Detailed investigation of absorption, emission and gain in Yb:YLF in the 78-300 K range
←
→
Page content transcription
If your browser does not render page correctly, please read the page content below
Research Article                             Vol. 11, No. 2 / 1 February 2021 / Optical Materials Express   250

Detailed investigation of absorption, emission
and gain in Yb:YLF in the 78–300 K range
U MIT D EMIRBAS , 1,2,* J ELTO T HESINGA , 1 M ARTIN K ELLERT, 1
F RANZ X. K ÄRTNER , 1,3 AND M IKHAIL P ERGAMENT 1
1 Center for Free-Electron Laser Science, Deutsches Elektronen-Synchrotron DESY, Luruper Chaussee 149,
22761 Hamburg, Germany
2 Laser Technology Laboratory, Antalya Bilim University, 07190 Dosemealti, Antalya, Turkey
3 Physis Department and The Hamburg Centre for Ultrafast Imaging, University of Hamburg, Luruper
Chaussee 149, 22761 Hamburg, Germany
* uemit.demirbas@cfel.de

Abstract: We present spectroscopic measurements focusing on a detailed investigation of
temperature dependence of absorption, emission and gain in the uniaxial Yb:YLF laser gain
medium. Measurements are carried out in the 78–300 K range, but we especially targeted our
attention to the 78–150 K interval, which is the desired working range of liquid nitrogen cooled
cryogenic Yb:YLF lasers/amplifiers. A tunable (770–1110 nm) Cr:LiSAF laser with around
100 mW continuous-wave output power and sub-0.2 nm bandwidth is used as an excitation
source. The average power of the Cr:LiSAF laser is low enough to prevent heating of the sample,
and its spectral flux (W/nm) is high enough to enable large signal-to-noise ratio measurements.
Measured absorption data is used to cross-check the validity of the emission measurements, while
the measured temperature dependent small-signal gain profile provided a second independent
confirmation. The acquired absorption cross section curves match the previous literature quite
well, whereas the measured strength of c-axis emission is stronger than some of the earlier reports.
Direct measurements of small signal gain confirmed the emission cross section data, where single
pass gain values above 50 have been measured for the 995 nm transition of E//c axis at 78 K. We
further provide simple analytic formulas for the measured temperature dependence of absorption
and emission cross section. We hope the presented results to be useful for the development of
next generation of cryogenic Yb:YLF laser and amplifier systems.

© 2021 Optical Society of America under the terms of the OSA Open Access Publishing Agreement

1.   Introduction
High-average and peak power laser and amplifier systems based on ytterbium-doped gain media
are interesting tools for many applications including nonlinear pulse compression [1], optical
parametric chirped-pulse amplification [2], parametric-waveform synthesis [3], and table-top
electron acceleration [4]. With its thermo-opto-mechanical strength, Yb:YAG gain media become
the working horse of such applications [5–10]. However, the relatively narrow gain profile of
Yb:YAG results in pulsewidths longer than 500-fs at room temperature, which even prolongs to
few picoseconds at cryogenic temperatures [11].
   Yb:YLF (Yb:LiYF4 ) is an interesting alternative material with broad bandwidths that could
ideally support 100-fs level pulses both at room and cryogenic temperatures [12–29]. Nevertheless,
compared to Yb:YAG, Yb:YLF is not yet well studied and many of its thermo-opto-mechanical
parameters are not well known, or their temperature dependence is not well investigated. For a
successful design of a laser/amplifier system, one of the first parameters a laser scientist needs
to know in detail is the absorption, emission and gain profile of the laser medium at different
temperatures. For cryogenic Yb:YLF laser/amplifier system, our recent experimental work has
shown that, during laser operation the average temperature of the liquid nitrogen cooled Yb:YLF
crystal varies in the ∼80–150 K range depending on the thermal load on the crystal [30]. However,

#415253                                                                     https://doi.org/10.1364/OME.415253
Journal © 2021           Received 19 Nov 2020; revised 20 Dec 2020; accepted 20 Dec 2020; published 6 Jan 2021
Research Article                        Vol. 11, No. 2 / 1 February 2021 / Optical Materials Express   251

in our design/simulation attempts [31], we have realized that, the literature lacks temperature
dependence of data even in these basic parameters (absorption, emission and gain): (i) data is
plotted in small graphs with limited spatial resolution, (ii) the data is taken with low spectral
resolution, (iii) the data is only given for a few selected temperatures, (iv) the data is only given
in arbitrary units, and (v) sometimes the data available from variable sources conflict with each
other. Unfortunately, due to the exponential nature of the amplification process (e.g. in a regen
one can easily have >100 round trips), even small uncertainties in laser parameters could result in
significantly different performance estimate. Hence, it is important to investigate the temperature
variation of absorption, emission and gain in Yb:YLF carefully (especially in the 78–150 K
range [30]), for the successful development of next generation of cryogenic Yb:YLF laser and
amplifier systems which could potentially reach kW level average powers along with pulsewidths
in the sub-250-fs range. Such spectroscopic information could also be useful for the optical
refrigeration community (that partially base their efforts on anti-Stokes emission of Yb:YLF
crystals) [32–38], in their attempts to develop nanometer scale quantum optical devices [36].
   Motivated by this need, we have focused our attention on careful measurement of temperature
dependence of absorption, emission and gain in Yb:YLF. As the main tool, we have used a
home-build continuous-wave Cr:LiSAF laser, that could be tuned from 770 nm to 1110 nm
[39–41]: a span that covers both the absorption and emission range of Yb:YLF gain media.
The experiments involved careful measurement of absorption and gain in Yb:YLF at different
temperatures while using a tunable Cr:LiSAF laser as an excitation/seed source. We have further
measured emission spectrum of Yb:YLF, and calculated the emission cross section (ECS) spectra
using the Füchtbauer-Ladenburg relation [42–44].
   To our knowledge, we present here the first set of measurements on polarization, temperature
and wavelength dependence of gain in Yb:YLF. Furthermore, along with a few other studies, this
is the first detailed report on temperature dependence of absorption and emission in Yb:YLF. We
also provide simple analytic formulas for the modelling of measured temperature dependence
of absorption and emission, as it is usually very hard to get quantitative information from the
published data.
   The measured absorption cross section (ACS) curves in this study match the previous literature
quite well and considerably extend the available temperature dependent data. Our emission
cross section (ECS) measurements underline a stronger c-axis emission than what is reported in
some of the earlier work, and complements the literature with detailed analysis. The observed
discrepancy in ECS results motivated us to implement a two-step verification approach for the
validation of our results. As the first approach, we have compared the emission measurement
results with the independently taken ACS data via the McCumber relation [45–48]. As the second
step, ECS data is used to calculate gain cross section (GCS) spectra, which is then cross-checked
via direct small signal gain measurements. Both schemes produced results that confirm each
other quite well, as it will be outlined in detail through the manuscript.
   The paper is organized as follows: In Section 2, we summarize the experimental setup and
the methodology that is employed. In Section 3, we start with presentation of absorption
measurements. Section 4 presents the emission cross section measurement in great detail. In
Section 5, we use the McCumber theory to validate our ECS measurements by comparison of
absorption and emission data. In Section 6, we estimate gain profiles at different temperatures
using the measured emission data, whereas in Section 7 we cross-check our results one more
time by direct measurement of small signal gain. Finally, in Section 8, we close with a brief
discussion.

2.   Experimental methodology
Figure 1 provides a sketch of the experimental setups used in this study for the emission, absorption
and gain measurements. A 675 nm tapered-diode laser (TDL) [49,50] pumped continuous-wave
Research Article                          Vol. 11, No. 2 / 1 February 2021 / Optical Materials Express   252

(cw) Cr:LiSAF laser (Fig. 1(a)) was used in the spectroscopy experiments [39–41]. A 3-mm-thick
crystal quartz birefringent filter (BRF) with an optical axis 45° to the surface of the plate was
used to tune the laser wavelength [51]. The BRF was inserted at Brewsters angle into the laser
resonator near the cavity high reflector mirror. The free spectral range of the plate is greater than
350 nm, preventing wavelength jumps and instabilities. Via simple rotation of the BRF plate,
the Cr:LiSAF laser provided broadly tunable cw output with up to 100 mW of output power
in the 770–1110 nm range (usage of two different output couplers was required to cover the
whole range) [52]. The spectral width of the Cr:LiSAF laser output was narrower than 0.2 nm
(FWHM: full-width at half-maximum) in the whole tuning range (was below 0.05 nm in most
of the range). Compared to setups that use lamp sources, the usage of Cr:LiSAF laser enables
a relatively high spectral flux (W/nm). Combined with a diffraction limited beam profile this
enables measurements with large signal-to-noise ratio. During the measurements, the Cr:LiSAF
laser output is collimated using a 100 mm lens, and the beam diameter on the sample was around
1.35 mm for absorption and gain measurements. A smaller beam size of around 100 µm is used
for the emission measurements to minimize self-absorption effects (the excited volume is smaller,
and the fluorescence collected transverses a smaller path to reach the detector, which helps to
minimize radiation trapping).

       Fig. 1. A simplified schematic of the setups used in spectroscopy experiments: (a) A simple
       schematic of tapered-diode laser (TDL) pumped cw Cr:LiSAF laser with broad tunability
       (770–1110 nm) that is used as the seed/excitation source, (b) Absorption measurement
       system (HR mirror is on a flip mount), (c) Fluorescence emission measurement system
       and (d) Small-signal gain measurement setup. The Yb:YLF crystal that is mostly used in
       measurements was an a-cut sample, with the axes oriented as shown. The dashed line in
       (d) indicates a relatively long distance, which is used to minimize ASE on the detector.
       M1-M3: Cr:LiSAF laser cavity dichroic and high reflector mirrors, OC: Output coupler,
       BRF: birefringent tuning filter, HR: High reflector, PM1-PM2: Sensitive power meters, P:
       Film polarizer, Spec: Spectrometer used for measuring the emission spectrum, BD: beam
       dump, HWP: Half-wave plate, DM: Dichroic mirror, A: Aperture, Det: Detector used in
       gain measurements.

   Several a-cut and c-cut Yb:YLF crystals with 1% Yb-doping and 2 cm length were available for
the experiments. The crystals were indium soldered from the top side to a multi-stage pyramidal
cold head, which was cooled to cryogenic temperatures by boiling liquid nitrogen using a vacuum
sealed dewar system. Silicon based thermal sensors connected to the cold head near the crystal
enabled real time measurement of cold head temperature with ±0.1 K accuracy. For temperature
dependent measurements, we have used the slow cooling cycle of the dewar (that typical took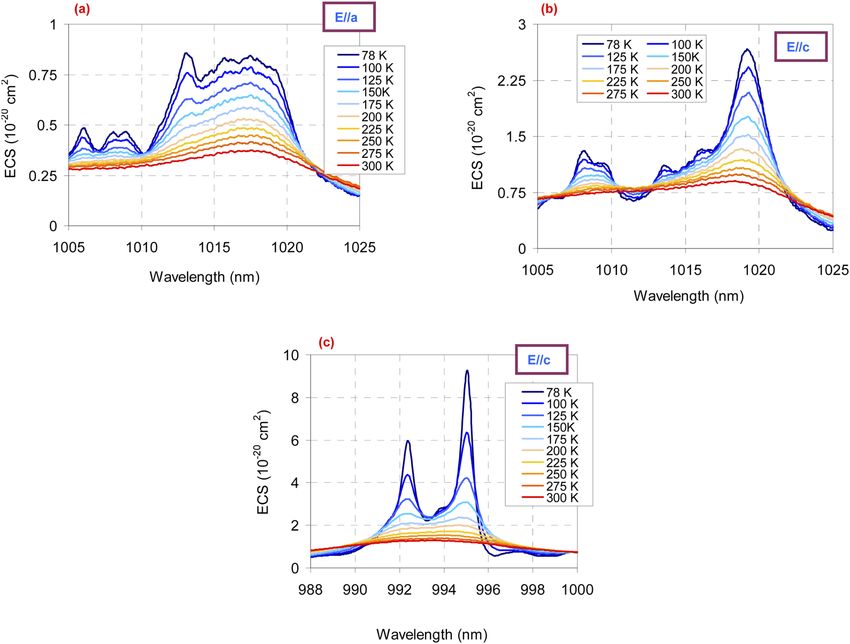
Research Article                                 Vol. 11, No. 2 / 1 February 2021 / Optical Materials Express   253

6–7 hours) [53]. Care is taken during the measurements not to heat up the crystal by minimizing
the power of the excitation beam as well as the excitation duration.
   For the absorption measurements a very simple setup is used as it is shown in Fig. 1(b). The
Cr:LiSAF output beam (diameter: 1.3 mm) is send through the center of the Yb:YLF sample.
The incident (Ii ) and transmitted power (It ) levels were measured carefully using a sensitive
silicon photodiode power meter (Thorlabs S121C, resolution: 10 nW). The absorption of Yb:YLF
crystal at each wavelength is calculated after subtracting the background loss of the system
which includes small residual losses from the AR coatings of Yb:YLF crystal surface, and dewar
windows. The sensitivity of the absorption measurements is limited by the intensity fluctuations
of the Cr:LiSAF laser as well as by the accuracy of determining the background losses, which
could be time dependent due to possible water condensation on the dewar inner windows or
crystal surfaces (an almost leak free home/made dewar with a pressure better than 10−8 mbar at
78 K is used to minimize such effects). At the same time, the relatively narrow linewidth of the
Cr:LiSAF laser (which stayed below 0.05 nm in most of the tuning range) is adequate to resolve
many of the peaks at most of the temperatures.
   Once the transmission (T) or absorption (A=1-T) of the sample is estimated at a specific
wavelength and temperature, we have calculated the corresponding absorption cross section value
(σa (λ, T)) using:
                                                       ln(T)
                                        σa (λ, T) = −                                           (1)
                                                      d NYb
where ln is the natural logarithm function, d is the thickness of the sample (20 mm in our case),
and NYb is the density of active Yb ions (1.4 x10²⁰ ions/cm3 for the 1% Yb-doped YLF [18]). As
mentioned earlier, if the absorption is known, and if the details of the energy levels creating the
transition is known, McCumber relation could be used to estimate emission cross section form
absorption cross section (or vice versa) using [45–48]:
                                                           (︄          )︄
                                         Zl                   Ezl − hc
                                                                    λ
                             σe (λ, T) =     σa (λ, T)Exp                                       (2)
                                         Zu                      kT

where h is the Planck constant, k is the Boltzmann constant, c is the speed of light in vacuum,
Ezl is the energy of the zero phonon line transition, Zu (Zl ) is the partition function of the upper
(lower) laser manifold, and their ratio could be calculated using [54]:
                         (︂            )︂            (︂             )︂       (︂             )︂        (︂             )︂
                              Eli− El1                    El2 −El1                El3 −El1                  El4 −El1
                                             1 +                       +                       +
               ∑︁
     Zl           i Exp     −   kT               Exp    −    kT          Exp    −    kT           Exp    −     kT
        (T) = ∑︁        (︂              )︂ =                     (︂           )︂           (︂            )︂             . (3)
    Zu                       E     E
                               hi− h1                                  E −E
                                                     1 + Exp − h2kT h1 + Exp − h3kT h1          E  −E
                 i Exp − kT

Here Ehi (Eli ) are the corresponding individual intra-manifold energies of the higher (lower)
lying laser levels. There are some minor differences in the reported values of energy levels
for Yb:YLF in literature [55–57], which might cause observable differences in the calculated
ECS/ACS values due to the existence of exponentials in the McCumber relation (both in Eq. (2)
and (3)). Here we have used the more recently reported values in [55]: El1 = 0 cm−1 , El2 = 218
cm−1 , El3 = 248 cm−1 , El4 = 486 cm−1 , Eh1 = 10293 cm−1 , Eh2 = 10416 cm−1 , Eh3 = 10554 cm−1 .
The corresponding wavelength for the zero-phonon line energy (Ezl = 10293 cm−1 ) is around
971.53 nm (an assignment made at 12 K [55]). In our measurements, we have positioned this
transition at 971.7 ± 0.25 nm at 78 K and 972 ± 0.25 nm at 200 K, respectively. We have used
Eq. (2) to transfer knowledge from ACS to ECS, and vice versa, to confirm and cross-check our
measurements.
   The fluorescence emission spectra were measured at a 90° angle to the Cr:LiSAF beam
propagation direction using a window at the side of the dewar (Fig. 1(c)). A thin film polarizer
(Thorlabs LPNIRE100-B) was used for selecting the fluorescence emission in the relevant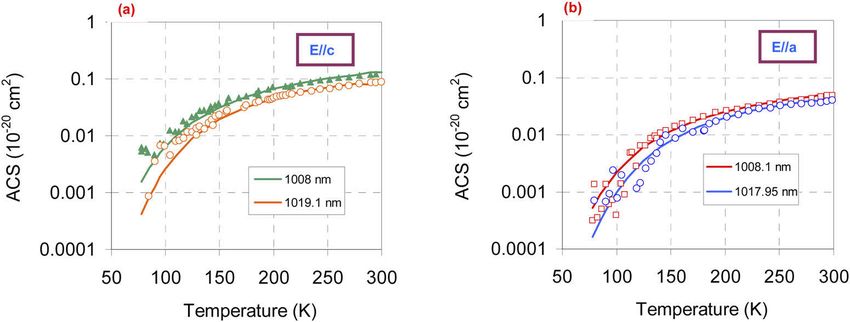
Research Article                          Vol. 11, No. 2 / 1 February 2021 / Optical Materials Express   254

axis. In the first set of experiments, we have checked the excitation wavelength dependence
of fluorescence spectra and we have observed that the fluorescence spectral shape does not
change for pump wavelengths in the 900–1020 nm range (some materials like Alexandrite might
show different emission spectra when excited at different wavelengths [58]). As a result, we
have chosen to use around 20 mW of 930 nm Cr:LiSAF light in the fluorescence emission
measurements, a wavelength on the shorter wavelength side of emission, which enabled easy
separation of background pump signal. A 3648 pixel CCD array (Toshiba TCD1304AP) based
Ocean Optics spectrometer was used for recording the fluorescence spectra. The spectrometer
had a spectral resolution of 0.1 nm in the 900–1060 nm range (spectrometer recorded 3600 data
points with an average wavelength separation of ∼0.05 nm). The calibration of the spectrometer
(estimated to be better than ±0.25 nm) was first confirmed using Ar and Kr lamp lines. The
overall spectral response of the measurement system was corrected using the known spectral
response curves and a fluorescence intensity accuracy better than ±20% is estimated for the
900–1025 nm range (the sharp drop of Si CCD array sensitivity creates higher uncertainty for
wavelengths above 1025 nm). Note that care is taken to minimize self-absorption effects, which
is known to produce errors in emission spectrum measurements in Yb-based systems. For that,
a relatively lowly Yb-doped (1%) sample is used, and the Yb:YLF crystal is excited from its
edge using a relatively small (100 µm) excitation beam. Furthermore, we have also corrected
the spectra for self-absorption losses, similar to what is employed in [59], by calculating the
self-absorption losses of the emission beam that reaches to the spectrometer (absorption of ∼2
mm of 1% Yb-doped material is considered). Note that, despite the care, as it will be discussed in
detail later, we have still observed some self-absorption induced small errors in emission spectra
especially for measurements near room-temperature: lower ECS strength is measured at shorter
wavelengths due self-absorption. On the other hand, since the overlap of absorption and emission
bands decrease with decreasing temperatures, errors due to self-absorption effect were minimal in
the 78–150 K range, which is the main region of interest for the cryogenic laser/amplifier systems.
This issue will be discussed in more detail while presenting the experimentally measured values.
   The normalized emission cross section (σe (λ)) curves are obtained by multiplying the measured
fluorescence emission spectrum by a factor of λ5 (where λ is the emission wavelength) [42,53],
and then renormalizing the curves. The emission cross section in absolute units is calculated
using the modified Füchtbauer–Ladenburg formula [42–44]:

                                            λ5              Ia (λ)
                          σe,a (λ, T) =       2
                                                                                                               (4)
                                          8πcn τR ∫ 1 I (λ) + 2 I (λ) λdλ
                                                   (︂                )︂
                                                      3 c       3 a

                                            λ5              Ic (λ)
                          σe,c (λ, T) =       2
                                                                                                               (5)
                                          8πcn τR ∫ 1 I (λ) + 2 I (λ) λdλ
                                                   (︂                )︂
                                                      3 c       3 a

where Ia,c (λ) are the measured emission intensities in the a, c axis of the uniaxial crystal, n is the
average refractive index of gain medium (∼1.46 [60] around 1 µm in YLF), τR is the radiative
lifetime of the upper laser level (2 F5/2 ) involved in transition. For Yb:YLF, due to the presence of
radiation trapping (on top of possible non-radiative effects), it is difficult to accurately measure
radiative lifetime. One alternative solution is to obtain emission cross section values from the
measured absorption data using McCumber relation (Eq. (3)), and calculate the radiative lifetime
using Füchtbauer–Ladenburg formula given above. This approach yielded a value of ∼2040 ± 180
µs in a recent study [47] (a value of 2270 µs is found in an earlier study [48]). In our work, for
the 1% Yb-doped YLF sample, we have measured fluorescence lifetimes of 1970 ± 50 µs at 78 K
and 2120 ± 50 µs at 300 K, in a setup which we tried to reduce the radiation trapping effects [61].
We believe that, the slightly longer fluorescence lifetime we measured at 300 K still might be
due to the radiation trapping effect which is hard to completely eliminate at room-temperature.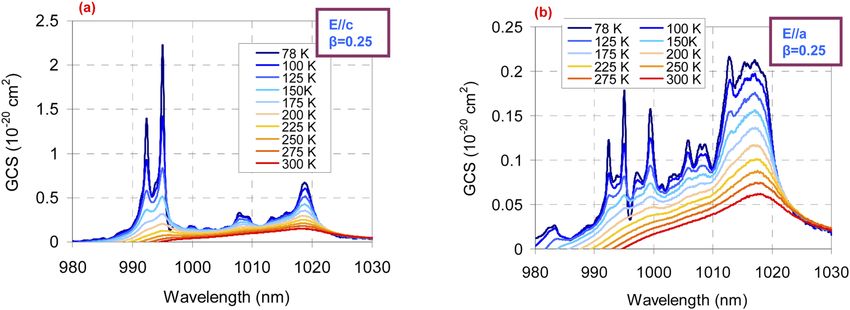
Research Article                       Vol. 11, No. 2 / 1 February 2021 / Optical Materials Express   255

Overall, we have chosen to use a radiative lifetime value of 2000 µs in this study. We would like
to also mention here that, after repeating the temperature dependent measurement required for
ECS determination 3–4 times, we have seen that, despite ultimate care in the fluoresce collecting
and measurement process, due to alignment sensitivities, it is very challenging to make accurate
absolute measurements of Ia (λ) and Ic (λ). As discussed in detail in [47], we have perfected our
alignment process to the best of our abilities (confirmed the setup with the homogeneous Yb:YAG
crystal), and also used the measured temperature dependent absorption data and McCumber
relation to reduce the uncertainties in our ECS calculations (by cross-checking the ECS and ACS
data with each other).
   The setup that is used for the gain measurements is shown in Fig. 1(d). In the setup, the weak
Cr:LiSAF beam plays the role of a low power seed beam, which we use to measure small signal
gain. Two 2 inch size 45° dichroic mirrors were used to couple in and out the 960 nm high power
pump source that is used for the main excitation of Yb:YLF crystal. The 960 nm pump diode
had an M2 of around 220 and was focused to a spot diameter of 3.2 mm inside the gain media.
The smaller Cr:LiSAF beam (1.3 mm) pass through the central region of the excitation area and
observes an almost flat-top excitation profile. In small signal gain measurements of the E//a axis,
the gain medium is excited with 2 ms long pump pulses with 2 kW of peak power at 0.1 Hz
repetition rate. Due to the low duty cycle employed, the average absorbed pump power was below
0.5 W in these measurements, and hence the heat load on the crystal is quite limited (we estimate
an average temperature rise below 0.1 K at this average pump power [30], whereas instant peak
temperatures might be 2–3 K higher). For the gain measurements in E//c axis, the pump pulse
duration is reduced from 2 ms to 250 µs to minimize amplified spontaneous emission (ASE)
effects observed in this higher gain emission band. Note that, to minimize the role of ASE in gain
measurements, we have put two small circular apertures and propagated the amplified Cr:LiSAF
beam 2–3 meters (ASE component is reduced by spatial filtering). Furthermore, a background
signal is also taken (while seeding the system above 1050 nm, a region outside of gain bandwidth)
and this small background is reduced from the measurements. The Cr:LiSAF beam power is
recorded again with the sensitive silicon photodiode power meter (Thorlabs S121C sensor in the
PM100A power meter), and the analog output of the power meter with sub-1-µs response time
was monitored by a fast 500 MHz oscilloscope and simultaneously recorded by the computer for
gain calculations. The measured small signal gain values are the maximum gain values of the
system that is acquired just after the tail of the 960 nm pump.
   To enable a further independent cross-check of ACS/ECS results, we have compared the
measured small signal gain spectra at 78 K and 295 K, with the gain spectrum estimated from
earlier emission and absorption measurements. The effective gain cross section (GCS) spectra
(σg (λ,T)) of Yb:YLF is estimated using:

                             σg (λ, T) = βσe (λ, T) − (1 − β)σa (λ, T)                                      (6)

where β is the fractional population inversion level and all the other parameters are as defined
above. The small signal gain coefficient (g0 ) could be calculated from σg (λ,T) using:

                                     g0 (λ, T) = σg (λ, T)NYb                                               (7)

where Nyb is the number density of the active Yb3+ ions in the YLF sample. Note that single
pass fractional gain Exp(g0 d) could be then easily estimated (d: length of the gain medium). As
a side note, for a long gain sample such as ours, the inversion will strongly vary with position:
will be higher at the front of the crystal where most of the absorption happens and will then decay
towards the end of the crystal (the exact profile will depend on incident pump power, pump spot
size, pump spectral width, absorption saturation effects, etc. . . ). Hence, position dependence
should also be included in the above discussion for an accurate calculation of Yb:YLF gain.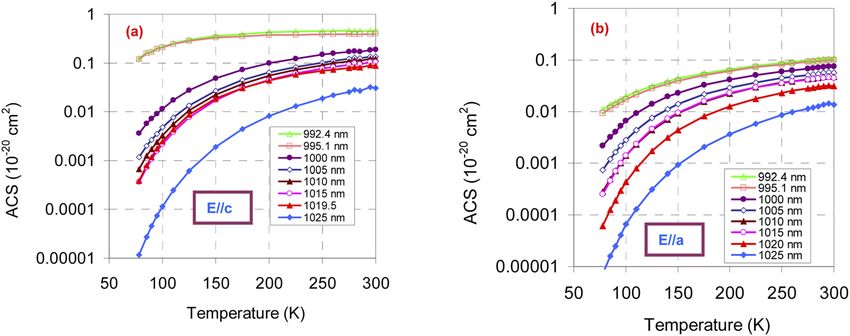
Research Article                        Vol. 11, No. 2 / 1 February 2021 / Optical Materials Express   256

3.   Absorption measurements
We start presentation of our experimental results with Fig. 2(a-b), which shows the measured
absorption of the 1% Yb-doped 2 cm long YLF sample at 78 K and 300 K, for both E//a and
E//c axis, respectively. The corresponding absorption cross section values are then shown in
Fig. 2(c-d), where we have used the known doping and thickness of the sample for the calculation.
Note that, to enable better visibility a second axis is used to show the ACS values at room
temperature. Moreover, a 5-times vertically expanded version of the 78 K ACS curve is also
shown to enable a zoom in view to the details of the measurement.
   The measured room-temperature absorption profile matches very well (difference smaller
than ±5%) to the measurement presented in [18] for a 5% Yb-doped YLF sample, and is also
in relatively good agreement with other measurements in literature [21,47,48,55,59,63–65].
Note that the scale of ACS graphs for RT emission is different for the different polarizations,
and the absorption strength in E//c axis is stronger compared to E//a axis. To our knowledge,
Fig. 2 contains the first detailed cryogenic absorption measurement of Yb:YLF for wavelengths
longer than 975 nm: knowledge of absorption in this region is important in determination of
quasi-3-level operation parameters of Yb:YLF laser systems [10].
   As outlined in [55], due to strong electron-phonon coupling, it is difficult to identify origins
of the absorption lines of Yb especially at room-temperature, and different absorption peaks
appear for different polarizations. Here, in Fig. 2(e), we also provide the energy level diagram of
Yb:YLF, where the data on intra-manifold energies of the Stark levels are taken from [55]. Note
that, we have also included calculated wavelengths for transitions and Boltzmann occupancy
factors for the different Stark levels at selected temperatures of 78 K, 150 K and 300 K [62]. Note
that origins of some of the absorption peaks can be easily understand by looking at the possible
transitions in Fig. 2(e). On the other hand, some transitions, like the absorption peak around 935
nm is believed to be a vibrionic side-peak induced by strong electron-phonon coupling [55]. We
refer the reader to Ref. [55] for a more detailed discussion on origins of transitions observed in
the measured absorption.
   For cryogenic lasing/amplifier applications the ACS at 78 K is more interesting, and we see that,
as the phonon energies decrease with decreasing temperature, due to reduced electron-phonon
coupling effects, the transitions get stronger and narrower. The measured ACS spectrum at 78 K
matches relatively well to most of the previously reported measurements in literature [47,59,62],
except small minor differences on peak values, which might be due to the limited resolution and
dynamic range of different measurement systems. As an example, we have measured a peak
absorption value of 5.6 × 10⁻²⁰ cm2 for the 960.35 nm transition of E//c absorption, where peak
values of ∼5.9 × 10⁻²⁰ cm2 [25], ∼5 × 10⁻²⁰ cm2 [62], and 6.5 × 10⁻²⁰ cm2 [59] are reported in
earlier work. Similarly, for the same peak, we have measured a value of 2.5 × 10⁻²⁰ cm2 for the
E//a axis, that is in relatively good agreement with 2.7 × 10⁻²⁰ cm2 of [62], ∼2 × 10⁻²⁰ cm2 of
[25], and ∼2.4 × 10⁻²⁰ cm2 of [59]. As a side note: (i) our measurements differ from what is
reported in [17,47], (ii) further cryogenic absorption data for Yb:YLF is also available in [56]
(15–300 K in arbitrary units), and in [21,55,64] (at 15 K, for un-polarized light).
   The difference of 78 K absorption between the E//a and E//c axis is also noteworthy. First
of all, the E//a absorption is broader and enables efficient pumping around 934 nm, 948 nm
and 960 nm. Note that, the 934 nm and 948 nm absorption transitions are rather weak in the
E//c axis absorption. As mentioned above, the 960 nm transition with a FWHM of ∼2 nm is
strong for both axes (stronger in E//c) and enables efficient pumping of cryogenic Yb:YLF laser
systems [26,27,29]. The strong zero-phonon absorption line around 971.7 nm could ideally
enable pumping with a lower quantum defect, which has a measured value of ∼4 × 10⁻²⁰ cm2
and ∼1.8 × 10⁻²⁰ cm2 , for the E//a and E//c axis, respectively. On the one hand, this line is too
sharp for high-power diode pumping at 78 K. On the other hand, under thermal load, the Yb:YLF
crystal could easily reach 125–175 K temperatures, and the linewidth of the 971.7 nm line at
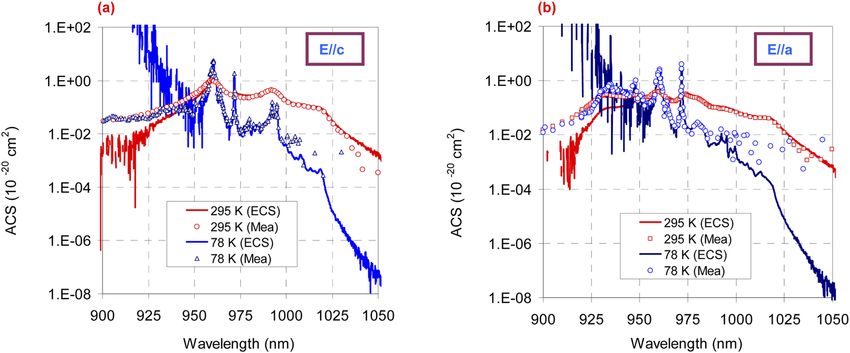
Research Article                           Vol. 11, No. 2 / 1 February 2021 / Optical Materials Express   257

 Fig. 2. Measured room-temperature (295 K) and 78 K absorption spectra of 2 cm long 1%
 Yb-doped YLF crystal in (a) E//c and (b) E//a axes. Corresponding calculated absorption
 cross section (ACS) spectra is shown in (c) and (d). The secondary vertical axes in (c-d)
 show the ACS cross section at RT, as well as 5-fold multiplied 78 K curve for better visibility.
 An energy level diagram of Yb:YLF is shown in (e), along with the calculated Boltzmann
 occupancy percentages of Stark levels at 78 K, 150 K and 300 K, respectively [55,62].
Research Article Vol. 11, No. 2 / 1 February 2021 / Optical Materials Express 258
these temperatures (∼0.5–1 nm) might be sufficient enough for the utilization of this pumping
scheme.
As discussed earlier, our absorption measurements are taken using the Cr:LiSAF laser, where
measurement of absorption spectra at each temperature requires tuning of the Cr:LiSAF laser
wavelength to the desired point and measuring incident and transmitted powers, and the overall
process takes time. As a result, we have only measured absorption spectra of Yb:YLF at 78 K
and 295 K. However, we have measured variation of absorption with temperature at selected
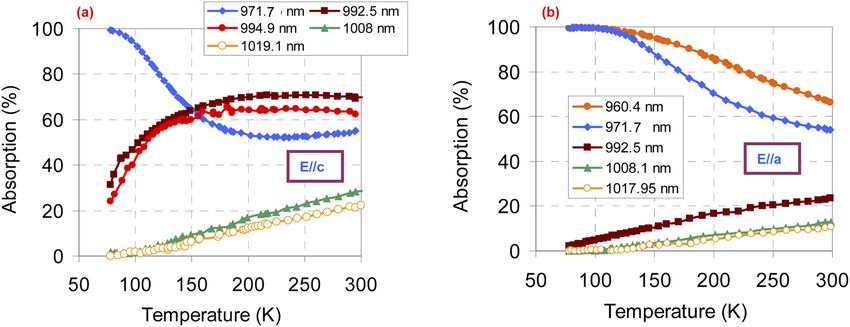
wavelengths using the cooling cycle of the dewar, and the results are summarized in Fig. 3.
Note that, the measured variation of absorption at the pump wavelength region (960.4 nm and
971.7 nm) contains important information on the variation of pump absorption with temperature,
whereas the measured variation of absorption at the lasing wavelength region (above 990 nm)
provides important information for the amount of self-absorption losses.
Fig. 3. Measured variation of absorption of Yb:YLF crystal with temperature in the
78–300 K range, at selected wavelengths for (a) E//c and (b) E//a axes. A 1% Yb-doped 2 cm
long YLF crystal was used in the measurements.
It is educational to try to roughly understand the trends observed in Fig. 3. For that, we can
use the energy level diagram that is shown earlier in Fig. 2(e). As an example, for wavelengths at
the far edge of absorption (above 995 nm), the absorption originates mostly from the highest
lying Stark level of the 2 F7/2 manifold. At 78 K, this Stark level is mostly empty (posses 0.1%
of the ions), and as one heats up the crystal this level slowly starts to fill up: 0.78% and 5.57%
occupancy at 150 K and 300 K, respectively. As a result, for wavelengths such as 1008 nm,
1018–1019 nm, the measured absorption is very low at 78 K, but it starts to slowly increase with
temperature as the population of the highest lying Stark level of the 2 F7/2 manifold increases. As
another example, around 960 nm the absorption is due to the transition from the lowest lying
Stark level of the 2 F7/2 manifold. The estimated Boltzmann occupancy factor for this level
decreases from around 97.24% to 57.03% as the temperature is increased from 78 K to 300 K.
As a result, the measured absorption for this band decreases with temperature due to the phonon
broadening of the transition. As the last example we can look at the absorption near the zero
phonon line around 971.7 nm, where again the absorption is believed to originate from the lowest
lying Stark level of the 2 F7/2 manifold. Similar to the 960 nm transition, the absorption at this
wavelength steadily decreases with temperature for the E//a axis. On the other hand, for the E//c
axis, the absorption first decreases then saturates and then even start to increase with temperature.
This shows that, as discussed in [55], even in a simple looking system like Yb:YLF, where one
has only two energy manifolds, due to strong electron-phonon coupling, it is not always easy
to interpret the measured trends in absorption. We will continue on this discussion in Section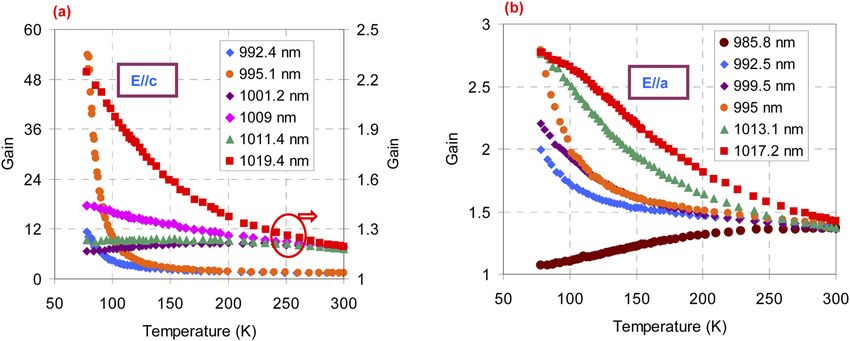
Research Article Vol. 11, No. 2 / 1 February 2021 / Optical Materials Express 259
5, where we will use the McCumber theory to calculate absorption spectra from the measured
emission profile at different temperatures.
4. Emission cross section measurements
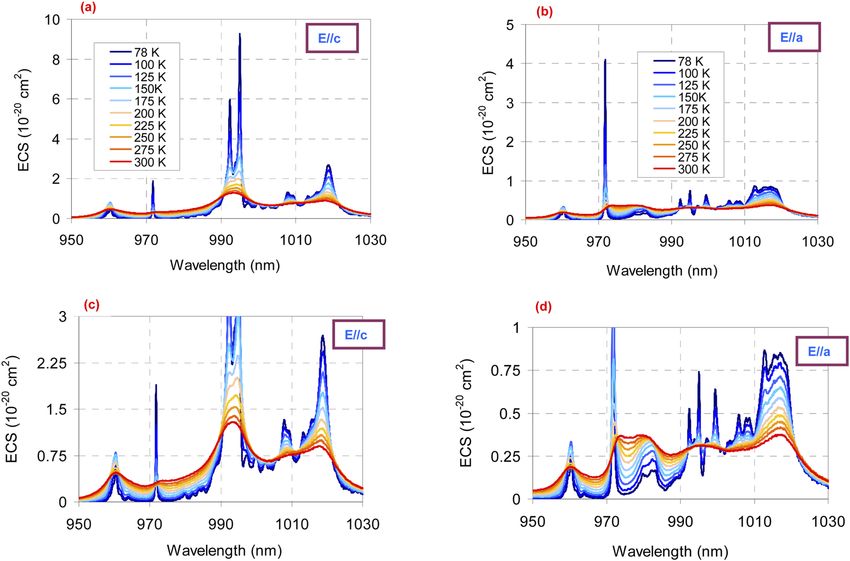
Figure 4 shows the measured variation of normalized emission cross section with temperature for
the (a) E//c and (b) E//a axes, respectively. The peak of the emission in E//c axis is around 995
nm. For the E//a axis, the peak of the emission is around ∼971.7 nm at 78 K, but we have chosen
to normalize the spectra with respect to main emission band around 1016 nm. It is clear that, as
the temperature increases the emission peaks get broader and smoother. As an interesting point,
it is already noticeable that, the E//a emission band centered around 1016 nm possesses a broad
bandwidth even at cryogenic temperatures, which we will elaborate in greater detail soon.
Fig. 4. Variation of normalized emission cross section (ECS) spectra of Yb:YLF with
temperature for (a) E//c and (b) E//a axes at crystal temperatures ranging from 78 K to 300 K.
Emission data in normalized or arbitrary units are useful to understand how the shape of the
emission bands change with temperature and polarization, and could be used in determining
effects such as gain narrowing. On the other hand, knowledge of ECS in absolute/qualitative
units gives more complete information, since the strength of the emission could also be acquired.
For that purpose, in Fig. 5, we present our temperature dependent ECS measurement results of
Yb:YLF for different polarizations. The same data is presented in two different vertical axis
scales, for better readability of the small details.
At this point, it is educational to first carefully compare the measurements in this study with
previous data in literature. To our knowledge, there are only a few earlier reports of temperature
dependent emission for Yb:YLF: (i) Kawanaka et al.: ECS measurements at 77 K and 293 K
[17], (ii) Bensalah et al.: ECS data at 12 K and 300 K [21,55,64], (iii) Sugiyama et al.: ECS
measurement between 15 K and 300 K in arbitrary units [56], (iv) Fan et al.: ECS data at 80 K
[25,59], (v) Selestskiy et al.: fluorescence measurement for E//c between 100 K and 300 K, in
arbitrary units [66], (vi) Ter-Gabrielan et al.: ECS data at 77 K [62], and recently (vii) Korner
et al.: ECS data between 80 K and 280 K [47]. First of all, when one looks at from a general
perspective, we see that, the variation of spectral shape of the emission with temperature is
rather similar in all studies, except a few work in which the resolution of the instrument created
weaker lines with broader bandwidths and smoother emission profile. However, there are some
observable differences in terms of absolute strength of the transitions especially for the E//c axis
as we try to outline below.
For a more comprehensive comparison/investigation of the ECS data near the important laser
bands, we have prepared Fig. 6, which shows the 1016 nm band of E//a axis, along with the
∼995.2 nm and ∼1019.5 nm transitions of the E//c axis in greater detail. Starting from the
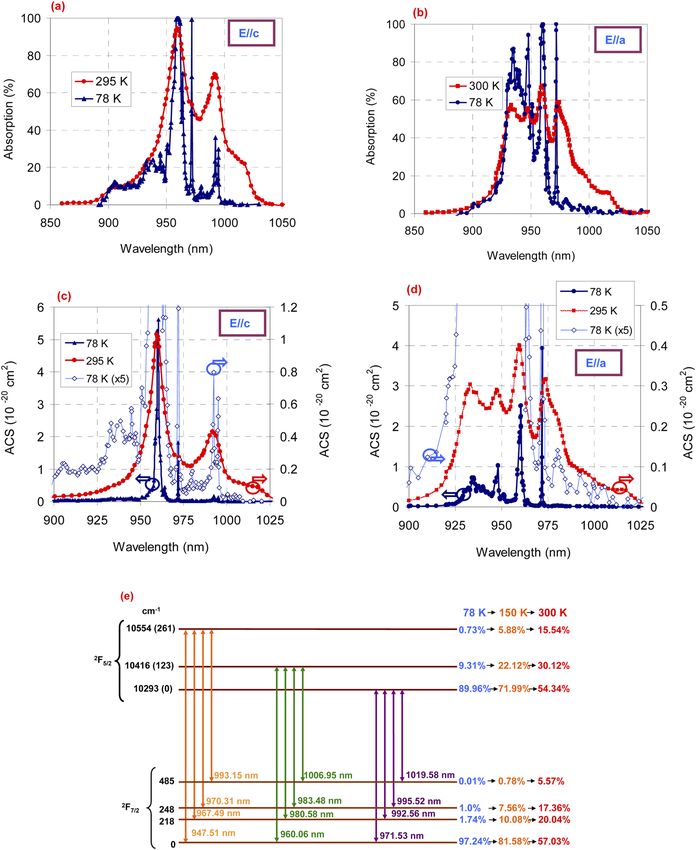
broadband E//a transition (Fig. 6(a)), we see that the transition has a FWHM bandwidth ofResearch Article Vol. 11, No. 2 / 1 February 2021 / Optical Materials Express 260
Fig. 5. Variation of emission cross section (ECS) spectra of Yb:YLF in absolute units with
temperature for (a-c) E//c and (b-d) E//a axes of Yb:YLF at crystal temperatures ranging
from 78 K to 300 K. In graphs (a-b) the whole spectra are shown, where as in graphs (c-d)
we focus on weaker parts of the spectrum with lower ECS values.
around 9.7 nm at 78 K, which extends to a FWHM of 11 nm at 125 K, and gets even broader
as the temperature increases. Due to the broad bandwidth of this transition, earlier Yb:YLF
amplifier work has been mostly based on this emission [23,27,28,67]. At 78 K, the peak value of
emission cross section in this transition is measured to be around 0.85 × 10⁻²⁰ cm2 , that is in
good agreement with the values reported in literature (∼1x 10⁻²⁰ cm2 [25,59], ∼0.75x 10⁻²⁰ cm2
[62], ∼0.88x 10⁻²⁰ cm2 [47]).
For the E//c axis, usually the sharp peak around 995 nm is employed in cryogenic lasing
experiments due to much higher gain in this band [25,62]. We have measured a peak ECS value
of 9.3 × 10⁻²⁰ cm2 for the 995 nm line, which is in good agreement with the recent measurement
(9.4 × 10⁻²⁰ cm2 ) by Korner et al [47], but rather higher than what is reported in other studies
(5.7 × 10⁻²⁰ cm2 in [62] and ∼4 × 10⁻²⁰ cm2 in [25,59]). Bensalah et al. measured a peak value
of ∼12 × 10−20 cm2 for the E//c axis 995 nm transition at 12 K, which confirms the strength and
sharpens of this peak at cryogenic temperatures [21,55,64], and support the relatively high 78 K
value presented in this work. When we look at the broader 1019.5 nm transition of E//c axis,
we find a FWHM value of 3.7 nm at 78 K, which extends to a FWHM of 6.5 nm at 125 K. The
1019.5 nm band of E//c axis is not as broad as the 1016 nm E//a band, but we have measured a
peak value of 2.7 × 10⁻²⁰ cm2 for the 1019.5 peak at 78 K, indicating presence of 2–3 fold higher
gain in this band. The peak value we have measured at 1019.5 nm is slightly higher than earlier
measurements in literature (2 × 10⁻²⁰ cm2 in [47], 1.8 × 10⁻²⁰ cm2 in [25,59]). A peak ECS
value of around 4 × 10⁻²⁰ cm2 is reported at 12 K in [21,55,64], which again might be seen as
a confirmation of the larger ECS value reported in our work. The recent detailed ECS results
reported by Cante at al. for Yb:LLF [68], a crystal with quite similar spectroscopic behavior
[21], also shows similar spectroscopic strength for E//c axis. The lower values reported in some
of the earlier Yb:YLF studies might be due to the limited resolution of measurements or localResearch Article Vol. 11, No. 2 / 1 February 2021 / Optical Materials Express 261
Fig. 6. Calculated variation of emission cross section (ECS) spectra of Yb:YLF with
temperature around the main lasing bands for the (a) E//a and (b-c) E//c axes.
heating of the sample which could broaden and weaken the transition (even a few K could create
a difference for some transitions).
As another note, when we look at the overall strength of the E//c and E//a axis (the integrated
emission strength), we have measured a quite strong E//c axis in our measurements, with an
integrated spectral intensity ∼2–2.5 times higher than E//a axis (around 2 at room-temperature
which increased monotonically to around 2.5 at 78 K). Looking at the literature, this observation
is in good agreement with the spectra shown in [21,47,55,64], but some other studies report a
slightly weaker E//c emission (∼1.5–2 ratio rather than a ∼2–2.5 ratio between E//c and E//a
emission). Unfortunately, it is rather difficult to get absolute measurements of ECS, and slight
differences in the measured ratio of different axis could also result in observed differences in
reported ECS values. Hence, in the coming sections, the accuracy of our ECS measurements will
be discussed by comparing the data with what is obtained from ACS using McCumber relation
and also via comparison with direct small signal gain measurements in different axis.
So far we have shown graphs of ECS (λ) at selected temperatures (Figs. 4–6), but it is also
quite helpful to look at the same data from a different perspective, by plotting ECS (T) at selected
wavelengths. For that purpose, Fig. 7 shows the measured variation of ECS with temperature at
selected wavelengths (data acquired by vertically slicing ECS data presented in Figs. 5,6). As
expected, as the temperature increases, we see a decrease of ECS value for the peaks of 78 K
emission and a slow increase of ECS value for the dips of the 78 K emission. Basically, via
increasing phonon energy and increasing rate of electron-phonon coupling, the emission strength
is distributed: peaks get wider, dips start to fill, and the ECS spectra gets smoother. If the initial
emission peak is very sharp/strong (e.g. 995 nm emission in E//c axis), the slope of decreaseResearch Article Vol. 11, No. 2 / 1 February 2021 / Optical Materials Express 262
is faster. If the initial strength is moderate (such as the 1019.5 nm line of E//c axis and 1016
nm line of E//a axis), the reduction of ECS value with temperature is slower, which might be
advantageous in the design of efficient cryogenic lasers/amplifiers.
Fig. 7. Variation of measured emission cross section value of Yb:YLF crystal with
temperature in the 78–300 K range, at selected wavelengths for (a) E//c and (b) E//a axes.
To our knowledge, the data in Fig. 7, which provides important basic information on laser
design, is presented to the first time for Yb:YLF in literature. Hence, we close this section with
Table 1, which provides equations for modeling the temperature dependence of emission cross
section of Yb:YLF as a function of temperature at selected wavelengths. Note that a relatively
complex functional form of:
σe (λ, T) = a0 + a1 T + a2 T2 + a3 T3 + a4 T4 + a5 T5 (8)
has been chosen and higher polynomial orders are included only if they are required to obtain a
nice fit to the experimentally measured data (a standard Boltzmann distribution formula did not
provide a good match to some of the measured trends, and hence, is not preferred). Note, again
the coefficients a0 – a5 in Eq. (8) are wavelength dependent fit parameters.
Table 1. Best fit values of the temperature coefficients in Eq. (8) for the calculation of emission
cross section at different temperatures for several representative wavelengths in E//a and E//c
axes.
Wavelength
(nm) & axis ao a1 (K−1 ) a2 (K−2 ) a3 (K−3 ) a4 (K−4 ) a5 (K−5 )
992.4 (E//c) 1.889 × 10+1 −2.661 × 10⁻¹ 1.616 × 10⁻³ −4.513 × 10⁻⁶ 4.768 × 10⁻⁹ -
995.1 (E//c) 3.423 × 10+1 −5.172 × 10⁻¹ 3.189 × 10⁻³ −8.932 × 10⁻⁶ 9.427 × 10⁻⁹ -
1001.4 (E//c) 2.640 × 10⁻¹ 3.428 × 10⁻³ −6.810 × 10⁻⁶ - - -
1009.1 (E//c) 1.445 × 10° −3.764 × 10⁻³ 4.969 × 10⁻⁶ - - -
1011.5 (E//c) 4.236 × 10⁻¹ 3.409 × 10⁻³ −7.494 × 10⁻⁶ - - -
1019.5 (E//c) 4.152 × 10° −2.064 × 10⁻² 3.277 × 10⁻⁵ - - -
985.8 (E//a) −8.916 × 10⁻² 1.877 × 10⁻³ −2.257 × 10⁻⁶ - - -
992.4 (E//a) 1.651 × 10° −2.488 × 10⁻² 1.701 × 10⁻⁴ −5.139 × 10⁻⁷ 5.778 × 10⁻¹⁰ -
995.1 (E//a) 3.749 × 10° −7.738 × 10⁻² 7.110 × 10⁻⁴ −3.280 × 10⁻⁶ 7.526 × 10⁻⁹ −6.839 x10⁻¹²
999.6(E//a) 1.542 × 10° −1.796 × 10⁻² 1.002 × 10⁻⁴ −2.512 × 10⁻⁷ 2.356 x10⁻¹⁰ -
1013.1 (E//a) 1.553 × 10° −1.156 × 10⁻² 4.035 × 10⁻⁵ −5.121 × 10⁻⁸ - -
1017.4 (E//a) 1.124 × 10° −3.861 × 10⁻³ 4.594 × 10⁻⁶ - - -Research Article Vol. 11, No. 2 / 1 February 2021 / Optical Materials Express 263
5. Emission & absorption cross-check
In this section, we will cross-check our independently obtained emission and absorption cross
section results using the McCumber relation. To start with, Fig. 8 shows the calculated ACS
curves (obtained from the ECS data presented in the earlier section using Eq. (2)). In general,
the observed trend in the curves matches the data in the literature quite well. For a more direct
comparison, we could compare the estimated ACS data with the direct ACS measurements that
we have taken at 78 K and 300 K.
Fig. 8. Calculated variation of absorption cross section with temperature for Yb:YLF crystal
in the 78–300 K range for (a) E//c and (b) E//a axes. The ACS data is calculated from the
measured emission data using McCumber theory.
For that purpose, Fig. 9 shows the measured ACS data at 78 K and 300 K in both axis along
with the curves estimated from ECS (directly measured ACS data is shown with open markers).
As a first observation, note that the ACS estimation via McCumber equation is quite noisy and
incorrect for wavelengths below 950 nm. Basically, this region is the lower wavelength edge of
the ECS data where the SNR ratio in ECS is low, and combined with the limited dynamic range
of the spectrometer as well as the exponential nature of McCumber theory, this creates noisy
data below 950 nm. Above 950 nm, we observe a relatively good fit to the measured ACS data
at 295 K, till one reaches the longer edge of absorption around 1025 nm. In a similar manner,
the 78 K curve matches very well to the experimental data in the 950–1000 nm range for the
E//a axis and 950–985 nm range for the E//c axis. Essentially, once the measured ACS gets
below 0.01 × 10⁻²⁰ cm2 , a measurement fluctuation of 0.1% in transmitted power creates up to
±5% error in the measured ACS values. As a result, as also discussed in previous literature, the
ACS curves obtained from ECS measurements using the McCumber theory provides a better
estimate for absorption on longer wavelength side of the absorption curves; whereas, on the
short wavelength side, direct absorption measurements provide a much higher accuracy in ACS
determination efforts. As an overall observation, we see that the directly measured ACS data and
the ACS data calculated from the measured ECS curve fits relatively well to each other in the
wavelength range where their harmony is expected, for both 78 K and 295 K measurements.
To cross-check the ACS and ECS curves via McCumber equation at other temperatures, we
have used the measured variation of absorption data at selected temperatures (presented earlier in
Fig. 3). Figure 10 shows the experimentally measured variation of ACS (open markers) with
the McCumber theory estimate based on ECS measurements (solid curves). It is clear that, a
relatively good fit exists between the experimentally measured and calculated values, which
provide a further sanity check for the earlier measured ECS data.
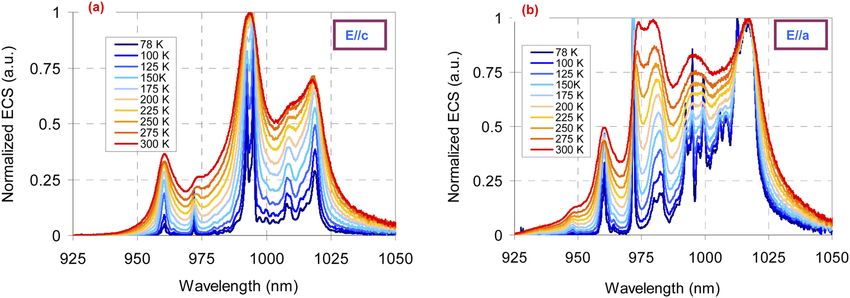
We would like to finalize this subsection with Fig. 11, which shows the calculated variation of
Yb:YLF absorption cross section with temperature on the long wavelength side of absorption,
between 975 nm and 1050 nm. The graph is in logarithmic scale, as the absorption in this longerResearch Article Vol. 11, No. 2 / 1 February 2021 / Optical Materials Express 264
Fig. 9. Comparison of measured and calculated absorption cross section spectra of Yb:YLF
for (a) E//c and (b) E//a axes at temperatures of 78 and 295 K. The calculated ACS data is
obtained from the measured emission data using McCumber theory.
Fig. 10. Comparison of measured (markers) and calculated (solid line) variation of
absorption cross section of Yb:YLF with temperature for (a) E//c and (b) E//a axes at selected
wavelengths. The calculated ACS data is obtained from the measured emission data using
McCumber theory.
end reduces sharply with temperature, and is ignorable for many applications. On the other hand,
the solid-state optical refrigerating studies with Yb:YLF [32–38], that is based on anti-Stokes
emission of Yb:YLF crystals, ideally needs to achieve absorption at the longer edge (optimum
pump wavelength is around ∼1020 nm) [69]. Moreover, absorption in this region, which overlaps
with the regular lasing region of Yb:YLF, appear as self-absorption losses in laser cavities, and
should be included in laser modelling. Figure 12 provides the same information from other
perspective, and shows the variation of ACS with temperature at several selected wavelengths.
If we investigate the data, in terms of their strength near the main lasing bands, we see that
the absorption around the 995 peak of Yb:YLF is strong even at 78 K (2 cm of 1% Yb-doped
YLF absorbs around 30%), and the laser is 3-level even at cryogenic temperatures (see also the
Boltzmann occupancy percentages presented in Fig. 2(e)). At the 1019.5 nm transition of E//c
axis and the 1016 nm transition of E//a axis, the ACS curves are more than two order of magnitude
weaker at 78 K, enabling almost 4-level lasing at cryogenic temperatures in these transitions.
Note that, our measurements for the 1020 nm E//c axis absorption of Yb:YLF matches quite well
with the earlier curve reported in [70].Research Article Vol. 11, No. 2 / 1 February 2021 / Optical Materials Express 265
Fig. 11. Calculated variation of Yb:YLF absorption cross section with temperature in
logarithmic scale for wavelengths above 975 nm. The ACS data is shown for (a) E//c and (b)
E//a axes of Yb:YLF, respectively. The ACS data is calculated from the measured emission
data using McCumber theory.
Fig. 12. Claculated variation of absorption cross section of Yb:YLF crystal with temperature
in the 78–300 K range, at selected wavelengths for (a) E//c and (b) E//a axes. The ACS data
is calculated from the measured emission data using McCumber theory.
To our knowledge, it is hard to find qualitative information in literature on variation of Yb:YLF
ACS with temperature. Hence, as we did earlier with ECS data, we will close this section with
Table 2, which provides equations for modeling the temperature dependence of absorption cross
section of Yb:YLF as a function of temperature at selected wavelengths. Note that a similar
functional form of:
σa (λ, T) = b0 + b1 T + b2 T2 + b3 T3 + b4 T4 + b5 T5 + b6 T6 (9)
has been chosen where the coefficients b0 – b6 in Eq. (9) are wavelength dependent fit parameters.Research Article Vol. 11, No. 2 / 1 February 2021 / Optical Materials Express 266
Table 2. Best fit values of temperature coefficients for the calculation of absorption cross section at
different temperatures for several representative wavelengths in E//a and E//c axes.
Wavelength
(nm) & axis bo b1 (K−1 ) b2 (K−2 ) b3 (K−3 ) b4 (K−4 ) b5 (K−5 ) b6 (K−6 )
992.4 (E//c) −3.905 x10⁻¹ 8.825 x10⁻³ −3.077 x10⁻⁵ 3.63 x10⁻⁸ - - -
995.1 (E//c) −5.558 x10⁻¹ 1.315 x10⁻² −6.886 x10⁻⁵ 1.603 x10⁻⁷ −1.383 x10⁻¹⁰ - -
1000 (E//c) 2.937 x10⁻² −1.037 x10⁻³ 1.036 x10⁻⁵ −1.710 x10⁻⁸ - - -
1005 (E//c) −9.480 x10⁻² 4.267 x10⁻³ −7.629 x10⁻⁵ 6.754 x10⁻⁷ −3.007 x10⁻⁹ 6.729 x10⁻¹² −6.051 x10⁻¹⁵
1010 (E//c) −7.102 x10⁻² 3.353 x10⁻³ −6.207 x10⁻⁵ 5.605 x10⁻⁷ −2.528 x10⁻⁹ 5.737 x10⁻¹² −5.241 x10⁻¹⁵
1015 (E//c) −5.152 x10⁻² 2.357 x10⁻³ −4.194 x10⁻⁵ 3.590 x10⁻⁷ −1.504 x10⁻⁹ 3.164 x10⁻¹² −2.698 x10⁻¹⁵
1019.5(E//c) −1.388 x10⁻² 9.881 x10⁻⁴ −2.307 x10⁻⁵ 2.326 x10⁻⁷ −1.052 x10⁻⁹ 2.291 x10⁻¹² −1.982 x10⁻¹⁵
992.4 (E//a) −2.101 x10⁻² 3.519 x10⁻⁴ 7.949 x10⁻⁷ −1.722 x10⁻⁹ - - -
995.1 (E//a) −1.422 x10⁻² 1.942 x10⁻⁴ 1.592 x10⁻⁶ −3.179 x10⁻⁹ - - -
1000 (E//a) 1.241 x10⁻² −5.302 x10⁻⁴ 6.473 x10⁻⁶ −1.925 x10⁻⁸ 1.987 x10⁻¹¹ - -
1005 (E//a) −4.568 x10⁻² 2.111 x10⁻³ −3.921 x10⁻⁵ 3.639 x10⁻⁷ −1.703 x10⁻⁹ 3.971 x10⁻¹² −3.677 x10⁻¹⁵
1010 (E//a) −7.331 x10⁻² 3.144 x10⁻³ −5.349 x10⁻⁵ 4.550 x10⁻⁷ −2.002 x10⁻⁹ 4.451 x10⁻¹² −3.968 x10⁻¹⁵
1015 (E//a) −6.297 x10⁻² 2.776 x10⁻³ −4.851 x10⁻⁵ 4.215 x10⁻⁷ −1.880 x10⁻⁹ 4.219 x10⁻¹² −3.789 x10⁻¹⁵
1020 (E//a) −5.676 x10⁻² 2.379 x10⁻³ −3.940 x10⁻⁵ 3.265 x10⁻⁷ −1.420 x10⁻⁹ 3.166 x10⁻¹² −2.860 x10⁻¹⁵
6. Gain cross-section calculations
In this subsection, we would like to present calculated gain cross section (GCS) curves for
Yb:YLF. Figure 13, which shows the variation of GCS spectra with temperature for both axis for
an assumed inversion level of 25%, could be used to initiate a discussion. As we have already
discussed while presenting the ECS results, the 1016 nm emission band of E//a axis provides
a bandwidth of around 10 nm, which is already sufficiently broad to tolerate sub-150-fs level
pulses either via mode-locking or via amplification. Note that the 1016 nm band is not only
broad, but it also possesses a relatively flat gain profile, which minimizes gain narrowing effects
in amplifiers [27]. If the whole available gain bandwidth of E//a axis could be used, for example
in a Kerr-lens mode-locked cryogenic Yb:YLF laser, there is potential to generate sub-100-fs
pulses. In contrast, the gain in E//c axis of Yb:YLF is much higher, at the expense of reduced
bandwidth. As an example, the 1019.5 nm emission band, which has around 2–3-fold higher gain
than the 1016 nm band of E//a axis, owns a FWHM of ∼4 nm, but this could already support
sub-300-fs pulses.
As we can see, the 992.5 and 995 nm peaks of Yb:YLF is quite narrow and has very high
gain at 78 K. Considering the additional advantage of lower quantum defect (995 nm laser
pumped at 960 nm), this line becomes very attractive for cw lasing [25], cw amplification [71],
or Q-switched lasing with ns-level pulses [62]. One important point to underline here is, in our
earlier work, we have seen that, under thermal load, the average temperature of Yb:YLF crystal
increases around 0.1–0.2 K per 1 W of absorbed power [30]. Hence, as mentioned earlier, under
typical cryogenic laser operation, the average temperature of the Yb:YLF crystal is typically
in the 125–150 K range (depending on absorbed pump power, pump spot size, etc..). Hence,
it is important to investigate the gain spectra of Yb:YLF in greater detail at slightly elevated
temperatures. For that, Fig. 14 shows the calculated gain of Yb:YLF at a temperature of 125
K, for inversion levels between 0 and 100%. Note that, at this temperature, the gain spectra of
Yb:YLF gets much more smoother, at the expense of reduced strength. It is interesting to see
that, at large inversion levels beyond 75%, the zero-phonon line around 971.7 nm also shows theResearch Article Vol. 11, No. 2 / 1 February 2021 / Optical Materials Express 267
Fig. 13. Calculated variation of Yb:YLF gain cross section (GCS) with temperature for an
inversion level of 0.25, for (a) E//c and (b) E//a exes.
potential of lasing for the E//a axis: ideally a 960 nm pumped 971.7 nm cryogenic Yb:YLF laser
will work with a quantum defect of only around 1.2%. As another observation, note that, even the
993.5–995 nm transitions are much smoother and at these temperature (∼125 K), it also seems to
have the potential to support sub-500-fs long pulses upon mode-locking or amplification.
Fig. 14. Calculated variation of Yb:YLF gain cross section (GCS) with inversion at a
temperature of 125 K, for (a) E//c and (b) E//a axes.
7. Small signal gain measurements
In this final section, we would like to present direct gain measurement results of Yb:YLF and
compare it with the estimates of the gain cross section (GCS) that is presented in the previous
section. This provides another alternative approach to investigate the error bars in the earlier
emission measurements. To start with, Fig. 15 shows the measured gain spectra of Yb:YLF at
(a) 78 K and (b) 295 K along with the calculated GCS profiles at the same temperatures, for an
inversion level of 75%. This inversion level is close to the estimated inversion amount in the
first few millimeters of the crystal along its length, which then decreases as the beam propagates
deeper inside the gain medium due to the lower amount of absorption. The small Cr:LiSAF beam
(1.3 mm) also passes through the center of the larger pump spot (3.2 mm), and observes a sweet
spot in terms of gain.
When we look at the measured gain profile at 78 K, we first notice that the measured gain
in E//c axis is much higher than the gain in E//a axis, which confirms our estimates based onResearch Article Vol. 11, No. 2 / 1 February 2021 / Optical Materials Express 268
Fig. 15. Comparison of measured variation of small single gain with calculated gain cross
section spectra in Yb:YLF for E//c and E//a axes, at temperatures of (a) 78 K and (b) 295 K.
The data is taken using a 2 cm long 1% Yb-doped YLF sample at an incident pump energy of
0.5 J and 4 J for the 78 K and 295 K, case respectively. An inversion level of 75% was used
in GCS calculation (this is the estimated average inversion level in the first few millimeters
of the crystal). An average inversion of around 50% and 20% is estimated through the whole
length of the crystal for the 78 K and 300 K cases, respectively.
earlier spectroscopic measurements. Moreover, the measured gain spectra match relatively well
to the estimated GCS profile for both polarizations, again confirming the flatness of the spectral
response of the measurement system. Note that for the E//c case, the measured gain is slightly
higher around the 1019.5 nm peak than what the GCS curve estimates.
We have also measured a single pass gain above 50 near 995 nm, a much higher value than
the GCS curve predicts. This data point is not shown in Fig. 15 on purpose (which would
otherwise scale down all the other data), but can be observed in Fig. 16, where we plot variation
of measured small single gain with temperature at selected wavelengths for both axes. We believe
the discrepancy between the measured and estimated gain around the 995 nm peak is again
potentially due to the limited resolution of our emission measurement spectrometer. A very high
gain (43-db gain in 14 passes) is also reported recently in a cw amplifier employing the 995 nm
line of Yb:YLF (2.6 mW cw signal is amplified to 40 W level), which confirms the strength and
sharpness of this line at cryogenic temperatures [71].
Fig. 16. Measured variation of small single gain with temperature in Yb:YLF for (a) E//c
and (b) E//a axes. The data is taken using a 2 cm long 1% Yb-doped YLF sample at an
incident pump energy of 0.4 J and 2 J for the E//c and E//a axes, respectively.You can also read