National Diabetes Registry Report - Volume 1 2009-2012 - Non-Communicable Disease Section
←
→
Page content transcription
If your browser does not render page correctly, please read the page content below

National Diabetes Registry
          Report
          Volume 1
          2009-2012

        Non-Communicable Disease Section
             Disease Control Division
            Ministry of Health Malaysia
Copyright © Ministry of Health Malaysia

All rights reserved. The contents of this publication may be freely
reproduced for non-commercial purposes with attribution to the
copyright holders. Suggested citation is: Feisul MI, Azmi S. (Eds).
National Diabetes Registry Report, Volume 1, 2009-2012. Kuala
Lumpur; Ministry of Health Malaysia; 2013 Jul.

This publication is also made available in electronic format on the
website of the Ministry of Health. Website: http://www.moh.gov.my

First published July 2013.

Published by:
Non-Communicable Disease Section
Disease Control Division
Department of Public Health
Ministry of Health Malaysia
Level 2, Block E3, Complex E
Federal Government Administration Centre
62590 Putrajaya, Malaysia

Tel: +603-8892 4413 Fax: +603-8892 4526
Website: http://www.moh.gov.my

ISBN 978-967-0399-53-9

Contents

Foreword ................................................................................................................................................... 1
Executive Summary ................................................................................................................................... 2
Abbreviations ............................................................................................................................................ 4
Definitions ................................................................................................................................................. 4
National Diabetes Registry Team .............................................................................................................. 5
Report Authors .......................................................................................................................................... 5
Acknowledgements ................................................................................................................................... 5
Introduction............................................................................................................................................... 6
Methodology ............................................................................................................................................. 9
Findings ................................................................................................................................................... 12
   Patient population ............................................................................................................................... 12
   Comorbidities ...................................................................................................................................... 15
   Clinical investigations .......................................................................................................................... 17
   Clinical target achievement ................................................................................................................. 18
   Drug treatment.................................................................................................................................... 22
Discussion ................................................................................................................................................ 25
Conclusions.............................................................................................................................................. 31
Bibliography............................................................................................................................................. 32
   Appendix 1: Participating KKs .............................................................................................................. 34
   Appendix 2: Patient Registration CRF.................................................................................................. 44
   Appendix 3: Outcome Update CRF ...................................................................................................... 45
   Appendix 4: Clinical Audit CRF............................................................................................................. 46
   Appendix 5: Sample size determination for Clinical Audit .................................................................. 48
Foreword

As Malaysia continues its developmental progress as a nation both socially and economically, disease
patterns and burdens are changing to reflect changes in lifestyle and dietary patterns of its population.
It is well-recognized that diabetes in Malaysia has become increasingly problematic along with issues
of other cardiovascular conditions such as hypertension, heart disease and stroke. Based on the latest
results of the National Health and Morbidity Survey (NHMS) 2011 and projections by the Disease
Control Division, Ministry of Health (MOH), the prevalence of diabetes among adults in Malaysia is
projected to rise to 21.6% by the year 2020. The Ministry of Health views these changes with concern
and awareness of the need to take action to both control complication rates of existing diabetics while
preventing the disease among those who are currently healthy.

The National Diabetes Registry (NDR) is one of the initiatives being taken by the MOH to further
strengthen Non-Communicable Disease surveillance in Malaysia, specifically for monitoring quality of
care among patients living with diabetes managed in MOH healthcare facilities. While the MOH has
been able to provide chronic disease management services at minimal or no cost, changes in our
socio-economic circumstances have stretched our services at MOH healthcare facilities.

Research and data are critical elements that facilitate better understanding for the improvements
needed. I commend the National Diabetes Registry team and all of the staff at our healthcare clinics
and hospitals for having initiated and contributed to this innovative registry that leverages upon
existing care and data collection processes within the MOH. It has been four good years of investment
and I am happy to see this first report being published as recognition of the work as well as an
opportunity to share information with all others who are interested in the care of our patients with
diabetes.

Finally, it is hoped that with the existence of this useful dataset, we can better understand how to
improve treatment and management of our patients to reduce complication rates, increase life span
and quality of life of patients within our care.

Datuk Dr Noor Hisham Abdullah
Director-General of Health, Malaysia

                                                                                                       1
Executive Summary

The National Diabetes Registry (NDR) was established to keep track of the target achievement and
clinical outcomes of patients with diabetes managed at primary healthcare clinics (Klinik Kesihatan or
KK) under the Ministry of Health (MOH). The NDR started in 2009, initially with manually collected
data and subsequently migrated to a web-based data collection system in 2011. All patients receiving
diabetes care at 644 participating KKs are required to be registered into the NDR and the status of
patients is regularly updated. The combined information from patient registration and status
determines the pool of ‘active’ patients with diabetes currently receiving care at KKs. A proportion of
these active patients are audited annually to obtain clinical and treatment information including data
on clinical investigation results, drug use, complications and co-morbidities. The data of audited
patients are required to be completed and uploaded into the NDR database before 31st August of
every year.

From 2009 to 2012 there were 657,839 patients registered in the NDR, of which 653,326 were
diagnosed with T2DM. The number of registered T2DM patients ranged from 106,101 in Selangor to
524 in WP Labuan. The mean age of T2DM patients in the NDR was 59.7 years old, 41.6% were men
and 58.4% were women. The mean age at diagnosis for T2DM patients was 53 years old, with a mean
duration of follow-up of 6.5 years. In terms of ethnicity, 58.9% were Malay, 21.4% were Chinese and
15.3% were Indian.

The mean HbA1c was 8.1% for T2DM patients audited in 2012, of which 23.8% of patients achieved the
Malaysian glycaemic treatment target of HbA1c

conduct source data verification that would ensure the data entered in the registry reflects
information in the medical records.

In order to limit the burden of data collection, the NDR has leveraged upon existing data collection
requirements within the KK setting (Diabetes Clinical Audit and The National Diabetes Quality
Assurance Programme). This approach along with limited sampling required, a web-based data entry
system and automated random sampling has enabled useful data collection and tracking with
relatively minimal effort.

The registry has been able to show that in the last four years there has been some progress made in
terms of treatment target achievement and insulinisation among MOH patients with T2DM. There
remain some questions that may not be possible to be answered with the present NDR data. It is
hoped that with the publication of this report, further exploration into these questions can be
pursued.

                                                                                                  3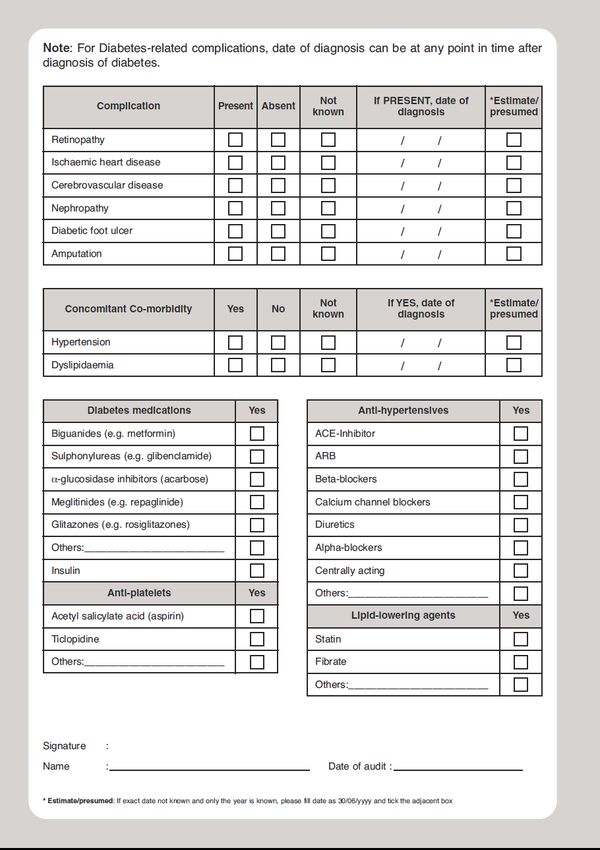
Abbreviations
2HPP                   2-hour post-prandial blood glucose
ACE-I                  Angiotensin converting enzyme inhibitor
ADCM                   Audit of diabetes control and management
ARB                    Angiotensin receptor blockers
BP                     Blood pressure
CI                     Confidence interval
CPG                    Clinical Practice Guideline
CRF                    Case Report Form
DM                     Diabetes mellitus
ECG                    Electrocardiogram
FBG                    Fasting blood glucose
HbA1c                  Glycosylated haemoglobin
HDL                    High density lipoprotein
IFG                    Impaired fasting glucose
IGT                    Impaired glucose tolerance
IQR                    Inter-quartile range
JKN                    State Health Department (Jabatan Kesihatan Negeri)
KK                     Health Clinic (Klinik Kesihatan)
LDL                    Low density lipoprotein
MOH                    Ministry of Health
N/A                    Not available
NDR                    National Diabetes Registry
NHMS                   National Health and Morbidity Survey
OAD                    Oral anti-diabetes drugs
RBG                    Random blood glucose
SIQ                    Shortfall in quality
T1DM                   Type 1 diabetes mellitus
T2DM                   Type 2 diabetes mellitus
TCM                    Traditional and complementary medicine
TG                     Triglycerides

Definitions
Active T2DM patients   Patients with Type 2 Diabetes with at least one visit to the health clinic
                       within one year of the date of clinical audit
Registry patients      Patients diagnosed with diabetes and registered at any of the participating
                       health clinics
Audit patients         Active T2DM patients who were sampled in the clinical audit year

                                                                                                     4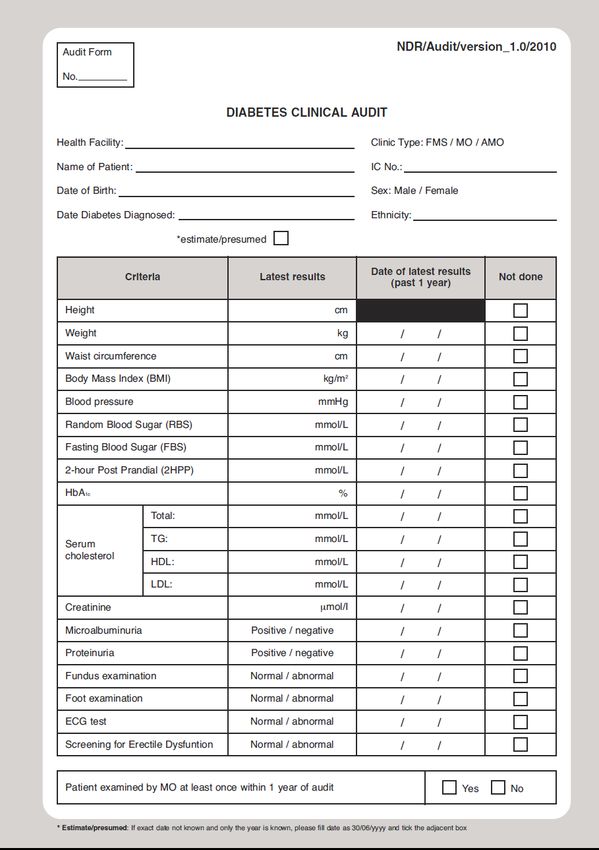
National Diabetes Registry Team
•       Dr. Feisul Idzwan Mustapha, MOH Putrajaya (Principal Investigator)
•       Dr. Adam Firdaus Dahlan, JKN WP Labuan
•       Dr. Asmah Zainal Abidin, JKN Perak
•       Dr. Azizah Abd. Manan, JKN P.Pinang
•       Dr. Fatanah Ismail, MOH Putrajaya
•       Dr. Fatimah Majid, JKN Pahang
•       Dr. Fatimah Muda, JKN Terengganu
•       Dr. Latifah Abd. Rahman, JKN Kedah
•       Dr. Mastura Ismail, JKN N.Sembilan
•       Dr. Misliza Ahmad, JKN WPKL & Putrajaya
•       Dr. Nirmal Kaur, JKN Sabah
•       Dr. Noor Hashimah Abdullah, JKN Kelantan
•       Dr. Noraryana Hassan, JKN Melaka
•       Dr. Norhashimah Basri, JKN Sarawak
•       Dr. Norli Ab. Jabbar, JKN Selangor
•       Dr. Rotina Abu Bakar, JKN N.Sembilan
•       Dr. Yusmah Muhammad, JKN Johor
•       Dr. Zainal Ariffin Omar, MOH Putrajaya
•       Dr. Zulhizzam Abdullah, JKN Perlis

Report Authors
    •    Dr. Feisul Idzwan Mustapha, NCD Section, Disease Control Division, Ministry of Health Malaysia
    •    Dr. Soraya Azmi, Azmi Burhani Consulting

Acknowledgements

        A special thanks to the whole National Diabetes Registry team and the staff of
        all the participating KKs for their dedication and support in the implementation
        of the registry. The NDR database and this report would not have been possible
        without their significant contribution. It is hoped that the clinic teams have
        found the data useful, enabling them to observe improvements as well as
        monitor performance at the clinic level.

Decisions about the content of this report rested entirely with the principal investigator and report
authors. We thank Adrian Goh, Siti Haryanie, Nurul Azwani, Rozana Razali and Izmil Haikal of Azmi
Burhani Consulting for their help in preparing this report.

Preparation of this report was supported by an unrestricted educational grant from Sanofi-Aventis
(Malaysia) Sdn Bhd.

                                                                                                          5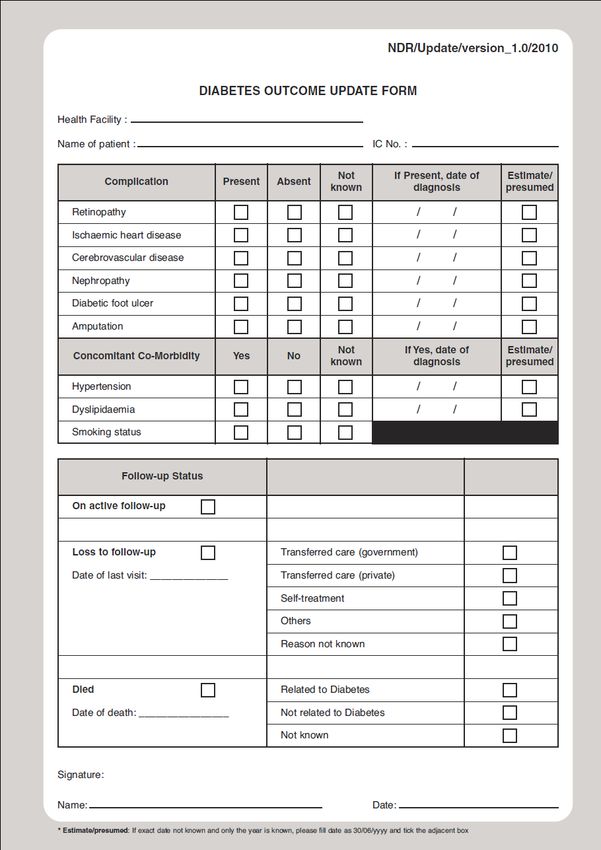
Introduction

Diabetes mellitus (DM) is a major public health concern in Malaysia and has been shown to be closely
related to increased premature and preventable mortality, as well as macro and microvascular
complications such as heart disease, stroke, end-stage renal failure, blindness and amputation. The
burden of diabetes continues to increase in Malaysia. The National Health and Morbidity Survey
(NHMS) 2011 has shown that the prevalence of diabetes in Malaysia has increased by 31.0% in the
space of just 5 years, from 11.6% in 2006 to 15.2% in 2011 (Figure 1). This means that there are
currently about 2.6 million adults age 18 years and above living with diabetes.

                    16                              15.2

                    14

                    12   11.6

                    10
   Prevalence (%)

                                                                 8.0
                     8          7.0                        7.2                        Total diabetes
                     6
                                                                                      Known
                                                                       4.9
                                      4.5     4.2                                     Undiagnosed
                     4                                                                IFG

                     2

                     0
                            NHMS III (2006)                NHMS 2011

Figure 1. Prevalence of diabetes in adults aged 18 years and above (NHMS III 2006 and NHMS 2011)

Data from NHMS 2011 also shows that about 80% of patients diagnosed with diabetes seek treatment
at public health care facilities (Figure 2), while the rest are treated by private general practitioners, or
take complementary and alternative medicines.

                                                                                                          6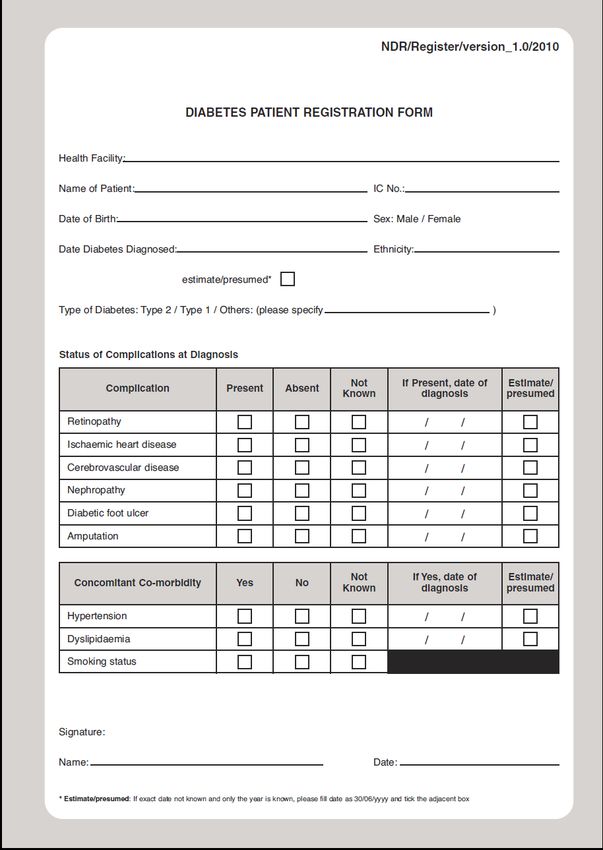
1.7%
                        2.5%           0.2%

                                                                       MOH health clinics
                      15.0%
                                                                       MOH hospitals
                                                                       Private clinics
                                                                       Private hospitals
                                          56.0%
                    24.6%                                              Self-medicate
                                                                       TCM

Figure 2. Usual place of treatment of patients diagnosed with diabetes (NHMS 2011)

Health clinics in the public sector provide more comprehensive diabetes services as compared to the
private sector, but bear a much higher patient load. Various programmes and activities have been
initiated in late 1990s and early 2000s to improve diabetes management at the primary healthcare
level, including the publication of the Clinical Practice Guidelines (CPG) on the Management of Type 2
Diabetes Mellitus (T2DM), the latest being the 4th edition, published in late 2009. The MOH centres
had also performed routine data collection in the past with paper-based “returns”. However, these
“returns” consisted mostly of process indicators, with very minimal clinical outcome data, and the
paper-based system suffered from expected inherent issues of reliability and timely data. Thus, there
was no reliable mechanism in place to monitor the achievement of patients’ targets and clinical
outcomes.

Rationale
In order to address the lack of information on the status of clinical target achievement of patients with
diabetes, a National Diabetes Clinical Audit was developed and implemented in 2008 to provide data
on the quality of care provided to T2DM patients managed in MOH health clinics. The clinical audit
was initially conducted manually using paper CRFs supported with an Excel-based stand-alone
application, but this process was gradually migrated on to a web-based application system. The NDR
was developed based on the platform of the Diabetes Clinical Audit as a mechanism to routinely
collect data for the audit, as well as to provide a more systematic and timely method of data
collection.

In order to limit the burden of data collection on clinic staff, the Diabetes Clinical Audit was conducted
on randomly sampled active T2DM on follow-up at MOH health clinics. Universal data entry for clinical
variables is not currently feasible as the medical records in the majority of MOH health clinics are still
paper-based.

                                                                                                        7
With its establishment, the NDR has collected basic socio-demographic information, clinical and
outcome data of patients with diabetes managed in MOH health clinics and selected hospitals. In
addition, it has allowed greater efficiency to conduct the annual clinical audit. The NDR has been a
collaborative effort among MOH clinics and hospitals that leverages upon existing data collection
requirements and processes. The registry is a useful tool to better understand patterns of disease and
clinical management of patients managed within the MOH in order to reduce complications and
improve patient management and future outcomes.
NDR components
The NDR contains information on patients with diabetes managed at participating KKs and consists of
two related components: (i) patient registry and (ii) clinical audit datasets. The audit dataset is a
subset of the patient registry. On an annual basis, patients from the registry are randomly selected for
auditing of clinical variables as well as clinical outcomes, with these data subsequently added to their
registry record.
At the end of December 2012, the patient registry contained 657,839 patient records of which
653,326 were diagnosed with T2DM. Basic information required in the registry dataset includes socio-
demographic and certain specified medical history variables from all new patients enrolled into the
registry. The clinical audit dataset has more complete patient clinical information with 353,017 patient
records at the end of December 2012. It captures clinical variables, drug use and outcomes data for
audited patients. The clinical audit has been performed on data of active patients in the NDR since
2009.
National Diabetes Registry objectives:
Leverage upon existing audit processes to collect useful clinical data
Enable tracking of glucose control and clinical outcomes of patients with diabetes managed at
MOH health clinics
Enable comparisons over time and across geographical locations
Enable research in order to improve the quality of care provided to patients
This publication is the first NDR report since the establishment of the registry. It is intended to share
the data contained within the registry with clinicians, public health specialists, researchers and all
those who are interested in the clinical management of diabetes.
8Methodology
Site selection criteria
All MOH KKs managing patients with diabetes from 2009 onwards were eligible for inclusion into the
NDR. From 2009 to 2012, 644 KKs throughout the country have provided data to the NDR as shown in
Appendix 1.
Patient selection criteria
The NDR includes all patients with diabetes managed at KKs which submit data to the NDR. These
included patients with T2DM, Type 1 Diabetes Mellitus (T1DM) and other types of DM diagnoses.
Other types of DM included congenital diabetes, cystic fibrosis-related diabetes, steroid-related
diabetes which is induced by high doses of glucocorticoids and several forms of monogenic diabetes.
The registry excludes IGT, IFG or gestational diabetes. Since the diabetes clinical audit is only
conducted for T2DM, this report focuses only on the results for patients with T2DM in the NDR.
Data collection
The NDR database contains information about patients with diabetes receiving care at participating
KKs. Prior to 2011, data collection was conducted using an Excel-based application. However, since 1st
January 2011, an electronic, web-based data-entry system has been used for this purpose.
Data collection is performed by the clinic staff, using 3 main CRFs:
i. Patient Registration CRF - for newly diagnosed patients with diabetes
(Form NDR/Register/version_1.0/2010)
ii. Outcome Update CRF - for all registered patients with diabetes
(Form NDR/Update/version_1.0/2010)
iii. Clinical Audit CRF - used to obtain data for clinical audit purposes
(Form NDR/Audit/version_1.0/2010)
The Patient Registration CRF: (Appendix 2)
Date of diagnosis and type of diabetes
Demographic data (state, sex, age, ethnicity, duration of diabetes)
Complications (retinopathy, ischaemic heart disease, cerebrovascular disease, nephropathy,
diabetic foot ulcer, amputation)
Co-morbidities (hypertension, dyslipidaemia, smoking status)
The Outcome Update CRF: (Appendix 3)
Complications (retinopathy, ischaemic heart disease, cerebrovascular disease, nephropathy,
diabetic foot ulcer, amputation)
Co-morbidities (hypertension, dyslipidaemia, smoking status)
Current patient status (still on active follow-up, loss to follow-up, died)
The Clinical Audit CRF: (Appendix 4)
Complications (retinopathy, ischaemic heart disease, cerebrovascular disease, nephropathy,
diabetic foot ulcer, amputation)
Co-morbidities (hypertension, dyslipidaemia)
Glycaemic control (HbA1c)
9 Clinical investigation results (BP, HbA1c, FBG, RBG, 2HPP, creatinine, total cholesterol, LDL,
HDL, triglycerides, proteinuria, microalbuminuria)
Diabetic treatments (monotherapy, OADs, insulin, diet)
Anti-diabetic drug use (metformin, sulphonylurea, alpha-glucosidase inhibitor, meglitinide,
glitazones, insulin, other agents)
Drug treatments for concomitant conditions (anti-hypertensive, anti-platelet and anti-lipid
drugs)
The status of registered patients is continuously updated throughout the year with updates for
occurrence of any new complication(s), co-morbidities, loss of follow-up and death. The active
patients with T2DM are the population pool from which patients are selected for the annual clinical
audit.
Data collection for audited patients is conducted from January each year while data entry into the
NDR database must be completed before 31st August of the same year.
Sampling methodology for Diabetes Clinical Audit
Random sampling is conducted to select the patients that need to be included in the annual Diabetes
Clinical Audit. The sampled population comes from active patients with T2DM in the registry dataset.
Since January 2011, the sampling has been automatically performed by the web-based application.
Different samples of patients are drawn every year. Patients sampled in the previous year have an
equal chance of being selected in the subsequent years. Prior to 2011, random sampling was
performed manually by the staff at the clinics.
The sample size is determined by the number of active patients with T2DM within a particular district.
This was done to minimise the number of patients audited, yet remain useful for inter-district
comparability. However, some states have opted for sampling at the clinic level, thus enabling
comparability between health clinics. Unfortunately, this causes an inflated number of sampled
patients to be audited. Once sampling is automatically performed for each KK, the clinic staff is
required to complete the audit details for all of the selected patients.
Sample size estimation
The sample size is calculated to estimate the proportion of patients with T2DM-related complications
managed at MOH KKs. The number of patients expected to have complications (shown in Box 1) was
estimated by consensus by a group of MOH clinicians.
Box 1. Consensus estimate of DM complications
Macroangiopathy Microangiopathy
IHD (50%) Retinopathy (30%)
Stroke (10%) Nephropathy (40%)
PVD (12-16%) Neuropathy (70%)
Foot ulcer (5-15%) Autonomic neuropathy (ED & GI)
Peripheral neuropathy (foot)
10The largest sample size was calculated from the prevalence of stroke (10%) with acceptable difference
in stroke prevalence of 20%, at power 80% and 95% confidence interval.
The sample of patients with T2DM required for the clinical audit from each district is based on the
number of active patients registered in each district, and ranges from 162 to 850 patients, as shown in
Appendix 5.
Statistical methods
Results below present descriptive statistical analysis as generated by the NDR web-based application
with supplementary analyses conducted using STATA SE version 11.2. Results are presented as
categorical variables (n, %) or continuous variables (mean, 95% CI and/ or median, inter-quartile
range).
Results below were generated using data from the NDR extracted between 13th to 28th May 2013. The
data included patient records from 1st January 2009 to 31st December 2012.
Clinical setting
A total of 644 government health clinics from all states in Malaysia were enrolled in the NDR between
2009 and 2012. In the reporting period ending December 2012, 625 KKs had submitted data to the
NDR. The distribution of KKs providing data to the NDR by state is shown in Table 1 below. A complete
list of KKs enrolled in the NDR is listed in Appendix 1.
Table 1. Distribution of KKs enrolled in the NDR registry by state
State Number of KKs
Johor 88
Kedah 52
Kelantan 53
Melaka 26
Negeri Sembilan 45
Pahang 67
Perak 73
Perlis 9
Pulau Pinang 27
Sabah 36
Sarawak 54
Selangor 59
Terengganu 39
WP Kuala Lumpur 13
WP Labuan 1
WP Putrajaya 2
Malaysia 644
11Findings
Patient population
From 2009 to end of 2012, there were a total of 657,839 patients enrolled in the registry. Nearly all
the patients enrolled, 653,326, were diagnosed with T2DM. As of end 2012, patients diagnosed with
T1DM or other forms of DM comprised only 0.6% and 0.1%, respectively.
The characteristics of T2DM patients are shown in Table 2. The mean age of T2DM patients registered
in the NDR was 59.7 years (95% CI: 59.7-59.7). Men represented 41.6% of the patients registered.
Thus, women were in the majority representing 58.4% of patients. Comparing by states, the largest
number of patients were registered from Selangor (106,101), followed by Johor (92,750) and Perak
(74,492). The ethnic distribution was as follows: Malay 58.9%, Chinese 21.4%, Indian 15.3%, Other
Malaysian 4.2% and Foreigner/Unknown 0.2% as shown in Figure 3.
12Table 2. Characteristics of T2DM patients enrolled from 2009 to 2012 [Registry Dataset]
Ethnicity, n(%)
No. of patients, Mean age
State Male, n(%) Other Foreigner/
n(%) (95% CI) Malay Chinese Indian
Malaysian Unknown
Johor 92,750(14.2) 38,386(41.4) 59.8 (59.7-59.9) 58,306(62.9) 22,724(24.5) 11,219(12.1) 397(0.4) 104(0.1)
Kedah 42,344(6.5) 16,482(38.9) 59.1 (59.0-59.2) 31,515(74.4) 5,059(11.9) 5,274(12.5) 453(1.1) 43(0.1)
Kelantan 27,002(4.1) 9,692(35.9) 59.3 (59.2-59.4) 25,497(94.4) 1,066(3.9) 145(0.5) 278(1.0) 16(0.1)
Melaka 42,974(6.6) 18,640(43.4) 61.0 (60.9-61.1) 28479(66.3) 9,883(23.0) 4,264(9.9) 292(0.7) 56(0.1)
Negeri Sembilan 57,869(8.9) 25,288(43.7) 60.4 (60.3-60.5) 33,317(57.6) 10,810(18.7) 13,347(23.1) 314(0.5) 81(0.1)
Pahang 38,119(5.8) 15,972(41.9) 58.9 (58.8-59.1) 29,700(77.9) 5,450(14.3) 2,664(7) 201(0.5) 104(0.3)
Perak 74,492(11.4) 31,604(42.4) 61.1 (61.1-61.2) 38,867(52.2) 18,869(25.3) 16,113(21.6) 588(0.8) 55(0.1)
Perlis 13,388(2.1) 5,311(39.7) 58.9 (58.7-59.1) 11,521(86.1) 1,217(9.1) 326(2.4) 314(2.3) 10(0.1)
Pulau Pinang 40,439(6.2) 17,271(42.7) 60.6 (60.5-60.7) 17,758(43.9) 14,534(35.9) 7,876(19.5) 210(0.5) 61(0.2)
Sabah 11,302(1.7) 4,933(43.6) 58.8 (58.6-59.0) 560(5.0) 3,594(31.8) 104(0.9) 6,888(60.9) 156(1.4)
Sarawak 43,333(6.6) 17,046(39.3) 59.3 (59.2-59.4) 12,030(27.8) 14,850(34.3) 254(0.6) 16,088(37.1) 111(0.3)
Selangor 106,101(16.2) 45,019(42.4) 58.5 (58.4-58.6) 55,245(52.1) 19,664(18.5) 29,603(27.9) 1067(1.0) 522(0.5)
Terengganu 22,272(3.4) 8,275(37.2) 58.3 (58.2-58.5) 21,786(97.8) 427(1.9) 21(0.1) 23(0.1) 15(0.1)
WP Kuala Lumpur 37,713(5.8) 16,261(43.1) 60.5 (60.4-60.7) 17,258(45.8) 11,587(30.7) 8,448(22.4) 317(0.8) 103(0.3)
WP Labuan 524(0.1) 202(38.5) 55.8 (54.8-56.8) 363(69.3) 72(13.7) 4(0.8) 77(14.7) 8(1.5)
WP Putrajaya 2,704(0.4) 1,408(52.1) 54.5 (54.1-54.9) 2,494(92.2) 62(2.3) 128(4.7) 12(0.4) 8(0.3)
Total patients, n (%) 653,326(100) 271,790 (41.6) 59.7 (59.7-59.7) 384,696(58.9) 139,868(21.4) 99,790(15.3) 27,519(4.2) 1,453(0.2)
134.2% 0.2%
Malay
15.3% Chinese
Indian
58.9%
Other Malaysian
21.4%
Foreigner/ Unknown
Figure 3. Distribution of T2DM patients at diagnosis by ethnicity [Registry Dataset]
< 18 years old
20.1%
18-29 years old
2.1% 32.6%
30-44 years old
0.2%
45-54 years old
1.1%
15.2% 55-64 years old
65-79 years old
28.7%
≥ 80 years old
Figure 4. Distribution of T2DM patients by age at diagnosis [Registry Dataset]
The mean age of T2DM patients in the NDR was 59.7 years (95% CI: 59.7-59.7). On the other hand,
the mean age at diagnosis was 53 years old (data not shown). As shown in Figure 4 above, categorised
by age at diagnosis, the largest proportion represented those who were diagnosed at age 45 to 54
years old (32.6%), followed by 55 to 64 years old (28.7%) and next at age 30 to 44 years old (20.1%).
The mean duration of follow up for the patients with T2DM was 6.5 years (95% CI: 6.5 - 6.5), with a
median duration of 5.0 years (IQR: 6.0 years) as observed in Table 3. The differences between the
mean and median are indicative that the data is not normally distributed and skewed to the right by a
greater number of older patients. Overall, 43.0% of patients were diagnosed with diabetes for less
14than 5 years, another 40.1% were diagnosed between 5-10 years and 17.0% were diagnosed more
than 10 years. However, it is interesting to note that in 2012 the majority of patients had diabetes for
a duration of 5 years or less, whereas in earlier years, the majority of patients had diabetes for 5-10
years. This may be due to a more generalized process of selecting patients for inclusion into the
registry after the web-based application was implemented.
Table 3. Duration of diabetes of registered T2DM patients [Registry Dataset]
Diabetes duration 2009-2012 2009 2010 2011 2012
Mean %, (95% CI) 6.5 (6.5 - 6.5) 8.7 (8.7 - 8.8) 7.7 (7.7 - 7.7) 6.7 (6.7 - 6.7) 6.0 (6.0 - 6.0)
Median %, (IQR) 5.0 (6.0) 7.0 (6.0) 7.0 (6.0) 5.0 (6.0) 5.0 (6.0)
Duration by group, n (%)
< 5 years 281,301 (43.0) 1,1005 (17.8) 21,032 (27.0) 155,754 (40.8) 161,224 (48.5)
5 – 10 years 262,301 (40.1) 34,720 (56.1) 41,031 (52.6) 161,171 (42.2) 118,268 (35.6)
> 10 years 111,260 (17.0) 16,148 (26.1) 15,901 (20.4) 64,696 (17.0) 52,778 (15.9)
Total patients 654,862 61,873 77,964 381,621 332,270
Comorbidities
Table 4 below shows the presence of co-morbidities and complications among patients with T2DM in
the clinical audit dataset. Hypertension was the most common co-morbidity in 70.1% of audited
patients in 2012 followed by dyslipidaemia in 55.1% of audited patients. Meanwhile, smokers
comprised 4.9% of patients registered in the NDR as of December 2012. Among patients audited in
2012, the most common DM related complications were nephropathy (7.8%), retinopathy (6.7%), and
ischaemic heart disease (5.3%).
15Table 4. Complications and co-morbidities in 2011 and 2012 [Audit Dataset]
Co-morbidities 2011, n (%) 2012, n (%)
Hypertension
Yes 49,038 (68.4) 86,975 (70.1)
No 15,935 (22.2) 30,251 (24.4)
Unknown 6,656 (9.3) 6,752 (5.4)
Dyslipidaemia
Yes 37,893 (52.9) 68,283 (55.1)
No 24,111 (33.7) 45,960 (37.1)
Unknown 9,625 (13.4) 9,735 (7.9)
Smoking status*
Smoker 19,362 (5.1) 16,361 (4.9)
Non-smoker 274,880 (72.0) 237,769 (71.6)
Unknown 86,903 (22.8) 78,089 (23.5)
Complications 2011, n (%) 2012, n (%)
Nephropathy
Present 5,429 (7.6) 9,707 (7.8)
Absent 51,350 (71.7) 99,016 (79.8)
Unknown 14850 (20.7) 15,256 (12.3)
Retinopathy
Present 4,627 (6.5) 8,255 (6.7)
Absent 50,455 (70.4) 96,872 (78.1)
Unknown 16,547 (23.1) 18,853 (15.2)
Ischaemic Heart Disease
Present 3,467 (4.8) 6,508 (5.3)
Absent 53,387 (74.5) 101,630 (81.9)
Unknown 14,775 (20.6) 15,842 (12.8)
Cerebrovascular Disease
Present 788 (1.1) 1,550 (1.3)
Absent 56,966 (79.5) 106,953 (86.2)
Unknown 13,875 (19.4) 15,476 (12.5)
Diabetic Foot Ulcer
Present 841 (1.2) 1,527 (1.2)
Absent 58,044 (81.0) 10,8726 (87.7)
Unknown 12,744 (17.8) 13,725 (11.1)
Amputation
Present 387 (0.5) 721 (0.9)
Absent 58,487 (81.6) 109,652 (88.4)
Unknown 12,755 (17.8) 13,605 (11.0)
Note: *Smoking status was obtained from the registry dataset. All other complications and co-
morbidities were obtained from the audit dataset.
16Clinical investigations
Table 5 shows the proportion of patients who had routine clinical tests performed including BP
measurement, HbA1c, FBG, RBG, 2HPP, creatinine, total cholesterol, LDL, HDL, TG, urine protein and
urine microalbumin tests, as well as had foot examination, funduscopy and ECGs performed. Among
the 124,023 patients selected for audit in 2012, 93.7% of patients had their BP taken and 78% or more
of patients had total cholesterol levels and TG tested, although LDL and HDL tests were performed for
only 59.1% and 59.5% of patients, respectively. Urine protein and urine microalbumin were measured
in 64.7% and 56.7% of patients respectively. Meanwhile, foot examination, fundus examination and
ECG were performed in 73.0%, 44.0% and 54.1% of patients, respectively.
Table 5. Proportion of patients receiving clinical investigations [Audit Dataset]
Investigation 2009, n (%) 2010, n (%) 2011, n (%) 2012, n (%)
BP 79,202 (98.8) 63,138 (81.8) 66,940 (93.4) 116,265 (93.7)
HbA1c 54,431 (67.9) 48,765 (63.2) 51,018 (71.2) 96,694 (78.0)
FBG 48,019 (59.9) 46,217 (59.9) 44,565 (62.2) 71,386 (57.6)
RBG 50,744 (63.3) 43,281 (56.1) 39,169 (54.7) 74,801 (60.3)
2HPP 9,719 (12.1) 6,150 (8.0) 4,200 (5.9) 5,862 (4.7)
Creatinine 65,875 (82.2) 53,067 (68.8) 51,940 (72.5) 96,248 (77.6)
Total cholesterol 66,203 (82.6) 52,724 (68.3) 53,091 (74.1) 97,362 (78.5)
LDL 51,421 (64.2) 34,220 (44.3) 35,950 (50.2) 73,332 (59.1)
HDL 52,306 (65.3) 34,461 (44.7) 36,508 (51.0) 73,772 (59.5)
TG 65,648 (81.9) 52,360 (67.8) 52,506 (73.3) 97,045 (78.3)
Urine protein 45,794 (57.2) 44,802 (58.1) 41,830 (58.4) 80,224( 64.7)
Urine microalbumin 36,300 (45.3) 35,859 (46.5) 36,842 (51.4) 70,273 (56.7)
Foot examination 58,001 (72.4) 59,643 (77.3) 50,115 (69.9) 90,558 (73.0)
Fundus 29,263 (36.5) 29,642 (38.4) 27,806 (38.8) 54,590 (44.0)
ECG 35,926 (44.8) 35,975 (46.6) 35,848 (50.0) 67,068 (54.1)
Patients audited 80,134 77,179 71,655 124,023
17Clinical target achievement Table 6 below shows the mean HbA1c and the percentage of patients reaching clinical targets for HbA1c. Mean HbA1c has decreased slightly over 4 years, from 8.3% in 2009 to 8.1% in 2012 with most audited patients recording HbA1c between 8.0% to 10.0%. In 2012, 23.8% of patients achieved the Malaysian glycaemic target of HbA1c
Table 7. Proportion of patients achieving HbA1c treatment target (HbA1c
Table 8 below reports the mean clinical test values and proportions of audited patients achieving
treatment targets for concomitant conditions. Among patients audited in 2012, more than 70% of
patients tested negative for proteinuria and microalbuminuria, while 65.7% recorded HDL ≥1.1 mmol/l
and 60.8% had TG ≤1.7 mmol/l. However, fewer patients achieved target total cholesterol (28.5%), LDL
cholesterol (37.8%), BMI (16.6%), as well as waist circumference for both males (33.8%) and females
(14.4%).

Comparing between 2009 and 2012, the achievement of treatment targets have improved for total
cholesterol (from 24.1% to 28.5%), TG (53.2% to 60.8%) and LDL (30.6% to 37.8%).

                                                                                                 20
Table 8. Target achievement based on clinical investigations [Audit Dataset]
2009 2010 2011 2012
Treatment % Mean test % Mean test % Mean test % Mean test
Clinical test
targets achieved result achieved result achieved result achieved result
target (95% CI) target (95% CI) target (95% CI) target (95% CI)
Urine protein Negative N/A N/A 64.3 N/A 74.6 N/A 77 N/A
Urine microalbumin Negative N/A N/A 64.3 N/A 71.1 N/A 71.9 N/A
136 134.4 135.4 135.5
Systolic BP ≤130 mmHg 48.7 52.6 49 47.6
(135.8-136.1) (134.3-134.6) (135.3-135.6) (135.4-135.6)
79.5 79.5 79.1 78.4
Diastolic BP ≤80 mmHg 64.5 67.1 66.2 67.1
(79.5-79.6) (79.4-79.5) (79.0-79.1) (78.3-78.5)
BP ≤130/80 mmHg 41.2 N/A 45 N/A 42 N/A 40.9 N/A
Total cholesterolDrug treatment
The use of anti-diabetic drugs is shown in Table 9 below. In 2012, 27.0% of patients were on
monotherapy compared to 33.7% in 2009, while 45.7% were on 2 or more OADs compared to 51.3% in
2009. The changes are reflected in patients who were on insulin-OAD combination treatment which
increased from 8.8% in 2009 to 16.5% in 2012. Rather unexpectedly, the number of patients on diet
management only also increased from 3.3% to 5.9%.
Among the various classes of OADs, metformin was the most commonly prescribed with 82.5% of
patients on this treatment. Second to metformin are the sulphonylureas, which are used by 56.9% of
patients. These are followed by alpha-glucosidase (4.7%) and glitazones (1.1%). One percent or fewer
were also on meglitinides and other OADs. On the other hand, the use of insulin has increased over
the last 4 years, from 11.7% of patients in 2009, increasing to 21.4% in 2012.
Table 9. Anti-diabetic drugs used [Audit Dataset]
Therapy 2009, n (%) 2010, n (%) 2011, n (%) 2012, n (%)
Monotherapy (OAD) 27,037 (33.7) 26,121 (33.8) 19,793 (27.6) 33,505 (27.0)
≥2 OAD 41,094 (51.3) 40,239 (52.1) 35,153 (49.1) 56,658 (45.7)
OAD + Insulin 7,068 (8.8) 6,851 (8.9) 9,579 (13.4) 20,434 (16.5)
Diet only 2,664 (3.3) 17,53 (2.3) 4,451 (6.2) 7,307 (5.9)
Type of anti-diabetic drug
Metformin 65,703 (82.0) 66,268 (85.9) 59,221 (82.6) 10,2315 (82.5)
Sulphonylureas 52,394 (65.4) 48,816 (63.2) 42,932 (59.9) 70,579 (56.9)
Alpha-Glucosidase Inhibitors 3,824 (4.8) 4,534 (5.9) 4,649 (6.5) 5,801 (4.7)
Meglitinides 201 (0.3) 274 (0.4) 131 (0.2) 119 (0.1)
Glitazones 134 (0.2) 261 (0.3) 477 (0.7) 1,330 (1.1)
Other OADs 601 (0.8) 502 (0.7) 645 (0.9) 1,135 (0.9)
Insulin 9,348 (11.7) 9,075 (11.8) 12,275 (17.1) 26,553 (21.4)
Total patients audited 80,143 77,188 71,672 124,023
The use of insulin as a mode of treatment from 2009 to 2012 by state is illustrated in Table 10 below.
Generally, there was a steady growth in percentage of patients receiving insulin treatment in all states
except for Perlis, Sarawak and WP Putrajaya. The highest percentage of T2DM patients receiving
insulin in 2012 was in Negeri Sembilan with 27.9% followed by Selangor and WP Putrajaya with 24.2%
and 23.9%, respectively.
22Table 10. Use of insulin by state [Audit Dataset]
2009 2010 2011 2012
State Audited Patients on Audited Patients on Audited Patients on Audited Patients on
patients insulin (%) patients insulin (%) patients insulin (%) patients insulin (%)
Johor 6,191 710 (11.5) 5,555 563 (10.1) 8,480 1,333 (15.7) 6,483 1,096 (16.9)
Kedah 4,033 359 (8.9) 6,629 726 (11.0) N/A N/A 5,920 902 (15.2)
Kelantan 7,461 482 (6.5) 6,951 572 (8.2) 4,603 579 (12.6) 9,805 1,565 (16.0)
Melaka 2,231 156 (7.0) 5,946 514 (8.6) 8,942 1,142 (12.8) 14,728 3,006 (20.4)
N.Sembilan 17,211 2,359 (13.7) 13,916 1,985 (14.3) 15,197 2,993 (19.7) 32,402 9,050 (27.9)
Pahang 5,766 708 (12.3) 6,220 855 (13.8) 5,786 1,003 (17.3) 16,844 3,369 (20.0)
Perak 5,044 448 (8.9) 6,154 658 (10.7) 5,716 878 (15.4) 7,342 1,221 (16.6)
Perlis 760 74 (9.7) 761 134 (17.6) 754 116 (15.4) 1,168 194 (16.6)
Pulau Pinang 3,293 388 (11.8) 3,632 446 (12.3) 3,850 513 (13.3) 3,690 641 (17.4)
Sabah 987 18 (1.8) 3,045 162 (5.3) 2,042 238 (11.7) 3,014 448 (14.9)
Sarawak 4,447 576 (13.0) 3,989 441 (11.1) 2,283 390 (17.1) 3,116 482 (15.5)
Selangor 6,691 822 (12.3) 6,776 1,047 (15.5) 6,188 1,493 (24.1) 6,038 1,461 (24.2)
Terengganu 2,182 124 (5.7) 3,846 388 (10.1) 3,590 600 (16.7) 4,014 892 (22.2)
WP Kuala Lumpur 13,670 2,097 (15.3) 2,948 476 (16.2) 3,577 833 (23.3) 8,716 2,071 (23.8)
WP Labuan N/A N/A 314 2 (0.6) 78 0 101 0
WP Putrajaya 167 26 (15.6) 496 105 (21.2) 558 163 (29.2) 631 151 (23.9)
Malaysia 80,134 9,348 (11.7) 77,188 9,075 (11.8) 71,672 12,275 (17.1) 124,023 26,553 (21.4)
23The use of other concomitant drugs is shown in Table 11 below. In 2012, ACE inhibitors were the most
commonly used anti-hypertensives (49.0%) followed by calcium channel blockers (38.0%) and beta
blockers (24.2%). Acetyl salicylic acid was the most commonly used anti-platelet (27.1%) and statins
were the most commonly used anti-lipids (62.3%).
Table 11. Use of concomitant drugs [Audit Dataset]
Drug 2009, n (%) 2010, n (%) 2011, n (%) 2012, n (%)
Patients audited 80,134 77,179 71,655 124,023
Anti-Hypertensives
ACE inhibitors 37,294 (46.5) 37,293 (48.3) 34,238 (47.8) 60,743 (49.0)
Angiotensin receptor
2,138 (2.7) 2,752 (3.6) 2,837 (4.0) 5,165 (4.2)
blockers
Beta blockers 21,267 (26.5) 20,249 (26.2) 18,428 (25.7) 29,986 (24.2)
Calcium channel blockers 21,050 (26.3) 21,513 (27.9) 23,735 (33.1) 47,077 (38.0)
Diuretics 13,269 (16.6) 13,525 (17.5) 14,019 (19.6) 25,258 (20.4)
Alpha blockers 3,396 (4.2) 2,739 (3.6) 2,766 (3.9) 4,708 (3.8)
Central-acting agents 3,52 (0.4) 371 (0.5) 279 (0.4) 283 (0.2)
Others 568 (0.7) 269 (0.4) 367 (0.5) 801 (0.7)
Anti-Platelets
Acetyl salicylic acid 23,543 (29.38) 24,446 (31.7) 20,813 (29.1) 33,665 (27.1)
Ticlopidine 862 (1.08) 850 (1.1) 838 (1.2) 1,628 (1.3)
Others 281 (0.35) 194 (0.3) 307 (0.4) 672 (0.5)
Anti-Lipids
Statins 37,128 (46.3) 39,476 (51.2) 42,153 (58.8) 77,239 (62.3)
Fibrates 3,254 (4.1) 2,689 (3.3) 2,332 (3.3) 4,787 (3.9)
Others 203 (0.3) 141 (0.2) 182 (0.3) 146 (0.1)
24Discussion
There are several key features that we wish to highlight in this first report. We discuss findings from
the NDR data, and additionally, some comparisons are made against results of the NHMS since it also
contains information about Malaysians with diabetes. Differences between the NDR and the NHMS
are to be expected, bearing in mind that the NHMS data is derived from a large population-based
survey whereas the NDR collects the data of patients with diabetes who are on follow up in KKs. We
also note that the comparisons between the two datasets are based on trends and patterns and
intended to provide a broad understanding of the differences. Statistical testing of differences was not
performed.
Demographic features
Patient registration at KKs
Based on NHMS 2011 results, it was estimated that approximately 698,500 patients with diabetes are
on follow-up at MOH KKs1. Therefore, although this registry is relatively new, it is reassuring that most
of the KKs have already registered most of their patients with diabetes who are on active follow-up at
their respective clinics.
Age at diagnosis
Although anecdotally many medical doctors are reporting that they are diagnosing diabetes more
frequently in younger Malaysians, the fact remains that many more older adult Malaysians are being
diagnosed. Again, with reference to NHMS results, Figure 5 below demonstrates a gradual shift of the
curve upwards over time, indicating that the increasing prevalence of diabetes is occurring amongst all
age groups, however, more so in the older age groups. This is consistent with our results from the NDR
showing the mean age of diagnosis as being 53 years old.
1
Estimated number of diagnosed individuals with diabetes: 1,247,366 x 56% (proportion attending
MOH KKs)
2540 36.2 36.6
35 31.6
30.3
30 26.7 26.1
24.4 24.5
Prevalence (%)
25 22.8
20.6 20.8
17.6 18.2
20 16.1
15.0 15.3 NHMS II (1996)
13.1
15 10.9
10.3 10.7 NHMS III (2006)
9.4 9.8
10 6.4 6.4 NHMS 2011
4.9 5.3
4.9
5 2.1 3.1 2.9
4.1
2.0
2.0
0
Age groups
Figure 5: Prevalence of Diabetes ≥18 years, by age groups (1996, 2006 and 2011)
Age influence on follow up attendance in KKs
From the age distribution of known diabetics in the NHMS and those registered in the NDR, as shown
in Figure 6, it appears that older patients tend to seek treatment within the KK system and are
registered in the NDR. This is possibly explained by the fact that younger patients would be more
inclined to seek treatment elsewhere (e.g. in private clinics) due to convenience to their location, time
constraints and ability to pay for service fees.
20
17.8 18.4
18
16.0 16.7
16
14.9 14.6
14
13.2
Percentage (%)
12 11.1 10.7
10.2
10 10.0 NDR (Audit 2011)
8.2
8 8.2 7.3
6.6
NHMS (2011)-
6
4.3 Known diabetes
4 3.0 3.9
0.9
2 0.9 1.8
0.8
0 0.0 0.1 0.3
Age groups
Figure 6: Age distribution of patients with known diabetes (2011)
26Gender influence on follow up attendance in KKs
Another interesting observation to note from NHMS 2011 is that the distribution by sex among the
patients with known diabetes was not statistically different, for males 7.0% (95%CI: 6.3-7.8) versus
females 7.5% (95%CI: 6.9-8.1)2. However, from the NDR, there is a preponderance of women
registered in KKs, with women making 58.4% of registered patients. Unfortunately, corroborative
information from the NHMS is unavailable since the NHMS 2011 report doesn’t provide the detailed
information on sex distribution by “usual place of treatment”. Thus, we are unable to provide further
explanation for this difference. We can only speculate that men may be less likely to seek
conventional treatment, or only seek treatment when severe complications arise.3
Ethnicity and diabetes
In terms of distribution by ethnicity (Table 2), at 15.3% Indian patients are over-represented in the
registry compared to overall national demographics. This was expected since patients of Indian
ethnicity tend to have a higher risk of developing diabetes as compared to patients of Malay or
Chinese descent.
Complications and co-morbidities
The accuracy of data on diabetes-related complications in the NDR still needs further work. In
particular, the prevalence of diabetic foot ulcer is unexpectedly low in the dataset. Considering that
this is a microvascular complication, it should at least match or exceed the prevalence of retinopathy
and nephropathy. This could be explained by the high proportion of patients with “unknown”
complications status in Table 4, i.e. the rates of unknown complications in 2012 were 12.3% for
nephropathy, 15.2% for retinopathy, 12.8% for IHD, 12.5% for cerebrovascular disease, 11.1% for
diabetic foot ulcer and 11.0% for amputation.
Since the methodology of the Diabetes Clinical Audit is heavily dependent on the quality of
documentation of the patients’ case notes, more emphasis should be placed on continually improving
documentation by all healthcare providers providing care to patients with diabetes, regardless of level
of care. This may also explain the lower than anticipated 4.9% prevalence of smoking among patients
registered in the NDR (Table 4).
Clinical investigations
It was reassuring to see that the coverage of HbA1c testing has slowly improved over the years. For
2012, about 78.0% of patients with T2DM had a HbA1c test at least once annually, compared to 67.9%
in 2009 (Table 5); however, there were variations between states (data not shown in this report).
In addition to HbA1c testing, the Malaysian CPG for the Management of T2DM (2009) has clearly laid
out the various clinical examination and investigations that needs to be carried out routinely to
monitor the status of control and early detection of complications, including the frequency of testing.
Most of these tests only need to be performed annually. The NDR dataset showed some issues which
should be of concern because of the low coverage (Table 5). For example:
2
Institute for Public Health (IPH) 2011. National Health and Morbidity Survey 2011 (NHMS 2011). Vol. II: Non-
Communicable Diseases.
3
Tong SF, Low WY, Ismail SB, Trevena L, Willcock S. Malaysian primary care doctors' views on men's health: an
unresolved jigsaw puzzle. BMC Fam Pract. 2011 May 12;12:29. doi: 10.1186/1471-2296-12-2
27(i) Proteinuria can easily be screened using a urine dipstick, a cheap item, and available even
in the remotest KKs; however, in 2012, only 64.7% of patients were tested at least once
annually.
(ii) Foot examination, as defined in the NDR, is a visual inspection of the feet, which can easily
be done at least once a year by the healthcare provider. In 2012, only 73.0% of patients
had their foot examined at least once annually.
(iii) Fundus examination can be done by using a funduscope and not necessarily by using a
fundus camera. All medical officers should have the necessary skills to use a funduscope
as a basic clinical skill and with most of KKs now staffed with permanent medical officers,
we should expect the rates of fundus examination to be higher than 44% in 2012.
However, there is an increasing trend as compared to 36.5% in 2009.
Treatment to Target
HbA1c target achievement
In terms of glycaemic control, based on the Malaysian CPG on T2DM (2009) HbA1c target of less than
6.5%, 23.8% of patients with T2DM achieved good control4, as compared to 19.4% in 2009 (Table 6). In
addition, the mean HbA1c value, although still high, has been improving from 8.3% in 2009, to 8.1% in
2012 (Table 7). However, we should take note that the analysis of target achievement excludes
patients who did not undergo HbA1c testing, or have no HbA1c results documented in their case notes.
If we were to assume that patients who were not tested are more likely among those with poor
glycaemic control, then the percentage achieving glycaemic target would be much lower.
There was much variation between states over the years in terms of HbA1c achievement (Table 7);
however this has to be interpreted with care since the coverage of HbA1c testing also greatly differs
between states (data not shown in this report). Since the allocation of resources to each individual
state is in proportion to its disease burden, further study would be required to explain why such
discrepancies are occurring. Despite this caveat, the dataset is still useful for each individual state to
monitor the changing trends of HbA1c achievements over time.
Cardiovascular target achievement
Compared to glycaemic control, BP control fared much better, with 40.9% of patients with T2DM
achieving BP of 130/80 or fewer in 2012, with a mean systolic BP of 135.5 mmHg and diastolic BP of
78.4 mmHg (Table 8). Total cholesterol control, however was poorer, with only 28.5% of patients with
T2DM achievingTreatment
Guidelines and treatment patterns
It is heartening to observe that insulin use has increased quite substantially between year 2010 to
2011, and increased further in 2012, in line with the recommendations of the Malaysian CPG on T2DM
(4th edition) which was published in late 2009. Following the publication of this CPG, the CPG Task
Force had undertaken extensive train-the-trainer sessions throughout the country in a concerted
effort to disseminate the information as widely as possible, in a systematic manner. This was also
aided by the publication of a Training Manual, complete with its set of presentation slides, to ensure
consistency of the training content. In addition, a “Practical Guide to Insulin Therapy in Type 2
Diabetes Mellitus” (PGIT) was published in 2010, developed by a group of endocrinologists, and again,
nation-wide training sessions followed suit.
Insulinisation
The 3rd Edition of the CPG on Management of T2DM recommended that insulin should only be
considered in patients with poor glycaemic control after lifestyle modifications and maximum oral
glucose-lowering therapy. In the 4th Edition of the CPG, the recommendation was changed and
healthcare providers are now advised to start insulin early, especially for patients who have poor
glycaemic control at diagnosis.
In terms of distribution of insulin use by states, although there is much variation between states, there
is an overall increasing trend in all states (Table 10). Further and more detail studies would need to be
conducted to explain these variations, and to determine the exact factor(s) contributing to the low
insulin usage in several states, which could be due to patient barriers, healthcare provider barriers,
health system barriers or other factors.
Diet management
It is also interesting to note that 5.9% of T2DM patients in 2012 appear to be on diet control only, an
increase compared to 2009 and 2010 (Table 9). This is contradictory to the recommendation of the
current CPG, which recommends early initiation of OADs, together with insulin where applicable.
Again, further studies need to be conducted to ascertain the factors contributing to this situation.
Oral medications
In 2012, 27.0% of patients were on monotherapy. Changes over time reflected a decreasing trend on
this point (Table 9). Metformin and sulphonylureas are the obvious OADs of choice as they are the
most easily available drugs in the KKs. The anti-hypertensive drug of choice in patients with T2DM was
ACE-I, which continues to be recommended in the current CPG. ARBs are used less as these drugs can
only be prescribed by Family Medicine Specialists or physicians in the hospitals.
Limitations
As with any registry, there are certain limitations that can be seen with regards to this dataset. It must
be noted that the registry is based on data collection in KKs and further reliant on records that are
kept by the doctor or medical assistant who sees the patients. To the extent that the documentation
in medical records is weak, there would be a related weakness in the registry dataset as well. The
dataset tends not to contain information about hospital admissions which occur elsewhere in the
MOH healthcare system. Hospital admissions and diagnoses related to in-patient treatment would
tend to be missing unless the information is recorded in the patients’ notes at the KKs.
29One of the possible improvements needed for the NDR is a data query mechanism that would support
good data collection processes and help to ensure accurate data entry. Furthermore, it would be
advantageous to have in place a process to conduct source data verification that would ensure the
data entered in the registry reflects that which is captured in the medical records.
Characteristics of a good registry have been described as (i) being able to support the condition of
interest and track desired outcomes, (ii) an application that fits with technical and financial
constraints, (iii) ensures up-to-date, complete and accurate patient information and (iv) integrates its
use into the workflow of the setting.5,6 It would seem that the registry is able to do well on several of
the items mentioned above, with some improvements needed on point number (iii). On this point,
improvement in medical record practices would be needed to ensure that corresponding
improvements can be made in the NDR. Furthermore, the suggested data query mechanism would
assist in this process. Data quality standards and errors within the system can also be improved. These
are limitations that are not insurmountable, and would be further explored and can be improved,
resource permitting.
5
Metzger J. Using Computerized Registries in Chronic Disease Care, 2004.
6
Arts DG et al. Defining and Improving Data Quality in Medical Registries: A Literature Review, Case Study, and
Generic Framework, J Am Med Inform Assoc.2002;9:600–611.
30Conclusions
Despite some limitations in the dataset, the NDR dataset is a useful tool for tracking the status of
patients with diabetes being managed at MOH KKs. Furthermore, in order to limit the burden of data
collection, the NDR has leveraged upon exisiting data collection requirements within the KK setting
(Diabetes Clinical Audit and The National Diabetes Quality Assurance Programme). This approach
along with limited sampling required, a web-based data entry system and automated random
sampling has enabled useful data collection and tracking with relatively minimal effort.
The registry has been able to show that in the last four years there has been some progress made in
terms of treatment target achievement and insulinisation among MOH patients with T2DM. There
remain questions that may not be possible to be answered with the present NDR data. It is hoped that
with the publication of this information, further exploration into these questions can be pursued.
31Bibliography
Arts DG, De Keizer NF, Scheffer GJ. Defining and Improving Data Quality in Medical Registries: A
Literature Review, Case Study, and Generic Framework, J Am Med Inform Assoc.2002;9:600–611.
Institute for Public Health (IPH) 2006. The Third National Health and Morbidity Survey 2006 (NHMS III).
Diabetes.
Institute for Public Health (IPH) 2011. National Health and Morbidity Survey 2011 (NHMS 2011). Vol. II:
Non- Communicable Diseases.
Metzger, J. Using Computerized Registries in Chronic Disease Care, 2004.
Ministry of Health Malaysia. User Manual Quality of diabetes care at MOH healthcare facilities:
Glycaemic control, 2008.
Ministry of Health. 2009. Clinical Practice Guidelines: Management of Type 2 Diabetes Mellitus (4th
Edition).
Tong SF, Low WY, Ismail SB, Trevena L, Willcock S. Malaysian primary care doctors' views on men's
health: an unresolved jigsaw puzzle. BMC Fam Pract. 2011 May 12;12:29. doi: 10.1186/1471-2296-
12-2.
3233
Appendix 1: Participating KKs

No.   Facility                            No.   Facility
                  Johor                                    Johor (cont.)
Batu Pahat                                Kota Tinggi
  1 Klinik Kesihatan Ayer Hitam            36 Klinik Kesihatan Air Tawar 2
  2 Klinik Kesihatan Bagan                 37 Klinik Kesihatan Bandar Mas
  3 Klinik Kesihatan Batu Pahat            38 Klinik Kesihatan Bandar Penawar
  4 Klinik Kesihatan Parit Raja            39 Klinik Kesihatan Bandar Tenggara
  5 Klinik Kesihatan Parit Sri Merlong     40 Klinik Kesihatan Bukit Besar
  6 Klinik Kesihatan Parit Sulong          41 Klinik Kesihatan Bukit Waha
  7 Klinik Kesihatan Parit Yaani           42 Klinik Kesihatan Kuala Sedili Besar
  8 Klinik Kesihatan Rengit                43 Klinik Kesihatan Lok Heng
  9 Klinik Kesihatan Semerah               44 Klinik Kesihatan Pengerang
 10 Klinik Kesihatan Senggarang            45 Klinik Kesihatan Sening
 11 Klinik Kesihatan Sri Gading            46 Klinik Kesihatan Sungai Rengit
 12 Klinik Kesihatan Sri Medan             47 Klinik Kesihatan Tanjong Sedili
 13 Klinik Kesihatan Tongkang Pecah       Kulaijaya
 14 Klinik Kesihatan Yong Peng             48 Klinik Kesihatan Kulai
Johor Bahru                                49 Klinik Kesihatan Kulai Besar
 15 Klinik Kesihatan Gelang Patah         Ledang
 16 Klinik Kesihatan Kampung Majidee       50 Klinik Kesihatan Bukit Gambir
 17 Klinik Kesihatan Kempas                51 Klinik Kesihatan Bukit Serampang
 18 Klinik Kesihatan Larkin                52 Klinik Kesihatan Gersik
 19 Klinik Kesihatan Mahmoodiah            53 Klinik Kesihatan Paya Mas
 20 Klinik Kesihatan Masai                 54 Klinik Kesihatan Sagil
 21 Klinik Kesihatan Pasir Gudang          55 Klinik Kesihatan Sungai Mati
 22 Klinik Kesihatan Sultan Ismail        Mersing
      Klinik Kesihatan Taman Ungku Tun     56 Klinik Kesihatan Endau
 23 Aminah                                 57 Klinik Kesihatan Jemaluang
 24 Klinik Kesihatan Taman Universiti      58 Klinik Kesihatan Tenggaroh II (Felda)
 25 Klinik Kesihatan Tampoi                59 Klinik Kesihatan Tenglu
 26 Klinik Kesihatan Tebrau               Muar
 27 Klinik Kesihatan Ulu Tiram             60 Klinik Kesihatan Bakri
Kluang                                     61 Klinik Kesihatan Bandar Maharani
 28 Klinik Kesihatan Felda Kahang Timur    62 Klinik Kesihatan Batu 15 Air Hitam
 29 Klinik Kesihatan Kahang Batu 22        63 Klinik Kesihatan Bukit Pasir
 30 Klinik Kesihatan Layang-Layang              Klinik Kesihatan Kampung Kenangan
 31 Klinik Kesihatan Mengkibol             64 Tun Dr.Ismail
 32 Klinik Kesihatan Paloh                 65 Klinik Kesihatan Lenga
 33 Klinik Kesihatan Renggam               66 Klinik Kesihatan Pagoh
 34 Klinik Kesihatan Simpang Renggam       67 Klinik Kesihatan Parit Bakar
 35 Klinik Kesihatan Ulu Belitong          68 Klinik Kesihatan Parit Jawa

                                                                                      34
You can also read


