Classification of Inter-Urban Highway Drivers' Resting Behavior for Advanced Driver-Assistance System Technologies using Vehicle Trajectory Data ...
←
→
Page content transcription
If your browser does not render page correctly, please read the page content below
sustainability

Article
Classification of Inter-Urban Highway Drivers’
Resting Behavior for Advanced Driver-Assistance
System Technologies using Vehicle Trajectory Data
from Car Navigation Systems
Jaeheon Choi 1 , Kyuil Lee 1 , Hyunmyung Kim 1 , Sunghi An 2 and Daisik Nam 2, *
 1    Department of Transportation Engineering, Myong Ji University, Gyeonggi-do 17058, Korea;
      jaeheon7219@mju.ac.kr (J.C.); kyuillee1324@mju.ac.kr (K.L.); hyunmyung@mju.ac.kr (H.K.)
 2    Institute of Transportation Studies, University of California, Irvine, CA 92697, USA; sunghia@uci.edu
 *    Correspondence: daisikn@uci.edu

 Received: 1 June 2020; Accepted: 21 July 2020; Published: 23 July 2020

 Abstract: Fatigue-related crashes, which are mainly caused by drowsy or distracted driving, account
 for a significant portion of fatal accidents on highways. Smart vehicle technologies can address this issue
 of road safety to improve the sustainability of transportation systems. Advanced driver-assistance
 system (ADAS) can aid drowsy drivers by recommending and guiding them to rest locations.
 Past research shows a significant correlation between driving distance and driver fatigue, which has
 been actively studied in the analysis of resting behavior. Previous research efforts have mainly relied
 on survey methods at specific locations, such as rest areas or toll booths. However, such traditional
 methods, like field surveys, are expensive and often produce biased results, based on sample location
 and time. This research develops methods to better estimate travel resting behavior by utilizing a
 large-scale dataset obtained from car navigation systems, which contain 591,103 vehicle trajectories
 collected over a period of four months in 2014. We propose an algorithm to statistically categorize
 drivers according to driving distances and their number of rests. The main algorithm combines
 a statistical hypothesis test and a random sampling method based on the renowned Monte-Carlo
 simulation technique. We were able to verify that cumulative travel distance shares a significant
 relationship with one’s resting decisions. Furthermore, this research identifies the resting behavior
 pattern of drivers based upon their travel distances. Our methodology can be used by sustainable
 traffic safety operators to their driver guiding strategies criterion using their own data. Not only
 will our methodology be able to aid sustainable traffic safety operators in constructing their driver
 guidance strategies criterion using their own data, but it could also be implemented in actual car
 navigation systems as a mid-term solution. We expect that ADAS combined with the proposed
 algorithm will contribute to improving traffic safety and to assisting the sustainability of road systems.

 Keywords: sustainable traffic safety; advanced driver-assistance system (ADAS); driver behavior;
 rest areas on inter-urban highways

1. Introduction
     Fatigue-related crashes, which are mainly caused by drowsy or distracted driving, account for a
significant portion of fatal accidents on highways [1]. Increased fatigue during driving is a consequence
of repetitive and monotonous tasks, which result in a deterioration of driving performance [2].
Prolonged driving time without sufficient rest induces fatigue, which is a critical factor in careless
driving. To reduce fatigue-related traffic accidents, it is crucial for drivers to get sufficient rest
and avoid long periods of continuous driving. Highway associations such as Korea Expressway

Sustainability 2020, 12, 5936; doi:10.3390/su12155936                         www.mdpi.com/journal/sustainability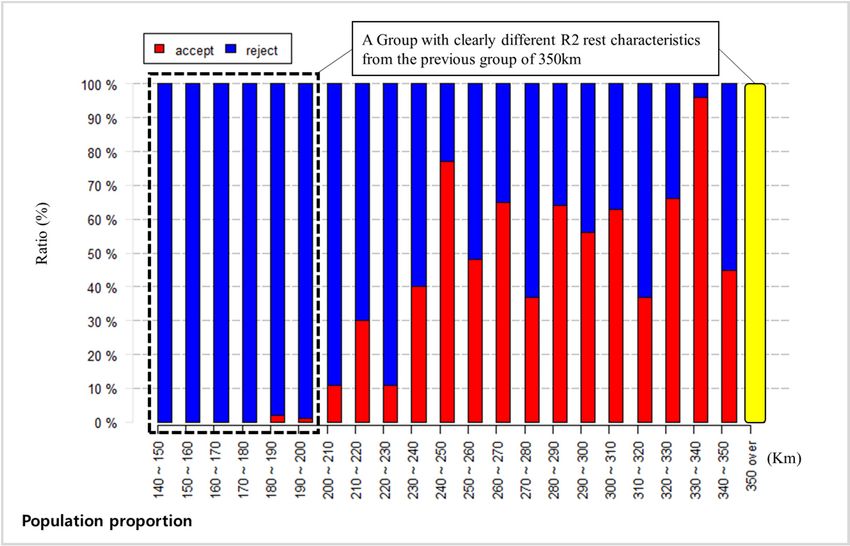
Sustainability 2020, 12, 5936                                                                        2 of 18

Corporation manage rest areas on the interurban highways by following the highway design guidelines.
The standard distance between two rest areas in Korea is 15 km, and the maximum recommended
distance is 25 km [3].
      Lapses in driving tasks are highly associated with traffic accidents [4–8]. The authors of [4]
identify behavioral factors that affect road safety by employing Analytic Hierarchy Process techniques.
Their results indicate that lapses and error are the most significant factors. One’s driving time on roads
stretched across a monotonous landscape also has an effect on driving performance, which causes
drowsiness and errors in maneuvering [2]. The authors of [9] measure drivers’ blink duration on the
wheel in a driving simulator and found that the blink duration of a drowsy driver is substantially
affected by time-on-task. Those drivers have a higher risk of lane departure. The authors of [10] add
performance impairment in driving by driving distance.
      Highway operators and safety managers are interested in guidance systems that can encourage
potentially drowsy drivers to stop at the nearest rest area. Variable message signs (VMSs) on the
roadside have little influence on compliance. Noting the location of a message sign increases the driver’s
attitudes about VMSs [11]. Previous studies report that over 2 hours of driving without rest induces
a driver to be close to falling asleep [12]. This fact supports the need for effective countermeasures
to discourage drivers from driving for extended periods of time by guiding them to take a rest in a
designated rest area. VMSs can be more effective if their design integrates the knowledge of drivers’
fatigue or resting behavior. However, the fixed location of VMSs limits the incorporation of details
regarding the driving distances of each driver.

Motivation and Contribution of the Study
      We were motivated by recent vehicle technologies such as informatics from car navigation and
driver-assistance systems (ADAS) to improve sustainable traffic safety by appropriately alerting drivers
to take a break. A short-term feasible countermeasure can be a recommendation alert through a car
navigation system when a driver is likely to feel sleepy. Another solution can be to enforce regulatory
policies on drivers, specifically commercial truck drivers, to not drive more than certain driving
distances or hours. The Hours of Services Regulation enacted by the USA Federal Motor Carrier Safety
Administration is an example [13].
      Possible mid- and long- term solutions can include the use of ADAS. This technology benefits
drivers through vehicle control features, such as lane-keeping assistance, adaptive cruise control,
and data collection [14]. This research focuses on data collection and an adaptive alert system.
We envision an ADAS equipped vehicle that collects information about drivers’ behavior and
surrounding road conditions and using that information to issue an appropriate warning message to
drivers to rest. We expect that drivers would comply at higher rates knowing that the message was
customized for them by their car, as opposed to the usual scenario where safety message signs are
displayed on highways for every driver to see.
      For these solutions, understanding the proper distance criteria for guiding drivers to stop driving
is of critical importance, but the criteria’s reliability depends on the method of data collection. The most
common method is a field survey. Traditional survey methods have been widely conducted to
gather information about drivers’ behavior. However, surveys are dependent on limited budgets
and locations, which implies that the accumulated data is not comprehensive, both qualitatively and
quantitatively. Therefore, if one requires an abundant number of samples to establish relevant policies,
conducting a field survey naturally entails exorbitant costs. Therefore, the survey cannot be conducted
continuously over time and space, which cannot meet the expectations of sustainable transportation
data management and policy on highway safety. Also, a field survey cannot be free from bias for other
reasons. For instance, it will only generate responses from those who use rest areas at certain times.
      This study aims to analyze resting behavior based on highway drivers’ travel distance data
collected from a large-scale real navigation dataset, and to provide a rest criterion for drivers based on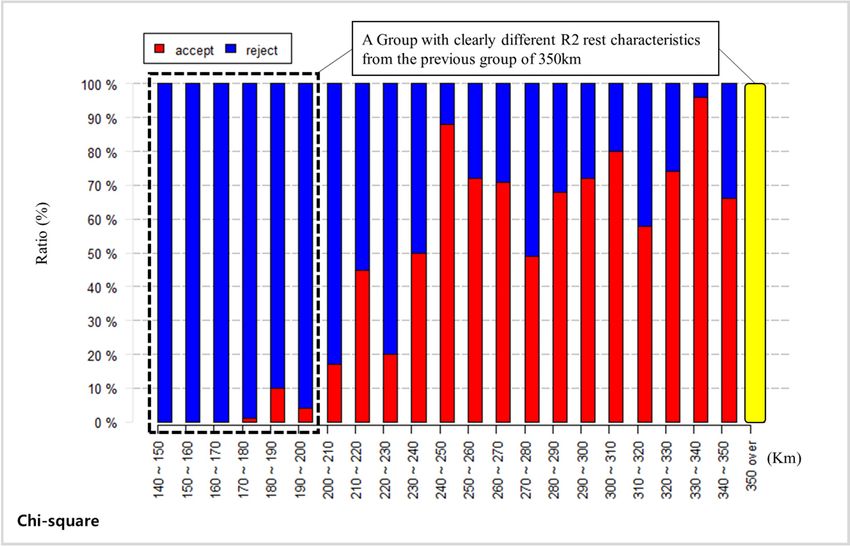
Sustainability 2020, 12, 5936                                                                         3 of 18

their travel distance using the Monte-Carlo simulation method. The criterion we suggest could be
utilized as a guideline for policymakers and/or highway operators.
      If actual datasets are available, the overall analysis and conclusion of drivers’ resting behavior
will be less biased and more reliable. Additionally, if datasets can be obtained on a regular basis,
transportation policies can be sustainably updated to consider future drivers’ behavior affected by
new mobility technologies. Using a large-scale dataset from car navigation systems, which are less
biased samples than datasets obtained from spot-based field surveys, this study analyzes drivers’
resting behavior. Results from statistical analyses confirm that drivers on turnpikes in Korea tend to
have a correlation between travel distances and the number of rests, which motivates the authors to
categorize groups of drivers based on these two variables. Previous research and details about the
methodologies will be addressed in the rest of the paper. The rest of the paper is structured as follows:
In Section 2, we review relevant research in this area; in Section 3, we describe the characteristics
of datasets acquired from car navigation systems and the methodology to cluster highway driver
behaviors; in Section 4, we present the clustering results, including a discussion about said results.
Finally, Section 5 concludes this study.

2. Literature Review
     Rest stations in highways are pivotal facilities for drivers because these stations provide a place
to reduce driver fatigue and offer various services. The Federal-Aid Highway Act of 1956, which
led to the creation of a national interstate system in the United States, declared the purpose of a rest
area as being for safety and convenience [15]. A 1958 policy by the American Association of State
Highway Officials [16] initiated the half-hour rule of thumb (i.e., that drivers can access a place to break
every 30 min driving) and set detailed design regulations for rest areas. This 30-min rule has been
an unofficial standard considered during highway construction from the following year. Besides the
Federal rules, some states have since issued their own guidelines. In 2007, the Minnesota Department
of Transportation [17] suggested a distance of 30 m between rest areas as an appropriate standard.
     The enhancement of service quality based on an understanding of driving behavior is essential.
Various survey methods have been proposed in the literature. The most common method is a personal
interview survey [4–6,8,18–23]. The second approach is to utilize a driving simulator [2,10,24,25].
In addition, a retrospective case-control study based on actual traffic accident data is conducted [20,26].
Last but not least, recent researchers employ the actual driving dataset [7].
     Regardless of the type of survey applied, research indicates that prolonged driving time is a major
factor in traffic accidents. In other words, long travel distances and driving times distract drivers
excessively and increase fatigue levels. The authors of [19,20] imply that the usages of a rest area highly
correlated to not only the use of restrooms, but also to stretch/take a break from driving. Research [20]
identifies that driver-at-fault crashes related to sleepiness strongly correlate to instances where rest
havens/truck stops are located over 20 m apart. Research [24] also finds that overextended driving
time in a driving simulator decreases the driver’s maneuver performance. Considering experiments
with driving simulators, Ref. [27] reveal that drivers tend to increase their safety margins when their
fatigue has accumulated over long period trips. Focusing on the speed drop at a sag section on an
expressway utilizing probe cars, Ref. [28] divides driver fatigue level into three stages: (1) Stage
1 being in a healthy or normal state; (2) Stage 2 being in a transitional state between normal and
fatigued; (3) Stage 3 being in-fully fatigued state. In their study, the researchers discovered that drivers’
fatigue status transitioned from one stage to the next approximately every 80 min. From the results of
simulator-based experiments, Ref. [29] concludes that long-period driving is a vital factor in driving
fatigue and might cause fatigue-related accidents. They also suggest that 80 min is the safe driving
limit for the driver on the highway without resting. The authors of [18] indicate that rest areas within
20 m from each other contribute to the decline of fatigue-related accidents.
     The large body of literature regarding drivers’ fatigue shows driving time and distance are
significantly correlated to driver-fatigue, which causes traffic accidents on highways; previous research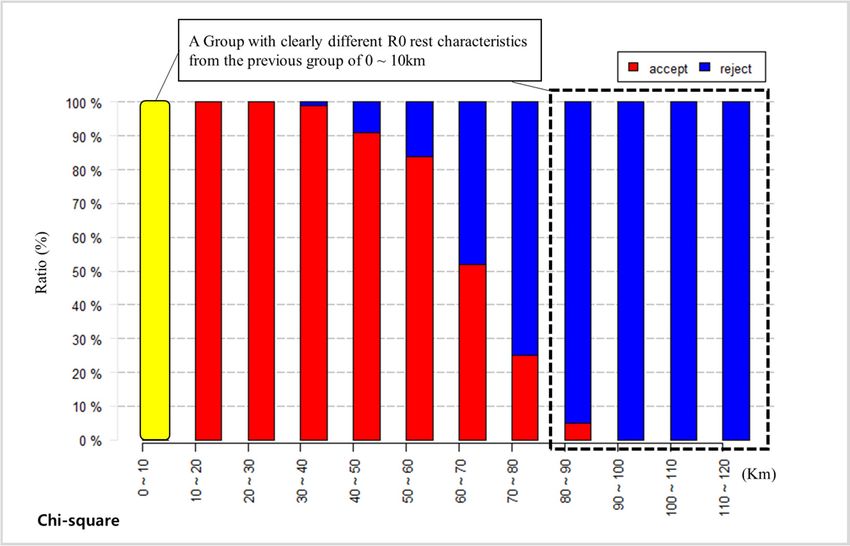
Sustainability 2020, 12, 5936 4 of 18
relies on survey methods to compile information about drivers’ resting behavior or their satisfaction
levels on the distribution of rest areas on highways. As previously discussed, survey methods for
highway drivers are not desirable in that the survey is restricted to only places where the survey
is conducted. A simulation-based approach is preferable when tackling geographical limitations.
However, a driving simulator approach is expensive, and results will fluctuate depending on the
participants involved, due to the issue of participant bias. For instance, Ref. [2] states that the dominant
group in such experiments tends to be young and more aggressive, which skews the collected data.
Another example is [25], where the samples predominantly consisted of male drivers. Therefore, it is
necessary to analyze highway drivers’ rest behavior based on real vehicle trajectory data and build an
analysis methodology accordingly. In the next section, we describe a new method to demonstrate the
relationship between highway drivers’ resting behavior by their usual travel distance by harnessing
data from car navigation systems.
3. Methodologies
3.1. Car Navigation Database for this Study
This research utilizes the car navigation database (CNDB) of the entire Korea region that comes from
the Korea Transportation DB (KTDB) center at the Korea Transportation Institute (KOTI). CNDB had
collected data from August 2013 to December 2015 for research purposes from Car Navigation
Systems (CNS) under a memorandum of understanding with MN-soft, which is a child company of
Hyundai Motors.
By limiting the target analysis period to March, April, October, and November in 2014, this research
minimizes the consequences of seasonal variances and traditional Korean holidays such as Lunar New
Year (February) and Chuseok (September). In the same manner, the data for Tuesday, Wednesday, and
Thursday are used to eliminate weekly inconsistencies of Monday and Friday. The dataset contains
vehicles’ trajectory and their identification numbers.
One of the main advantages of data from CNS is that it provides aggregate-level data of a link-level
trajectory and link accessing/egressing time, which reduces the data size compared to the total data set
from Global Positioning Systems. Being able to match link IDs to link type and their geometry enables
us to analyze specific travel behaviors of drivers accurately. Due to the existence of data security
measures and privacy requirements, vehicle type information cannot be obtained. The size of the total
dataset is 279 GB, and it contains 14,614,137 vehicle trips. For the purpose of analyzing the behavior of
turnpike drivers, we filtered drivers to only include those who traveled on highways with limited road
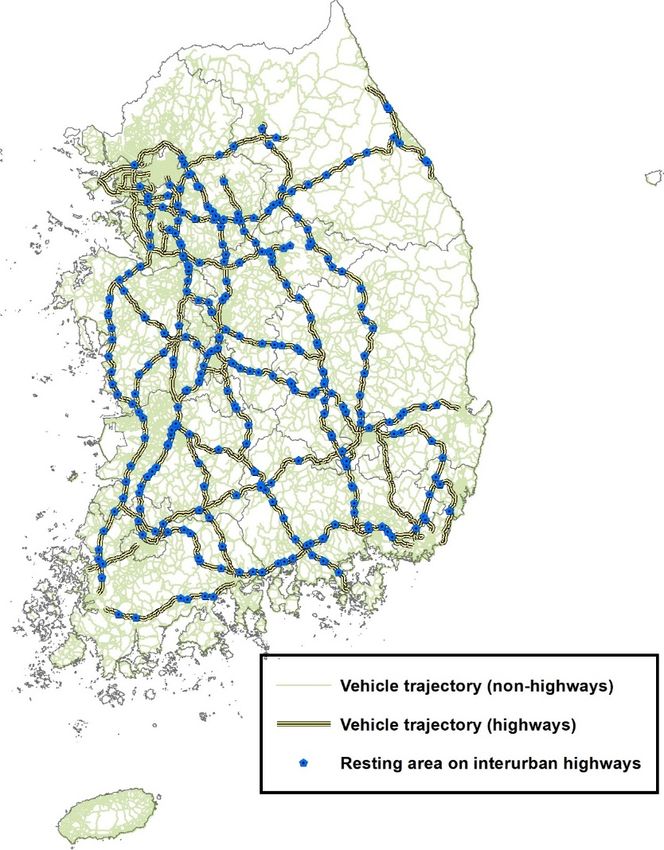
geometry. As a result, total vehicle trajectories were reduced to 591,103. Figure 1 indicates the paths of
all vehicles using highways. These paths not only contain highway links, but also surface streets as
drivers’ stress depends on total travel distances accumulated from their origin.
We make the following assumptions to capture drivers’ rest behavior. Since vehicle trajectory
data do not provide specific information on where/when drivers take a break, this research firstly
defines the scope of rest areas to the spots that the highway operation company officially designates
and operates. There are two types of rest areas: (1) On-route service centers that are a place to purchase
refreshments, refuel gas, and use restrooms, and (2) a rest stop where a driver pulls over to take a
short nap. We could identify rest areas from digital map data and link information on the trajectory.
Each link has an associated link type information, which is used to check whether it is an entrance or
exit link of a rest area. Once a vehicle passed an entrance link and took a break for a certain duration,
we regarded the driver rests upon a rest area. We also set the time duration as 5 min, meaning that
only some drivers were regarded to be at rest when the vehicle had stopped for over 5 min on the link
with the rest area attribute.
Sustainability 2020, 12, 5936 5 of 18
Sustainability 2020, 12, x FOR PEER REVIEW 5 of 20
Figure 1. Highway vehicle trajectory and resting areas on inter-urban
inter-urban highways
highways in
in Korea.
Korea.
3.2. Travel Distance and the Number of Rests in Highway Driving
We make the following assumptions to capture drivers’ rest behavior. Since vehicle trajectory
data Based
do noton provide
the CNS specific
data, information
it is possibleon to where/when
analyze drivers’ drivers
rest take a break,
behavior this research
in relation to theirfirstly
trip
defines the
distance. scope
Before of rest areas
analyzing restingto the spots that
behavior, the highway
we first generate theoperation company
trip distance officiallyfor
distribution designates
analysis.
anddemonstrated
As operates. There are two
in Figure 2, types
whichofis rest areas: (1) On-route
the cumulative curve ofservice centers that
travel distances are CNS
by the a placedata,to
purchase
the medium refreshments,
travel distance refuel gas,km.
is 34.94 andItsuse10restrooms, and (2) aare
and 90 percentiles rest stopkm
14.85 where a driver
and 85.36 km,pulls over to
respectively.
take astatistics
These short nap. implyWe that
couldmostidentify rest areas
trips coming from from
CNS digital
on themap data and
highway werelink information
inter-urban trips.on the
trajectory. Each link
To identify has an
patterns of associated link type information,
rest stop frequencies according towhich is usedtraveled,
the distance to check whether
we analyze it isthe
an
entrance
rest ratio or
of exit link by
drivers of aeach
restdriving
area. Once a vehicle
distance range.passed an preliminary
In our entrance linkanalysis,
and tookwe a break
dividefor thea
certain duration,
driving distance into we 50regarded
km-distancethe driver reststoupon
intervals a rest area.find
experimentally Wethealsorest
setratio.
the time
Tableduration
1 showsas the5
min, meaning
comparison thatnumber
of the only some drivers
of rests andwere regarded
the travel to beatatevery
distance rest 50-km
when the vehicle
interval had The
range. stopped
generalfor
over 5 min
pattern on thethat
indicates linkthe
with the rest
number of area
restsattribute.
is proportional to a driving distance. For short distances of
less than 50 km, only 0.08% of drivers take a rest. The average resting rate of drivers in the 150–200 km
3.2. Travel
travel Distance
distance intervaland is
the43.01%—approximately
Number of Rests in Highway 85% Driving
of drivers who drive more than 350 km stop at
least Based
once aton rest
theareas.
CNS data, it is possible to analyze drivers’ rest behavior in relation to their trip
From Table 1,
distance. Before analyzingwe could also inferbehavior,
resting that a large weproportion
first generateof drivers makedistance
the trip trips lessdistribution
than 50 km for on
highways. About 70% (413,552) of those trips are within 50 km. These
analysis. As demonstrated in Figure 2, which is the cumulative curve of travel distances by the CNStrips are unlikely to require a
period
data, theof rest.
mediumOnlytravel
0.8% distance
of driversisstopped
34.94 km. byIts
rest10areas,
and 90 whereas only aare
percentiles small
14.85portion
km andof trajectory
85.36 km,
data are captured in the CNS data. The travel range from 300
respectively. These statistics imply that most trips coming from CNS on the highway were to 350 km trips has only 688 inter-
trips,
which represent
urban trips. 0.1% of the total, but 77.62% of them stopped by rest areas. In this regard, the number
of long-distance trips was excessively low compared to the number of short-distance trips. Even though
there is a difference between the sample proportions in terms of each trip distance interval, CNS data
Sustainability 2020, 12, 5936                                                                                     6 of 18

are enough to impute drivers’ resting behavior depending on their trip distance because there are
distinct resting behaviors in relation to each trip distance interval. In addition, the least number of
samples that were collected at an ‘above 350-km’ travel distance interval is 286. The statistics discussed
here indicate
Sustainability    that
               2020, 12, drivers’ resting
                         x FOR PEER REVIEWbehavior is related to driving distance.                   6 of 20

              Figure 2.
              Figure    The cumulative
                     2. The cumulative curve
                                       curve of
                                             of travel
                                                travel distance
                                                       distance generated
                                                                generated by
                                                                          by the
                                                                             the car
                                                                                 car navigation
                                                                                     navigation data.
                                                                                                data.
                           Table 1. The comparison of the number of rest and travel distance.
      To identify patterns of rest stop frequencies according to the distance traveled, we analyze the
                                                                   Travel Distance (km)
rest ratioRest
            of drivers
               Behavior by each driving distance range. In our preliminary analysis, we divide the driving
                                     0–50     50–100     100–150   150–200     200–250     250–300   300–350    350 over
distance into 50 km-distance intervals to experimentally find the rest ratio. Table 1 shows the
             Zero rest             410,195    128,594     21,637     4207         773        271       154          49
comparison      of the number of3247
           One-time rest
                                      rests and8954
                                                 the travel  distance2563
                                                           5476
                                                                       at every826 50-km interval
                                                                                             413
                                                                                                    range.
                                                                                                       322
                                                                                                             The general
                                                                                                                   139
pattern indicates       that the number
           Two-times rest             80 of rests
                                                709 is proportional
                                                           781        to a driving
                                                                      576         423 distance.
                                                                                             237 For short
                                                                                                       189 distances
                                                                                                                   132 of
          Three-times rest             0         14         22        36           30         16       23          15
less Total
     thannumbers
            50 km,of only    0.08% 413,522
                       samples
                                    of drivers138,271
                                                 take a rest.  The average
                                                          27,916     7382
                                                                              resting
                                                                                 2052
                                                                                        rate 937
                                                                                             of drivers688in the 150–200
                                                                                                                   335
km travel    distance
     Rest numbers         interval is3327
                    of samples         43.01%—approximately
                                                9677       6279    85%
                                                                     3175 of drivers
                                                                                 1279 who 666 drive more
                                                                                                       534 than 350286 km
      Average resting rate (%)      0.80%      7.00%     22.49%     43.01%      62.33%     71.08%    77.62%      85.37%
stop at least once at rest areas.

      For more detailed  Tableinvestigations,    weofconduct
                                 1. The comparison            a random
                                                      the number  of rest andsampling      analysis to calculate the
                                                                                travel distance.
proportion of the number of rests associated with driving distances. Here, we further discretize the
                                                             Travel Distance (km)
driving distance      into 10 km intervals to examine detailed behavior, and then we apply a random
             Rest Behavior
                                      0–50  50–100 100–150 150–200 200–250 250–300 300–350 350 over
sampling method, which is useful not only to explain a characteristic feature of a large-scale population
               Zero rest            410,195 128,594   21,637   4207         773        271       154       49
data, but also to balance the number of sample data, which would be selected from the data at each
             One-time rest            3247    8954     5476    2563         826        413       322      139
interval. Note that only 88 individual trips were collected in the 340–350 km interval, as shown in
             Two-times rest            80     709       781     576         423        237       189      132
Figure 3. In this research, by considering this number as the minimum base criterion, we select 80
            Three-times rest            0      14        22      36          30         16        23       15
sample trips in a range and averaged those samples. We reiterate this process ten times. By averaging
       Total numbers of samples 413,522 138,271       27,916   7382        2052        937       688      335
the 10-averaged data at each range, we could also reduce the impact of outliers.
       Rest numbers of samples        3327    9677     6279    3175        1279        666       534      286
      Very few drivers took a rest within a 30-km drive. However, the proportion of drivers who
        Average resting rate (%)     0.80%   7.00%    22.49%  43.01%      62.33%     71.08%    77.62%   85.37%
rested at least once increased as the travel distances rose accordingly. In the travel distance interval of
50–60 km, 3.5% of drivers took a rest once, while at the travel distance of 80–90 km, 10% of drivers took
     From Table 1, we could also infer that a large proportion of drivers make trips less than 50 km
a rest at least once. The longer the travel distance, the more people took rests once or more. As a matter
on highways. About 70% (413,552) of those trips are within 50 km. These trips are unlikely to require
of fact, when drivers’ trip distance was over 180 km, about half of drivers chose to rest at least once.
a period of rest. Only 0.8% of drivers stopped by rest areas, whereas only a small portion of trajectory
      In Figure 3, drivers’ resting behavior is distinctly different according to their travel distance.
data are captured in the CNS data. The travel range from 300 to 350 km trips has only 688 trips, which
Drivers who drive less than 100 km rarely take rests twice. However, the proportion of drivers who
represent 0.1% of the total, but 77.62% of them stopped by rest areas. In this regard, the number of
take rests twice increases when drivers travel more than 200 km. For instance, about 16.7% of drivers
long-distance trips was excessively low compared to the number of short-distance trips. Even though
stop at rest areas two times. From these patterns, we classify drivers’ resting behavior into two groups:
there is a difference between the sample proportions in terms of each trip distance interval, CNS data
(a) First group drivers—who may or may not take any rests; (b) second group—drivers who may
are enough to impute drivers’ resting behavior depending on their trip distance because there are
distinct resting behaviors in relation to each trip distance interval. In addition, the least number of
samples that were collected at an ‘above 350-km’ travel distance interval is 286. The statistics
discussed here indicate that drivers’ resting behavior is related to driving distance.
     For more detailed investigations, we conduct a random sampling analysis to calculate the
Sustainability 2020, 12, x FOR PEER REVIEW                                                                             7 of 20

 sampling method, which is useful not only to explain a characteristic feature of a large-scale
 population
Sustainability   data,
               2020,      but also to balance the number of sample data, which would be selected from
                     12, 5936                                                                             7 of the
                                                                                                                18
 data at each interval. Note that only 88 individual trips were collected in the 340–350 km interval, as
 shown in Figure 3. In this research, by considering this number as the minimum base criterion, we
or may80
 select   not   take rests
              sample     tripstwice. Fromand
                               in a range  one’s  resting those
                                               averaged    behavior patterns,
                                                                 samples.     we couldthis
                                                                          We reiterate identify that
                                                                                           process   the
                                                                                                   ten   rate of
                                                                                                       times.   By
drivers   who    take   rests  is proportional to their trip distance.
 averaging the 10-averaged data at each range, we could also reduce the impact of outliers.

                     Figure 3. The relationship between the number of rest and travel distance.
                      Figure 3. The relationship between the number of rest and travel distance.
3.3. A Clustering Approach for Highway Drivers’ Behavior Analysis
        Very few drivers took a rest within a 30-km drive. However, the proportion of drivers who
      Figure 4 shows an overview of the proposed method for clustering resting behavior. The preceding
  rested at least once increased as the travel distances rose accordingly. In the travel distance interval
section expands the possibility of categorizing drivers’ resting behaviors according to travel distances.
  of 50–60 km, 3.5% of drivers took a rest once, while at the travel distance of 80–90 km, 10% of drivers
From an operational point of view, we divide drivers into three categories based on their distance
  took a rest at least once. The longer the travel distance, the more people took rests once or more. As
traveled: (1) Short distance (R0); (2) mid-range distance (R1); and (3) long-distance (R3). As analyzed
  a matter of fact, when drivers’ trip distance was over 180 km, about half of drivers chose to rest at
in the previous section, there are distinctive rest patterns according to the travel distance. Having an
  least once.
appropriate criterion can help policymakers or highway operators when they design guidelines for
        In Figure 3, drivers’ resting behavior is distinctly different according to their travel distance.
specific drivers to take a rest. For instance, a driver traveling a long distance and taking fewer rests
  Drivers who drive less than 100 km rarely take rests twice. However, the proportion of drivers who
than drivers in his driving group is more likely to be drowsy. Therefore, if a highway operator can
  take rests twice increases when drivers travel more than 200 km. For instance, about 16.7% of drivers
recognize drivers who are traveling longer distances, they will be able to guide drivers to the nearest
  stop at rest areas two times. From these patterns, we classify drivers’ resting behavior into two
rest area.
  groups: (a) First group drivers—who may or may not take any rests; (b) second group—drivers who
      However, setting a clustering criterion without a sound mathematical basis is bound to be
  may or may not take rests twice. From one’s resting behavior patterns, we could identify that the rate
subjective, which is why we propose a statistical clustering approach. Once we identify the base
  of drivers who take rests is proportional to their trip distance.
groups, we start to categorize from a statistical comparison between a base group and an experimental
group. Here, the experimental group is a subsequent group that is the next base group based on
  3.3.A Clustering Approach for Highway Drivers’ Behavior Analysis
distance traveled. If a rest pattern of the experimental group is significantly different, we categorize it
as theFigure     4 shows
         other group.     Thisan   overview
                                 process  can beofregarded
                                                     the proposed      method for clustering
                                                               as semi-supervised                  resting
                                                                                       learning since        behavior. The
                                                                                                        the categorization
ispreceding
    computedsection        expandsa labeled
                 by comparing         the possibility
                                                base groupof categorizing     drivers’
                                                               and an unlabeled          resting behaviors
                                                                                     experimental    group. according to
  travel
      In distances.
          this regard,  From
                           this an operational
                                research           point of
                                            categorizes      view, we
                                                           highway       divideby
                                                                       drivers   drivers
                                                                                    travelinto  three and
                                                                                            distance   categories    based of
                                                                                                            the number       on
  their distance    traveled:   (1) Short   distance   (R0); (2) mid-range    distance   (R1); and  (3)
rests, utilizing data from CNS. Intuitively, the descriptive statistics confirm that the pattern of the long-distance     (R3).
  As analyzed
number            in the
           of breaks    forprevious   section,
                            the shortest        there
                                           travel       are distinctive
                                                   distance              rest patterns
                                                              group (within    10 km) isaccording    to the
                                                                                          significantly     travelfrom
                                                                                                         different   distance.
                                                                                                                           the
  Having    an  appropriate       criterion   can   help  policymakers      or  highway     operators   when
pattern of longest distance trips (over 350 km). This distinctive pattern difference inspires us to identify    they   design
  guidelines
whether    thefor
                restspecific
                      driver drivers
                               groups to    take atorest.
                                        belong            For instance,
                                                      a group             a driver
                                                                of the shortest    traveling
                                                                                 distance      a long distance
                                                                                            or longest   distance,and  taking
                                                                                                                     and  this
  fewer rests than
categorization           drivers inby
                    is conducted      hisa driving
                                           statisticalgroup   is more
                                                        test. The       likely totwo
                                                                    pre-defined    be drowsy.     Therefore,
                                                                                        base groups            if a statistics
                                                                                                      have their     highway
  operator
(mean    andcan    recognize
              variance),    whichdrivers  whotoare
                                    are used          traveling
                                                   decide        longer
                                                            the rest      distances,
                                                                     drivers’  group they    will The
                                                                                       identity.  be able  to guide
                                                                                                      statistical testdrivers
                                                                                                                        plays
  to the  nearest   rest  area.
a role in identifying their status, but if a driver could not be placed in any group, he/she is assigned to
the middle group. In other words, a trip group not belonging to the short or the long-distance group
belongs to the mid-distance group. The details about this test will be addressed in the next section.
Sustainability 2020, 12, 5936 8 of 18
Sustainability 2020, 12, x FOR PEER REVIEW 8 of 20
Descriptive statistic analysis from CNS data
Select two groups with specific drivers’ resting behavior pattern
R0 – base group
R2 – base group
Monte Carlo Simulation # 1 Monte Carlo Simulation # 2
(Population proportion test) (Chi-square test)
Forward stepping categorization Forward stepping categorization
Monte Monte
Carlo Carlo
Compare group( … ) Compare group( … )
Simulation Simulation
Sampling(N=80) Sampling(N=80)
Simulation-based Statistical Simulation-based Statistical
Base group( ) vs compare Base group( ) vs compare
group ( test1
… ) group (test1
… )
(two population proportions (two population proportions
test) test)
Backward stepping categorization Backward stepping categorization
Monte Monte
Carlo Carlo
Compare group ( … ) Compare group ( … )
Simulation Simulation
Sampling(N=80) Sampling (N=80)
Base group( ) vs compare Base group( ) vs compare
group ( … ) group ( … )
Similarity Test
R0, R2 population proportion test, chi-squared test Simulation
rejection ratio
Clustering resting behavior based on similarity of travel distance
Overviewofofthe
Figure4.4.Overview
Figure themethod
methodfor
forclustering
clusteringresting
restingbehavior.
behavior.
With the two
However, defined
setting base groups,
a clustering we derive
criterion without a ratio of themathematical
a sound number of driversbasis is who tookto
bound a rest
be
to the number
subjective, whichof drivers
is why at weeach travelagroup.
propose None
statistical of the drivers
clustering took aOnce
approach. rest in
wethe first base
identify thegroup
base
(i.e., the we
groups, shortest
start travel distance group).
to categorize from a For the second
statistical base group
comparison (i.e., the
between most extended
a base group and travel
an
distance group), 43.88% of drivers took a rest at least twice. With these results,
experimental group. Here, the experimental group is a subsequent group that is the next base group we are able to define
patterns
based on of highway
distance drivers.IfWe
traveled. claim
a rest that a feature
pattern of the short distance
of the experimental group travelers would different,
is significantly have a similar
we
drive behavior derived from the first base group (i.e., approximately
categorize it as the other group. This process can be regarded as semi-supervised learning zero percent of restsince
behaviorthe
based on drivers’
categorization travel distance),
is computed and b) aa labeled
by comparing feature of
basethegroup
long-distance travelers experimental
and an unlabeled would have agroup. similar
drive Inbehavior derived
this regard, from thecategorizes
this research second base group (i.e.,
highway roughly
drivers 43.88%
by travel of at least
distance and thetwo-times
numberrest of
behavior based on drivers’ travel distance). We simply categorize these independent
rests, utilizing data from CNS. Intuitively, the descriptive statistics confirm that the pattern of the resting-behaviors
in R0 and
number of R2, respectively.
breaks Otherwise,
for the shortest traveldrivers
distancewould
group fall into the
(within 10mid-distance group, different
km) is significantly and this group
from
of people would fall under the category, R1 (Table 2). For example, if a percentage
the pattern of longest distance trips (over 350 km). This distinctive pattern difference inspires us to of non-rest drivers
in the target
identify group
whether theisrest
similar
driverto the ratiobelong
groups of the first
to a base
group group,
of thethen this group
shortest distance willorbe categorized
longest distance,as a
short-distance
and traveler,isand
this categorization thereforeby
conducted belong to ‘R0 test.
a statistical category’.
The pre-defined two base groups have their
statistics (mean and variance), which are used to decide the rest drivers’ group identity. The statistical
test plays a role in identifying their status, but if a driver could not be placed in any group, he/she is
assigned to the middle group. In other words, a trip group not belonging to the short or the long-based on drivers’ travel distance). We simply categorize these independent resting-behaviors in R0
and R2, respectively. Otherwise, drivers would fall into the mid-distance group, and this group of
people would fall under the category, R1 (Table 2). For example, if a percentage of non-rest drivers
in the target group is similar to the ratio of the first base group, then this group will be categorized
Sustainability 2020, 12, 5936 9 of 18
as a short-distance traveler, and therefore belong to ‘R0 category’.
Table2.2. Resting
Table Resting behavior
behaviorcategory.
category.
Driving
Driving Behavior Group Description
Behavior Description
Group Drivers who have approximately a zero probability of
R0 taking a rest which is a similar proportion as the first
Drivers who have approximately a zerobaseprobability of taking
group drivers who doa rest which
not take is a similar
a rest
R0
proportion as the first base group
Drivers drivers
who have who do not atake
approximately a rest
43.88 percentage
Drivers who of probability of taking at least two rests which is
R2 R2have approximately a 43.88 percentage of probability of taking at least two rests
similar
which is similar to ‘two-times resting to ‘two-times
behavior’ resting
proportion behavior’
of the second proportion
base groupof drivers
the second base group drivers
R1 R1 Drivers who do not belong
Drivers who doto both R0 andtoR1
not belong groups
both R0 and R1 groups
Figure 5 visually illustrates the details of the proposed methodology. All trip distance groups
Figure 5 visually illustrates the details of the proposed methodology. All trip distance groups with
with the exception of the last group are defined by 10 km trip distances. This means that drivers in
the exception of the last group are defined by 10 km trip distances. This means that drivers in each
each interval have similar travel distances, but resting behaviors in each range are heterogeneous.
interval have similar travel distances, but resting behaviors in each range are heterogeneous. The second
The second to last interval, where trip distance is between 340 km and 350 km, has the lowest
to last interval, where trip distance is between 340 km and 350 km, has the lowest observation number
observation number at 88. We heuristically define the previous range that travels more than 350 km,
at 88. We heuristically define the previous range that travels more than 350 km, since the sample rate is
since the sample rate is insignificant, and its drivers tend to take a rest at least two times in their
insignificant, and its drivers tend to take a rest at least two times in their journey.
journey.
Figure 5. The clustering method in terms of the resting behavior.
Figure 5. The clustering method in terms of the resting behavior.
3.4. A Statistical Approach for Resting Behavior Analysis
Basically, we applied a semi-supervised analytical categorization method, which categorizes the
sample data by comparing the target group to a pre-defined comparison group. Once the target group
violates a null hypothesis that the target group is statistically identical with the pre-defined group,
the model generates the target group. Otherwise, the target group belongs to the pre-defined group.
The null hypothesis of our study is that there is no difference in proportion between the two
groups. The alternative hypothesis is that there are significant proportional differences between the
two groups; thus, these tests are of a two-tailed test, as the null hypothesis would be rejected when the
test statistic does not fall into the range within the value of a significant level.
H0 : P1 − P2 = 0 (1)
H1 : P1 − P2 , 0 (2)Sustainability 2020, 12, 5936 10 of 18
Algorithm 1 displays the overall process. The bi-directional comparison method plays a vital
role in categorizing driving groups. In summary, the statistical comparisons are conducted from both
directions: (1) Short-distance group to long-distance group (Steps 1 and 2), and (2) long-distance group
to short-distance group (Steps 3 and 4). Finally, the path groups not allocated to the base groups are
regarded as a mid-distance group. The main advantage of statistical comparison is that it is consistent
and mathematically sound. However, a notable disadvantage is that it is likely to be unsuitable for
a large-scale dataset. The characteristic of a large sample size deters clustering performances since
statistical comparison tests tend to be stricter as the size of samples is larger. A significantly narrow
confidence interval from the large dataset results in a very low p-value that is most likely to reject the
hypothesis [30].
Algorithm 1. Classification Algorithm
01 Step 0. Initialization
02 Divide vehicle trips according to trip distance by 10 km
03 path_group = [P0, P1, . . . , , Pmax ]
04 nofgroups = len(path_group) # the number of path groups
05 Gshort = [P0]
06 Glong = [Pmax]
07 Gmid = [∅]
08 Step 1. Forward stepping categorization (Multiple Simulations approach)
09 base_group = P0 # the shortest travel path group (0–10 km driving)
10 compare_groups = [P1, . . . , , Pmax ]
11 N_S = Simulation-based Statistical test(base_group, compare_groups)
12 Step 2. Categorizing a short driving distance path group
13 for n ∈ N_s:
14 If n < Criteria: # number of accepted hypothesis in each path group (Gj) 350 km driving)
20 compare_groups = [Pmax-1 , . . . , , P0 ]
21 N_L = Simulation-based Statistical test (base_group, compare_groups)
22 Step 4. Define a long driving distance group
23 for n ∈ N_L:
24 If n < Criteria: # number of accepted hypothesis in each path group (Gj)Sustainability 2020, 12, 5936 11 of 18
the longest group. The path group sets that have not been assigned to one of two groups are allocated
to the mid-distance group in Step 5.
Algorithm 2. Simulation-based Statistical test
Input: base_group, compare_groups (k intervals)
significance level (alpha = 0.05), number of samples = 80
Output: Number of accepted for the hypothesis (N = [N0, N1, . . . , Nk]) of k intervals
00 Step A. Initialization
01 N = zeros(compare_groups) # for all Ni = 0, N will be used to decide the group is in
the group or not
02 Step B. Hypothetical tests with Multiple simulations
03 For i: I ∈ (0,100): # 100 trials
04 sample1 = Random Sampling(base_group, nofsamples)
05 for pj ∈ compare_groups:
06 sample2 = Random Sampling(pj, nofsamples)
07 Accepted = Hypothetical Test(sample1, sample2, alpha)
08 if Accepted:
09 N[pj] + = 1
10 End if
11 End for
12 End for
13 End
The presented algorithm requires a statistical test in Step 1 and 3. Step B in Algorithm 2 in
both steps applies both a two-sample z-test for the difference between proportions (Equation (1))
and a chi-square test (Equation (2)) as criteria to classify the samples. The chi-square test, one of the
nonparametric methods, is also used to compare two groups, to ascertain whether the proportion of
some characteristic is equal in several populations. Theoretically, chi-square statistics is equivalent to a
z-test’s. The chi-square test of proportions is derived from z-statistics. Note that the test value of the
chi-square test for one degree of freedom is equivalent to the z-test’s value squared. Details about the
two tests can be found in [31]. The main difference between the two statistic tests is the assumption of
distribution. Z-statistics is based upon the normal approximation of binomial distribution, which can
be used for a parametric study where the number of samples is large enough (over 30) and proportional
values approximate to 0.5. However, the chi-square test does not require these strict assumptions and
is based on the chi-square distribution.
(p̂1 − p̂2 ) − 0
Z= q (3)
p̂(1 − p̂) n11 + n12
(p̂1 − p̂2 )2
X2 = (4)
p̂(1 − p̂) n11 + 1
n2
sample proportion for sample 1:
x1
p̂1 = (5)
n1
sample proportion for sample 2:
x2
p̂2 = (6)
n2
combined proportion in both samples:
x1 + x2
p̂ = (7)
n1 + n2̂ = (6)
combined proportion in both samples:
Sustainability 2020, 12, 5936 + 12 of 18
̂= (7)
+
4. Results
4. Results
Highway Driver Classification Based on the Resting Behavior
Highway Driver Classification Based on the Resting Behavior
Figures 6 and 7 show the results of the z-test simulation in terms of R0. Each simulation is run 100
timesFigures 6 and 7The
for reliability. show
testthe results
results of the the
establish z-test simulation
point that it is in terms to
possible of classify
R0. Each simulation
groups whichishave
run
100 timesR0
different forresting
reliability. The test
behaviors results
from the establish
standard the point
group thatkm).
(0–10 it is possible
Notably,tothe
classify
groupsgroups which
that have a
have different R0 resting behaviors from the standard group (0–10 km). Notably, the
travel distance more than 70 km with the Population proportion method, and the groups that traveledgroups that have
a travel
more thandistance morethe
80 km with than 70 km with
Chi-squared the Population
method, proportion
show completely method,
different andthan
results the those
groups ofthat
the
traveled more
standard group. than 80 km with the Chi-squared method, show completely different results than those
of the standard group.
6. Population proportion test results
Figure 6. results (R0).
(R0).
From the overall z-test simulation results between the standard group and each sample group,
a criterion is established whereby if there are 90 rejects out of 100 tests, then the sample group has a
completely disparate effect compared to that of the standard group (Table 3). According to results
from different methodologies, despite there being a 10 km gap in clustering reference distances,
the proportion of acceptance and rejection for each result is not substantially changed. When the
clustering reference distance is more than 90 km for each R0 test, no acceptance result is shown.
Considering the arbitrary nature of the simulation method, it can be assumed that if the proportion of
rejection is more than 90% of total simulation tests, then it has the status of “completely different result.”
Figures 8 and 9 show the z-test simulation results in terms of R2 for the clustering reference distance.
In this case, the travel distance of the standard group for the z-test is above 350 km. The population
proportion method and chi-square method are applied, and as for the results, the R2 value of drivers
who drive less than 200 km produces an entirely different outcome to the R2 value of standard group
drivers with both methods (Table 4). The “completely different result” for R2 z-test has the same
meaning as the one for R0 z-test.Sustainability 2020, 12, 5936 13 of 18
Sustainability 2020, 12, x FOR PEER REVIEW 14 of 20
Figure 7.
Figure 7. Chi-squared test results (R0).
(R0).
Table 3. Population proportion test and chi-square test simulation results in terms of R0.
From the overall z-test simulation results between the standard group and each sample group,
a criterion is established whereby if there are 90
R0rejects
Test out of 100 tests, then the sample group has a
completely disparate effect compared to that of the standard group (Table 3). According to results
Population Proportion Chi-Square
Km
from different methodologies, despite there being a 10 km gap in clustering reference distances, the
Accept Reject Accept Reject
proportion of acceptance and rejection for each result is not substantially changed. When the
clustering reference0–10 0 than 90 km0 for each R00test, no acceptance
distance is more 0 result is shown.
010–20 100 0 100 0
Considering the arbitrary nature of the simulation method, it can be assumed that if the proportion
020–30 100 0 100 0
of rejection is more030–40
than 90% of total
100simulation tests,
0 then it has
99 the status of1 “completely different
result.” 040–50 93 7 91 9
050–60 64 36 84 16
060–70
Table 3. Population 30 test and chi-square
proportion 70 52
test simulation results 48
in terms of R0.
070–80 10 90 25 75
080–90 1 R099 Test 5 95
090–100 0 100
Population Proportion 0 100
Chi-Square
Km100–110 0 100 0 100
110–120 Accept
0 100 Reject 0 Accept 100 Reject
0–10120–130 00 100 0 0 0 100 0
010–20130–140 1000 100 0 0 100 100 0
020–30 100 0 100 0
030–40
It is evident in Figures 6 and 7100that the rejection ratio0 increases consistently
99 as the1 travel distance
increases. However,
040–50Figures 8 and93 9 support the point that 7 the rejection91 ratio decreases
9 as the travel
distance decrease and that there is 64
050–60 fluctuation while the36 rejection ratio is84
dropping. This
16 might occur
because the sample
060–70number of long-distance
30 trips is also70low, making it 52
difficult to extrapolate
48 these
results to the entire
070–80population. More
10 general observations90 can be made for
25 long-distance
75 trips once
more data become available.
080–90 1 99 5 95
From the090–100
clustering results in terms
0 of the sample proportion
100 and travel0 distance,100
highway drivers
could be divided into three groups (Table 5). Even though there are some differences due to the two
100–110 0 100 0 100
clustering methods, drivers who travel 0–70 km or 80 km are clustered as a short-distance trip group
110–120 0 100 0 100
based on their resting behavior, whereas drivers who travel more than 200 km are clustered as a
120–130 0 100 0 100
130–140 0 100 0 100Sustainability
Sustainability2020,
2020,12,
12,xxFOR
FORPEER
PEERREVIEW
REVIEW 15
15of
of20
20
Figures
Figures 88 and
and 99 show
show the the z-test
z-test simulation
simulation results
results in
in terms
terms ofof R2
R2 for
for the
the clustering
clustering reference
reference
Sustainability 2020, 12, 5936 14 of 18
distance.
distance. In
In this
this case,
case, the
the travel
travel distance
distance of
of the
the standard
standard group
group forfor the
the z-test
z-test isis above
above 350 350 km.
km. The
The
population
populationproportion
proportionmethod
methodand andchi-square
chi-squaremethod
methodare areapplied,
applied,andandasasfor
forthe
theresults,
results,the theR2
R2value
value
of
of drivers
drivers who
who
long-distance drive
drive
trip groupless
less
withthan
than 200
200 km
two-times produces
km rest
produces an
an entirely
behavior. entirely
A different
different outcome
middle-distance outcome
trip group to
toisthe
the R2
R2 value
defined value of
for theof
standard
standard
drivers group
group
who drivers
standdrivers
betweenwith
with both
the twomethods
both groups. (Table
methods (Table 4).
4). The
The “completely
“completely different
different result”
result” forfor R2
R2 z-test
z-test
has
has the
the same
same meaning
meaning as as the
the one
one for
for R0
R0 z-test.
z-test.
Figure
Figure 8.
Figure 8. Population
8. Population proportion
proportion test
proportion test results
test results (R2).
results (R2).
(R2).
Figure
Figure 9.
Figure 9. Chi-squared
9. Chi-squared test
Chi-squared test results
test results (R2).
results (R2).
(R2).Sustainability 2020, 12, 5936 15 of 18
Table 4. Population proportion test and chi-square test simulation results in terms of R2.
R2 Test
Population Proportion Chi-Square
Km
Accept Reject Accept Reject
140–150 0 100 0 100
150–160 0 100 0 100
160–170 0 100 0 100
170–180 0 100 1 99
180–190 2 98 10 90
190–200 1 99 4 96
200–210 11 89 17 83
210–220 30 70 45 55
220–230 11 89 20 80
230–240 40 60 50 50
240–250 77 23 88 12
250–260 48 52 72 28
260–270 65 35 71 29
270–280 37 63 49 51
280–290 64 36 68 32
290–300 56 44 72 28
300–310 63 37 80 20
310–320 37 63 58 42
320–330 66 34 74 26
330–340 96 4 96 4
340–350 45 55 66 34
350 over 0 0 0 0
Table 5. The clustering results in terms of travel distance.
Travel Distance(km)
Clustering Method
Short-Distance Group Middle-Distance Group Long-Distance Group
Population proportion method 0–70 70–200 200 ~
Chi-square method 0–80 80–200 200 ~
5. Discussion
As aforementioned, fatigue-related crashes, which are mainly caused by drowsy or distracted
driving, account for a significant portion of fatal accidents on highways. The most traditional way to
analyze drivers’ travel and rest behavior is by conducting surveys at rest areas on highways. The benefit
of such surveys is that interviewers can directly gather accurate travel information (i.e., trip purpose,
origin and destination, average travel time, travel experience, the number of resting before the current
rest area, etc.) from the survey respondents. However, collected survey data are mostly based on
respondents’ memory and approximation. Moreover, it is challenging to amass travel information
from people who are not taking the survey, which leads to researchers having to estimate or ignore
that information. This means that the survey sampling will be inevitably biased, not to mention that
survey results can also be affected by the design, sentence structure, and vocabulary of the survey
questionnaire. The budget for the survey is another limitation. Thus, this study used real sample data,
car navigation data, which are big enough and comfortable to collect, to analyze the resting behavior
of drivers according to their travel distance.
Many studies in the literature mentioned have revealed that the level of fatigue is related to
travel distance. Moreover, continuous driving (i.e., especially more than two hours traveling) without
rest can increase the probability of drowsy driving occurrences on highways. Putting this into
consideration, we hypothesize that resting behaviors vary by the number of rests and driving distances.
Then, this study applies the Monte-Carlo Simulation method to classify drivers based on statisticalSustainability 2020, 12, 5936 16 of 18
tests with respect to an average travel distance and the number of resting behavior and then indicates
a unique rest behavior of drivers in each group. Instead of the more traditional method of conducting
surveys at rest areas on highways, we incorporate CNS data to impute highway drivers’ travel patterns
and reduce sampling bias, which could happen with missing data. Our method identifies that drivers
are highly likely to take a rest after over 80 km (50 m) of driving. The average distance between rest
sites in Korea is 15 km [3]. ADAS can give a soft alert to a driver to stop at a rest site after 80 km driving
and increase the intensity of the recommendation by each rest site. A smart highway management
association can also devise a platform to increase highway safety and rest area usage for sustainable
transportation systems. A mobility platform attracts a driver who has prolonged driving by providing
store coupons in the nearest rest area through the ADAS system.
However, the limitation of using CNS data instead of survey data is that it is hard to define trip
purposes for each trip. Kim and Bae surveyed to analyze the purpose of stopping at a rest area on
highways in Korea [32]. In their study, 92.9% of survey respondents said that they visit rest areas to
use the highway restrooms, and 72.0% of them responded that they visited rest areas to purchase
food. Only 58.3% of respondents stopped at rest areas for a brief excursion. From these survey
results, we could assume that some people merely stopped at rest areas for a while without taking
appropriate rest. With CNS data, it is possible to estimate the purposes of rest area users from the
driver’s destination searching log. In addition, CNS data have the potential to include exogenous
variables such as gender, age, departure time for further analysis, but we did not have access to such
private information. In further research, this study will conduct a survey that targets CNS users and
combine them with CNS data to analyze highway drivers’ rest behavior in detail and provide a more
accurate resting criterion. The uncertainty of collected data also remains an issue, so our future research
may also be extended to include time-space dynamics of traffic conditions.
6. Conclusions
The effectiveness of sustainable traffic safety systems can be enhanced by the proper analysis
of driving behavior by providing decisionmakers with a drivers’ behavior criterion [4]. This study
utilizes data obtained from CNS to confirm that the highway drivers’ resting behavior is dependent
on the length of their travel distance. To efficiently utilize the large-scale data that contain 591,103
vehicle trajectories, we suggest new criteria to classify the driver traveled distance groups according to
the drivers’ rest behaviors on highways. We initially categorize two base groups, which represent a
short-distance travel behavior (R0) and long-distance travel behavior (R2), respectively. To identify
whether the rest drivers belong to base groups or not, we adopt a random sampling method based
on Monte-Carlo simulation for each target group and conduct z-test and chi-square test. As a result,
we find that people who drive less than 70–80 km share a similar rest pattern of short-distance travelers.
Also, drivers who travel more than 200 km have a similar rest pattern of long-distance travelers.
Therefore, we conclude that (a) the length for the short distance traveler group is a range between 0 km
to 70–80 km, and (b) the length for the long-distance traveler group is over 200 km.
We expect this proposed method to contribute to the construction of a proper resting strategy or
a drowsy-driving avoidance strategy, resulting in fewer traffic accidents related to drowsy-driving
or loss of concentration while driving. For instance, it is possible to build some wake-up facilities to
attract short-trip drivers’ attention and provide information to long-trip drivers to let them take a rest,
as necessary. Furthermore, the study can provide policy implications and a highway-safety investment
basis by verifying the behavioral patterns through the simulation-based approach.
This research applied a statistical method to identify the relationship between driver’s resting
behavior and categorical resting behavior patterns. To apply a statistical model to large-scale data,
the authors introduce the Monte-Carlo simulation approach. Future research will extend the statistic
approach to a nonparametric method such as Neural network, Random Forest classification tree,
and K-nearest clustering. The authors of [33] identify influential factors on traffic accidents by injury
severity using the Random Forest classification tree. Our data also include the categorical relationshipYou can also read


