ICHOR TEAM 15 - Jerome Fisher Program in Management ...
←
→
Page content transcription
If your browser does not render page correctly, please read the page content below

ICHOR                                     LUV IYER (EE, ‘20)
 TEAM 15                            LUVIYER@SEAS.UPENN.EDU

                                        AMIT GUPTA (BE, '20)
 TEAM EMAIL:                   AGUPTA98@WHARTON.UPENN.EDU
 ESESENIORDESIGN201920TEAM15
 @GMAIL.COM                        MAYANK MARDIA (CIS, ‘20)
                               MMARDIA@WHARTON.UPENN.EDU
 ESE451
 INTER-DEPARTMENTAL                DR. JAMES WEIMER (ADVISER)
 SENIOR DESIGN PROJECT (ISD)        WEIMERJ@SEAS.UPENN.EDU

29 APR 2020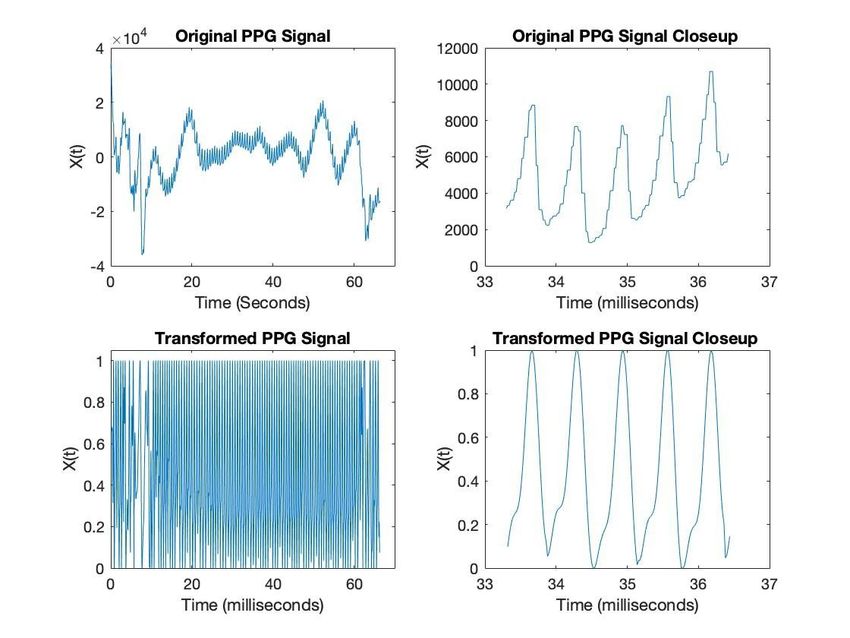
Table of Contents

I. Executive Summary                                               2

II. Overview of Project                                            3
       Business Analysis                                           3

III. Technical Description                                         5

IV. Self-learning                                                  8

V. Ethical and Professional Responsibilities                      10

VI. Meetings                                                      11

VII. Reflection on Fall Milestones and Proposed Spring Schedule   11

VIII. Teamwork                                                    12

IX. Budget                                                        13

X. Discussion and Conclusion                                      13

XI. Appendices                                                    15
       Appendix A: Figures                                        15
       Appendix B: Code Snippet                                   17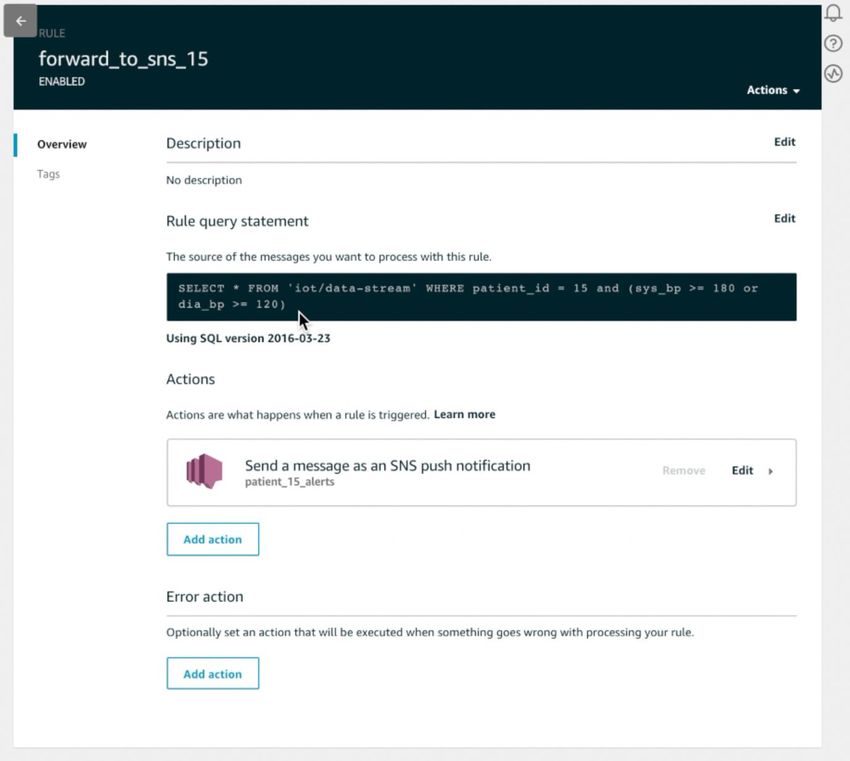
I. Executive Summary
Ichor is a software package designed to transform off-the-shelf wearable devices into
vital sign monitors. Current smartwatches such as the Samsung Galaxy Gear estimate heart
rate and blood oxygenation (SPO2) estimation, but lack the ability to provide accurate estimates
of patient blood pressure, which is Ichor’s key innovation. Furthermore, no other software
platform today allows care providers to monitor patient health in a clinically meaningful manner.
Currently there are two main use cases for Ichor: As a diagnostic tool for assessing
hypertension and a cardiovascular care management platform. There is a severe clinical failure
to integrate home-based blood pressure monitoring into cardiovascular disease diagnosis and
treatment which is why Ichor is extremely valuable as a replacement for ambulatory blood
pressure monitors (ABPs). Numerous studies have revealed significant rates of misdiagnosis of
hypertension due to static blood pressure measurements in stress-inducing clinical settings.
This increases overall quality of care and reduces system-wide costs. Furthermore, doctors lack
insight into how various medications affect a patient’s vitals like blood pressure and heart rate
throughout the course of a day, week, or month. Having this information can help enable
clinicians perform advanced chronic care management for at-risk patients saving payors and
providers hundreds of millions of dollars. In the long-run our goal is for Ichor to serve as a
non-invasive vital sign monitor at home as well as in skilled nursing facilities (SNFs),
rehabilitation centers and assisted living facilities.
Over the course of the year we accomplished several important tasks towards realizing
Ichor’s mission. First and foremost we were successful in wirelessly interfacing with the
Samsung Galaxy Gear watch to access raw light absorption/reflection data. We then processed
this data, cleaning and de-noising the signal. Afterwards, we successfully extracted
physiologically meaningful features out of the dataset such as pulse width duration. Separately,
we were able to train a basic machine learning model to predict blood pressures using a dataset
of PPG signals and basic patient characteristics and medical information. Lastly, we developed
a cloud platform for allowing doctors to access patient blood pressure data and message them
accordingly. This marks a large step towards bringing low-cost, unobtrusive vital sign monitoring
to patients at home and in the clinic.
II. Overview of Project
The goal of the project is to create an automated, non-invasive means of measuring
blood pressure. Blood pressure is an extremely important indicator of cardiovascular health and
today 75 million Americans, one in every three adults, has hypertension. Accurately diagnosing
hypertension is extremely important, but it is an error-prone process leading to estimates that
10-30% of people are misdiagnosed. This error is due to the fact that the standard for
measuring blood pressure requires using an inflatable cuff in a doctor’s office. This results in
one single measurement which is not indicative of overall health because blood pressure
fluctuates throughout the day. Furthermore, blood pressure can be affected by stress which is
why many patients do not adhere to physicians’ treatment plans thinking the measurements are
inflated. The current solution to this problem is prescribing the use of ambulatory blood pressure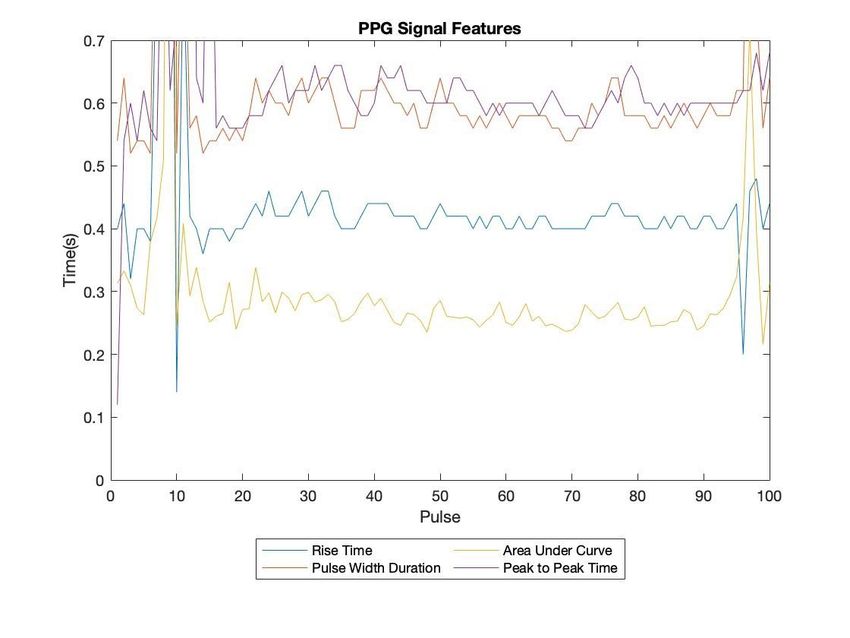
monitors which are motorized inflatable blood pressure cuffs. These monitors suffer from three
issues: 1. they are obstructive and require patients to wear an uncomfortable device, 2. they
continue to use inflatable cuffs alerting patients to when the measurement is being taken, and 3.
they provide a small number of data points with one measurement every several hours. Ichor
solves these problems by providing continuous blood pressure estimation throughout the day in
a completely non-obstructive, non-invasive manner in the form of a light-weight wearable.
Ichor’s use of existing smart watch technology makes it a highly scalable solution which can be
implemented worldwide without any complex supply chain. Ichor’s blood pressure estimation
can then be combined with existing heart rate and oxygen saturation data to provide physicians
a holistic view into patients’ cardiovascular health.
Business Analysis
Value Proposition
Ichor has a strong value proposition for patients, providers, and payors alike through
improving care outcomes for chronic heart conditions. According to the Centers for Disease
Control and Prevention (CDC), one out of every four deaths in the U.S. is a result of heart
disease, and overall heart disease costs the country $200 billion per year1. High blood pressure
is a key risk factor for coronary heart disease, and thus properly managing blood pressure can
significantly reduce total system-wide costs, and improve care outcomes. Furthermore, research
shows that there is significant misdiagnosis of hypertension with approximately 9% of patients
receiving false positive diagnoses, and thus receiving unnecessary care, while 19% of patients
receive false negative diagnoses and thus do not receive the care they need2.
Stakeholders
One stakeholder that can benefit financially from Ichor is payors, which includes
government plans like Medicare and Medicaid, as well as private commercial insurance plans
and self-funded employer-based health insurance. One quick way to save money is to stop
unnecessarily medicating patients who have white coat (false positive) hypertension. Given the
current cost of current prescription statins and related blood pressure medication, this could
save payors approximately $1000 per patient per year. In the aforementioned study on The
misdiagnosis of hypertension 9% of patients in their sample had white-coat hypertension while
37% had sustained hypertension. This means that of the patients who tested positive for
hypertension, approximately 20% had normal blood pressure. Given that 75 million Americans
have been diagnosed with hypertension, we can infer that up to 15 million of them are in fact
healthy, and thus payors could save $15 billion by accurately diagnosing this group. Even larger
savings can be found from treating patients who have masked hypertension. Comparing the
19% of patients with masked hypertension to the 46% with white-coat or sustained
1
Centers for Disease Control and Prevention, National Center for Health Statistics. Multiple Cause of Death
1999-2015 on CDC WONDER Online Database, released December 2016. Data are from the Multiple Cause of
Death Files, 1999-2015, as compiled from data provided by the 57 vital statistics jurisdictions through the Vital
Statistics Cooperative Program. Accessed at http://wonder.cdc.gov/mcd-icd10.html.
2
Ogedegbe G, Pickering TG, Clemow L, et al. The misdiagnosis of hypertension: the role of patient anxiety. Arch
Intern Med. 2008;168(22):2459–2465. doi:10.1001/archinte.168.22.2459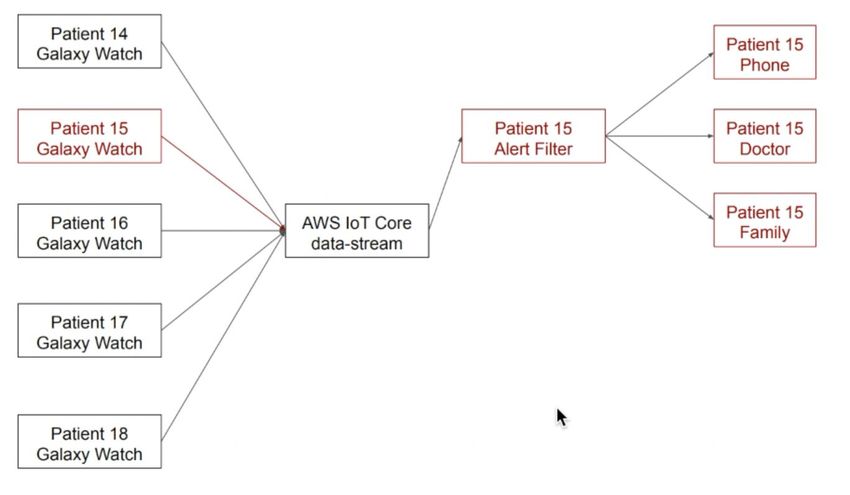
hypertension, we can infer that an additional 41% of people or approximately 31 million
Americans could be hypertensive, yet undiagnosed and untreated. Caring for these individuals
is extremely important because hypertension leads to higher inpatient and outpatient costs by
increasing the risk of heart attacks and other serious issues.
Besides payors, providers can also benefit from accurately diagnosing hypertension.
Health care payment models are rapidly shifting in the United States after the introduction of the
Affordable Care Act. Currently, 25% of all healthcare payments in the United States are tied to
quality or value with an additional 38% being made through alternative payment models3. These
models make providers accountable for patient outcomes, paying bonuses for properly
managing chronic conditions and some also put them at financial risk for adverse events like
hospitalizations. This trend, coupled with an increasing focus on primary care, is driving
providers to look for effective ways to manage chronic conditions. By providing physicians with
up to date information on key metrics of cardiac health like blood pressure and heart rate, we
can help them better serve their patient populations and improve their bottom lines.
Last, but not least, patients can benefit greatly from more accurate diagnoses of
hypertension. Medications are both expensive and can have negative side effects, so reducing
false positive diagnoses can improve patient quality of life and improve their finances. There is
significant interest in consumer health with smartwatches and fitness trackers. Examples include
FitBit which Alphabet is acquiring for $2.1 billion and Apple’s smartwatch line which includes
measurements for heart rate, oxygen saturation, and even an electrocardiogram (EKG) function.
This significant consumer interest can act as a “pull” in addition to the “push” from payors and
providers leading to increased adoption of Ichor and other digital health applications.
Market Size
Overall, there is a large potential market for Ichor. Today, the global wearable device
market is currently estimated to be worth $14.5 billion with a 4.2% CAGR and expected 2024
market size of $17.9 billion4. As of 2017, the ambulatory blood pressure market was $84 million,
and with a 6.7% CAGR is expected to reach $142 million by 20255. However, we believe there
is potential to significantly expand the market by capturing the value created from providing
more accurate diagnoses.
Market Trends and Revenue Generation
Already, there is a growing trend of employers and insurance companies subsidizing
smart watches and other fitness trackers in an effort to improve employee/patient health. For
3
LaPointe J. 36% of payments tied to alternative payment models in 2018. RevCycleIntelligence Web site.
https://revcycleintelligence.com/news/36-of-payments-tied-to-alternative-payment-models-in-2018. Updated 2019.
Accessed Dec 19, 2019.
4
Wearables - worldwide | statista market forecast. Statista Web site.
https://www.statista.com/outlook/319/100/wearables/worldwide. Accessed Dec 19, 2019.
5
Raghvendra OS. Ambulatory blood pressure monitoring (ABPM) devices market by product (arm and wrist ABPM
devices) and end user (hospitals, ambulatory surgical centers, and others): Global opportunity analysis and industry
forecast, 2018 - 2025 Allied Market Research. 2018.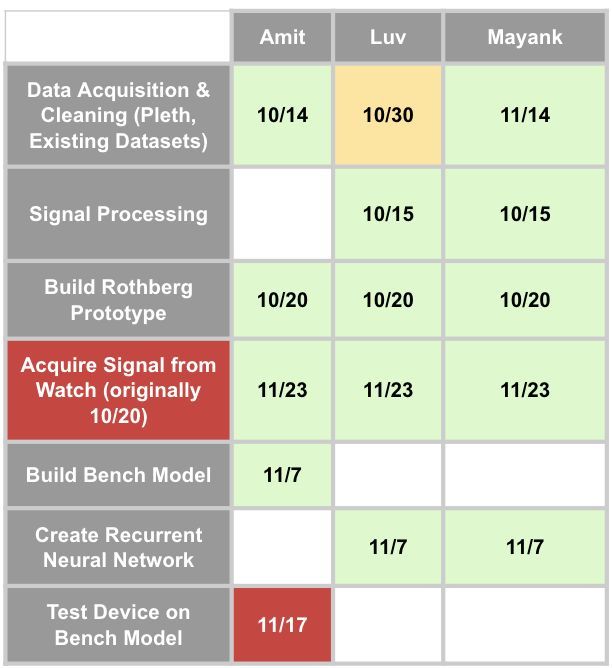
example, Apple has partnered with CVS on a new health tracking application being rolled out to
Aetna beneficiaries. We can bill employers, insurance companies, or accountable care
organizations a monthly fee for use of Ichor through a software as a service (SaaS) model to
generate a large annual recurring revenue. Currently, United Health is giving patients up to $4 a
day towards the cost of an Apple Watch for reaching activity milestones. Additionally, CMS pays
PCPs up to $50/month for physicians to coordinate with specialists as they care for patients with
chronic conditions. Given our ability to improve the effectiveness of this coordination, we believe
we can safely charge up to $10 per patient per month (ppm) for monitoring high-risk patients
with advanced cardiovascular disease. Currently the average Medicare reimbursement for,
“Ambulatory blood pressure monitoring...for 24 hours or longer; including recording, scanning
analysis, interpretation and report,” is $54.42 per use6. This means as a diagnostic tool, we can
bundle Ichor software with a specific hardware device and position it as a replacement for
ambulatory blood pressure monitoring and safely charge $50 per use.
Competitors
Currently there is only one FDA approved smart watch which can measure blood
pressure. This is the Omron HeartGuide. The watch currently retails at $499 in the United States
and measures blood pressure using an inflatable cuff embedded in the watch’s wristband.
Additionally, QardioArm sells an app that can take blood pressure readings along with a
wearable blood pressure monitor for $99. We believe Ichor possesses several advantages over
these competitors. First, we are looking to make Ichor software compatible with all major smart
watches. This will enable us to easily convert existing consumers with wearable devices and
expand our potential market. Secondly, by using optical detection methods we can significantly
increase comfort and ease of use because cuffs inherently make devices larger and bulkier.
Lastly, optical detection also makes blood pressure measurements passive, decreasing the risk
of false positives due to patient anxiety since the patient would not know when the blood
pressure measurement is being taken.
Costs
Since the purchase of smartwatch is ancillary to the actual “using” of Ichor, the main
costs that we need to take into account are for cloud computing infrastructure to carry out data
storage and processing. Amazon EC2 (on-demand pricing) is approximately $8 per month per
node. Since the data file sizes for individual patients would be in the kilobytes, we can easily
scale to thousands of patients, while still only having to pay for only a few nodes.
III. Technical Description
We set out to create a continuous, non-obtrusive wearable that monitors blood pressure. As
such, for any device we were to make, our constraints were that the device is no larger than an
average wristwatch, functions with minimal patient interaction, functions throughout the entire
day (long battery life - useful for continuous measurements), and securely stores/transmits data
6
Reimbursement for ambulatory blood pressure monitoring A&D Medical Web site.
https://medical.andonline.com/professional-resources/abpm-reimbursements. Accessed December 19, 2019.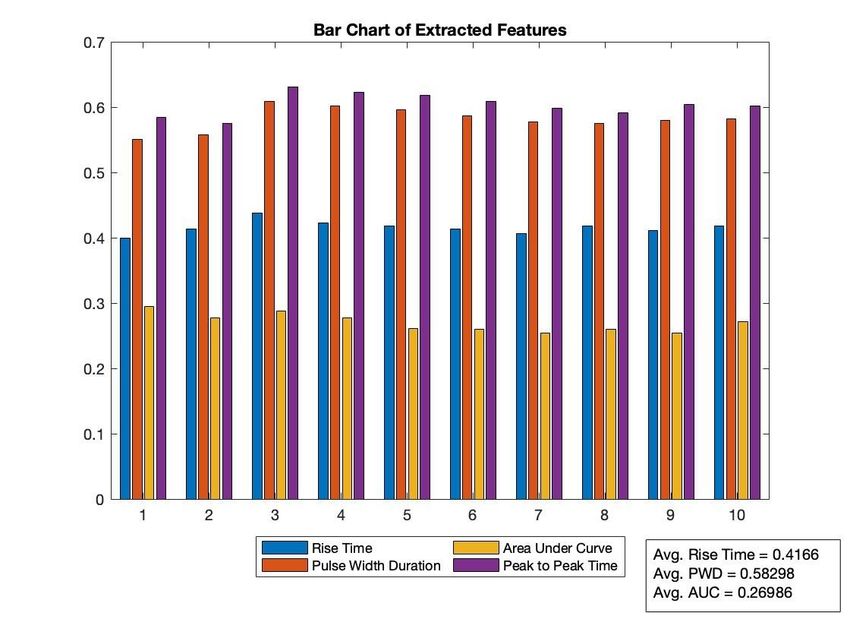
so as to comply with the HIPAA Data Privacy rule. Additionally, we also considered the FDA
regulation on non-invasive blood pressure measurement systems, which are categorized as
Class II Medical Devices, which mandates a certain level of accuracy - approximately ±5mm Hg.
With that in mind, our final design specifications for our project were

Final Design Desired Specifications
         ●   Blood Pressure prediction within 15 seconds
         ●   Compatibility with Tizen OS smartwatches
         ●   Battery life greater than 10 hours
         ●   Data collected at least once every 5 minutes
         ●   Send notification to patient/doctor if blood pressure deviates from long term
             baseline for several minutes

        Our final implementation does not achieve all these specifications. While there is
compatibility with Tizen OS smartwatches, data collection on the order of every 20ms, prediction
of blood pressure with 6 second samples of PPG waves, and a notification system, we were not
able to create a fully stand-alone system that would toggle data collection on/off every few
minutes to avoid draining battery. In our current implementation, we can collect data every
20ms, but at the cost of battery life being limited to 1.5-2 hours. An improvement would be to
collect data at 50Hz for 15 seconds every 5 minutes.

         We explored multiple methods to predict blood pressure from PPG waveforms. In our
initial approach in October 2019 at the Rothberg Catalyzer, we began building our own
wearable with an LED and photodiode that would collect PPG data. We moved away from
hardware to develop software as smartwatches like the Samsung Galaxy Watch Active had
better hardware than what we were attempting to use. Additionally, in the Fall semester, we also
tried approaching the prediction of blood pressure from PPG waveforms as a pure machine
learning problem, without doing signal processing to clean the PPG data. Our predictions with
feeding raw PPG into a Recurrent Neural Network did not capture variations in blood pressure.
It merely predicted a single value.

        We can now delve deeper into our approach, as seen in Figure 4 in Appendix A. Our
approach to measuring a patient’s blood pressure consists of three main parts: acquiring a PPG
signal, processing the signal to extract features, and inputting those features into a machine
learning model to predict blood pressure.

Signal Acquisition
       A PPG signal is acquired at the wrist using the LEDs and phototransistors of a Samsung
Galaxy Watch Active smartwatch. The choice to build our project using a Samsung watch was
due to the fact that Dr. James Weimer and others at the PRECISE Center had experience
working with these watches and the Tizen operating system. As a result, we would be able to
leverage their experience in developing our solution. As a smartwatch has limited compute
power the PPG signal recorded by the smartwatch’s phototransistors is transmitted off of the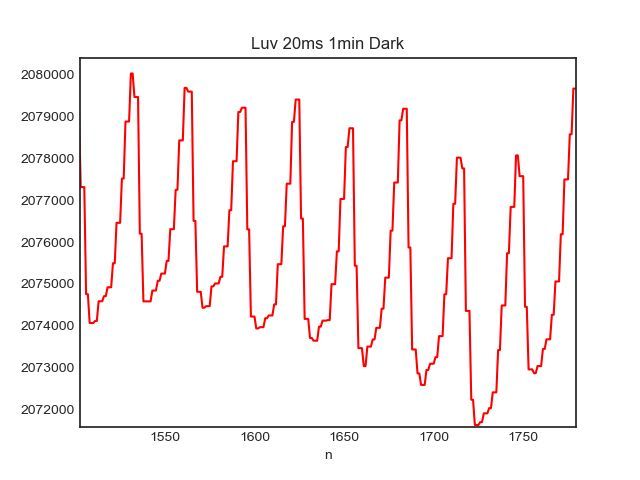
smartwatch using MQTT - an ISO standard protocol for transporting messages between
devices. This particular protocol is designed for connections with limited bandwidth, which is
useful as a hypothetical user of Ichor would need to be collecting and transmitting data as she
goes about her day, often in spite of poor network quality. An example of the raw data we collect
from the smartwatch can be found in Figure 5 in Appendix A.

Signal Processing and Feature Extraction
        The signal acquired off the smartwatch was extremely noisy and could not immediately
be used for blood pressure prediction. Sampling rates had to be increased significantly from the
default to exceed the Nyquist rate of the signal. Afterwards the signal was band-pass filtered to
remove the large roving DC offset as well as high frequency noise artifacts. From the filtered
signal one can estimate heart rate as shown in Figure 6 in Appendix A. From here, a
peak-finding algorithm was used to identify the individual ppg pulses. Each pulse was
normalized to have the same height. These basic transformations can be seen in Figure 7 in
Appendix A. Using the normalized pulses, physiologically relevant features were extracted such
as rise time, peak to peak time, pulse width duration, and normalized area under the curve.
These features were calculated on an individual pulse level as well as in 6 second batches to be
used as inputs for the blood pressure prediction algorithm. Figures 8 and 9 of the appendix
displays said features.

Blood Pressure Prediction
        The calculated features of the PPG waveform would be used along with patient data
such as age, height, weight, and gender to predict blood pressure. This part of the project
remains incomplete due as we were unable to collect PPG and blood pressure data from
patients. As a proof of concept, we used a small anonymized dataset (278 samples) containing
patients’ height, weight, age, gender, blood pressure, and 2100 sample PPG waveform
corresponding to 3 seconds of data collection. We trained an autoencoder (see Figure 10 in
Appendix A) on these PPG Waveforms and extracted 5 features, which has 50% reconstruction
error i.e. the 5 features represent 50% of the information in the original 2100 feature PPG
waveform. These 5 features were combined with age, height, weight, and gender in a gradient
boosted regression to predict the patient’s blood pressure. The model was trained on 75% of
the dataset and tested on the remaining 25%. In testing, this model predicted systolic blood
pressure with an average error of +/- 11mmHg, which was an improvement over our RNN
implementation in the Fall which predicted a constant value for systolic blood pressure and had
an average error +/- 20mmHg.

Cloud Infrastructure
        With respect to our data pipeline, Ichor used the lightweight and secure MQTT protocol
for data transfer and storage. Our data and notification pipeline schematic is as follows: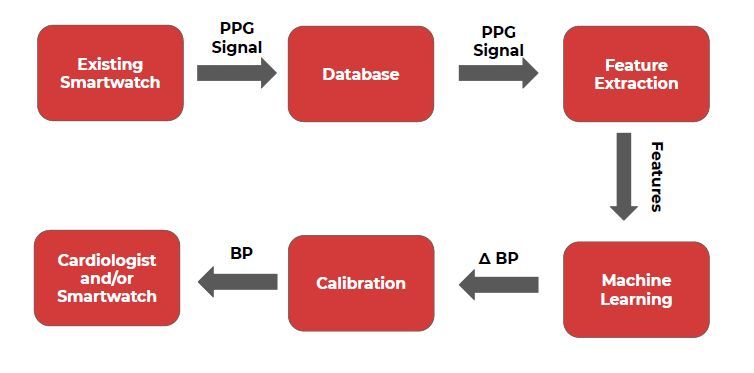
PPG waveform data from all patients is sent at timed intervals from Patient Galaxy
watches to an AWS IoT Core data stream (sample registration of Patient 15’s watch with the
AWS IoT Core stream shown in Appendix C).

       In the cloud, PPG data would be transformed into BP predictions by collapsing input
waveforms into discrete features (autoencoder) and feeding these features into a model
(implemented locally during Spring semester, not implemented in cloud).

These BP predictions would proceed through two pipelines:

   1) DynamoDB storage for analytics (to be used in website, historical views)
   2) Emergency Notification (for abnormal BP events)

        The Emergency Notification pipeline would filter in-bound predictions using patient
specific conditions. If an in-bound BP prediction is caught by a filter (Appendix C), the Ichor
system will send a message to all subscribers (Appendix C) of that patient’s abnormal events
(e.g. family, doctor, etc.). Subscribers can choose to receive notification via text, email, etc.

IV. Self-learning
        Working on Ichor involved a fair degree of self-learning for all aspects of the project: data
collection, signal processing, machine learning, and cloud infrastructure. In regards to the data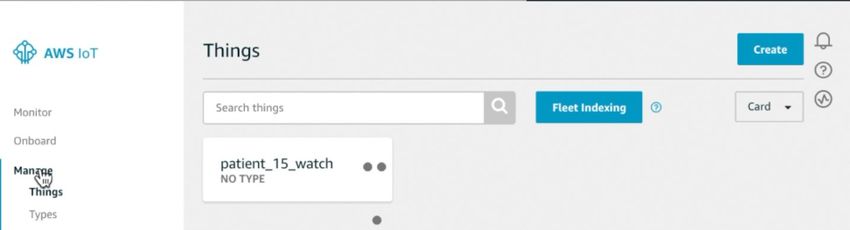
collection, we learned how to interface with our Samsung Galaxy Watch Active (smartwatch)
through the Tizen Studio Integrated Development Environment (development is done in C++).
This allowed us to use the code-base written by Dr. James Weimer and other members of the
PRECISE Center to control the LED on the smartwatch and stream the PPG data in batches.
This data streaming made use of the MQTT protocol, and so we learned how to build a
“dumper” which could interface with this protocol and “dump” the individual batches of data into
a single .csv file. This data wrangling was done so that the data could be easily input into our
signal processing/feature extraction and machine learning steps.
Additionally, self-learning was involved with regards to applying different signal
processing and machine learning methods for data analysis. While we had an idea of which
methods might be useful, understanding how to implement them in software was something that
we learned throughout the semester. For example, we learned how to use Sci-Kit Learn and
PyTorch in order to build an autoencoder to do feature extraction and apply Gradient Tree
Boosting to predict blood pressure. Additionally, we learned how to use the PyWavelets
package to implement wavelets for signal processing. The work of implementing these methods
helped us to learn their practical advantages and disadvantages. For example, Wavelet
Transforms are beneficial as they give one resolution of the signal in both the time and
frequency domains, but are limited in the fact that individual wavelet coefficient has little to no
interpretability. Hence, in filtering applications (in our case, removing a DC offset), wavelets
would be inferior to simple low pass filtering. Though we did not end up using Wavelets in our
final implementation to clean our signal, it was still interesting to learn.
With regards to the cloud infrastructure Mayank had some experience with both AWS
and databases, and so he followed online tutorials to develop our system.
Coupled with our self-learning, several classes had been helpful in giving us the skills to
tackle this project. A basic knowledge of physiology was important, and so BE 305 was been
helpful. Additionally, the knowledge gained in ESE 224, ESE 531, and BE 301 with regards to
signal processing was useful in directing us to potential methods to manipulate the PPG
waveforms without losing valuable “information”. A main value-add of our project was our use of
machine learning, and so the knowledge gained in CIS 519 and CIS 520 were invaluable in
regards to our understanding of various discriminative models.
V. Ethical and Professional Responsibilities
Overall Ichor is centered on data. Data collection, synthesis, and reporting form the core
of our product. This use of consumer and patient data comes with significant responsibilities in
making sure that the information is handled responsibly. There are many regulations and
standards we must adhere to such as FDA CFR Title 21 870.1130 which regulates noninvasive
blood pressure measurement systems. Additionally AAMI ANSI UL 2900 contains standards for
safety for medical device interoperability governing things like data transmission format and
security. The most significant piece of regulation is The Health Insurance Portability andAccountability Act of 1996 (HIPAA) which regulates usage and transmission of patient
information.
HIPAA gives patients rights over their information including a right to request copies of
records and corrections. This is important because ethically we need to provide a way for
patients to control the transmission of their information. Patients need to be able to choose
whom to share their health information with whether that is the provider, payor, employer etc.
Furthermore, we need to provide a way for patients to view the data, thus there need to be both
patient and provider portals to view health information and statistics. Care must be taken to
make sure that we are not feeding into patients' hypochondria and causing fear from benign
information. Thus, we believe that it is our responsibility to only report measurements, not
provide diagnoses. Doctors should always be the ones making final diagnoses, not technology
companies and thus we will only provide measurements, alerts, and guidance not diagnoses or
prescriptive care to patients.
A very large responsibility for us is figuring out how to properly manage patients’
protected health information (PHI). For our solution to have value, we need to maintain identified
health data which can integrate with electronic health records (EHR). This means we are
subject to significant regulation through HIPAA to make sure that the information is protected
and there is no opportunity for data leakage or misuse. Additionally, we believe that it is our
responsibility to make use of the information on a macro level to see what we can learn about
how blood pressure and other markers affect overall patient health and behavior. Using this
data requires us to be able to fully de-identify the information before we agglomerate the
sources and make it available to corporations, and academic researchers.
While normally thought of as a financial or economic issue, pricing our product brings up
many ethical concerns. As a healthcare technology product and company we must balance
making a profit with providing access and quality of care. We will need to work with
governments, insurers, and providers in order to find out the optimal price point that puts Ichor
in the hands of everyone who could benefit from our technology. Furthermore we have to
respect patient’s rights in sharing or selling the data to third parties such as Google or Apple
who are putting a large focus on applying “Big Data” and analytics to health information.
VI. Meetings
We began this semester following along with our meeting schedule from last semester.
We set up a standing meeting time with Dr. Weimer at 10:00 on Tuesday mornings via Skype.
We met with him once in early February, and his recommendation to keep trying to gather clean
PPG data and extract features formed the basis of our work for the remainder of the semester.
We did not meet with him afterwards. Scheduling conflicts prompted cancellation of the first few
meetings, and we did not maintain our regular updates via Slack as we had done in the fall
semester. Additionally, we conversed briefly with Dr. Sangeeta Vohra occasionally throughout
the semester to discuss the status of our project. Unlike last semester, we did not reach out to
subject matter experts, as we were focused on trying to build out our technical capabilities(finally acquire some clean data and extract features). In hindsight, our project would have
probably turned out better had we met more with our advisers and subject matter experts.
VII. Schedule and Milestones
By the end of the fall semester we were able to acquire data from the watch, created a
bench-top model and had a rudimentary autoencoder running. The spring semester focused
mainly on improving the data collection and signal processing. We quickly realized that the data
we were acquiring from the watch was extremely noisy and hard to work with which is why we
had to diverge from our original schedule in Figure 2. Additionally, the bench experiment was
de-prioritized as the industry standard is to test against a regular blood pressure cuff,
specifically a mercury sphygmomanometer. Unfortunately, due to the COVID-19 pandemic we
were unable to run our pilot study. However, the major milestones this semester included fixing
signal acquisition problems, successfully de-noising the signal and extracting features, running
a machine learning algorithm to predict blood pressure, and setting up an AWS server for
physicians to view patient data, receive alerts if necessary, and communicate with patients.
Figure 2. Fall milestones (left) and proposed spring milestones (right)
There is still work to be done in terms of learning especially in regards to further delving
into the Tizen Mobile Operating System upon which our smartwatch is built. We additionally
envision there will need to be significantly more testing and data processing to bring down our
error from ±11 mmHg to ±5 mmHg after the semester ends.
VIII. Discussion of Teamwork
Given that our group was only three people and coordinating meeting times was
relatively easier, much of the work was conducted in a weekly group meetings twice a week.
Figure 2 above specifically highlights our deliverables broken down by team member
contributions. Our project was an inter-departmental senior design and we felt that our skills
complemented each other (e.g. with Amit working on signal processing techniques to clean the
PPG and extract features, Luv working on feature extraction and prediction, and Mayank
working on prediction and our cloud based notification system). We found reports and similar
project deliverables to be readily split up, and we mostly completed such assignments remotely.One challenge that we faced as a team was that we only had one watch. Initially we
were conducting work separately and we quickly realized that this resulted in many hand-offs
and wasted time. To circumvent this problem, we made sure that multiple watch-specific tasks
were not assigned to people concurrently (or, in the event that two people had to work on
different parts of the watch, we made sure to meet up so that we could test code in real-time).
Having one watch was a bottleneck that we were not able to fully avoid, so we optimized our
tasks to avoid unnecessary hand-offs.
IX. Budget
The budget we have outlined at the beginning of the Fall semester has not changed, as
seen in Figure 3, below. We anticipate potential variability in the amount of AWS credits that we
seek and watch parts in the case that we must abandon our Samsung Watch in favor of a
bespoke watch with finer LED measurements.
Figure 3. Proposed budget
X. Standards and Compliance
We created Ichor with the following standards and compliance regulations in mind:
● HIPAA Privacy Rule (use de-identified personal health information)
● Electromagnetic Compatibility Testing: IEC 60601-1-2:2014
● Cytotoxicity, sensitization and irritation: ISO 10993
● Clinical validation: ISO 80601-2:2013
Besides HIPAA which we discussed in our ethical responsibilities there are many
professional standards this product needs to meet as specified by the International Organization
for Standardization (ISO) and the International Electrotechnical Commission (IEC). For example,the device must be safe to be in contact with the user’s skin and adhere to ISO 10993 which
governs cytotoxicity, sensitization, and irritation. Additionally it has to meet elecrocombatibilty
testing under IEC 60601-1-2:2014. As it is serving as a blood pressure monitor it needs to be
clinically validated per ISO 80601-2:2013. Thankfully, since we are using pre-existing hardware,
Samsung has already met these criteria. However, to use this as a medical device it would need
to be FDA approved as a Class 2 medical device and falls under Federal Classification 21
870.1130. We do not see this as a problem as there are multiple predicate devices such as
190792 BB-613 WP, K181006 BB-613, and K113165 Mini-Medic.
With respect to privacy, our cloud infrastructure - in particular the registration of the
Galaxy watches with security certificates in AWS IoT - would allow us to maintain robust data
protection for our users. Future development in Eclipse Paho would also allow encryption.
XI. Work Done Since Last Semester
The work done this semester was primarily a refinement of what we did the previous
semester. This semester, we built out the data processing pipeline. We were able to
successfully clean the data gathered from the Samsung Galaxy Watch Active and produce
clean PPG waveforms. Additionally, we were able to extract key features from the clean
waveforms. Though we did not fully build out the prediction model, we were able to show as a
proof of concept how extracted features could be used for prediction. Using a small sample of
data found online, we extracted features from clean PPG signals using an autoencoder and
made a prediction using these extracted features. The fact that we made an improvement in our
prediction as compared to the models we used last semester which were trained on the raw
signal indicated to us that future work to develop the prediction model could lead to good
results. Lastly, we began developing a a cloud-based notification system to alert patients and
doctors when abnormal changes in blood pressure were detected.
XII. Discussion and Conclusion
Overall we accomplished many things this year and are satisfied with our progress. First
and foremost, we are currently capable of collecting raw PPG data from the Samsung Watch.
This was an important hurdle for us to overcome. Secondly, we built out data processing
routines enabling us to de-noise the signals and extract physiologically-relevant features from
the pressure waves. Furthermore, we have built a recurrent neural network (RNN) and an
autoencoder to extract features from the data in an unsupervised manner. Using the
autoencoder and RNN we were able to achieve an accuracy of ±11 mmHg. We strongly believe
that when we couple this with our physiological features we will be able to reduce the error
dramatically.
On top of the data acquisition and blood pressure estimation, we were also able to build
a system on the cloud to transmit the data to doctors. This allows physicians to view the patient
data and also provides notifications if there are anomalies. Eventually we want to give
physicians the option to message patients and customize notifications sent directly to patients.
There is still work to do in the future to perfect this technology, gain clinically meaningful results
and receive FDA approval. Much testing is needed in the future.Despite the challenges ahead, we are confident that we can deliver a feasible solution that estimates blood pressure using off-the-shelf smartwatch technology. We have already learned a lot this semester from figuring out photoplethysmography works, to learning how to write Tizen applications to learning how to fabricate a bench-top model for blood pressure measurements. We are excited to continue working on this project in the future and look forward to eventually putting Ichor to clinical use!
XIII. Appendices Appendix A: Figures Figure 4. Ichor block diagram Figure 5. Closeup of PPG wave acquired from Samsung Watch (50Hz sampling for 1 minute)
Figure 6. Estimating Heart Rate from Signal using Power Spectral Density Figure 7: Filtering and normalizing the signal
Figure 8: Extracted Features over time calculated per pulse Figure 9: Extracted Features over time in groups of 6 pulses
Figure 10:. Training curve for autoencoder
Appendix B: Code Snippet
Autoencoder Implementation:
#Dataset Generation
batch_size = 32
hidden_layer_size = 6
num_epochs = 300
# df = pd.read_csv('Luv Autoencoder.csv')
X_ppg = torch.tensor(raw_ppg)
print(X_ppg.shape)
dataset = full_data = torch.utils.data.TensorDataset(X_ppg)
dataloader = DataLoader(dataset, batch_size=batch_size, shuffle=True) #
Dataset that is mainly used for training
full_dataload =
iter(DataLoader(full_data,batch_size=len(full_data),shuffle=False)) #
Dataset object to get the full dataset returned when iterated.
# This will be used to calculate the reconstruction errors, and to plot
latent spaces.
ppg_sample = full_dataload.next()[0]
plt.plot(raw_ppg[0])
plt.show()
'''
This is the autoencoder class where you are supposed to set up the
architecture, and the forward pass.
The constructor is setup so that it takes in a variable
'''
class autoencoder(nn.Module):
def __init__(self,n=64):super(autoencoder, self).__init__()
'''
The __init__ takes in 'n' which denotes the size of the bottleneck
layer. By default, it is set to 64.
'''
### TODO: Implement the architecture with an encoder layer and a
decoder layer
# as defined in the problem set PDF. Be sure to use bias
terms here.
#
self.encoder = nn.Sequential(nn.Linear(2100, 1256), nn.ReLU(),
nn.Linear(1256, 128), nn.ReLU(),
nn.Dropout(),
nn.Linear(128, 64), nn.ReLU(),
nn.Dropout(),
nn.Linear(64, n), nn.ReLU())
self.decoder = nn.Sequential(nn.Linear(n, 64), nn.ReLU(),
nn.Dropout(),
nn.Linear(64, 128), nn.ReLU(),
nn.Dropout(),
nn.Linear(128, 1256), nn.ReLU(),
nn.Linear(1256, 2100),
nn.Tanh())
def forward(self, x):
### TODO: Implement the forward pass, by taking in the input batch
of images x, and returning
# the output of the network
x = self.encoder(x)
x = self.decoder(x)return x
'''
Implement the main training loop here
'''
def train(num_epochs,dataloader,model,criterion,optimizer):
'''
Takes in all necessary parameters to train the model and returns the
model and the loss curves.
Args:
num_epochs: Number of epochs to train for
dataloader: The training dataloader object that was given in the
helper code
model: The autoencoder model from the class
criterion: Loss criterion
Optimizer: Optimizer to be used
Returns:
model: trained model
loss_curve: A list of mean epoch losses over the range of epochs
'''
#### TODO: In this function, you'll implement the main training loop.
loss_curve = []
for epoch in range(num_epochs):
epoch_loss = 0
for data in dataloader:
ppg = data[0].to(device).float()
# print(len(ppg))
# Implement the forward pass, the loss calculation,
and the optimization processes.
# Calculate the losses and add them to the total
epoch loss to find the mean epoch lossoptimizer.zero_grad()
# forward + backward + optimize
output = model(ppg)
loss = criterion(output, ppg)
epoch_loss += loss.item()
loss.backward()
optimizer.step()
epoch_loss = epoch_loss / len(dataloader)
loss_curve.append(epoch_loss)
print('epoch [{}/{}], mean epoch loss:{:.4f}'.format(epoch + 1,
num_epochs, epoch_loss))
# if epoch % 10 == 0:
# # For every 10 epochs, take the output of the last minibatch
of the epoch and print the reconstruction.
# pic = convert_to_img(output.cpu().data)
# imshow(torchvision.utils.make_grid(pic),epoch)
return model, loss_curve
learning_rate = 1e-3 #TODO: Give in a suitable learning rate for the
optimizer.
print('-------TRAINING WITH HIDDEN LAYER SIZE ------ ', hidden_layer_size)
# Create a model object of the autoencoder class with bottleneck layer
size (n)
# Define the criterion and the optimizer. Call the train function.
model = autoencoder(n=hidden_layer_size)
criterion = nn.MSELoss()
optimizer = torch.optim.Adam(model.parameters())trained_model, loss_curve = train(num_epochs, dataloader, model.cuda(), criterion, optimizer) Appendix C: Cloud Infrastructure Patient 15 Watch AWS IoT Registration (With Security Certificates)
Patient 15’s Abnormal Blood Pressure Event Filter (systolic blood pressure above 180 OR diastolic above 120)
Management of SNS Subscriptions - “patient_15_alerts”

Doctor Receiving Patient 15’s Blood Pressure Notification with Details
You can also read