R 421 - Internal capital markets in Italian business groups: evidence from the financial crisis - Banca d'Italia
←
→
Page content transcription
If your browser does not render page correctly, please read the page content below
Questioni di Economia e Finanza
               (Occasional Papers)

               Internal capital markets in Italian business groups:
               evidence from the financial crisis

               by Raffaele Santioni and Ilaria Supino
January 2018

                                                                           421
                                                                  Number
Questioni di Economia e Finanza (Occasional Papers) Internal capital markets in Italian business groups: evidence from the financial crisis by Raffaele Santioni and Ilaria Supino Number 421 – January 2018
The series Occasional Papers presents studies and documents on issues pertaining to
the institutional tasks of the Bank of Italy and the Eurosystem. The Occasional Papers appear
alongside the Working Papers series which are specifically aimed at providing original contributions
to economic research.

                 The Occasional Papers include studies conducted within the Bank of Italy, sometimes
in cooperation with the Eurosystem or other institutions. The views expressed in the studies are those of
the authors and do not involve the responsibility of the institutions to which they belong.

                 The series is available online at www.bancaditalia.it .

ISSN 1972-6627 (print)
ISSN 1972-6643 (online)

Printed by the Printing and Publishing Division of the Bank of Italy
INTERNAL CAPITAL MARKETS IN ITALIAN BUSINESS GROUPS:
EVIDENCE FROM THE FINANCIAL CRISIS
by Raffaele Santioni* and Ilaria Supino*
Abstract
Using unique detailed data, we describe the role of internal capital markets in Italian
business groups before and after the financial crisis, an exogenous event which provides an
ideal setting to assess whether the working of internal capital markets helps group-affiliated
firms to mitigate external financial constraints. Our findings support the hypothesis that
internal capital markets are typically activated by firms standing at the top of the control
chain given their easier access to external borrowing. Larger and more profitable firms serve
as internal suppliers of capital and support financially constrained group members that
struggle to stay viable. We also show that firms affiliated to larger and diversified groups
benefit from the existence of internal mechanisms of resource reallocation that can substitute
external finance when it becomes more expensive and hard to access. During the crisis,
group-affiliated firms were more likely to survive than unaffiliated firms.
JEL Classification: G01, G30, G32, G34.
Keywords: business groups, internal capital markets, financial crisis.
Contents
1. Introduction ........................................................................................................................ 5
2. Business groups and internal capital markets ..................................................................... 6
3. Data and descriptive statistics ............................................................................................ 8
3.1 Data on ownership structures ....................................................................................... 9
3.2 Data on financials and firm demographics ................................................................. 10
3.3 Data description ......................................................................................................... 12
4. The functioning of internal capital markets ..................................................................... 17
4.1 Group financial structures and intra-group flows ...................................................... 17
4.2 The direction of internal flows .................................................................................. 19
4.3 The role of group diversification ............................................................................... 22
5. Group-affiliated firms vis-à-vis standalones: a pre- and post-crisis analysis ................... 24
6. Conclusions ...................................................................................................................... 27
Appendix A ........................................................................................................................... 29
A1. Definition of corporate scope ................................................................................... 29
A2. Variable definitions: firm and intra-group level ....................................................... 30
A3. Performance and financial indicators ....................................................................... 30
Appendix B ........................................................................................................................... 31
References ............................................................................................................................. 34
_______________________________________
* Bank of Italy, Directorate General for Economics, Statistics and Research.1. Introduction1
The widespread crisis experienced by the world economy since 2007 has
reinvigorated scholarly attention on corporate funding choices. Under stressed financial
market conditions, firms struggled to raise capital from traditional external providers and
tried to secure alternative sources of funding. This provided researchers with a new
stimulus to document the trade-off between internal and external modes of financing, while
addressing the question of whether the services of outside capital markets can be replaced
and under which circumstances.
In this paper we analyse the role of internal capital markets in Italian business
groups assessing their scale, functioning and importance to the national economy. We track
reallocation flows within enterprise groups before and after the financial crisis, an event
that is likely to have magnified the impact of internal capital markets on resource exchange.
Indeed, especially in the years following the outbreak of the sovereign debt crisis in the
Eurozone, sources of external financing such as bank loans and corporate bonds became
more expensive and, in some cases, difficult or impossible to obtain. In a scenario of
financial distress, the ability of Italian business groups to redistribute resources across
group members may have been essential.
Our paper contributes to the existing literature in several ways. First, it builds upon
previous work on the ownership and control structures of Italian companies. We provide an
unprecedented, full assessment of the business groups operating in Italy, shedding light on
their internal composition and economic relevance. Second, it adds to the growing volume
of research exploring how business groups can replace external financing at times of
impaired credit market functioning. Third, our findings have implications for the literature
on the consequences of internal capital allocation. We have evidence that, on average,
internal capital markets engage in cross-subsidization and provide group members with a
financing advantage over standalone firms.
The rest of the paper proceeds as follows. Section 2 provides a brief overview of the
literature. Section 3 describes the data and Section 4 discusses the evidence concerning the
1
We would like to thank Giorgio Albareto, Alessandro Fabbrini, Riccardo De Bonis, Giovanni D’Alessio,
Fabio Schiantarelli and Philip E. Strahan for their guidance, comments and suggestions. We are solely
responsible for any and all errors. The views expressed herein are ours and do not necessarily reflect those
of the Bank of Italy.
5functioning of internal capital markets. Section 5 compares affiliated and independent firms
over a relevant set of indicators, both in pre- and post-crisis years. Section 6 concludes.
2. Business groups and internal capital markets
Unlike conglomerates, business groups consist of related but legally independent
firms held together by multiple ties (cross-stockholdings, financial inter-linkages, etc.)
under a unique ownership structure. Nevertheless, group members can autonomously raise
external financing (Cestone and Fumagalli, 2005; Bianco and Nicodano, 2006) and can
choose not to bail out ailing affiliated units (Nicodano, 2003). Among potential advantages,
group members can benefit from common affiliation and can use internal capital markets as
an alternative funding channel to support financially constrained firms.
Business groups remain a prevalent organizational form across both developed
(ECGN, 1997; La Porta et al., 1999; Barca and Becht, 2002) and developing countries
(Khanna, 2000; Claessens et al., 2002). However, the vast majority of published research
on business groups has underestimated or even neglected the role that enterprise groups
play in advanced economies, focusing instead on countries at an earlier stage of
development where failings in basic legal, financial and market infrastructures have led to
the emergence of groups as second-best responses to institutional voids (Leff, 1978;
Khanna and Palepu, 1997).
Past literature has looked into specific aspects of business group formation and
activity. It has extensively detected, for instance, how the allocation of funds within a
group’s corporate boundaries takes place through the functioning of an internal capital
market. A number of papers have addressed the question of whether internal markets
allocate scarce resources in an efficient (bright side) or inefficient (dark side) way.
According to Stein (2003), internal mechanisms of capital distribution permit (i) the
avoidance of underinvestment problems that divisions (or group members) would
experience if operating as standalones (more-money effect), as well as (ii) the value-
enhancing reallocation of assets towards successful projects and away from poorly
performing ones (smarter-money effect). Both these effects are based on the assumption
that extensive knowledge of investment prospects ensures accurate information and enables
the headquarters to make better allocation decisions. Internal capital markets countervail
6financial market dislocation and contribute to reducing the transaction costs associated with
external financing.
However, these benefits are sometimes hard to realize in practice. Empirical
evidence has been offered in support of the claim that “cross-subsidies in internal capital
markets often tend to be ‘socialist’ in nature” (Scharfstein and Stein, 2000), resulting in
resource misallocation and exacerbating the problem of overinvestment in low-profit
business activities. The centralization of capital may also leave room for opportunistic
behaviors such as managerial rent-seeking (Meyer et al., 1992), power-grabbing (Rajan et
al., 2000; Scharfstein and Stein, 2000) or tunnelling (Bertrand et al., 2002).
Few prior works have investigated the inner workings of internal capital markets in
business groups, with a specific focus on emerging economies. Gopalan et al. (2007) show
that Indian firms with limited access to intermediated funds can benefit from capital
reallocation within the group when they suffer negative cash-flow shocks. Buchuk et al.
(2014) confirm the positive role of internal markets in relaxing financing frictions in
Chilean control pyramids, but find no support for the tunnelling hypothesis in the presence
of strict regulation and disclosure requirements. Almeida et al. (2015) find that Korean
chaebol use their internal markets to mitigate the negative effects of a financial crisis on
investments and performance.
In addition, little evidence is available on internal capital markets established within
European groups. Dewaelheyns and Van Hulle (2006) argue that group-internal markets
may distort predictions on the survival chances of distressed member affiliates as compared
with independent peers in Belgium. Gorodnichenko et al. (2009) find that participation in
German Konzerns alleviates market imperfections for small firms. Boutin et al. (2013)
demonstrate how French business groups are able to shift liquidity in favor of financially
constrained affiliates, providing them with a competitive advantage over their standalone
rivals in the product market.
In Italy, group membership is a salient and persistent feature of the industrial
structure (Barca et al., 1994; Cannari and Gola, 1996; Bianchi et al., 2005; Santioni, 2012).
In 2014, one third of total employment in industry and services occurs at firms affiliated
with Italian business groups. They generate 55 per cent of total value added in the industrial
and service sectors (Istat, 2017); listed firms controlled via pyramids accounted for 18 per
cent of the market (Consob, 2016).
7The ownership structure of Italian groups has been extensively examined, but only a
limited number of empirical studies have specifically looked at the functioning of internal
capital markets. Buzzacchi and Pagnini (1994) consider a sample of 510 industrial firms to
study the importance of intra-group transactions in Italy. They confirm the reallocation
function of internal capital markets, showing that the amount of resources exchanged
through internal channels is comparable to the amount of funds raised externally by the
corporate groups. In a similar vein, Schiantarelli and Sembenelli (2000) use a panel of
private Italian firms classified into two categories according to their ownership structure:
independent firms and business group members. Their findings provide strong support for
the existence of internal capital markets that help group-affiliated firms to alleviate market
imperfections and to gain a financial advantage over standalones. Santioni et al. (2017) use
a novel dataset that combines data on the structure of Italian groups with data on both firm
performance and the financial soundness of the banking sector. Their results suggest that
firms in business groups were more likely to survive in the wake of the global financial
crisis and the euro area sovereign debt crisis compared with unaffiliated firms. During the
crisis, the overall relevance of internal capital transfers increases; funds move from cash-
rich to cash-poor firms and to firms with more favorable investment opportunities.
To the best of our knowledge, this is the first study that assesses the relevance and
the workings of internal capital markets in Italian business groups over the last decade,
separating episodes of crises from normal times.
3. Data and descriptive statistics
Our analysis is based on two main sources of data, both from the Company
Accounts Data System (Centrale dei Bilanci/Cerved). The first source is Gruppi Italiani, an
electronic database which collects information on the ownership structures of the entire
universe of Italian business groups, both financial and non-financial (see Section 3.1).2 The
second is a firm-level accounting dataset which provides comprehensive balance sheet
information for the entire universe of Italian limited companies (see Section 3.2).
2
We acknowledge the support of the Cerved Group in providing us with Gruppi Italiani data.
83.1 Data on ownership structures
Gruppi Italiani collects data on more than 145,000 business groups on the basis of
consolidated financial reporting, shareholders’ lists maintained by the Chambers of
Commerce and notifications of major holdings of shares that listed companies are obliged
to disclose to the Italian Securities and Exchange Commission (CONSOB). It provides data
on firms operating in Italy which are affiliated with domestic and foreign groups; it also
contains group-specific details in terms of prevalent economic activity and level of
integration. Information is updated monthly and, for a sub-sample of the bigger groups
(exceeding one billion EUR in terms of consolidated revenues), is also validated quarterly
and integrated with press reports and corporate communications.
Methodologically, the reconstruction process consists of various phases. First,
control relationships between companies are identified based on the ultimate owner (i.e. the
largest shareholder located at the upper echelons of the ownership chain who holds directly
or indirectly controlling stakes in other firms). A dominant influence is exerted through
centralized coordination when control is performed on a de jure or de facto basis, or when a
firm’s share capital is (i) equally distributed among different owners (such as in joint
ventures) or (ii) subject to any shareholder agreements. As a consequence, the controller
can be more or less visible depending on how the control is actually exercised.
Details obtained from Gruppi Italiani allow us to map the hierarchical structures of
the universe of Italian business groups.3 The holding company is defined according to
specific criteria: it may be either a corporation (i.e. a firm positioned at the apex retaining
control over bottom-tier companies, but which is not, in turn, controlled by any individual
or legal entity) or one or more natural persons who ultimately own controlling shares in at
least two separate firms that make up the group.
Irrespective of whether the ultimate owner is a company or not, a control link is
identified when the holding company – or one of the held firms operating in the next tier
down – owns a certain percentage of the firms standing at the bottom of the pyramid. In
Figure 1, the corporate structure of an Italian business group is shown.
3
The Cerved archive also distinguishes between simple and complex groups: the former are characterized
by the presence of a unique holding, while the latter show more than one holding companies positioned
within a hierarchical structure.
9Figure 1
An example of the ownership structure: the De Rigo Group in 2014
De Rigo
Holding
Ateco 70.1
De Rigo De Rigo Hotel De Rigo
Sting Grupo Dr Cool
Refrigeration SpA Antonella Immobiliare
Espana Promibe Equipment
(100%) (96.9%) (100%) (100%)
(foreign) (foreign) (foreign)
Ateco 28.25 Ateco 70.1 Ateco 55.1 Ateco 68.1
De Rigo
Vision
(100%)
Ateco 32.50
(*) Other 25
foreign
affiliates
Source: Gruppi Italiani.
3.2 Data on financials and firm demographics
Data on firm characteristics. Detailed information on accounting records,
geographic location, the type of business entity and the sector(s) of economic activity are
drawn from the Cerved database, which collects mandatory disclosures for the entire
universe of Italian limited companies from 1993 onwards.4 Information is gathered under
five broad categories: individual balance sheet data, industry affiliation, firm size,
composition of the company’s financial structure and intra-group transactions.
Financials are presented in different formats.5 Because of non-harmonized reporting
templates, we reconcile data in order to ensure that two or more sets of records can be
easily compared without further modification. In addition, specific criteria for inclusion in
the dataset are set out: first, we consider only active firms with turnover and total assets
greater than zero; second, firms are required to have statements of cash flows (whether
4
Financial statements refer to a 12-month period and are deposited each year at the local Chamber of
Commerce.
5
Five reclassification schemes are compiled by Cerved based on the type of activity carried out by each
firm: industrial transformation, real estate companies, financial and factoring, holding, and leasing.
10presented by the company itself or reconstructed by Cerved); third, financial statements
prepared in abbreviated form are included under the condition that financial or trade
payables are recognized and fully disclosed.
Industrial affiliation is defined according to the ISTAT classification system
ATECO 2007.6 Alternatively, we use the Central Credit Register when the ATECO code is
not available. Information on the number of employees (often unavailable in the Cerved
database) is mainly obtained from an administrative source called Infocamere and based on
the Register of Companies. Firms are further categorized into four size classes as defined in
accordance with Commission Recommendation 2003/361/EC and measured in terms of
employees and annual turnover (or employees and total assets). According to the same
criteria, size is also defined at the group-level (see Table A1 in Appendix A).
The Cerved archive provides balance sheet information about the capital structure
and the firm’s performance. This allows us to compute a set of ratios used to gauge member
firms’ financial health and to make comparisons with independent companies. Key
financial and non-financial indicators are defined and classified in Appendix A (see Table
A2) according to the insights they provide.
We then merge Gruppi Italiani and Cerved data by matching up observations based
on a common key identifier, the fiscal code. After the merging we are able to disentangle
affiliated and unaffiliated firms; the merging of the two datasets does not entail any deletion
of firms and consequently lacks any selection bias. The final dataset consists of 158,670
group-affiliated firms in 2006 (188,826 in 2014) for which we provide complete details on
annual accounts. We then include 355,025 independent firms for the pre-crisis period and
402,271 for the post-crisis phase.
Data on internal capital markets. In accordance with national rules, individual firms
are required to indicate in the balance sheet – compiled as envisaged by Art. 2424 of the
Italian Civil Code – any intra-group lending or borrowing relationships. Likewise, Art.
6
Cf. Council Regulation n. 1165/98 on short-term statistics. Please note that we exclude from the scope of
observation those economic activities related to: agriculture, forestry and fishing (Section A, NACE
classification), community, social and personal services (Section O, NACE classification), activities of
membership organizations (division 94); activities of households as employers; undifferentiated goods
and services producing activities of households for own use (Section T, NACE classification),
extraterritorial organizations and bodies (Section U, NACE classification), public institutions and private
non-profit entities. For the purpose of the analysis, financial service firms are screened out. We remove
financial companies because they are few in number and limited intra-group information exists.
112425 of the Italian Civil Code, requires that items relating to “controlled, affiliated and
controlling undertakings” be indicated separately in the income statement. Companies are
also allowed to prepare abridged financial statements, which are not required to contain
details on intercompany transactions.
The information on intra-group positions is contained in a dedicated section
(“position towards the group”) of the reclassified financial statements, to which we refer for
our research purposes. This section thoroughly describes intra-group operations, providing
us with details on intra-group sales, shareholdings in controlled, controlling or other related
firms, and financial and trade receivables (or payables) from other group members, just to
mention few. As Table A2 in Appendix A reports, some key measures are constructed
based on these items. Later in the paper, we will better point out how internal resources are
allocated within the group. When testing the operation of internal capital markets, we
further narrow down our dataset to include observations from firms that display at least one
populated item in the intra-group section; the resulting dataset consists of 49,877 firms in
2006 (60,520 in 2014).
3.3 Data description
To date no comprehensive study has attempted to fully reconstruct the perimeter of
Italian business groups while describing under which form of ownership arrangements they
operate. We use a large archive which covers roughly 80 per cent of the entire universe of
Italian limited liability companies in the Italian Register of Active Firms (Archivio
Statistico delle Imprese Attive – ASIA).
Micro- and small-sized firms make up the vast majority of enterprises within the
country (see Table 1). Approximately one third of these firms are affiliated to a business
group, while the remaining ones compete in the market on a standalone basis. Among
larger companies, membership in a group is widespread, with very few medium- and large-
sized enterprises operating as independent entities.
12Table 1
Data description: firms and employees by affiliation status
(number of active firms and employees)
2006 2014
Affiliated
Firms Employees Firms Employees
Firm size (1)
Micro and small 140,054 804,133 170,101 984,699
Medium and large 18,616 3,806,283 18,725 3,891,621
Geographic area (2)
North-West 57,205 1,938,897 65,239 2,014,335
North-East 39,067 1,059,953 44,352 1,177,837
Centre 37,044 1,086,295 44,965 1,108,705
South and Islands 25,354 525,271 34,270 575,443
Sector
Industry 32,767 1,899,466 33,576 1,782,977
Construction 19,615 236,027 21,837 252,369
Services 106,288 2,474,923 133,413 2,840,974
Total 158,670 4,610,416 188,826 4,876,320
Unaffiliated
Firms Employees Firms Employees
Firm size (1)
Micro and small 345,102 1,357,320 392,304 1,773,660
Medium and large 9,923 1,059,908 9,967 1,148,617
Geographic area (2)
North-West 110,030 837,518 120,856 949,214
North-East 76,494 567,263 86,595 696,225
Centre 84,752 493,573 95,326 588,762
South and Islands 83,749 518,874 99,494 688,076
Sector
Industry 63,792 844,035 67,637 845,548
Construction 51,328 236,493 54,553 246,337
Services 239,905 1,336,700 280,081 1,830,392
Total 355,025 2,417,228 402,271 2,922,277
Source: Our processing of Gruppi Italiani and Cerved data.
(1) For size definitions see Table A1 in Appendix A. – (2) Location of the firm’s head office.
In 2006, according to our data, about 160,000 firms with 4.6 million employees
(representing 66 per cent of total employed persons) were affiliated to a business group; in
2014 there were less than 190,000 affiliated firms and about 4.9 million employees (62.5
per cent of the total). Most firms enjoying group membership have less than 50 employees,
are located in the northern part of the country and are active in the industry and service
sectors. Medium and large firms in groups are notably less diffused and are nearly twice
(about 200 employees per firm) as large as their independent peers. These features
remained almost unchanged over time.
13Table 2 presents the number of group-affiliated enterprises for 2006 and 2014 by
group size class. More than half of the affiliated firms are in simple group structures, which
consist of no more than two active firms.7 Companies in more complex groups (i.e. those
with at least ten affiliated firms) are few in number but have a strong economic impact in
terms of jobs created: while representing only 5.5 per cent of enterprises in 2016 (3.8 in
2014), they account for 26.4 per cent of total employment of groups (23.3 in 2014).
Table 2
The size of Italian business groups (1)
(number of active firms and employees; average values)
2006 2014
Number of firms Firms Employees Employees Firms Employees Employees
per firm per firm
1 51,110 840,500 16.4 59,672 863,575 14.5
2 62,890 970,991 15.4 77,194 1,061,177 13.7
3–4 25,402 907,447 35.7 31,630 913,588 28.9
5–9 10,588 672,297 63.5 13,287 902,960 68.0
10 and above 8,680 1,219,181 140.5 7,043 1,135,020 161.2
Total 158,670 4,610,416 29.1 188,826 4,876,320 25.8
Source: Our processing of Gruppi Italiani and Cerved data.
(1) We only consider active firms incorporated in Italy. This implies that a group consisting
of one active firm may instead include at least (i) a foreign holding and/or a foreign affiliate
or (ii) a non-active holding and/or non-active subsidiary based in Italy.
The average number of employees per firm belonging to micro and small groups is
5, while firms in medium-large groups average 90 employees (see Table B1 in Appendix
B). Micro and small companies represent the entirety of firms belonging to smaller groups
and the overwhelming majority of those present in groups of medium and large scale;
however, small-sized firms affiliated to medium-large groups are, on average, bigger than
similar firms in micro and small groups or comparable standalones.
In order to assess the extent to which our dataset covers the entire universe of
companies, we compare Gruppi Italiani data on affiliated firms with those disclosed by
Asia Gruppi, the official register on enterprise groups maintained by the national statistics
7
Please note that we only consider active firms incorporated in Italy. This implies that a group consisting of
one active firm may instead include at least (i) a foreign holding and/or a foreign affiliate or (ii) a non-
active holding and/or subsidiary based in Italy.
14bureau (ISTAT). Comparisons are performed across several dimensions, in both the periods
we consider for the study.
Different methodologies are applied by Cerved and ISTAT to identify the perimeter
of a business group.8 ISTAT, for instance, defines firm size classes in terms of employees
(while we use employees and annual turnover or total assets) and uses several
administrative sources (Italian Social Security Administration, Italian Revenue Agency)
that are not available to us. Table 3 synthetizes the representativeness of our data on the
number of firms and workers.
Table 3
Data comparison by firm size
(number of active firms and employees)
Firm size 2006 2014
Gruppi Italiani Asia Gruppi Gruppi Italiani Asia Gruppi
Number of active firms
Micro and small 140,054 147,281 170,101 190,590
Medium and large 18,616 15,450 18,725 15,139
Total 158,670 162,731 188,826 205,729
Number of employees
Micro and small 804,133 1,092,332 984,699 1,127,908
Medium and large 3,806,283 4,449,186 3,891,621 4,445,391
Total 4,610,416 5,541,519 4,876,320 5,573,299
Source: Our processing of Gruppi Italiani, Cerved and ISTAT-Asia Gruppi data.
We group firms into two size-based clusters in order to explain their
representativeness across two relevant dimensions: regional location and sector affiliation.
Based on geographic distribution (Figure 2), firms included in our dataset cover almost the
entire population of firms present in Asia Gruppi. Interestingly, our data explain – both in
terms of firms and employees – the near totality of affiliated firms located in southern Italy,
thus avoiding the underrepresentation of this area as is often the case.
8
Data sources may differ from each other or may use different rules to classify the same dimension. This
explains why our dataset over-represents the universe along some dimensions.
15Figure 2
Data comparison by geographic location
(thousands)
(a) number of active firms (b) number of employees
Source: Our processing of Gruppi Italiani, Cerved and ISTAT-Asia Gruppi data.
Figure 3 provides a breakdown of enterprises by sector and shows the distribution of
the employed persons across economic segments. Data refer to both the pre- and post-crisis
periods and include industry, construction and services. Our data are able to fairly represent
all the Italian groups, regardless of the type of industry they operate in: firms in groups are
almost entirely concentrated in the service sector, a leading sector of the Italian economy
even before the financial crisis.
Figure 3
Data comparison by sector affiliation
(thousands)
(a) number of active firms (b) number of employees
Source: Our processing of Gruppi Italiani, Cerved and ISTAT-Asia Gruppi data.
164. The functioning of internal capital markets
4.1 Group financial structures and intra-group flows
There are several ways of exchanging financial resources among affiliated firms
which form part of the same business group. Available funds can be reallocated internally
through multiple channels such as intra-group loans, mutual debt guarantees, subscription
of shares and bonds, dividend distributions, transfer prices and deferred payments
(Buzzacchi and Pagnini, 1994; Almeida et al., 2015; Gopalan et al., 2007; Buchuk et al.,
2014).
Intra-group exposure can originate from either cross-holdings or credit lines that a
member firm makes available to other group members. However, since the most relevant
channel through which Italian business groups transfer resources is internal borrowing, we
choose the intra-group net financial position as the main variable of interest, measured as
the difference between intra-group financial debt and intra-group financial credit: it takes a
positive value if the firm is borrowing from other group members.
Italian accounting standards require companies to provide details of their financial
position towards the group they belong to (see Section 3.2). This enables us to have data on
intra-group transactions and to assess their relative weight in covering firms’ overall
financing needs. Our intention is to show the relevance and the direction of intra-group
financial flows, identifying the main features of group members which benefit from the
internal capital market.
Table 4 synthetises the financial situation of the groups with several indicators
assessing their profitability and financial viability (see Table A2 in Appendix A for variable
definitions). Those results are broken down by group size, distinguishing holdings and sub-
holdings from affiliates. This allows us to identify allocation patterns and to evaluate
whether and how the magnitude of internal capital markets has changed because of the
economic crisis.
In medium- and large-sized groups, internal markets are much more developed.
Bank borrowings are an important source of funding, but in some cases (holdings and sub-
holdings) it is not a major one. After the onset of the financial crisis, affiliates are less
dependent on banks, with greater recourse to internal finance: the relative weight of intra-
17group loans on total financial debt increased by 4 percentage points between 2006 and
2014, which speaks of a substitution between external (bank) debts and internal lending.
Holding companies are found to borrow at a slightly lower cost compared with other group
members.
Table 4
Performance, financial structure and intra-group reallocation
by group layer level (1)
(per cent; weighted averages)
Indicator 2006 2014
Holdings Affiliates Holdings Affiliates
Sub-holdings Sub-holdings
Micro and small groups
EBITDA/Operating assets 6.9 7.5 4.8 5.9
ROE 4.2 4.9 1.4 2.7
ROA 3.4 3.9 1.8 2.3
Leverage 56.4 65.7 51.4 58.3
Bank debt exposure 62.2 63.9 64.9 64.4
Intra-group financial debts/Financial debts 23.0 26.6 16.1 22.6
Intra-group financial debts/Assets 11.0 13.2 7.3 10.4
Intra-group trade debts/Assets 3.3 6.4 4.6 5.3
Cost of debt 4.2 4.5 3.3 3.5
Medium and large groups
EBITDA/Operating assets 12.3 8.8 8.3 9.1
ROE 7.4 6.8 4.9 5.0
ROA 6.1 4.8 3.6 4.2
Leverage 46.6 50.1 49.9 49.7
Bank debt exposure 37.0 53.2 29.6 47.2
Intra-group financial debts/Financial debts 31.7 41.1 31.3 44.9
Intra-group financial debts/Assets 9.9 15.2 12.6 17.1
Intra-group trade debts/Assets 3.6 6.4 3.9 6.5
Cost of debt 4.6 4.8 3.5 3.6
Total
EBITDA/Operating assets 12.0 8.6 8.1 8.4
ROE 7.3 6.5 4.8 4.6
ROA 6.0 4.6 4.8 4.6
Leverage 46.9 52.6 49.9 51.4
Bank debt exposure 37.8 55.2 30.8 51.4
Intra-group financial debts/Financial debts 31.6 40.0 31.0 42.4
Intra-group financial debts/Assets 9.9 15.1 12.5 16.6
Intra-group trade debts/Assets 3.6 6.4 3.9 6.5
Cost of debt 4.6 4.7 3.5 3.5
Source: Our processing of Gruppi Italiani and Cerved data.
(1) For size definitions see Table A1 in Appendix A.
18In comparison with firms in larger groups, those in smaller groups – either holdings
or affiliates – perform worst, are more leveraged and are highly dependent on the banking
sector even after the financial crisis. Most micro and small groups are poorly diversified
(see Section 4.3) and have at their disposal a limited share of internal resources (in relation
to both total debts and assets).
Looking at the composition of borrowing, we find that the share of bank debt on
total debt is particularly relevant in controlled rather than controlling firms. This could be
due to the fact that affiliates are, on average, smaller than holdings and sub-holdings, and
have fewer opportunities to diversify their sources of finance. Table B1 in Appendix B
shows that most affiliates are small companies which represent the totality of firms
affiliated to micro and small groups and more than half of those belonging to larger groups.
However, parent companies at the top of medium-sized and large business groups are
predominantly large firms that can exploit their scale to secure funding options alternative
to bank loans (see Figure B1 in Appendix B).
4.2 The direction of internal flows
Internal capital reallocation follows a top-down scheme: resources are channelled
away from the upper nodes of the group towards companies located at the bottom of the
pyramid (see Table 5).
Table 5
Intra-group flows by group layer level
(per cent; weighted averages)
Indicator 2006 2014
Number of Intra-group net financial Number of Intra-group net financial
firms position/Assets firms position/Assets
Holdings 17.7 -5.9 17.6 -4.2
Sub-holdings 4.8 -0.2 5.0 1.0
Affiliates 77.4 4.7 77.4 4.9
Total 100.0 0.4 100.0 1.0
Source: Our processing of Gruppi Italiani and Cerved data.
Holding companies act as the main suppliers of funds, while receivers are often in
the lower ranks; funds flow along the control chain to finance firms demanding for intra-
group support, especially in times of financial distress. Affiliated firms are, on average, net
19receivers with a net financial position that represents 4.7 per cent of total assets in 2006 (4.9
per cent in 2014).
In medium-sized and large groups providers are typically larger firms (see Table 6):
they are, on average, three times bigger than receivers in terms of turnover and have a
greater amount of collateralizable assets. Providers are also more profitable and more
dependent on external financiers, in line with the idea that companies with stronger
bargaining power leverage it to obtain better credit conditions.
Table 6
Providers and receivers: some features (1)
(thousands of euros and per cent; averages)
Indicator 2006 2014
Net providers Net receivers Net providers Net receivers
(NFP0) (NFP0)
Micro and small groups
NFP towards the group (2) -779 713 -1,151 673
Turnover 987 819 530 465
Assets 3,328 1,873 3,326 1,978
External finance/Assets 37.5 19.9 33.3 19.3
EBITDA/Operating assets 7.4 6.6 5.6 5.1
ROE 3.2 3.3 2.0 2.4
ROA 3.5 3.4 2.1 2.0
Number of firms 4,805 5,950 7,396 9,180
Medium and large groups
NFP towards the group (2) -13,888 11,466 -15,130 14,632
Turnover 15,876 5,574 14,454 4,214
Assets 20,138 8,326 21,203 8,653
External finance/Assets 25.4 13.0 20.7 10.8
EBITDA/Operating assets 8.7 7.3 9.0 6.7
ROE 4.4 3.9 4.6 3.9
ROA 4.3 3.6 3.7 2.8
Number of firms 7,617 9,677 9,108 10,897
Total
NFP towards the group (2) -8,817 7,372 -8,866 8,250
Turnover 6,113 2,462 3,254 1,411
Assets 9,862 4,281 9,401 3,977
External finance/Assets 28.5 15.4 23.9 14.5
EBITDA/Operating assets 8.2 7.0 7.6 6.0
ROE 4.0 3.7 3.4 3.1
ROA 4.0 3.5 2.9 2.5
Number of firms 12,422 15,627 16,504 20,077
Source: Our processing of Gruppi Italiani and Cerved data.
(1) For size definitions see Table A1 in Appendix A. – (2) The net financial position towards the
group of providing firms is supposed to be equal, in absolute terms, to that of receiving ones.
However, based on our data, we are not able to: (i) trace inflows (outflows) from (to) affiliates
that are abroad; (ii) always have complete information on each affiliated firm of the group.
20Compared with large business groups, smaller ones do not have the scale to
internalize the costs associated with operating an internal capital market. This results in less
channels of resource transfer and, consequently, in a lower volume of intra-group
exchanges. In such a case, our estimates show no significant differences between providers
and receivers in terms of firm features.
The provider–receiver status also depends on the likelihood of a firm being
constrained by external financing. Following Lamont et al. (2001), we construct the Kaplan
and Zingales index (KZ) of financial constraints for each group member in each year
considered. The index is calculated using the following formula:
KZ Index= -1.002*Cash Flow/K+0.283*Tobin′ s Q+3.139*Debt/Total Capital
(1)
-39.368*Dividends/K-1.315*Cash equivalent assets/K
where the KZ index loads positively on Tobin’s Q (market-to-book) and Leverage,
negatively on Cash Flow, Dividends and Cash equivalent assets. In line with the extant
empirical literature, we sort firms into different categories based on the KZ index ranking:
firms are classified as “financially constrained” (“financially unconstrained”) if their KZ
index lies in the top (bottom) three deciles, with status changes allowed over time. This
sorting does not imply that the firms ranked in the top (bottom) three deciles are completely
constrained (unconstrained).
Our results (see Table 7) show different levels of leverage and profitability across
constrained and unconstrained firms, the former being more leveraged (80 per cent versus
44 in 2006; 74 per cent versus 39 in 2014) and less profitable (with a ROA of around 1 or 2
per cent) than the latter. We also find that financially constrained firms are considerably
smaller than their financially unconstrained counterparts, even though differences in size
dwindle after the crisis.
Companies in need receive a large amount of resources from other group members
not facing financial constraints, a tendency that is more marked after the outbreak of the
crisis: between 2006 and 2014, the net financial position increased by about 40 per cent. In
2014, unconstrained firms became, on average, providers of funds: their net financial
position towards the group turned negative throughout the period of analysis, suggesting
21greater support was provided to struggling firms when the crisis tightened financial
constraints.
Table 7
Intra-group flows by Kaplan-Zingales index
(thousands of euros and per cent; averages)
Kaplan-Zingales Index
Indicator
Constrained Unconstrained Constrained Unconstrained
2006 2014
NFP toward the group 3,136 3,061 4,405 -2,951
-if Net providers (NFP0) 7,293 11,620 9,803 4,425
Total assets 31,862 76,313 36,169 63,947
Leverage 0.80 0.44 0.74 0.39
ROA 1.90 8.79 1.12 7.82
Number of firms 7,783 5,639 10,499 6,711
Source: Our processing of Gruppi Italiani and Cerved data.
4.3 The role of group diversification
We also consider the effects of group-level diversification in influencing the
functioning of an internal capital market. Intuitively, business groups composed of firms
operating in the same or like industries are less likely to share resources in an internal
market mechanism. One explanation is that firms affiliated to poorly diversified groups
tend to exhibit similar performance when a common industry shock hits their businesses.
The Herfindahl-Hirschman index (HHI) is then constructed at group level to capture
the degree of diversification across industries over the period considered (a higher HHI
means that a business group is concentrated in few economic sectors). Figure 4 shows a
negative correlation between the net financial position towards the group (both for
providers and receivers, in absolute terms) and the level of diversification: the less
concentrated a business group is, the better the chances of establishing a cross-industry
22internal capital market that acts as a conduit for the shifting of funds from members in
flourishing sectors to other members which could have suffered industry-specific shocks.9
Figure 4
Net financial position towards the group by degree of diversification (1) (2)
(thousands of euros; averages)
Source: Our processing of Gruppi Italiani and Cerved.
(1) HHI is computed on sales at group level based on 3-digit SIC classification. The
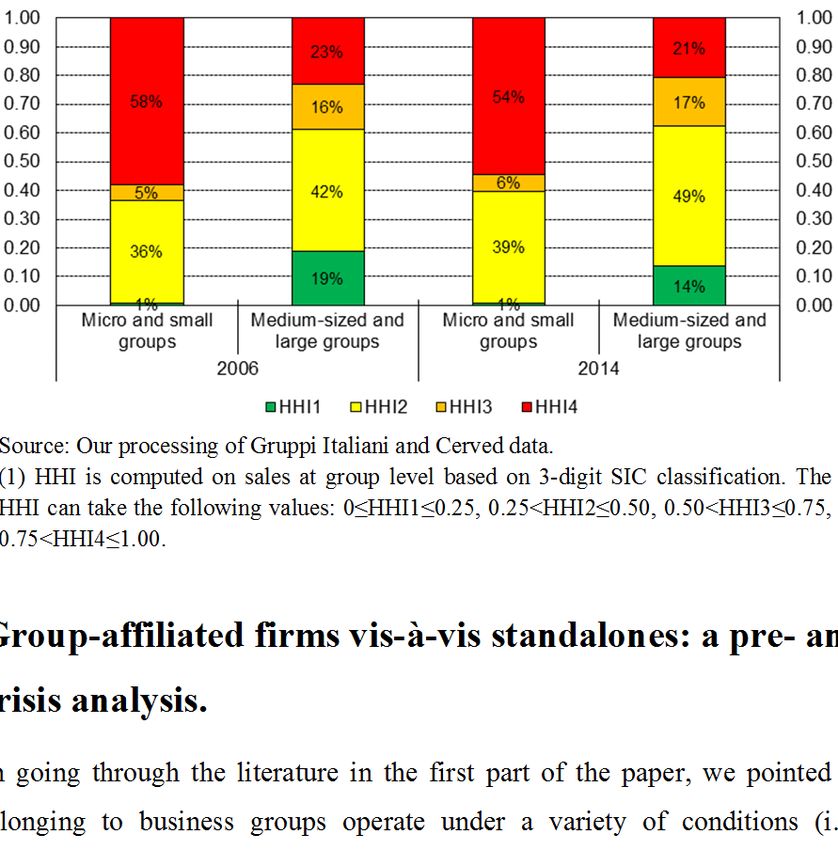
HHI can take the following values: 0≤HHI1≤0.25, 0.25Figure 5
Group size and diversification (1)
(per cent)
Source: Our processing of Gruppi Italiani and Cerved data.
(1) HHI is computed on sales at group level based on 3-digit SIC classification. The
HHI can take the following values: 0≤HHI1≤0.25, 0.25dimension both at firm and group level. In Table 8 we report the results obtained after
controlling for firm size.10
Table 8
Performance and financial indicators by size and affiliation status (1)
(per cent; weighted averages)
Indicator 2006 2014
Affiliated Unaffiliated Affiliated Unaffiliated
Micro and small enterprises
Profitability
EBITDA/Operating assets 7.1 8.2 5.8 7.0
ROE 4.6 5.1 2.3 4.3
ROA 3.5 4.0 2.2 3.0
Financial structure
Leverage 58.8 64.9 50.8 58.3
Financial debts/Turnover 46.6 36.5 64.0 41.7
Bank debts/Financial debts 60.9 63.0 60.8 62.8
Short-term financial debts/Financial debts 40.8 44.1 36.7 39.4
Cost of debt 4.4 4.4 3.9 3.2
Medium and large enterprises
Profitability
EBITDA/Operating assets 10.4 9.3 9.0 8.8
ROE 7.4 1.6 5.4 4.3
ROA 5.7 4.5 4.1 3.9
Financial structure
Leverage 47.5 53.1 50.5 51.0
Financial debts/Turnover 39.3 32.6 46.7 29.6
Bank debts/Financial debts 42.1 71.9 33.6 65.8
Short-term financial debts/Financial debts 47.4 50.9 45.7 48.0
Cost of debt 4.7 4.7 3.5 4.0
Total
Profitability
EBITDA/Operating assets 9.8 8.6 8.3 7.7
ROE 7.0 3.6 4.7 4.3
ROA 5.2 4.2 3.7 3.3
Financial structure
Leverage 49.6 60.0 50.6 55.6
Financial debts/Turnover 40.4 34.8 48.8 36.0
Bank debts/Financial debts 45.5 66.2 39.2 63.7
Short-term financial debts/Financial debts 46.1 46.6 43.9 42.3
Cost of debt 4.6 4.8 3.5 3.9
Source: Our processing of Gruppi Italiani and Cerved data.
(1) For size definitions see Table A1 in Appendix A.
10
See Figure B2 in Appendix B for a breakdown by sector.
25In both periods micro- and small-sized independent firms are found to outperform
their group-affiliated peers, a difference which becomes even larger after the crisis.
Medium-sized and large unaffiliated firms also improved their profitability in 2014,
reducing their performance gap with comparable group members. This dynamic is even
more remarkable when we take into account a close population, that consists of all firms
that remained in the dataset over the entire period of analysis.
These results could be explained through the differences in survival rates between
affiliated and independent firms: affiliated firms may have had higher survival rates due to
the internal capital market which may have helped subsidize weaker group members during
the crisis, keeping afloat firms that would have otherwise left the market; on the other hand,
independent firms – not having access to a similar reallocation channel – underwent a
severe market selection process that led the more profitable firms to survive and the
unsuccessful ones to fail. If we consider the probabilities of changing status over time given
different credit scoring levels (as defined at the beginning of the period), we find that
unaffiliated firms are more likely to exit the market than their affiliated counterparts. This
general trend can be observed across all z-score classes but the difference in transition
probabilities is much bigger for healthier firms (Table 9).
Table 9
Transition probabilities by risk class (1)
Rating in 2014
Affiliated firms Safe Solvent Vulnerable Risky Exit (no
firms firms firms firms balance sheet)
Rating in 2006 (a) Affiliated firms
Safe firms 37% 17% 5% 4% 37%
Solvent firms 11% 32% 11% 7% 38%
Vulnerable firms 3% 18% 19% 12% 47%
Risky firms 2% 7% 11% 16% 64%
(b) Unaffiliated firms
Safe firms 34% 15% 5% 4% 43%
Solvent firms 11% 27% 11% 7% 43%
Vulnerable firms 3% 16% 18% 12% 49%
Risky firms 1% 6% 10% 16% 66%
Source: Our processing of Gruppi Italiani and Cerved data.
(1) Safe firms (SCORE = 1 and 2), solvent firms (SCORE = 3 and 4), vulnerable firms (SCORE = 5 and
6), risky firms (SCORE = 7, 8, and 9). The score is computed annually using a discriminant analysis
based on a series of balance sheet indicators (assets, rates of return, debts, etc.).
26In the post-crisis phase, though both affiliated and unaffiliated smaller firms
dropped their debt levels, standalones remained more leveraged than business group
affiliated firms with greater exposure to banks and short-term debt. Large unaffiliated firms
were quite reliant on bank borrowing: the proportion of bank debts to total financial debts
was around 30 percentage points higher than affiliated firms.
On the other hand, large group members increased their leverage and reduced their
bank debts since the crisis erupted. This seems to suggest that, when external market
conditions worsened, firms in business groups started to replace bank funding with
alternative forms of financing (such as internal debts or bonds). In addition to this, larger
affiliated firms also enjoyed cheaper access to financing as compared with standalones: in
2014 the cost of borrowed capital was 0.5 percentage points lower for group members (see
Table 8).
6. Conclusions
In this paper we assess the role of internal capital markets in Italian business groups.
The functioning and importance of internal capital markets are analysed in a cohort of
domestic group-affiliated firms, comparing pre- and post-crisis periods. Our results support
the hypothesis that internal mechanisms of resource reallocation can help member firms to
access capital during periods of financial frictions.
First, we show how relevant internal capital markets are in large groups, where
affiliated firms make extensive use of intra-group debt as a source of financing alternative
to bank lending, especially in the period after the crisis. Conversely, no significant
substitution effect between external and internal funding occurs in smaller groups which
remain largely dependent upon the banking sector.
Second, we consider the position of each firm within the group and we find that
internal fund transfers follow a specific pattern, with funds usually being directed from
holding companies to other members located at the bottom of the group structure. On
average, holdings and sub-holdings have a higher leverage ratio compared with lower-
tiered firms and exhibit negative net financial positions. These findings are consistent with
our hypothesis that controlling firms internally reallocate (to other companies affiliated to
the group) the resources they are able to borrow (at a more reasonable cost) from external
27financiers. Holding companies are indeed able to borrow at a lower cost compared with
other group members.
Third, we test whether the degree of financing constraints influences the likelihood
of a group member to be a net provider (or receiver) of intra-group loans. Our evidence
suggests that internal funding is provided from unconstrained to constrained firms,
especially during the financial crisis. In short, it would seem that internal capital markets –
where available – have been used to cross-subsidize group members facing difficulties
when the crisis occurs, preventing them from being pushed out of the market.
Fourth, we identify the characteristics of those firms that supply and that obtain
intra-group loans. Providers are larger firms, with higher profits and higher external debts.
We show that resources are more likely to be exchanged internally in business groups not
specialized in a few industries: the more diversified a group is, the greater the amount of
intra-group flows that can be transferred between group members.
Finally, we perform a comparison between group and standalone firms before and
after the financial crisis. We acknowledge the role played by the internal capital markets in
supporting weaker group members, which have been given a better chance of surviving the
financial crisis. Faced with a worsening financial situation, affiliated firms have been able
to count on their peers, benefiting from group support for financing. In other words, the
activation of internal capital markets has helped group-affiliated firms (including those with
fewer opportunities to succeed) to remain in marketplace, while less efficient firms which
have not received similar assistance have instead been forced to exit.
28Appendix A
A1. Definition of corporate scope
Table A1
Firm size Description
Micro less than 10 employees and an annual turnover or total assets of up to 2
million EUR
Small less than 50 workers and an annual turnover or total assets of 2-10 million
EUR
Medium up to 250 employees and an annual turnover of less than 50 million EUR or
total assets below 43 million EUR
Large all remaining firms
Business groups are classified in the above four classes. For the purposes of the
analysis, we group together either micro and small enterprises (or groups), or medium and
large ones.
29A2. Variable definitions: firm and intra-group level
Table A2
Indicator Operationalization
Profitability
Earnings Before Interest, Revenues minus operating expenses, excluding depreciation and amortization.
Taxes, Depreciation and
Amortization (EBITDA)
Operating assets Total fixed assets plus short-term assets, excluding total financial assets,
financial receivables, cash and cash equivalent assets.
Return on Equity (ROE) Ratio of net adjusted profit (adjusted profit before taxes minus income tax paid
minus taxes on wealth and other taxes) to shareholders' equity before
dividends (shareholders' equity plus declared distributions).
Return on Assets (ROA) Ratio of current profit before financial charges (current profit before interest
and taxes plus financial income minus financial charges) to total assets.
Financial structure
Financial debts The total amount of financial liabilities towards shareholders and other
financiers.
Leverage Total financial debts divided by total equity plus total financial debts.
Cost of debt Ratio of interest paid on debt financing to total financial debts.
Bank debt exposure Ratio of total bank debts to total financial debts.
Short-term financial debts All financial debts with a residual maturity of less than one year.
KZ Index Measure of financial constraints constructed in the following way:
-1.002*Cash Flow/K+0.283*Tobin′s Q+3.139*Debt/Total Capital
-39.368*Dividends/K-1.315*Cash equivalent assets/K
Intra-group
Net financial position Intra-group financial payables minus intra-group financial receivables.
(NFP) toward the group
Net trade position (NTP) Intra-group trade payables minus intra-group trade receivables.
toward the group
A3. Performance and financial indicators
All the indicators reported in Table A2 are calculated on a yearly basis, adopting a
specific outlier treatment. We set distribution delimiters at the 5th and 95th percentiles,
keeping only those values that are contained within this range. Each value which falls
outside the interval established is replaced with a missing one.
30Appendix B
Table B1
Group composition by firm size
(a) number of active firms
Firm size
Group size
Micro Small Medium Large Total
2006
Micro 62,755 62,755
Small 21,290 29,639 50,929
Medium 9,310 7,051 10,621 26,982
Large 5,635 4,374 3,977 4,018 18,004
Total 98,990 41,064 14,598 4,018 158,670
2014
Micro 80,994 80,994
Small 27,366 34,409 61,775
Medium 10,131 7,676 10,691 28,498
Large 5,167 4,358 3,809 4,225 17,559
Total 123,658 46,443 14,500 4,225 188,826
(b) number of employees
Firm size
Group size
Micro Small Medium Large Total
2006
Micro 64,792 64,792
Small 33,118 484,807 517,925
Medium 9,061 135,303 756,052 900,416
Large 4,498 72,554 329,123 2,721,108 3,127,283
Total 111,469 692,664 1,085,175 2,721,108 4,610,416
2014
Micro 107,716 107,716
Small 48,464 584,708 633,172
Medium 12,635 153,360 751,191 917,186
Large 5,565 72,251 312,718 2,827,712 3,218,246
Total 174,380 810,319 1,063,909 2,827,712 4,876,320
Source: Our processing of Gruppi Italiani and Cerved data.
31Figure B1
Group size and holding size
(number of active firms)
Source: Our processing of Gruppi Italiani and Cerved data.
32Figure B2
Performance and financial indicators by sector
(per cent; weighted averages)
(a) ROE
(b) Leverage
(c) Bank debts over total financial debts
Source: Our processing of Gruppi Italiani and Cerved data.
33References
Almeida, H., C. Kim, and H. B. Kim, 2015. Internal Capital Markets in Business Groups:
Evidence from the Asian Financial Crisis, Journal of Finance, 70 (6), 2539–2586.
Barca, F., M. Bianchi, F. Brioschi, L. Buzzacchi, P. Casavola, L. Filippa, and M. Pagnini.
1994. Gruppo, proprietà e controllo nelle imprese italiane medio-grandi, Milano: Il Mulino.
Barca, F., and M. Becht, 2002. The Control of Corporate Europe, Oxford: Oxford
University Press.
Bertrand, M., P. Mehta, and S. Mullainathan, 2002. Ferreting Out Tunneling: An
Application to Indian Business Groups, Quarterly Journal of Economics, 117 (1), 121–148.
Bianchi, M., M. Bianco, S. Giacomelli, A. M. Pacces, and S. Trento, 2005. Proprietà e
controllo delle imprese in Italia, Bologna: Il Mulino.
Bianco, M., and G. Nicodano, 2006. Pyramidal Groups and Debt, European Economic
Review, 50 (4), 937–961.
Boutin, X., G. Cestone, C. Fumagalli, G. Pica, and N. Serrano-Velarde, 2013. The Deep-
Pocket Effect of Internal Capital Markets, Journal of Financial Economics, 109 (1), 122–
145.
Buchuk, D., B. Larrain, F. Muñoz, and F. Urzúa, 2014. The Internal Capital Markets of
Business Groups: Evidence from Intra-Group Loans, Journal of Financial Economics, 112
(2), 190–212.
Buzzacchi, L., and M. Pagnini, 1994. I meccanismi di funzionamento dei circuiti interni dei
capitali: un’indagine empirica del caso italiano, Temi di discussione del Servizio Studi, 240,
Bank of Italy.
Cannari, L., and C. Gola, 1996. La diffusione dei gruppi industriali in Italia, in VV. AA., I
gruppi di società, Milano: Giuffrè.
Cestone, G., and C. Fumagalli, 2005. The Strategic Impact of Resource Flexibility in
Business Groups, RAND Journal of Economics, 36 (1), 193–214.
Claessens, S., S. Djankov, J. Fan, and L. Lang, 2002. Disentangling the Incentive and
Entrenchment Effects of Large Shareholdings, Journal of Finance, 57 (6), 2741–2771.
Consob, 2016. Report on corporate governance of Italian listed companies, Roma.
Dewaelheyns, N., and C. Van Hulle, 2006. Corporate Failure Prediction Modeling:
Distorted by Business Groups’ Internal Capital Markets?, Journal of Business Finance and
Accounting, 33 (5–6), 909–931.
European Corporate Governance Network, 1997. The Separation of Ownership and
Control: A Survey of 7 European Countries, Preliminary Report to the European
Commission, Brussels.
Gopalan, R., V. Nanda, and A. Seru, 2007. Affiliated Firms and Financial Support:
Evidence from Indian Business Groups, Journal of Financial Economics, 86 (3), 759–795.
Gorodnichenko, Y., D. Schaefer, and O. Talavera, 2009. Financial Constraints and
Continental Business Groups: Evidence from German Konzerns, Research in International
Business and Finance, 23 (3), 233–242.
Istat, 2017. Report sui risultati economici delle imprese, Roma.
34You can also read