Swiss Re - Leading Global Re/Insurer - Company presentation as of April 2019

Page created by Julio Logan
 
CONTINUE READING
Swiss Re - Leading Global Re/Insurer - Company presentation as of April 2019
Swiss Re – Leading Global Re/Insurer
Company presentation as of April 2019
Swiss Re - Leading Global Re/Insurer - Company presentation as of April 2019
Swiss Re – Leading Global Re/Insurer

  Overview and                 Capital                 P&C and L&H                                     Corporate
  Group Strategy             Management                Reinsurance                                     Solutions
     page 4                    page 23                   page 31                                        page 41

                     Life                    Asset                    Global Re/Insurance
                   Capital                Management                   & Protection Gap
                   page 46                  page 51                         page 58

                                                                     Swiss Re Group | Company presentation | April 2019   2
Swiss Re - Leading Global Re/Insurer - Company presentation as of April 2019
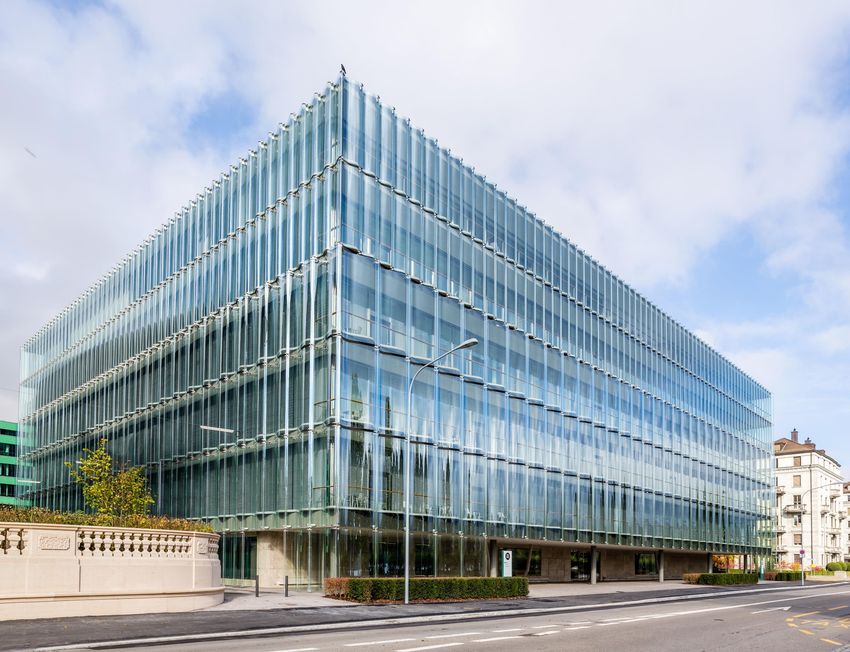
A truly global reinsurer1…                                                          Profitable long-term growth opportunities
                                                                                    •      Reinsurance market growth of 4-5%3 p.a.
               21%
                                                                                    •      Differentiation through transactions, solutions and core                                               Group financial
                                47%                                                 •      No 1 reinsurer in High Growth Markets                                                                     targets
                                                                                    •      Life Capital open book 2015-18 GPW CAGR of 30%                                                             over-the-cycle
             32%
                                                                                    •      Corporate Solutions focusing on ROE target

                                                                                    Financial strength and defensive profile                                                                             RoE ≥
        Americas          EMEA          Asia
                                                                                    •      Group SST ratio of 251%, well above target level of 220%                                                     risk free
                                                                                    •      Capital strength remains resilient to market movements                                                      +700bps
…strongly diversified2                                                              •      AA- S&P credit rating, A.M. Best A+
                 12%                                                                •      Strong diversification benefit
            9%                                                                      •      Low investment risk4
                               38%                                                                                                                                                                   ENW6 per
                                                                                    Sector-leading capital management                                                                               share growth
                40%
                                                                                    •      Net solvency capital generation of USD 2.6bn5                                                             +10% p.a.
                                                                                    •      Dividend CAGR of 8% over 2012-2018
        P&C Re          Corporate Solutions
                                                                                    •      Disciplined M&A strategy and organic deployment
        L&H Re          Life Capital                                                •      Special dividend & buy-backs of USD 6.2bn since 2014
1   Net premiums earned by region                      3   10-year outlook: 5% for P&C reinsurance and 4% for L&H reinsurance; source: Swiss Re Institute   5 Average  2014-2019
2   Economic Net Worth by segment, excl. Group items   4   93% of credit bonds are investment grade rated                                                   6   Economic net worth

                                                                                                                                                                  Swiss Re Group | Company presentation | April 2019   3
Swiss Re - Leading Global Re/Insurer - Company presentation as of April 2019
Financial highlights
Overview and Group Strategy

                              Swiss Re Group | Company presentation | September 2018   4
Swiss Re - Leading Global Re/Insurer - Company presentation as of April 2019
Swiss Re Group at a glance

                                Swiss Re is a leading and highly diversified global re/insurer,
                                          founded in Zurich (Switzerland) in 1863
    •   The financial strength1 of the Swiss Re Group is currently rated: Standard & Poor’s: AA- (stable); Moody’s Aa3 (stable); A.M. Best: A+ (stable)
    •   Swiss Re Group’s Swiss Solvency Test Ratio for 2019 is 251%
    •   AAA sustainability rating from MSCI (May 2018)

                     Reinsurance                                Corporate Solutions                                         Life Capital

    Offers traditional reinsurance products,            The commercial insurance arm of the Group          Manages closed and open life and health
    insurance-based capital market instruments          and provides risk transfer solutions to large      insurance books and provides alternative
    and risk management services globally               and mid-sized corporations around the world        access to the life and health risk pool, helping
    through two segments – Property & Casualty                                                             to generate stable returns
    and Life & Health

1   As at 26 March 2019

                                                                                                           Swiss Re Group | Company presentation | April 2019   5
Swiss Re - Leading Global Re/Insurer - Company presentation as of April 2019
Swiss Re is well diversified across geographic regions and business
segments

    Net premiums earned1 by segment                                         Net premiums earned1 by region                                                Economic Net Worth2 by segment

                         Life Capital                                                                                                                                       Life Capital
     Corporate                5%                                                                                                                                                12%
     Solutions                                                                       Asia
       11%                                                                           21%                                                                    Corporate                                    P&C Re
                                                                                                                              Americas                      Solutions
                                                     P&C Re                                                                                                                                               38%
                                                                                                                               47%                             9%
                                                      47%

      L&H Re
       37%                                                                        EMEA                                                                          L&H Re
                                                                                   32%                                                                           40%

     Swiss Re benefits from geographic as well as business mix diversification and has the ability to reallocate capital to achieve
      profitable growth

1   USD 34.5bn as at 31 December 2018; includes fee income from policyholders; does not reflect the exposure to HGMs through Principal Investments (PI)
2   Share of Swiss Re Group’s Economic Net Worth deployed across Business Units (excl. Group Items), 31 December 2018

                                                                                                                                                          Swiss Re Group | Company presentation | April 2019      6
Swiss Re - Leading Global Re/Insurer - Company presentation as of April 2019
Premium development by line of business and geography

Premiums earned and fee income by line of business                  Premiums earned and fee income by geography
(USD bn, CAGR in %)                                                 (USD bn, CAGR in %)

                                                    34.5                                                                       34.5
                                +5%                                                                   +5%
                                                    14%
                                                                                                                               21%

              25.4                                                                25.4
                                                    28%
              12%
                                                                                  20%
                                                                                                                               32%

              30%                                   10%

                                                                                  42%
              11%
                                                    27%
              21%
                                                                                                                               47%

                                                                                  38%
              26%                                   21%

             2012                                   2018                         2012                                          2018

          Property   Casualty    Specialty   Life          Health            Americas    Europe (incl. middle East & Africa)      Asia - Pacific

                                                                                          Swiss Re Group | Company presentation | April 2019       7
Swiss Re - Leading Global Re/Insurer - Company presentation as of April 2019
Our near-term priorities remain unchanged

      Swiss Re’s strategic framework                                               Near-term priorities                                 Group financial targets
                                                                                                                                                 over-the-cycle
 I
        systematically allocate capital to risk pools /                            Large & tailored transactions
                         revenue streams                          Growth
                                                                   through
                                                                                   Corporate Solutions                                              RoE ≥
 II                              III
                                                              systematic capital
                                                                  allocation       Life Capital
                                                                                                                                                   risk free
            broaden                          optimise                                                                                             +700bps
       and diversify client               resources and                            High Growth Markets
     base to increase access           platforms to support
              to risk                    capital allocation
                                                                                   Research & Development
                                                              Risk Knowledge                                                                     ENW per
                                                                                   Technology
 IV                                                           supporting capital
                                                                 allocation
                                                                                                                                               share growth
                 emphasise differentiation
                                                                                   People & Culture
                                                                                                                                                +10% p.a.

  We are a risk knowledge company that invests in risk pools

                                                                                                                   Swiss Re Group | Company presentation | April 2019   8
Swiss Re - Leading Global Re/Insurer - Company presentation as of April 2019
Based on three differentiation drivers, we have built leading insurance
businesses

                          Client                           Risk                                  Capital
                          Access                        Knowledge                               Strength

                  Reinsurance                             Corporate Solutions                             Life Capital
    P&C Reinsurance          L&H Reinsurance
                                                  • Top 5-10 in Excess Layer market       • Leading UK life & pension
   • #1 global property     • Top 2 global                                                  consolidator
     reinsurer                reinsurer           • Growing in Primary Lead segment
                                                                                          • Leading L&H B2B2C platforms in
                                                                                            core markets
   • #1 global reinsurer in High Growth Markets

                                                                                      Swiss Re Group | Company presentation | April 2019   9
Swiss Re - Leading Global Re/Insurer - Company presentation as of April 2019
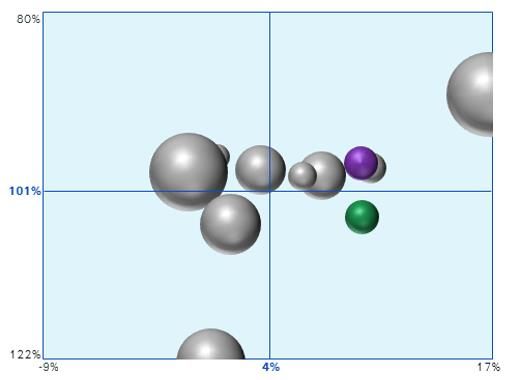
We are benefiting from a more positive current environment and
promising long-term opportunities

Current market environment improved

                            Moderate
                            improvements in P&C                            …to benefit P&C Reinsurance and Corporate Solutions                                           5%
                            pricing…
                                                                                                                                                                    overall market
                            Gradually increasing
                                                                                                                                                                       growth
                                                                           …to benefit the return profile of our investment portfolio
                            interest rates…                                                                                                                          expected1

Long-term opportunities remain

                            Risk pools continue
                                                                           …we can access global risk pools through all Business Units
                            to grow…
                                                                                                                                                                        9%
                            Opportunities in High
                                                                           …we are the #1 global reinsurer in High Growth Markets
                                                                                                                                                                   market growth
                            Growth Markets…                                                                                                                       expected in High
                                                                                                                                                                  Growth Markets1
                            Protection gap still
                                                                           …we develop innovative solutions to increase insurance coverage
                            expanding…

¹ Source: Swiss Re Institute; expected premium growth per annum in reinsurance in nominal USD terms over the next five years
                                                                                                                                        Swiss Re Group | Company presentation | April 2019   10
Focus areas of Annual Results 2018

                             •     Group net income of USD 421m for FY 2018, despite the 2018 large natural catastrophes the                                                      Impacted by large
                                   fourth highest year on sigma records in terms of large loss burden for the insurance industry                                                   losses and recent
                             •     Group investment result impacted by change in US GAAP accounting guidance (ROI of 2.8%),                                                      change in US GAAP
                                   while running yield remains stable at 2.9%                                                                                                    accounting guidance

                             •     Price quality improved by 1% and year-to-date                                                                                                   Strong outcome of
                             •     The treaty premium volume increased by 19%                                                                                                      January renewals

                             •     Life Capital transformation from closed book consolidator to dynamic primary B2B2C                                                                 Life Capital in
                                   business in motion                                                                                                                                    transition

                             •     12% regular dividend per share increase to CHF 5.60 per share
                                                                                                                                                                                  Attractive capital
                             •     New share buy-back programme1, in two tranches, consistent with Swiss Re’s capital                                                            management actions
                                   management priorities

1   Subject to AGM 2019 approval; commencement of share repurchases subject to Board approval and legal and regulatory requirements being satisfied
                                                                                                                                                      Swiss Re Group | Company presentation | April 2019   11
Second consecutive year with significantly higher than expected
large losses

                Group ROE          700bps above 10yr US govt. bonds
                Group Net Income   Impact of change in US GAAP accounting guidance                            •    After benign nat cat loss
                                                                                                                   years from 2012-2016 the
USD bn
                                                                                                                   insurance industry
  4.6                                                                                         14%                  experienced two elevated
  4.4                                                                                                              loss years
  4.2                                                                                         12%
  4.0                                                                                                         •    Estimated claims from
                                                                                              10%                  multiple nat cat and man-
  3.8
                                                                                                                   made disasters for Swiss Re
  3.6
                                                                                              8%                   amounted to USD 3.0bn in
  3.4                                                                                                              2018
                                                                                              6%
  1.0
  0.8                                                                                         4%
  0.6
  0.4                                                                                         2%
  0.2
  0.0                                                                                         0%
         2012          2013        2014          2015           2016            2017   2018

                                                                                              Swiss Re Group | Company presentation | April 2019   12
Swiss Re’s strong economic earnings track record 2014-2018

     EVM profit        USD 608m            EVM profit
                                           Economic value is created if
     new business       avg. 2014 - 2018
                                           total economic return generated   USD 503m                            Total contribution to
                                           for shareholders is above
                                           expected total return
                                                                              avg. 2014 - 2018
                                                                                                                         ENW
                                                                                                                 Represents total economic return
                                           for taking risk (capital costs)
     EVM profit                                                                                                     generated for shareholders
                       USD 77m                                                                                  (economic earnings) and is the key
     previous years’                                                                                              element of gross excess capital
                        avg. 2014 - 2018
     business                                                                                                              generation
                                            Capital cost release,
                                            debt costs and tax
                                            Includes base cost of capital    USD 2 922m
     EVM profit        USD -183m            (risk-free return and             avg. 2014 - 2018
                                                                                                                         USD 3 425m
                                            market risk premium)
     investments        avg. 2014 - 2018                                                                                    avg. 2014 - 2018
                                            and frictional capital costs

  Total contribution to ENW forms the basis for Swiss Re’s attractive capital management actions

                                                                                             Swiss Re Group | Company presentation | April 2019   13
Swiss Re’s total shareholder return is best tracked by ENW developments

    ENW per share growth vs. total shareholder return1                                                               ENW per share vs. share price development
                                                                                                                        130

                                                                                                                        120
       300%         Total return to shareholders
       250%         ENW per share growth 2                                                                              110

       200%                                                                                                             100
       150%
                                                                                                                         90
       100%
        50%                                                                                                              80
          0%
                                                                                                                         70

                             ENW per share growth2             Total shareholder return                                                          Swiss Re share price (CHF)           ENW per share (CHF)

     EVM results represent the market relevant information aligned with total return to shareholders

1 Reflects share price development and dividends paid in USD; shown on a cumulative basis and indexed from 1 December 2005
2 Calculated as: (current-year closing ENW per share + current-year dividends per share) / (prior-year closing ENW per share + current-year opening balance sheet adjustments per share); shown on a cumulative basis and indexed
from 1 December 2005

                                                                                                                                                           Swiss Re Group | Company presentation | April 2019                  14
Swiss Re proposes attractive capital management actions

Regular dividend per share (CHF)
                          +3%                     +12%
                                                                                                                   12% regular dividend per share increase
                                      5.00                    5.60
               4.85                                                                           Rebasing supported by long-term economic earnings and sustainable
                                                                                                                      capital generation

              2017                    2018                   20191

Share buy-back programme (CHF bn)                                                                               New share buy-back programme1
                                                                                                    consistent with Swiss Re’s capital management priorities
                                                                                      • Up    to CHF 1bn with no commencement pre-conditions
                                                              1.00
               1.00                    1.00
                                                                                      • Up  to CHF 1bn contingent on 2019 Group excess capital development, e.g.
                                                              1.00                      increase as a result of successful reduction of Swiss Re’s holding in ReAssure
            2017/18                 2018/19                2019/201                     to below 50%

     Very strong Group capitalisation, with Swiss Re’s Group SST ratio comfortably above the 220% target level
1   Subject to AGM 2019 approval; commencement of share repurchases subject to Board approval and legal and regulatory requirements being satisfied
                                                                                                                                                      Swiss Re Group | Company presentation | April 2019   15
Swiss Re’s capital repatriation remains peer-leading
    Dividends and share buy-back per share (CHF, CAGR in %)

                                                                                                                      +17%

                                                                                                                                                                                               9.20
                                                                                                         8.65                                                                                                               8.90
                                                                            8.00                                                                                  8.25
                                                                                                                                      7.90
                                                7.50
                                                                                                                                                                                                                                  1
                                                                                                                                                                                               4.20                         3.30
                                                                                                         4.40                                                     3.40
                                                                                                                                      3.30
                                                                            4.15
                                                4.00
                                                                                                                                     1

                   3.00
                                                                                                                                                                                                                            5.60
                                                                                                                                      4.60                        4.85                         5.00
                                                                            3.85                         4.25
                                                3.50

                   2012                        2013                         2014                        2015                         2016                         2017                        2018                        2019E
                                                                                         Ordinary dividends            Special dividends and share repurchases

     Swiss Re maintained its very strong capital position and is well positioned to respond to market opportunities while
      continuing to focus on its capital management priorities
1   Share repurchase for 2019 includes share repurchase programme of up to CHF 1bn purchase value; subject to AGM 2019 approval; commencement of share repurchases subject to Board approval and legal and regulatory requirements being satisfied;
    additional share repurchase programme of up to CHF 1bn contingent on 2019 Group excess capital development, e.g. increase as a result of successful reduction of Swiss Re’s holding in ReAssure to below 50%
                                                                                                                                                                        Swiss Re Group | Company presentation | April 2019                       16
Value creation with increasing book value and paid dividends

Book value per share and accumulated paid dividends (CHF, CAGR in %)

                                                                       +6%                      137.99                 138.57
                                                                                                                                                 131.92

                                       119.62                     121.79
                                                                                                30.35                   35.20
                                       18.50                                                                                                      40.20
                                                                   25.75

       90.76           93.26
        3.00           10.50

                                                                                                107.64                 103.37
                                       101.12                      96.04
       87.76                                                                                                                                      91.72
                       82.76

        2012            2013           2014                        2015                          2016                   2017                      2018

                                                Book value per share         Accumulated paid dividends

                                                                                                          Swiss Re Group | Company presentation | April 2019   17
Swiss Re maintains leadership in sustainability
 Key actions in 2018
                                                                                                                                                                                  Close to
               Responsible
                                                                                                                                                                            100%
                                             •     Early mover in switching to ESG benchmarks in equity and credit markets
               investing                     •     USD 1.6bn of green bonds as of end FY 2018
                                                                                                                                                                      assets considering ESG criteria

               Sustainable
               underwriting
                                             •
                                             •
                                                   Implemented thermal coal policy – 30% investment threshold extended to underwriting
                                                   Active in all renewable energy re/insurance and “lead market” for offshore wind risks
                                                                                                                                                                       ~3 400
                                                                                                                                                                      wind and solar farms insured

               Innovative
                                             •
                                             •
                                                   First county-level earthquake parametric cover in China
                                                   Largest sovereign-sponsored cat bond issued by the World Bank in Latin America
                                                                                                                                                                                96
                                                                                                                                                                      number of (sub-)sovereigns
               solutions                     •     Flood insurance for homeowners in Florida, based on proprietary flood model                                      advised on climate risk resilience

               Recognised                    •     Externally recognised: AAA-rating in MSCI ESG assessment and top 3 in DJSI
               leadership                    •     Active participation in European and global expert groups

    More public-private partnerships are crucial to strengthen resilience and mitigate effect of climate change
For further information on sustainability at Swiss Re please visit http://media.swissre.com/documents/Swiss_Re_ESG_Highlights.pdf
                                                                                                                                    Swiss Re Group | Company presentation | April 2019              18
R&D builds on our thought leadership position, bringing us
closer to the needs of our clients

How R&D drives value at Swiss Re:                                               Drivers for underwriting
                                                                                    outperformance

                                                    Insurance “beta”                                                                ~450 FTE in
  R&D improves top down                Target                        Strategic
                                                                                                                                   13 R&D teams
  capital allocation leading to         Liability                      Asset              50-60%
                                        Portfolio                      Allocation
  outperformance

                                                Insurance “alpha”

  R&D improves risk selection          Product design
  and further portfolio                Product pricing
                                        Underwriting
  steering given allocation         
                                        criteria

                                                                                                                 >200 R&D
  R&D provides services and            Client services
                                                                                                                  initiatives
                                       Thought-leadership
  thought leadership enabling           publications                                      40-50%               ongoing (50%
  higher pricing                       Curated data                                                            focusing on
                                                                                                                technology)
                                       Cost efficiency
  R&D provides new ideas to
                                       Business process
  reduce the cost of generating         disruption &
  a given unit of revenue               improvement

                                                                                                           Swiss Re Group | Company presentation | April 2019   19
Swiss Re’s tech strategy is embedded in our business strategy and
ensures effective innovation management
          1     OUR CLIENTS                                                                                                         OURSELVES           2

                   Increase our clients’ competitiveness                                           Improve our value chain
              Provide tools and solutions for clients’ value chains                        Apply technology to Swiss Re’s value chain

          Examples: Magnum, Life Guide, CatNet, Liability Risk Drivers                     Examples: ATLAS, digital claims, document intelligence

                                                                           Swiss Re
          4     OUR DATA                                                 tech strategy                                        OUR EXPOSURE              3

                     Harvest full potential of data                                                    Get closer to risk
          Build up competitive advantage from proprietary data                           Seek access to risk pools through tech platforms

          Example: Stargate platform                                                 Examples: iptiQ, elipsLife, dynamic parametric pricing platform, Pulse

  Our tech strategy is implemented with a combination of in-house developments and strategic partnerships

                                                                                                               Swiss Re Group | Company presentation | April 2019   20
Swiss Re outperforms its peers with higher margins
 Peer-leading margins                                                                          •    The differentiation approach has
                                                                                                    enabled Swiss Re to generate higher
  US GAAP net operating margins average 2012-18                                                     margins and outperform

                                  12%                                        7%                •    Swiss Re outperformed peers on
                                                                                                    average by 6%pts since 2012, driven
                                                                                                    by underwriting performance (risk
                                                                                                    selection, capital allocation and
                                                                                                    differentiation)

                            Swiss Re Group                            Reinsurance market ¹

                                Investment             Underwriting   Operating expenses

    Swiss Re is leading insurance business that represents a highly rewarding combination for shareholders

¹ Based on weighted average of Munich Re, Hannover Re, SCOR and RGA
                                                                                             Swiss Re Group | Company presentation | April 2019   21
We are committed to our over-the-cycle Group financial targets

    Group return on equity                                                                                              Group ENW per share growth2
                                                                                                                           24.6%
                   13.7%                    13.7%                                                                                       17.0%
       13.4%

                               10.5%                   10.6%
                                                                                                                                                                            11.0%
                                   9.6%                                                                                                                                                10.8%
                       9.4%                                                            9.6%
           8.8%                                 9.2%       9.4%          9.4%                             Rf +
                                                                                                                                10%         10%          10%          10%      10%         10%          10%                 10%
                                                                                                          700                                     7.2%
                                                                                                          bps1
                                                                                                                                                               5.4%
                                                                                                                                                                                                 4.4%
                                                                  1.0%          1.4%

       2012        2013         2014        2015        2016        2017         2018                    Over-             2012        2013        2014         2015        2016       2017        2018                    Over-
                                                                                                       the-cycle                                                                                                         the-cycle
                                                                                                         target                                                                                                            target
                                       actual          700 bps above 10y US Govt. bonds                                                                     actual          target

1   700 bps above 10y US Govt. bonds. Management to monitor a basket of rates reflecting Swiss Re’s business mix
2   The 10% ENW per share growth target is calculated as: (current-year closing ENW per share + current-year dividends per share) / (prior-year closing ENW per share + current-year opening balance sheet adjustments per share)

                                                                                                                                                             Swiss Re Group | Company presentation | April 2019                 22
Financial highlights
Capital Management

                       Swiss Re Group | Company presentation | September 2018   23
We remain focused on our capital management priorities

                                                                                                                                         I                                                                                  II
    Swiss Re’s capital management priorities remain unchanged                                                                                       Group SST ratio
                                                                                                                                                    SST 18        SST 19                          USD 7.9bn2
    I. Ensure superior capitalisation at all times and maximise financial                                                                           269%          251%                         ordinary dividend
                                                                                                                                                                                               (FY 14 to FY 18)
       flexibility                                                                                                                                       Rating
                                                                                                                                                                                                       Payout
                                                                                                                                                                                                               1
                                                                                                                                                        AA-/Aa3/A+                                   ratio 46%
    II. Grow the regular dividend with long-term earnings, and at a
        minimum maintain it
                                                                                                                                                               Capital management priorities
                                                                                                                                        IV                                                                                  III
    III. Deploy capital for business growth where it meets our strategy and
         profitability requirements                                                                                                                   USD 6.2bn3
                                                                                                                                                   special dividend &
                                                                                                                                                        buy-back
                                                                                                                                                    (FY 14 to FY 18)
    IV. Repatriate further excess capital to shareholders
                                                                                                                                                       Extraordinary
                                                                                                                                                     Payout ratio 36%1                       Business        Acquisitions
                                                                                                                                                                                        reinvestments

1 Payout ratio
             calculated as capital repatriation over total contribution to ENW; assumes AGM approval of the proposed ordinary dividend of CHF 5.60 per share and the unconditional share buy-back of up to CHF 1bn
2 Includes AGM 2019 proposal for ordinary dividend of CHF 5.60 per share
3 Includes AGM 2019 proposal for unconditional share buy-back programme of up to CHF 1bn

                                                                                                                                                             Swiss Re Group | Company presentation | April 2019              24
Group capital position remains very strong, even after significant large
losses and continued peer-leading capital repatriation to shareholders
SST ratio development (USD bn, %)
                                                                                                                                            • Group SST ratio remains very strong and
                                                                                                                                              comfortably above the 220% target level
                                                                                       269%
                            261%                             262%
       80.0

                                                                                                                              251%          • The SST ratio decreases by 18%pts mainly
                                                                                                                                              due to lower risk-bearing capital reflecting
       70.0

  SST target
capitalisation1
       60.0                                                                                                                                   capital repatriation, redemption of a
   (220%)                                                                                                                                     subordinated instrument and depressed
                                                                                    46.3
                 44.8                              46.1
                                                                                                                                              financial markets at year-end 2018. These
       50.0

                                                                                                                      40.6
       40.0                                                                                                                                   effects are partly offset by positive
       30.0
                                                                                                                                              contributions from underwriting activities
       20.0                    17.2                              17.6                             17.2                              16.2    • Increase in MVM mainly driven by growth in
                                                                                                                                              Asia
       10.0

                                                                                                                                            • Swiss Reinsurance Company Ltd solo ratio
                                                                                                                                              also remains strong at 218% with USD
         0

                        2016                              2017                             2018                              2019

                 USD 5.3bn MVM                     USD 5.2bn MVM                    USD 5.9bn MVM                     USD 7.0bn MVM           14.3bn excess capital above the 100%
                                                                                                                                              regulatory requirement
                                           SST available capital                      SST economic target capital

                                                Group SST ratio calculation
                               SST available capital        SST risk-bearing capital - MVM2
                        SST economic target capital
                                                                 =        SST target capital - MVM2

1   SST 220% target capitalisation was only introduced in 2017
2   MVM = Market Value Margin = Minimum cost of holding capital after the one-year SST period until the end of a potential run-off period
                                                                                                                                             Swiss Re Group | Company presentation | April 2019   25
Swiss Re’s capital strength remains resilient to market movements

Group SST sensitivities
                                                                              • Swiss Re uses a central proprietary risk model to
          Resulting estimated Group SST ratio 2019                              measure capital requirements, define risk
                                                                                tolerance, risk limits and assess stress test
                                                                                impacts
          Equity markets (-25%)                              248%
                                                                              • Swiss Re remains strongly capitalised under strict
          Equity markets (+25%)                                   254%          risk limits curtailing the impact of market moves
                                                                                on the Group SST ratio
          Interest rates (-50bps)                        239%

          Interest rates (+50bps)                                      261%

          Credit spreads (-50bps)                                     259%

          Credit spreads (+50bps)                          244%

          Real estate values (-25%)                        245%

          Real estate values (+25%)                                   257%

                                           220%             251%
                                      Group SST target    Group SST
                                        capitalisation      2019

                                                                                       Swiss Re Group | Company presentation | April 2019   26
Swiss Re maintains a leading capital position in the reinsurance sector and
industry
    Group SST to Solvency II walk1
                                                                                                                                                                            >280%
                                                                                                                                                                             311%

             251%
                                                                                                                                                                                                       239%
                                                                                                                                                                                                                                210%

          Group SST                 Risk measure         Modelling differences             Valuation             Eligibility of capital       Deferred taxes          Group Solvency II              Average of              Average of
          ratio 2019                (1-year risk)                                        (discounting)                                                                      ratio                    reinsurers2              insurers3

     SST and Solvency II are both comprehensive economic and risk-based solvency regimes
     Due to important differences, Solvency II equivalent ratio is significantly higher
     For 2019, our comparable Group Solvency II ratio is estimated to be >30%pts higher than our Group SST ratio
1 Comparison was produced on a best effort basis using Swiss Re's SST calculation for 2019; For more details on differences between SST and Solvency II please refer to our “SST vs. Solvency II – comparison analysis” published on our website
(http://media.swissre.com/documents/2016_sst_presentation.pdf). Please note that the difference from “capital cost recognition” has been eliminated in 2017 with FINMA's change in SST ratio definition. Differences between SST and Solvency II also
explained in the booklet “Measuring economic performance & solvency at Swiss Re” published on our webpage.
2 Average of Munich Re, Hannover Re, SCOR
3 Average of Allianz, Aviva, Axa, Generali

                                                                                                                                                                            Swiss Re Group | Company presentation | April 2019                          27
Strong solvency capital generation over the last five years
Swiss Re’s solvency capital generation – five year aggregated view from Group SST 2014 to 2019
                                                                                                                                                                                                More details on following slides

             17.1                                                                                                                                      Capital management
                                             -2.8                                                             12.8
                                                                              -1.5
                                                                                                                                                -3.2

                                                                                                                                                                               -14.0

                                                                                                                                                                                                                 -4.4
    Economic earnings               Capital deployment             Other items (incl.      fx)2        Net solvency                      Change in                     Capital   repatriation3              Change in
    (Total contribution             (capital allocation)1                                            capital generation             supplementary capital                                                 excess capital
         to ENW)
                                                                                                                                                                                                              yearly average
            CHF 11                                                                                            CHF 8                                                            CHF 9
                                                                                                                                                                                                                per share

    • Solid economic earnings (USD 3.4bn on average) drove Swiss Re’s strong solvency capital generation over the last five years (USD 2.6bn net solvency capital
      generation on average per year or CHF 8 yearly average per share)
    • In line with its target capital structure, Swiss Re reduced its traditional funded subordinated debt instruments by USD 3.2bn and at the same time strengthened its
      financial flexibility through the issuance of USD 2.7bn of pre-funded subordinated debt facilities at Group level (not counting as SST supplementary capital until
      drawn)
    • Over the period, Swiss Re implemented peer-leading capital repatriation of USD 14bn in total or USD 2.8bn per year, on average
1 Including model changes
2 SST available capital: includes change in other EVM items (including foreign exchange impacts on ENW) and change in SST valuation differences with EVM on a best effort basis; SST economic target capital: includes foreign
  exchange, interest rate and other impacts on Swiss Re’s economic target capital on a best effort basis
3 Includes the sum of paid (2015 – 2018) and proposed 2019 dividends and public share buy-backs (a pro-rata share of the 2019 share buy-back programme with no commencement pre-conditions of CHF 0.9bn is used)

                                                                                                                                                             Swiss Re Group | Company presentation | April 2019                  28
Swiss Re’s target capital structure and financial flexibility is supported by
the Group’s strong funding platforms

Implementation and maintenance of target capital structure
USD bn                                                                Established funding platforms in all Business Units to fund capital & liquidity requirements
                                                                          Corporate             Life                Group
                                                    Reinsurance                                                                        Outlook
    YE 2012 – YE    20181                                                 Solutions            Capital              (SRL)
                                                                                                                                     Continued focus on optimising capital structure and
Subordinated debt                                        -2.02              +0.5
                                                                                                                                     cost of capital
                                                                                                                                     Continued focus on innovative, cost efficient
Contingent capital                                        -0.23                                                     +3.24            contingent capital instruments at Group Holding level

                                                                                                                                     Support business growth in Life Capital in line with
    Senior debt                                           -6.9                                  +1.5
                                                                                                                                     leverage targets

    Letters of credit                                     -4.5                                                                       In line with Reinsurance requirements

•    SST supplementary capital includes traditional funded subordinated debt and funded contingent capital instruments. In line with Swiss Re’s target capital structure,
     Swiss Re has reduced its traditional funded subordinated debt instruments by USD 1.5bn between YE 2012 and YE 2018
•    At the same time, the Group has significantly strengthened its financial flexibility through senior debt deleveraging and the issuance of USD 1.0bn contingent capital
     instruments at the Reinsurance level, a USD 0.5bn contingent capital instrument at the Group level (6-year non-dilutive senior exchangeable bond with anytime issuer
     stock settlement) and USD 2.7bn pre-funded subordinated debt facilities at Group level (not counting as SST supplementary capital until drawn)

1 Change in supplementary capital is calculated using YE 2012 and YE 2018 figures
2 EUR 750m and USD 1bn subordinated fixed rate reset set-up callable notes issued in March and April 2019, respectively (not included in the table)
3 Reflects the issuance of USD 1.0bn in 2013 and redemption of the contingent capital instruments classified as equity issued in 2012 (USD 1.1bn)
4 Reflects USD 2.7bn pre-funded subordinated debt facilities (currently fully undrawn), and USD 0.5bn senior non-dilutive exchangeable bond with anytime issuer stock settlement

                                                                                                                                                           Swiss Re Group | Company presentation | April 2019   29
Peer-leading capital repatriation

    USD bn                                        in year paid                                     Ordinary dividends                                         Special dividends and share buy-backs
                                                                                                       USD 7.9bn                                                            USD 6.1bn

                                                                                      1.5       1.6          1.6         1.6         1.7                        1.5                            1.3
                                                                                                                                                                             1.1     1.1               1.0

                                                                                     2015      2016      2017        2018 2019E2                               2015      2016       2017      2018 2019E2

                                                      Per share in CHF               4.25      4.60       4.85        5.00           5.60                       4.40      3.30      3.40      3.80    3.35

               14.0                                                                                                                                 Swiss Re

     Capital repatriation                             P&C Reinsurance                              L&H Reinsurance                             Corporate Solutions                             Life Capital
    Group SST 2014-19¹
                                                2.7       2.5
                                                                   2.0
                                                                             1.3                                                                                                                       1.1    1.1
                                                                                             0.3       0.4         0.7         0.7                   0.3                              0.4       0.4
                                                                                                                                             0.2             0.2       0.1
                                              2015       2016     2017      2018            2015      2016         2017    2018             2015    2016   2017       2018          2015      2016    2017    2018

                                                                                                                                            Received capital contribution           Received capital contribution
                                                                                                                                               of USD 1bn in 2017                   of USD 1.6bn in 2016 for the
                                                                                                                                                                                       acquisition of Guardian

1   Capital repatriation includes dividends and share buy-backs paid in 2015-18 and projected for 2019
2   Capital repatriation includes AGM 2019 proposal for ordinary dividend and new unconditional share buy-back programme of up to CHF 1bn, of which a pro-rata share of CHF 0.9bn is used for SST

                                                                                                                                                           Swiss Re Group | Company presentation | April 2019        30
Financial highlights
P&C and L&H  Reinsurance

                           Swiss Re Group | Company presentation | September 2018   31
We seek to benefit from a more positive environment and promising long-
term opportunities in the reinsurance market
Market environment improved

   Moderate improvements in P&C reinsurance pricing developments

                                                                                                                                                               5%
   Gradually increasing interest rates benefit our long tail lines in Life and Casualty                                                                   overall market
                                                                                                                                                            growth1
   Global economic growth increases demand in and from primary markets

Long-term opportunities remain

   #1 global reinsurer in High Growth Markets, well positioned to take advantage of
   projected growth
                                                                                                                                                           Mortality
   Growth from innovative solutions to address the global protection gap                                                                                protection gap
                                                                                                                                                       > USD 270 billion
   As a knowledge company we benefit from the growing importance of R&D and technology

1 Source: Swiss   Re Institute, expected growth per annum in reinsurance in nominal USD terms over the next five years

                                                                                                                         Swiss Re Group | Company presentation | April 2019   32
Differentiation is at the heart of what we do

             Core                        Transactions                    Solutions

                                                                                                                     Differentiation
       Simplify and drive                                            Add value to clients’
                                    Deliver innovative deals by
       efficiencies in our                                           original business by
                                    combining our knowledge
      traditional business                                          providing tech enabled
                                            and capital
                                                                           solutions

  We access risk pools through the three pillars of our strategy

                                                                                     Swiss Re Group | Company presentation | April 2019   33
We leverage technology in solutions to add value to our clients’ original
business and value chain

                                   Selected examples of commercialised solutions in P&C and L&H Reinsurance
  Pilot / Proof of concept
  With clients and partners

                                      Automotive         Parametric           Smart                     SwiftRe®                    Magnum
                                       Solutions                              Homes
          Development
        Build resources and
          infrastructures

           Commercialisation                                    Customer
          Bring to market viable                                                      Liability                        Claims
                                            Life Guide          Retention
                 solutions                                                            Analytics                       Deep Dive
                                                               Management

  Our innovation mind-set allows us to focus on commercialisation of proven solutions

                                                                                         Swiss Re Group | Company presentation | April 2019   34
Swiss Re’s reinsurance client franchise represents the biggest source of
our competitive advantage

We have strong direct relationships with our customers…         Direct relationships drive our access to large & tailored
                                                                transactions
 P&C Reinsurance                             L&H Reinsurance    EVM profit - new business (USD m)

                   % of premiums from non-
      47%          intermediated business,         96%                                            CAGR 16%
                           FY 2018                              700

                                                                600

                                                                500
…with distinct client interactions
                                                                400
Client example
                                                                300

                                                                200

                                                                100
                                                     Americas
                                                     APAC         0
                                                     EMEA              2010   2011   2012    2013      2014    2015     2016     2017      2018
 Swiss Re
                                                                                     P&C Reinsurance        L&H Reinsurance

                                                                                      Swiss Re Group | Company presentation | April 2019     35
We have significantly grown and diversified our portfolio

Portfolio developments 2010-18
EVM premium (USD bn)                                                                                                                      Overall portfolio
                   Americas                                EMEA                                 Asia                                     CAGR of 7% from
                                                                                                 CAGR 21%                                 2010 to 2018
                                                                                                            15.4
                    CAGR 7%

                              12.6                          CAGR 4%
                               3%                                                                           43%
                                                                      10.9

                              34%                                     16%
                                                                                                                                  Balanced global portfolios
             7.4                                     7.8
                              3%                                      22%
             1%                                      12%
                                                     17%                                                    31%
                                                                      15%
             50%              36%
                                                     21%
                                                                      28%                 3.3               4%
              3%                                                                                   18%
             18%                                     24%                                  27%
                              9%                                                                   12%      11%
             16%                                     10%               7%                          9%       5%
             12%
                              15%                    16%              12%
                                                                                          20%
                                                                                                   14%      6%                     Increased diversification
            2010              2018               2010                 2018                2010              2018                        of product lines
                                Property   Nat Cat         Casualty    Specialty   Life   Health

                                                                                                                   Swiss Re Group | Company presentation | April 2019   36
Net premiums earned                                        Net operating margin1 (%)                      Combined ratio (%)
                                                                                                                                                                               111.5

                                                                                                                                                                                        104.0
                                                                          +5.6pts

                                                                                           4.3                                                                  93.5
                                                                                           2.9

USD 16.1bn
                                                                                                                            83.8      83.7
                                                                                                                   80.7                              85.7
                                                                8.9                        7.8
                                                                                                                   2012     2013     2014         2015         2016            2017     2018
in 2018
                                                                -3.9
                                                                                          -6.4
                                                                                                            • Net impact of large nat cat events in 2018 5.0%pts above
USD 16.7bn
in 2017
                                                                -6.3                                          expectations. Favourable prior-year development positively
                                                                                                              impacted the combined ratio by 0.9%pts
                                                                -1.3
                                                            2017                         2018

                                                         Underwriting   Investment   Operating expenses
                                                                                                          Net income (USD m, LHS), Return on equity (%, RHS)

  • Decrease of net premiums earned driven by a reduction of Chinese quota shares and                     4 000      26.7     26.0     26.7                                                     30
                                                                                                                                                   22.4
    US Casualty, partially offset by large transactions in Asia and the US                                3 000
                                                                                                                                                                                                25
                                                                                                                                                                 16.4                           20
  • Underwriting margin impacted by several large losses in both periods                                  2 000                                                                                 15
                                                                                                                             3 228     3 564
                                                                                                                    2 990                         3 008
  • Decrease in investment margin driven by market value losses on equity securities                      1 000                                                 2 100                           10
                                                                                                                                                                                         3.7
    and lower realised gains from fixed income securities                                                                                                                               370
                                                                                                                                                                                                5
                                                                                                              0
                                                                                                                                                                                 -413           0
  • Increase in the expense margin driven by the decrease in premiums earned                                                                                                 -3.5
                                                                                                          -1 000                                                                                -5
                                                                                                                     2012    2013      2014        2015         2016            2017    2018

                                                                                                                                     Net income           Return on equity
             1   Net operating margin = EBIT / total revenues                                                                 Swiss Re Group | Company presentation | April 2019                37
P&C Reinsurance strategy in action
Portfolio split by region and line of business          CORE
(% of net earned premium, USD bn)                       US GAAP operating expenses (USD m)

                                                                           -3.9%
                                                                                                       • Leveraging technology to achieve efficiency
                                      Americas                 1 159                  1 114              across Swiss Re’s value chain
       22%
                                      EMEA
                                                                2017                  2018
                                      Asia
                      48%
                                                        SOLUTIONS – selected examples
      30%                                                       ADAS risk score                                 Data analytics
                                                                Working with OEM partners to                    Addressing strategic questions
                                                                improve the risk assessment of                  through a combination of the latest
                                                                increasingly automated vehicles                 data science methods with
                                      Property                                                                  bespoke advisory
          6% 3%                       Liability
     5%   3% 3%                       Motor             TRANSACTIONS
                      37%
                                      A&H               Economic profit (USD m)
                                      Marine
                                                        200                   +5%
    23%                               Engineering                                                      • >130 transactions closed in 2018
                                      Credit            100                                            • Transactions contributed ~23% to
               20%                    Other specialty                                                    economic profit in 2018
                                                          0
                                                                   2017                 2018

                                                                                                  Swiss Re Group | Company presentation | April 2019   38
Net premiums earned                                          Net operating margin1 (%)                              Running yield and ROI (%)
                                                                                                                                                   3.8
                                                                                                                                     3.5                           3.5             3.4           3.3          3.4
                                                                                                                        3.2
                                                                                -3.7pts
                                                               13.1                                                     4.7
                                                                                                                                     4.1                                                         4.3
                                                                                                                                                                   3.4             3.6                        3.7
                                                                                                                                                   3.2

USD 12.7bn
                                                               4.8                                  9.4
                                                                                                    3.3

in 2018                                                                                                                2012          2013          2014            2015           2016          2017      2018
                                                               13.7                                                                                Running yield            ROI
                                                                                                   11.4

USD 11.9bn
in 2017
                                                               -5.4                                 -5.3
                                                                                                                      • Slightly increasing running yield but lower ROI as prior period
                                                                                                                        positively impacted by significant net realised gains

                                                              2017                                 2018

                                                          Underwriting       Investment       Operating expenses
                                                                                                                    Net income (USD m, LHS), Return on equity (%, RHS)

  • Increase in premiums earned reflected growth across all markets including large                                 1 500
                                                                                                                                                                    16.2                      15.3
                                                                                                                                                                                                                    20

    transactions in Asia, intra-group retrocession agreements and favourable fx                                     1 000
                                                                                                                                                                                  12.8
                                                                                                                                                                                                       11.1         15
                                                                                                                              8.9
                                                                                                                                                                                                                    10
  • Decrease in underwriting margin due to unfavourable mortality experience in the                                   500
                                                                                                                                             6.4
                                                                                                                                                                     968                      1 092
                                                                                                                              739                                                  807                 761
    US, partially offset by favourable contribution from transactions                                                                       420                                                                     5
                                                                                                                        0
                                                                                                                                                                                                                    0
  • Lower investment margin as prior period was positively impacted by significant net                                                                   -462
                                                                                                                     -500
    realised gains from sales of equity securities                                                                                                                                                                  -5
                                                                                                                                                            -7.9
                                                                                                                    -1 000                                                                                          -10
                                                                                                                              2012          2013      2014          2015          2016        2017     2018

                                                                                                                                                   Net income              Return on equity
             1   Net operating margin = EBIT / (total revenues – net investment result unit linked & with profit)                           Swiss Re Group | Company presentation | April 2019                      39
L&H Reinsurance strategy in action
Portfolio split by region and line of business              CORE
(% of net earned premium, USD bn)                           US GAAP operating expenses (USD m)

                                                                               0.5%
                                                                                                                • Despite strong growth in the last years,
                                                                    754                    758                    expense base remained stable
                                         Americas
      26%                                EMEA
                                                                    2017                   2018
                      43%                Asia
                                                            SOLUTIONS – selected examples
                                                                    Magnum                                               Behavioural economics
          30%                                                       Used by >60 insurers and                             Creating improvements across the
                                                                    available in 26 countries; processes                 insurance value chain by helping to
                                                                    more than 12m applications per                       enhance the way insurers connect
                                                                    year; >1.3m devices in China                         with customers
           10%
      6%                                 Mortality
                                                            TRANSACTIONS
                                         Disability
    11%                                                     Economic profit (USD m)                             • 24 transactions closed in 2018
                                         Critical Illness
                                                                                                                • Transactions contributed ~38% to
                      62%                Medical            600                  +86%
     11%                                                                                                          economic profit in 2018
                                         Other              400
                                                                                                                • Large and tailored deals in Asia drove
                                                            200
                                                                                                                  transactional growth in 2018
                                                              0
                                                                       2017                 2018

                                                                                                           Swiss Re Group | Company presentation | April 2019   40
Financial highlights
Corporate Solutions

                       Swiss Re Group | Company presentation | September 2018   41
2018 Corporate Solutions result impacted by large man-made and nat cat
losses
Net premiums earned                                         Net operating margin1 (%)                       Combined ratio (%)
                                                                                                                                                                             133.4

                                                                           +12.4%pts                                                                                                 117.5

                                                                                              1.9                                                         101.1
                                                                 7.4                          5.4                  96.2    95.1      93.0         93.2

USD 3.9bn
in 2018
                                                                 -11.7
                                                                                             -18.4                 2012    2013     2014          2015       2016            2017    2018

                                                                 -19.2                       -11.1
                                                                                                              • Profitability continues to be impacted by underwriting
USD 3.7bn
in 2017
                                                                 -23.5
                                                                                                                performance, driven by an increase in severity and frequency of
                                                                                                                large man-made losses, and generally depressed rate levels, as
                                                                 2017                        2018               well as unfavourable prior-year development

                                                          Underwriting   Investment    Operating expenses
                                                                                                            Net income (USD m, LHS), Return on equity (%, RHS)

  • Premiums earned increased by 7.5% driven by growth in Primary Lead which more                           400              9.6     12.5
                                                                                                                                                  15.5                                       20
    than offset active pruning in US General Liability portfolio                                                    7.4                                        6.0
                                                                                                            200                       319          357                                       10
                                                                                                                    196     279
  • Underwriting margin improved driven by lower nat cat losses, partially offset by an                       0
                                                                                                                                                              135
                                                                                                                                                                                             0
    increase in severity and frequency of large man-made losses
                                                                                                            -200                                                                     -405    -10
  • Investment margin decreased due to lower realised gains from equities, partially                        -400                                                             -741            -20
    offset by increasing yields and a higher invested asset base                                                                                                                     -19.4
                                                                                                            -600                                                     -32.2                   -30
  • Operating expense margin improved driven by strong growth and continued focus                           -800                                                                             -40
    on productivity measures                                                                                        2012    2013     2014         2015        2016           2017    2018

                                                                                                                                     Net income          Return on equity
              1   Net operating margin = EBIT / total revenues                                                               Swiss Re Group | Company presentation | April 2019              42
Addressing Corporate Solutions underperformance

        Drivers of underperformance                                                        Actions taken

       •     Difficult market environment: man-                                            •       Portfolio pruning started in 2017,
             made losses above expectations                                                        continued in 2018 and
             and price improvements not yet                                                        intensifying in 2019
             sufficient after years of decline
                                                                                           •       Continued focus on productivity
       •     Higher net exposures led to large                                                                                                               Business update to
             single event losses                                                           •       Higher prices already                                      be provided with
       •     Unfavourable PYD related to
                                                                                                   experienced and expecting more                              Half-year 2019
             structure1 and business mix                                                                                                                           Results
                                                                                           •       Reinsurance programme
             (Excess Layers and overweight
                                                                                                   adjusted but to be revisited
             US)

       •     High cost ratio because of on-                                                •       New experienced CEO started in
             going investments and continued                                                       March 2019
             lack of scale

    Progress has been made and we will continue to address Corporate Solutions underperformance
    Corporate Solutions remains core to Swiss Re and we continue to see long-term attractive potential in the business
1: Positive development on Corporate Solutions historical loss reserves remaining in Reinsurance

                                                                                                                                        Swiss Re Group | Company presentation | April 2019   43
Corporate Solutions remains focused on key priorities
Performance improvement actions                       Increase productivity                             Primary Lead
• US General Liability pruning actions started 18     • A combination of process improvements, cost     • Extension of own domestic and international
  months ago; time lag for improvements to be           saving measures, use of technology and strong     Primary Lead producing capabilities to 19 and 9
  reflected in financials                               growth led to a lower operating expense ratio     countries respectively

• Additional improvement actions initiated for less   • Maintain focus on productivity to finance       • Global network coverage for international programs
  strategic segments which are further minimised or     continuing investment into Primary Lead           > 120 countries
  partially exited                                      capabilities

• Pursue sizable rate increases on underperforming
  sub-segments and across the board

US General Liability repositioning / pruning           Operating expense ratio (%)
(Gross premiums written)
                                                      22%

                    -30%                              21%

                                                      20%       21.7
                                                                            20.8
                                                      19%
                                                                                        19.4
                                                      18%
       2016        2017         2018                            2016        2017        2018
                                                                                                                             Own offices   Network partners

  Positive price momentum expected to continue
  Corporate Solutions will continue to take targeted actions addressing business performance issues and price deficiencies

                                                                                                        Swiss Re Group | Company presentation | April 2019    44
Corporate Solutions has shown disciplined performance within its peer-
group

                                           2012 – 2017                                                                                                       Average 2012 – 2018

                        2012                          2013                          2014

                                                                                                                                         Combined ratio
      Combined ratio

                       2015                          2016                           2017

                                                                                                                                                                             Gross premiums growth

                                                                                                                                           Corporate Solutions (Combined Ratio incl. Total financial contribution - TFC)
                                                                                                                                           Corporate Solutions (Combined Ratio published)
                                         Gross premiums growth                                                                              Peers

Source: Swiss Re Institute
Note: Quadrants are determined based on average combined ratio and gross premiums compound annual growth rate (CAGR); premium growth & bubble size are in USD; Size of bubbles corresponds to GPW; From 2011-2014: Unchanged set of 8 peers,
2015: peer group reduced to 7 due to M&A. 2016: 10 peers, 3 players added to ensure comparison is representative of market

                                                                                                                                                                    Swiss Re Group | Company presentation | April 2019                     45
Financial
Life Capitalhighlights

                         Swiss Re Group | Company presentation | September 2018   46
UK life & pension closed book                                  Group protection solutions through                               White-labelled individual protection products
Business    consolidator                                                   intermediaries                                                   through distributors

            Protection, annuities, unit-linked
Products    insurance
                                                                           Group life, disability, income protection                        Individual life, health and non-life protection

                                                                           Pension providers, pension funds, corporates
Clients     Insurers, banks, PE firms
                                                                           and affinity groups
                                                                                                                                            Distribution partners

           UK Closed Book Market Reserves                                 Group L&H Market GPW                                              Individual L&H       P&C personal lines

                            ~ USD 440bn                                                    ~ USD 150bn                                                              ~ USD
                                                                                                                                                                      ~ USD
                                                                                                                                                                          650bn
                                                                                                                                                                            920bn

                                                                                                                                            ~
                                                                                                                                            ~ USD
                                                                                                                                              USD 300bn
                                                                                                                                                  300bn

                                   14%                                                            1%
ReAssure developments in 2018…                 …complemented by open book evolution                                            2019 outlook

                                                                                                                          Focus on
                                                                                      # new policies               ReAssure IPO preparation
                                                                  # iptiQ             written in iptiQ
                                         elipsLife premium      distribution 120k
                                         volume (USD m)          partners

                                                                                                                         Enhancing access
                                                                    19
                                         450

   Exceptional GCG: USD 818m
                                                                    in 2018
                                                                                                                            to risk pools
                                                                                                                         with iptiQ platform
   MS&AD stake increased to 25%         300

                                                                      5
                                                                              60k

   IPO preparations continued           150                        in 2016

                                                                      2                                                      Scale-up of
   New Chairman and new CEO appointed    0
                                           2009    2014      2018
                                                                    in 2014    0
                                                                               2014    2016         2018
                                                                                                                          elipsLife platform

                                                                                                     Swiss Re Group | Company presentation | April 2019   48
Exceptional Life Capital GCG; open book growth in line with expectations
Gross cash generation (USD m)                                                Open book - Gross premiums written (USD m)

  1196

                                                           998                                                                                     1 567
                         945
                                                                      818                                      CAGR 30%
                                               721
                                                                                                                             1 039
              521                   543                                                                  868
                                                                                   709

  2012       2013       2014        2015       2016       2017        2018         2015                 2016                 2017                  2018

 • Exceptional gross cash generation (GCG) driven by strong underlying        • Gross premiums written increase reflects significant growth in open
   emerging surplus, the sale proceeds from the initial 5% stake in             book businesses:
   ReAssure acquired by MS&AD and the finalisation of the 2017 Solvency
   II position                                                                      –     iptiQ L&H increase driven by a large medex transaction
                                                                                    –     elipsLife increase reflects strong growth on core as well as
 • GCG 2016-2018 of USD 2.5bn at top end of USD 2.3-2.5bn target
                                                                                          medex business
   range (significantly outperforming original target of USD 1.4-1.7bn)

                                                                                                       Swiss Re Group | Company presentation | April 2019   49
Life Capital open book businesses continue to grow
                                                                2016     2018

                                Weekly
                                policies sold1                   545
                                                                         2 755
                                                                                   ~ 5x
                                # of                                                                       Expansion of access to
                                distribution
                                partners
                                                                  5      19        ~ 4x                     attractive risk pools

                                # of countries                    5       7        +2

                                GPW2
                                (USD m)                          247
                                                                          412
                                                                                   + 67%
                                                                                                           Ambition to continue
                                # of clients                  < 8 000   ~ 12 000   + 50%                 growing at an accelerated
                                                                                                                   pace
                                # of countries                    2       5        +3
      1   Weekly policies sold in Q4 2016 and Q4 2018, respectively                        Swiss Re Group | Company presentation | April 2019   50
      2   Reflects core business, i.e. excludes medex business
Financial highlights
Asset Management

                       Swiss Re Group | Company presentation | September 2018   51
Swiss Re’s investment portfolio
                                                                                                                         Other investments (incl. policy
                                                                                                                                                         Cash and cash equivalents
                                                                                                                                     loans)
                                                                                                           Mortgages and other                                     4%
                                                                                                                                       5%
                                                                 End                                             loans                                        Short-term investments
                                                                                                                  4%                                                    4%
USD bn                                                       FY 2018
                                                                                                                   Equities
Balance sheet values                                           153.3                                                 5%

    Unit-linked investments                                    -25.9                                                                                                 Government bonds
                                                                                                                                                                           41%
    With-profit business                                         -4.8
Assets for own account                                         122.6
(on balance sheet only)                                                                                      Credit bonds
                                                                                                                37%

                                                                                                     Corporate                 Life                                                    End           End
USD bn                                                                        P&C Re        L&H Re   Solutions              Capital    Group items       Consolidation            FY 2018       FY 2017
Cash and cash equivalents                                                        1.7           1.7         0.8                 0.4              0.2                   -                4.8           4.9
Short-term investments                                                           2.5           1.2         0.5                 1.2                 -                  -                5.4           4.8
Government bonds                                                                25.8          13.1         5.5                 6.5                 -                  -               50.9          54.7
Credit bonds                                                                    10.2          16.1         2.7                16.1                 -                  -               45.1          47.1
Equities1                                                                        3.2           0.7         0.2                 0.1              2.1                   -                6.3           7.1
Mortgages and other loans                                                        7.5           1.8            -                1.8              4.3             (10.9)                 4.5           4.0
Other investments (incl. policy loans)                                           4.4           1.3         0.1                 0.8              0.4               (1.4)                5.6           9.1
Total                                                                           55.3          35.9         9.8               26.9              7.0              (12.3)              122.6         131.7

                 1   Includes equity securities, private equity and Principal Investments                                                  Swiss Re Group | Company presentation | April 2019       52
Return on investments (ROI)                            Investment portfolio positioning (USD bn)                                 Net investment income (USD m, LHS)
                                                                                                                                 Running yield (%, RHS)
                                                         140
                                                                          128.0
                                                                                                             122.6
                                                         120               9.8                                                           3.2       3.2        3.3
                                                                                                              10.2              4 000                                                                            3.5

 2.8% 3.3%1
                                                                                                                                                                         3.0       2.9           2.9      2.9
                                                         100                                                                                                                                                     3.0
                                                                             52.9                              49.3             3 000
                                                           80                                                                                                                                                    2.5
 in 2018                                                                                                                                                                                                         2.0
                                                           60                                                                   2 000
                                                                                                                                        3 610                3 386                                       3 396   1.5
                                                                                                                                                  3 178                           3 099        3 132
                                                           40                53.2                              51.1                                                     2 860
                                                                                                                                                                                                                 1.0
                                                                                                                                1 000
                                                           20

 3.9%
                                                                                                                                                                                                                 0.5
                                                                                11.2                              11.0
                                                            0          0.9                               1.0                       0                                                                             0.0
                                                                                                                                        2012      2013       2014       2015      2016          2017     2018
                                                                          2017                               2018
  in 2017                                                             Cash and short-term investments
                                                                                                                                                          Net investment income          Running yield
                                                                      Government bonds
                                                                      Credit investments
                                                                      Equities and alternatives (incl. Principal Investments)
                                                                      Other

 • ROI driven by net investment                        • No significant net changes in the asset allocation                         • Net investment income of USD 3.4bn above prior year,
   income, partially offset by market                                                                                                 reflecting the impact of rising yields as well as additional
   value losses across equities and                    • Net purchases and market value gains on direct                               income from alternative investments
   alternative investments                               real estate largely offset by market value losses
                                                         on equity securities                                                       • Group fixed income running yield in line with prior year
 • Excluding the estimated impact
   of the change in US GAAP                            • Impairments remain low (USD 9m), reflecting a
   accounting guidance, the ROI                          disciplined investment approach
   would have amounted to 3.3%
             1   ROI excluding the estimated impact of the new US GAAP accounting guidance on recognition and measurement of financial instruments Swiss Re Group | Company presentation | April 2019            53
High quality portfolio drives the Group’s sustainable investment result
  Credit bonds: USD 45.1bn                                                                                             Fixed income impairment trend
 Below investment grade credit bonds represent approximately
  half of peer average of 9%
                                                                                                                            USD m                                                                                         bps
                          4%
                            3%
                                                                                                                             60
                                                                Investment grade rated                                                                  Typical default rate assumption (Single A) ~13bps                  15

                                                                Non-investment grade rated
                                                                                                                                            37
                                                                Not rated1                                                                                                                                                 10

                                                                                                                             30
                                 93%                                                                                                                                22
                                                                                                                                              3                                           15                               5
                                                                                                                                                                    2
                                                                                                                                                                                           1                    5
      Credit spread sensitivity on shareholders’ equity and ENW2                                                                                                                                                    1
                                                                                                                               0                                                                                           0
                                                                                                                                           2015                   2016                  2017                  2018
                                                       USD -1.9bn         USD +2.0bn
                Credit spreads +/-50bps
                                                                                                                                             Fixed income impairments (USD m, LHS)                ROI impact (bps, RHS)

        High quality portfolio drives stable running yield of 2.9% for                                                    Impairment trend reflects significant reduction of high yield
         2018 (quarterly running yield increased from 2.8% to 3.0%                                                          exposure in 2016
         during 2018)
  1   Determination of credit quality of non-rated securities, which includes catastrophe bonds and infrastructure loans, based on Swiss Re analysis
  2   Sensitivity on both shareholders’ equity and economic net worth assumed to take effect on 31 December 2018; sensitivities are comparable but not exact

                                                                                                                                                               Swiss Re Group | Company presentation | April 2019           54
Fixed income securities

                          Government                                Credit
USD m                       bonds                                   bonds
End
FY 2017                    54 658                               47 128                   • Decrease in government bonds driven by foreign
End                                                                                        exchange impacts as well as net sales and market value
FY 2018                    50 876                               45 076
                                                                                           losses stemming from rising interest rates across the US
                                                                                           and UK

                                                                                         • Credit bonds include corporate bonds (USD 40.8bn)
                                                                                           and securitised products (USD 4.3bn)
                                                                      3%
                                                               4%
                 2%
                          14%
                                                                                         • Decrease in credit bonds driven by foreign exchange
          3%                                                  8%
                                                                                           impacts as well as market value losses stemming from
            3%
                                   40%                    8%                               rising interest rates and wider credit spreads, partially
            3%                                                               48%
            4%
                                                                                           offset by net purchases
                  6%
                    6%                                        29%
                             19%

          United States            United Kingdom
          Germany                  Canada
          France                   Australia
          Italy                    China            BBB   A    AAA     AA
Equities and alternative investments
                                                                                                  Equity securities                      Exchange-traded funds
                                                                                                  by sector                              Non-Cyclical Consumer Goods
                                                               End                         End                                           Financials
                                                                                                              1%     1%
USD m                                                      FY 2017                     FY 2018           3%2%          1%
                                                                                                       6%                                Information Technology
Equity securities                                            3 326                      2 695     6%                                     Cyclical Services
                                                                                                                                         General Industrials
Private equity                                               1 382                      1 463    7%                          48%
                                                                                                                                         Basic Industries
Hedge funds                                                    359                        327    12%                                     Cyclical Consumer Goods
                                                                                                                                         Non-Cyclical Services
Real estate                                                  4 091                      4 430            13%                             Resources

Principal Investments                                        2 422                      2 109                                            Utilities
                                                                                                       Real estate
        Equity securities                                      539                        341          by geography
                                                                                                                3%
                                                                                                        13%                              Switzerland
        Private equity                                       1 883                      1 768                                            US
                                                                                                                                         Germany
Total market value                                          11 580                     11 024                                41%         Other Direct
                                                                                                 17%                                     Indirect

  • Decrease in equity securities mainly driven by net sales and market value losses
                                                                                                          26%
  • Increase in real estate driven by net purchases and market value gains                             Principal Investments
                                                                                                       by sector
                                                                                                                                         HGM Insurance
  • Decrease in Principal Investments reflects market value losses, mainly driven by New                8% 5%                            PE Funds
    China Life
                                                                                                                                         Developed Market Insurance
                                                                                                 15%                                     Non Insurance

                                                                                                                            72%

                                                                                                                            Swiss Re Group | Company presentation | April 2019   56
Swiss Re’s approach to responsible investing: we consistently integrate
ESG criteria across all asset classes

                         Switch to broad-based ESG benchmarks
Enhancement
                        focusing on higher ESG-rated investments

                            Focus on themes and create related
Inclusion                     mandates, such as green bonds,
                             renewable or social infrastructure

                            Exclusions based on the internal
Exclusion                  Sustainable Risk Framework. Avoid
                    investments related to thermal coal and tar sands

 Governance          • Responsible Investment Policy                    Signatories to        • Principles for Responsible Investment (PRI)
                     • Voting Framework                                                       • ICMA Green Bond Principles
                     • Sustainability Risk Framework

  Systematic integration of ESG criteria into investment process and portfolio
  Close to 100% assets invested considering ESG criteria

                                                                                         Swiss Re Group | Company presentation | April 2019   57
Financial highlights& Protection Gap
Global Re/Insurance

                            Swiss Re Group | Company presentation | September 2018   58
Global cat losses totaled USD 165 billion in 2018, and 49% was uninsured

                                                 Swiss Re Group | Company presentation | April 2019   59
Disaster losses still mostly uninsured

   500

   450

   400

   350                              Economic
                                     losses =
   300
                                    insured +
   250                              uninsured
                                      losses
   200

   150

   100

     50

       0
           1970              1975         1980         1985           1990           1995             2000        2005            2010             2015          2018

                 Insured losses          Not insured          10-year moving average insured losses          10-year moving average total economic losses
Source: Swiss Re Institute

                                                                                                                  Swiss Re Group | Company presentation | April 2019    60
Insured losses in 2018: USD 85 billion
Insured losses, 1970-2018 (USD bn at 2018 prices)

                                                                                                                                                   Hurricanes
    160                                                                                                                     Japan, NZ
                                                                                                                                                   Harvey, Irma,
                                                                                                                            earthquakes,
                                                                                               Hurricanes
                                                                                                                            Thailand flood
    140                                                                                        Katrina, Rita, Wilma

    120

    100                                                                                                                                                Camp Fire,
                                                                                         Hurricanes Ivan,                           Hurricane          Typhoon Jebi
                                                                                         Charley, Frances                           Sandy
      80
                                                                       Winter Storm Lothar                       Hurricanes
                                                                                                                 Ike, Gustav
      60
                                                            Hurricane Andrew                   WTC

      40

      20

        0
            1970             1975        1980        1985   1990         1995           2000             2005             2010              2015         2018
                                Earthquake/tsunami              Weather-related catastrophes                             Man-made disasters

Source: Swiss Re Institute

                                                                                                        Swiss Re Group | Company presentation | April 2019      61
Direct premiums as a % of GDP, 2017
                                                                                                                                      United States     • Swiss Re’s developed insurance
 4%                                                                                                                               Canada                  “S-Curve” illustrates the various
                                                                                                                                        Switzerland
      Average advanced markets                                                                                                                            stages of insurance penetration

                                                                                                                                    Germany             • Insurance penetration rises most
                                                                                                                                                          sharply in middle-income
 3%                                                                                                                   Spain
                                                                                                                                                          countries
                                                                                         South Africa
                                                                                                                                                        • With our focus on High Growth
                                                                                                               Portugal           United Kingdom          Markets, Swiss Re is well
                                                                                                                          Italy
 2%                                                                           Morocco                                                                     positioned to benefit from this
                                                                                               China                                                      trend
                                                                                             Brazil
      Average emerging markets
                                                                  Kenya
                                           Mozambique                                                        Greece                           Ireland
 1%                                                                   India                         Russia
                                                                  Cote d Ivoire
                                                                  Ghana             Angola
                                                       Ethiopia          Egypt
                                                                     Nigeria
 0%
      0.1                                                  1                                   10                                                100

                                                                                                                 GDP per capita, 1000 USD

Source: Swiss Re Institute, S-Curve in non-life insurance 2017

                                                                                                                                        Swiss Re Group | Company presentation | April 2019    62
Lines of business1 (premium equivalents)

                    Property Cat                                             Property Non-Cat
                                                                                                                                                                   Premium
                    ~USD 155 bn                                                ~USD 80 bn                                                                          potential
                                                                                                                                                                  > USD 500
                                                                                                                                                                    billion
                                                                                                                                                                 and growing
                        Agro                                                    Mortality
                     ~USD 30 bn                                                ~USD 270 bn

Source: Swiss Re Institute
1 Excluding Morbidity, Other P&C and Emerging Risks; Protection Gap for Property Cat, Property Non-Cat, Agro and Mortality estimated at ~500bn vs Premium insured of ~900bn

                                                                                                                                       Swiss Re Group | Company presentation | April 2019   63
How to close the gap?
Economic                                                               Solution type    Description
     loss                                 Foregone revenues

                                          Damaged public                                         Risk transfer solutions
                                          physical assets
                                                                                              for (sub)sovereigns to cover
                                                                          Macro               their direct or indirect costs
                          gap             Clean up costs

                                          Emergency relief

                                          Damaged                                           Insurance schemes and pools
                                          uninsured
 Insured
                                          private assets
                                                                         Pooling          to increase insurance penetration;
    loss                                                                                   distribution and simplified products

                                          Livelihood assistance,                            Simplified products distributed
                                          rehabilitation of the poor      Micro                via aggregators such as
                                                                                             MFIs1, NGOs, and corporates

    1   Monetary Financial Institutions

                                                                                                      Swiss Re Group | Company presentation | April 2019   64
Swiss Re Public Sector Solutions enables the Group to broaden our client
base and address the protection gap
                                                                   Florida      United Kingdom     Turkey          Bangladesh
                                          United States          Hurricane risk    Flood risk  Earthquake pool   Flood insurance
• First dedicated public sector               Flood risk
  team in the reinsurance
                                             Caribbean
  industry                        Hurricane, earthquake                                                                                         Heilongjiang
• More than 400 transactions      and excess rainfall risk                                                                                      Multiperil disaster risk
  since 2011                                  Louisiana                                                                                         Beijing
                                           Hurricane risk                                                                                       Agricultural risk
• Develop insurance,
  reinsurance and capital               California/Utah                                                                                         Vietnam
  markets solutions on all               Earthquake risk                                                                                        Agriculture yield cover
  perils (natural disasters,                                                                                                                    Guangdong
  weather risks, pandemics                                                                                                                      Typhoon/rainfall
  and other health topics,                                                                                                                      Philippines
  infrastructure, etc.)                                                                                                                         Earthquake and
                                                                                                                                                tropical cyclone risk
• Global footprint                                   Mexico
                                      Earthquake/hurricane                                                                                      Pacific Islands
• Pioneer in emerging and                                                                                                                       Earthquake and
                                           and livestock risk
  industrialised markets                                                                                                                        tropical cyclone risk
                                                  Guatemala
                                            Nat cat business
                                             interruption risk
                                            Pacific Alliance                                                                                    IDA countries
                                    (CHL, COL, MEX, PER)                                                                                        Pandemic outbreak
                                              Earthquake risk
                                                    Uruguay
                                         Energy production
                                   shortfalls due to drought       African Risk Capacity     Kenya          India         Thailand
                                                                    Government drought     Livestock   Weather insurance    Crop
                                                                       insurance pool      insurance     for farmers     insurance

                                                                                                         Swiss Re Group | Company presentation | April 2019         65
Swiss Re Group | Company presentation | April 2019   66
Corporate calendar & contacts

Corporate calendar

2019
17 April              155th Annual General Meeting                  Zurich
3 May                 Q1 2019 Key Financial Data                    Conference call
23 May                Management Dialogues                          London
31 July               H1 2019 Results                               Conference call
31 October            9M 2019 Key Financial Data                    Conference call
25 November           Investors’ Day 2019                           Zurich

Investor Relations contacts

Hotline                  E-mail
+41 43 285 4444          Investor_Relations@swissre.com

Philippe Brahin          Daniel Bischof           Manfred Gasser
+41 43 285 7212          +41 43 285 4635          +41 43 285 5516
Chris Menth              Iunia Rauch-Chisacof
+41 43 285 3878          +41 43 285 7844

                                                                                 Swiss Re Group | Company presentation | April 2019   67
Cautionary note on forward-looking statements
Certain statements and illustrations contained herein are forward-looking. These statements (including as to plans, objectives, targets, and trends) and illustrations provide current expectations of future events based on certain
assumptions and include any statement that does not directly relate to a historical fact or current fact.

Forward-looking statements typically are identified by words or phrases such as “anticipate”, “assume”, “believe”, “continue”, “estimate”, “expect”, “foresee”, “intend”, “may increase”, “may fluctuate” and similar expressions, or by
future or conditional verbs such as “will”, “should”, “would” and “could”. These forward-looking statements involve known and unknown risks, uncertainties and other factors, which may cause the Group’s actual results of operations,
financial condition, solvency ratios, capital or liquidity positions or prospects to be materially different from any future results of operations, financial condition, solvency ratios, capital or liquidity positions or prospects expressed or
implied by such statements or cause Swiss Re to not achieve its published targets. Such factors include, among others:

•   the frequency, severity and development of insured claim events, particularly natural catastrophes, man-              •   failure of the Group’s hedging arrangements to be effective;
    made disasters, pandemics, acts of terrorism and acts of war;                                                         •   the lowering or loss of one of the financial strength or other ratings of one or more Swiss Re companies, and
•   mortality, morbidity and longevity experience;                                                                            developments adversely affecting the Group’s ability to achieve improved ratings;
•   the cyclicality of the insurance and reinsurance sectors;                                                             •   uncertainties in estimating reserves;
•   instability affecting the global financial system;                                                                    •   policy renewal and lapse rates;
•   deterioration in global economic conditions;                                                                          •   uncertainties in estimating future claims for purposes of financial reporting, particularly with respect to large
•   the effect of market conditions, including the global equity and credit markets, and the level and volatility of          natural catastrophes and certain large man-made losses, as significant uncertainties may be involved in
    equity prices, interest rates, credit spreads, currency values and other market indices, on the Group’s                   estimating losses from such events and preliminary estimates may be subject to change as new information
    investment assets;                                                                                                        becomes available;
•   changes in the Group’s investment result as a result of changes in the Group’s investment policy or the               •   extraordinary events affecting the Group’s clients and other counterparties, such as bankruptcies,
    changed composition of the Group’s investment assets, and the impact of the timing of any such changes                    liquidations and other credit-related events;
    relative to changes in market conditions;                                                                             •   legal actions or regulatory investigations or actions, including those in respect of industry requirements or
•   the Group’s ability to maintain sufficient liquidity and access to capital markets, including sufficient liquidity        business conduct rules of general applicability;
    to cover potential recapture of reinsurance agreements, early calls of debt or debt-like arrangements and             •   changes in accounting standards;
    collateral calls due to actual or perceived deterioration of the Group’s financial strength or otherwise;             •   significant investments, acquisitions or dispositions, and any delays, unexpected costs, lower-than expected
•   any inability to realize amounts on sales of securities on the Group’s balance sheet equivalent to their values           benefits, or other issues experienced in connection with any such transactions;
    recorded for accounting purposes;                                                                                     •   changing levels of competition, including from new entrants into the market; and
•   changes in legislation and regulation, and the interpretations thereof by regulators and courts, affecting us         •   operational factors, including the efficacy of risk management and other internal procedures in managing
    or the Group’s ceding companies, including as a result of shifts away from multilateral approaches to                     the foregoing risks and the ability to manage cybersecurity risks.
    regulation of global operations;
•   the outcome of tax audits, the ability to realize tax loss carryforwards, the ability to realize deferred tax
    assets (including by reason of the mix of earnings in a jurisdiction or deemed change of control), which
    could negatively impact future earnings, and the overall impact of changes in tax regimes on business
    models;

These factors are not exhaustive. Swiss Re operates in a continually changing environment and new risks emerge continually. Readers are cautioned not to place undue reliance on forward-looking statements. Swiss Re undertakes
no obligation to publicly revise or update any forward-looking statements, whether as a result of new information, future events or otherwise.
This communication is not intended to be a recommendation to buy, sell or hold securities and does not constitute an offer for the sale of, or the solicitation of an offer to buy, securities in any jurisdiction, including the United States.
Any such offer will only be made by means of a prospectus or offering memorandum, and in compliance with applicable securities laws.

                                                                                                                                                                       Swiss Re Group | Company presentation | April 2019                         68
You can also read