The Global Diamond Industry 2018 - A resilient industry shines through - Bain & Company

Page created by Eddie Mullins
 
CONTINUE READING
The Global Diamond Industry 2018 - A resilient industry shines through - Bain & Company
The Global Diamond Industry 2018

A resilient industry shines through
The Global Diamond Industry 2018 - A resilient industry shines through - Bain & Company
This work was commissioned by AWDC and prepared
by Bain & Company and AWDC. It is based on secondary market
research, analysis of financial information available or provided
to Bain & Company and AWDC, and a range of interviews with
customers, competitors and industry experts. Bain & Company
and AWDC have not independently verified this information
and make no representation or warranty, expressed or implied,
that such information is accurate or complete. Projected market
and financial information, analyses and conclusions contained herein
are based (unless sourced otherwise) on the information described
above and on Bain & Company’s and AWDC’s judgment,
and should not be construed as definitive forecasts or guarantees
of future performance or results. Neither Bain & Company nor
AWDC nor any of their subsidiaries or their respective officers,
directors, shareholders, employees or agents accept any responsibility
or liability with respect to this document. This document is copyright
of Bain & Company, Inc., and AWDC and may not be published,
copied or duplicated, in whole or in part, without the written
permission of Bain & Company and AWDC.

Copyright © 2018 Bain & Company, Inc. All rights reserved.
The Global Diamond Industry 2018 - A resilient industry shines through - Bain & Company
The Global Diamond Report 2018

Contents

     Note to readers�������������������������������������������������������������������������������������������� ii

1.   Recent developments in the diamond industry�������������������������������������������������� 1

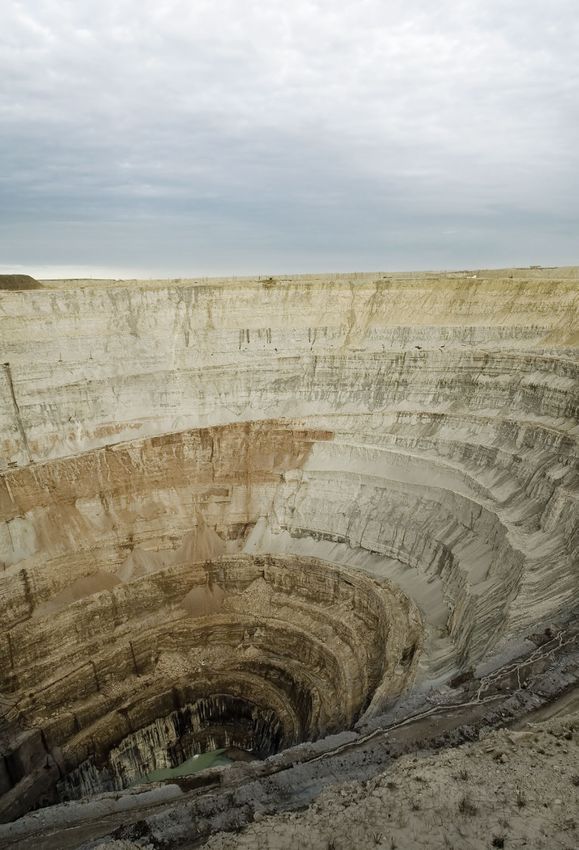
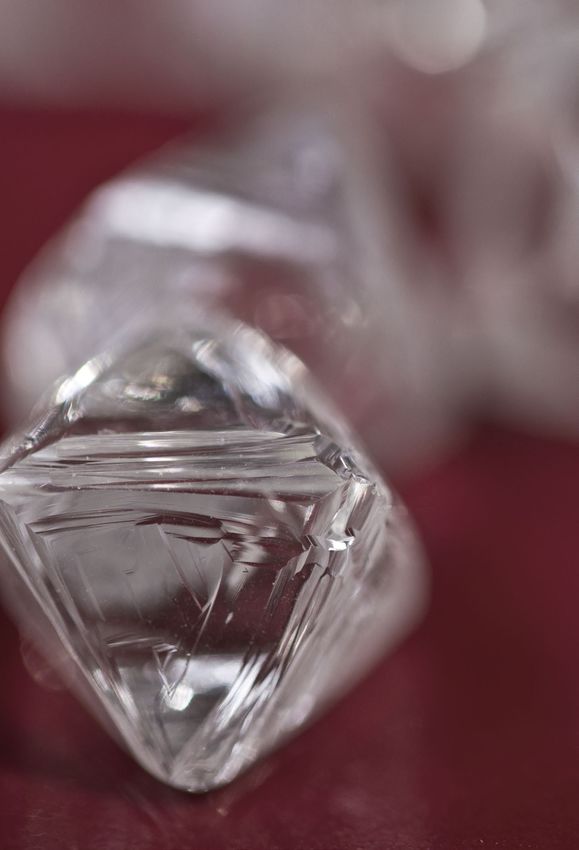
2.   Rough diamond production���������������������������������������������������������������������������� 7

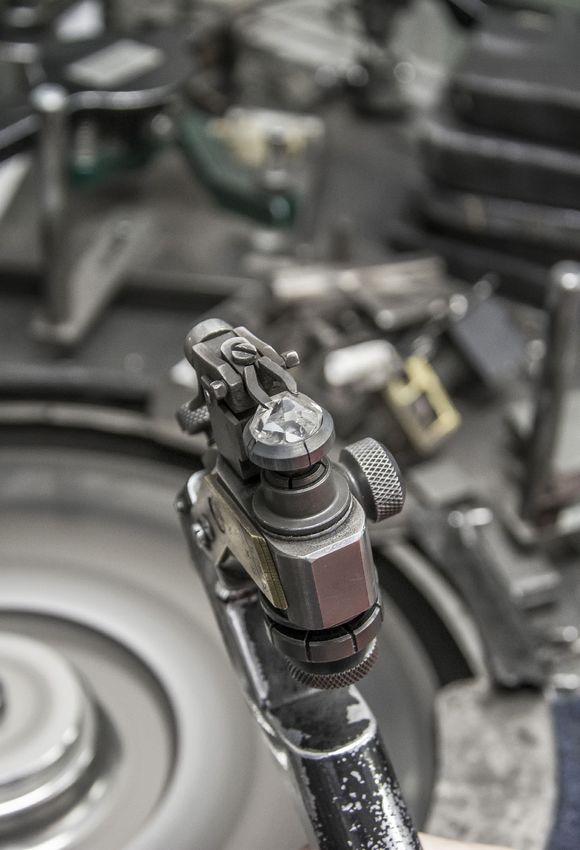
3.   Cutting and polishing���������������������������������������������������������������������������������� 11

4.   Diamond jewelry retail�������������������������������������������������������������������������������� 15

5.   Key industry trends������������������������������������������������������������������������������������ 19

6.   Recent developments in the lab-grown market ���������������������������������������������� 23

7.   Updated supply and demand model ������������������������������������������������������������ 29

     Glossary �������������������������������������������������������������������������������������������������� 35

     Key contacts for this report�������������������������������������������������������������������������� 36

                                                    Page i
The Global Diamond Industry 2018 - A resilient industry shines through - Bain & Company
The Global Diamond Report 2018

Note to readers

Welcome to the eighth annual report on the global diamond industry prepared by the Antwerp World
Diamond Centre (AWDC) and Bain & Company. This year’s edition covers industry developments
in 2017 and the first half of 2018 and takes a close look at key industry trends.

We begin with important developments along the value chain. In subsequent sections, we review
factors that influenced rough diamond production and sales, midstream performance and global
diamond jewelry demand in major markets.

We also provide an update on the long-term outlook for the diamond industry through 2030.
The 2030 supply-demand forecast considers announced production plans, recent changes
in mining operations, potential additional sources of supply, expected changes in global
and regional macroeconomic parameters, and potential effects of lab-grown diamonds.

Readers looking for a brief overview of this report can find key points below:

  Following a period of high volatility, 2017 was strong for the diamond industry, with
 	
  approximately 2% growth across all segments of the value chain. In 2018, revenues are expected
  to grow again, even accelerating in the mining and jewelry retail segments. Volatility persisted
  in 2018; the final outcome for the year will be determined by sales performance during
  the holiday season.

  Rough diamond mining companies delivered unprecedented production growth of nearly 20%
 	
  in volume in 2017. The production increase came mostly from mines with lower-quality
  assortments. Mining company revenues grew by 2% overall, indicating a positive trajectory
  for the second year in a row. In 2017, some major producers reported decreases in their EBIT
  margins, mostly due to currency appreciation in production countries. However, mining
  companies’ profitability bounced back in the first half of 2018.

  Midstream profitability remained positive with margins of about 1% to 3%. Assuming
 	
  the demand for diamond jewelry continues to rise through the end of 2018, overall profitability
  of the cutting and polishing segment is expected to improve. Midstream inventories increased
  in 2017–18, particularly in lower-quality and small-size assortments, as midstream players
  prepared to ride another demand surge for those categories in 2018. India continued to grow its
  leadership position in the cutting and polishing segment due to lower labor costs, a favorable
  regulatory environment and relatively better access to financing. Even though financing
  availability remains an issue in the midstream segment, transparent and financially healthy
  companies report little impact on their ability to secure funding.

    I n line with positive luxury market trends, global diamond jewelry sales grew 2% in US dollar
     terms in 2017, fueled by strong macroeconomic fundamentals in the US, resurging demand
     from Chinese millennials, and increasing sales in the self-purchasing category in China.

                                                 Page ii
The Global Diamond Industry 2018 - A resilient industry shines through - Bain & Company
The Global Diamond Report 2018

  The demand for diamond jewelry is expected to accelerate in 2018. However, if the trade war
  between the US and China continues, it may have a negative effect on the growth prospects
  for global demand in the short to medium term.

 Three key industry trends are shaping the future of the diamond industry.
	

 One of the most important opportunities is the increasing influence of digital technologies.
	
 Emerging and maturing digital technologies are affecting all parts of the value chain, enabling
 diamond producers, midstream players and retailers to increase efficiencies within their operations.
 Marketing efforts that use digital technology can also deliver superior customer experiences.

 The second trend is the growing presence of lab-grown diamonds. Lab-grown diamonds are
	
 clearly here to stay. De Beers Groups’ launch of a lab-grown fashion jewelry retailer called
 Lightbox Jewelery, and the US Federal Trade Commission ruling on diamond terminology were
 major news in 2018. Lightbox does not provide grading reports for its products, as it states that
 grading reports exist as a record of a diamond’s rarity and, therefore, its value — with products
 that can be mass-produced to a particular recipe, Lightbox notes that grading reports could
 confuse consumers about the value of their lab-grown stones. The effects on natural diamond
 demand and price will depend on consumers’ perceptions and preferences. If the natural
 diamond industry can differentiate its stones from lab-grown diamonds (perhaps positioning
 lab-grown diamonds as fashion jewelry rather than luxury items), the effect on natural diamond
 demand by 2030 will be limited up to 5% to 10% in value terms. Given the pace of declining
 production costs and wholesale and retail prices, we expect lab-grown stones to become
 accessible to a wider consumer audience, potentially increasing demand for diamonds in general.
 In the short to medium term, growth of lab-grown diamonds will be limited by manufacturing
 capacity, access to technology and intellectual property, and availability of funding.

 The third key trend is the shifting preferences of younger generations of consumers. Younger
	
 generations of consumers are causing industry players to rethink their sales and marketing
 strategies. The self-purchase product category continues to grow as millennial and Generation
 Z’s female spending power increases. Younger generations are also more inclined to consider
 the opinions of social influencers, customer reviews and “likes” when making purchasing
 decisions. Social media shopping is expected to increase significantly as the spending power
 of Gen Z rises. Many retailers are already strategizing how the shifts in preferences will change
 their approaches to marketing and operations.

 The long-term outlook for the diamond market remains positive. Rough diamond supply
	
 is projected to be negative 1% to 1% annually in volume terms. We expect demand for natural
 rough diamonds to stay flat or grow up to 2% annually through 2030 in real terms (2% to 4%
 in nominal), backed by strong fundamentals in the US and the continued growth of the middle
 class in China and India. Our outlook incorporates possible demand substitution from lab-grown
 diamonds, which is estimated to be 5% to 10%. It also reflects fundamental long-term supply
 and demand factors rather than short-term fluctuations.

                                              Page iii
The Global Diamond Industry 2018 - A resilient industry shines through - Bain & Company
1.
                      •   Every segment of the value chain improved in 2017,
                          with industry revenue growing around 2%. In 2018,
                          we expect revenues to continue to trend upward,
                          and project accelerated growth in the mining
                          and jewelry segments.

                      •   Revenue for rough diamonds increased, continuing
                          a climb that started in 2016. Revenue growth for rough
Recent developments       diamonds is largely attributed to increased production
                          by smaller players. The top five mining company
in the diamond            aggregates faced unfavorable exchange rates in 2017,
                          which contributed to lower profit margins of about 5%.
industry
                      •   Cutting and polishing revenues increased slightly in 2017
                          due to healthy demand, marking a turnaround from prior
                          years. Average profitability was stable at 1% to 3%, with
                          the most efficient players delivering margins of around 10%.
                          We expect cutting and polishing profitability to improve
                          in 2018, supported by rising prices for polished diamonds
                          and increased demand for diamond jewelry.

                      •   Midstream inventory has increased in anticipation of higher
                          demand, particularly in lower-quality and smaller-sized
                          assortments.

                      •   Global retail sales of diamond jewelry increased in 2017
                          due to a strong economy in the US, the world’s largest
                          diamond jewelry market. A resurgence of luxury
                          spending among Chinese millennials also contributed
                          to the increase.

                      •   De Beers Group launched Lightbox Jewelry, a lab-grown
                          fashion jewelery retailer with a new linear pricing model
                          and no grading reports for its products, in September
                          2018. Along the value chain, companies are evaluating
                          how to strategically respond.

                      •   Performance across the value chain was strong during
                          the first half of 2018, with accelerated growth expected
                          among mining companies and jewelry retailers. The final
                          outcome for the year hinges on holiday sales in December.
The Global Diamond Industry 2018 - A resilient industry shines through - Bain & Company
The Global Diamond Report 2018

Figure 1: Barriers to entry and bargaining power vary across the diamond value chain

                   Rough diamonds                                    Polished diamonds                            Diamond jewelry

                   Production              Sales                     Cutting and          Sales                   Jewelry manufacturing              Retail sales
                                                                     polishing

                  • Exploration          • Sale of rough  • Cutting                      • Polished              • Jewelry design                   • Jewelry and watches
                    of diamond             diamonds         and polishing                  diamond                 and manufacturing
                    resources              from producers   rough                          wholesale
                                                            diamonds
                  • Rough                • Rough            to produce                   • Polished
                    diamond                diamond          polished                       diamond
                    production,            trading          diamonds                       trading
                    processing
                    and sorting

No. of              Top 5 players                                                                                                                           Large retailers control
                                                ~100 players                          ~5,000 players                          >10,000 players
players:             control 70%                                                                                                                             ~35% of the market

Entry
                          high                         high                     low                        low                   medium                            medium
barriers:

Bargaining
                          high                     medium                       low                        low                     low                             medium
power:

Source: Bain & Company

Figure 2: Revenues improved throughout the process, and the trend is expected to accelerate in
2018

   Rough diamonds                                 Polished diamonds                              Diamond jewelry

   Rough diamond sales                            Cutting and polishing                          Jewelry manufacturing                       Retail sales

   Global revenues by value chain segment, $                                                                                                         +2%      +4–6%

                                                                                                                +2%   +4–6%

                                                              +2%      +3–5%
              +2%      +4–6%

                                                2016          2017        2018F*         YOY change 2016–17           YOY change 2017–18F*

*Forecast (F) made based on FY 2017 results
Note: Jewelry manufacturing value is estimated at approximately 65% of retail sales based on historic average
Sources: Company data; Kimberley Process; Euromonitor; Bain & Company

                                                                                               Page 3
The Global Diamond Report 2018

Figure 3: Profitability in the rough diamond segment trended down in 2017 but is expected
to rebound in 2018

                Rough diamonds                   Polished diamonds                              Diamond jewelry

                             Rough               Cutting and polishing                          Jewelry manufacturing                  Retail sales
                             diamond             (including trading)
                             sales

                Average operating margin, 2017

                               22–24%

                                                                                                                                                                          9–11%

                                                                                                                                               3–5%
                                                                                                             2–4%
                                                                  1–3%
                                                                                                                                          Small retailers              Large retailers
Change in                                                                                                                               (~65% of market)             (~35% of market)
profitability
                                                                                                                            Rectangle width corresponds to segment revenue in 2017

2017 vs. 16                       –5%

2018 vs. 17

Notes: Analysis of exploration and production is based on data for ALROSA, De Beers Group, Rio Tinto, Dominion Diamond Mines, Petra Diamonds;
analysis of large chains is based on data for Chow Sang Sang, Chow Tai Fook, Gitanjali Jewels, Lukfook, Signet Jewelers, Tiffany & Co., Titan Company
Sources: Publication analysis; company data; expert interviews; Bain & Company

Figure 4: Rough diamond sales were stable in 2017 and are expected to rise in 2018

World rough diamond sales by producers (including sale of inventories), $ billions                                                                                               YOY change
                                                                                                                                                                                  (2016–17)

                                                                                                                                                                                         2%
                                  ~16
                                                                                                                          ~16
            ~15                                                               ~15                   ~15

                                                        ~12
                                                                                                                                                         Other                           20%

                                                                                                                                                         Petra Diamonds                  –6%

                                                                                                                                                         Dominion                        57%
                                                                                                                                                         Diamond Mines

                                                                                                                                                         Rio Tinto                       15%

                                                                                                                                                         De Beers Group                  –7%

                                                                                                                                                         ALROSA                          –5%

           2013                   14                    15                    16                    17                   18E

Average price per carat sold (including sale of inventories), $

          ~119                  ~131                  ~114                  ~111                   ~99

Notes: Estimated realized price is based on an estimate of carats sold if data is published, if not, on production data; ALROSA revenues represent diamond sales only;
Dominion Diamond Mines 2017 results based on H1 2017 as the company was delisted and no long publishes the data; Petra Diamonds data converted from year ending in June
to year ending in December, based on company reports for full year and half year; only diamonds tracked by Kimberley Process are included; other is estimated assuming no price change
for the players of this segment; E is estimate; to estimate average price per carat sold, total value of diamonds sold is divided by total volume of diamonds sold
Sources: Company data; Kimberley Process; analyst reports; Bain & Company

                                                                                             Page 4
The Global Diamond Report 2018

Figure 5: Rough and polished diamond prices trended up during the first half of 2018

Polished diamond market price index,                                                                                  Rough diamond market price index,
2004 price=100*                                                                                                                       2004 price=100*

  200                                                                                                                                                                   250

                                                                                                                                                                        200
  150

                                                                                                                                                                                   Polished
                                                                                                                                                                        150        diamonds
                                                                                                                                                 −3%       +2%
                                                                                                                                                                                   Rough
                                                                                                                                                                                   diamonds
  100
                                                                                                                                                                        100
                                                                                                                                                 +1%       +3%

    50
                2004        05        06        07       08        09        10        11        12        13        14        15        16        17      H1 18

                                                                           Change of average to previous year

*Price index shows change in market price for like-for-like diamond categories weighted according to global rough and polished product mix
Sources: General polished diamond price index (PolishedPrices.com, data set 2004–16); Kimberley Process; company data; Bain & Company

Figure 6: Midstream inventories grew in 2017, largely with smaller and lower quality diamonds

Accumulated inventory in midstream by value, index 2012=100

                                                                                            Inventory decline             Stable inventory          Shift of inventory        Inventory
                                                                                            due to decreased              due to increased          from producers            accumulation
                                                                                            rough diamond                 rough diamond             to midstream              reversed
                                                                                            sales by mining               sales back                (with accumulation        in the second half
                                                                                            companies                     to normal levels          of lower-quality          of the year due
                                                                                            (fueled by rough                                        diamonds)                 to growth
                                                                                            price decrease)                                                                   in demand
                                                                                                                                                                              for diamond jewelry

                                                                    ~168

                                                                                                                                                         ~138                    ~139
                                                                                                                             ~130
                                        ~122                                                    ~124

             100

            2012                           13                         14                          15                          16                          17                     18E

Note: Technological inventories are diamond stocks necessary to maintain regular production and the selling cycles of cutters and polishers, and polished diamond traders
(around 9 months of total stock coverage)
Sources: Company data; Kimberley Process; expert interviews; Bain & Company

                                                                                               Page 5
The Global Diamond Report 2018

           Page 6
2.
                •   All of the top mining companies increased production
                    in 2017, leading to an unprecedented 19% growth
                    in rough diamond production; volume reached
                    151 million carats in 2017, breaking an eight-year
                    trend of flat output. However, the increase was largely
                    attributed to the processing of lower-quality supplies
                    and tailings, diminishing the effect on revenues.
Rough diamond   •   Canada, the Democratic Republic of the Congo,
                    Australia, Botswana and Russia accounted for 90%
production          of the output increase in 2017. Canada led the way, with
                    the largest production increases coming from commercial
                    mining efforts in Gahcho Kué and Renard, both of which
                    started production in 2016 and early 2017.

                •   We believe that 2017 was the pinnacle production level
                    for the natural diamond supply. From here on, output
                    is expected to remain stable at best. Miners’ plans
                    and actual production volumes in the first half of 2018
                    suggest production may even decline in the near future.

                •   The most significant decreases are expected from Mirny
                    in Russia and Voorspoed in South Africa, resulting from
                    their closure; Jubilee in Australia from lower-grade
                    mining; and Argyle, also in Australia, because
                    of depleted reserves in its block cave. Meaningful
                    increases are expected from Orapa and Jwaneng
                    in Botswana.

                •   Currency adjustments in production countries lowered
                    the EBIT margins (earnings before interest and taxes)
                    for De Beers Group and ALROSA in 2017. ALROSA
                    returned to positive in the first half of 2018
                    and maintains the highest margin in the segment,
                    attributable to rises in rough diamond prices, currency
                    devaluation and strong cost containment. Petra reported
                    negative EBIT margin in 2017 but rebounded in 2018.

                •   Merger and acquisition activity was focused
                    on the mining segment, with key industry players investing
                    in mining resources and operations. De Beers Group
                    purchased Chidliak, a diamond resource in Canada;
                    ALROSA increased its shares in Catoca from 33% to 41%.
The Global Diamond Report 2018

Figure 7: Rough diamond production grew by 19% in 2017, and may decline slightly in 2018

Annual production, million carats                                                                                                                                         YOY change
                                                                                                                                                                     (2016–17) (2017–18E)

                                                                                                                                                                          19%             –3%
                                                                                              151
                                                                                                                   147
                                                                                                                                              Other                       21%
           130                                       127
                                125                                       126
                                                                                                                                              Angola                       5%

                                                                                                                                              South Africa                16%

                                                                                                                                              DRC                         21%

                                                                                                                                              Australia                   23%

                                                                                                                                              Botswana                    12%

                                                                                                                                              Canada                      78%

                                                                                                                                              Russia                       6%

          2013                   14                   15                  16                   17                 18E*

*Estimated based on company production plans
Notes: Only diamonds tracked by Kimberley Process are included; 2018 data is preliminary estimate and is to be updated with 2018 Kimberley data; due to rounding, some totals may not correspond
with the sum of the separate figures; DRC is Democratic Republic of the Congo
Sources: Company data; Kimberley Process; expert interviews; Bain & Company

Figure 8: Five countries accounted for 90% of the output increase in 2017

Annual production by country, million carats

                                                                                                                         3
                                                                                                                      Other 2                 Australia –3
                                        25                                                    151                   Botswana 2
                                     Other 2                                                                                                   Russia –1
                                                                    ~0
                                   South Africa 1                                                                                               Other –2                      147
                                     Russia 2
                                                                                                                                                    –7
                                      Botswana 2
                                      Australia 3

                                        DRC 3

                                      Canada 10

               126

              2016                      Output                   Output                      2017                      Output                    Output                     2018E
                                       increase                 decrease                                              increase                  decrease

Notes: Only diamonds tracked by Kimberley Process are included; 2018 data is preliminary estimate and is to be updated with 2018 Kimberley data; due to rounding, some totals may not correspond
with the sum of the separate figures; DRC is Democratic Republic of the Congo
Sources: Company data; Kimberley Process; expert interviews; Bain & Company

                                                                                             Page 9
The Global Diamond Report 2018

Figure 9: All of the top mining companies increased production in 2017

Annual production, million carats                                                                                                                                         YOY change
                                                                                                                                                                     (2016–17) (2017–18E)

                                                                                                                                                                         19%              –3%
                                                                                        151
                                                                                                                  147

                                                                                                                                              Other                      30%
             125                      127                      126

                                                                                                                                              Petra                        3%
                                                                                                                                              Diamonds

                                                                                                                                              Dominion                   33%
                                                                                                                                              Diamond
                                                                                                                                              Mines

                                                                                                                                              Rio Tinto                  20%

                                                                                                                                              De Beers Group             22%

                                                                                                                                              ALROSA                       6%

            2014                        15                      16                       17                       18E*

* Estimated based on company production plans
Notes: Dominion Diamond Mines production includes 40% Diavik and 100% Ekati, and 2017 estimate is based on H1 2017 as the company was delisted and no longer publishes
the data; only diamonds tracked by Kimberley Process are included; 2018 data is a preliminary estimate and is to be updated with 2018 Kimberley data
Sources: Company data; Kimberley Process; expert interviews; Bain & Company

Figure 10: Diamond producer margins showed mostly positive dynamics in the first half of 2018

EBIT margin, %

                             48          47
                        44

                   36              37

                                                                                                                                      25                24
                                                                                                                                 22
                                                              19                                                  19                                                18          19
                                                                          17                               16
                                                                                15                                                                            14
                                                                     12               13                                 12

EBITDA margin, %                                                                                                                                                         –11

                   45   53   56    47    54                   26     21   23    25    22                   35     42     39      41   41                32    25    45     8    51

                         ALROSA                                    De Beers Group                                  Rio Tinto                                 Petra Diamonds

                                                                            2014         15        16        17          H1 18

Notes: Rio Tinto, BHP Billiton revenues and EBIT include diamond mining only; Petra Diamonds data converted from year ending in June to year ending in December, based on company reports for full
year and half year; 2017 impairment charges are taken into consideration for Petra Diamond EBIT/EBITDA calculations
Sources: Company data; Bain & Company

                                                                                              Page 10
3.
                •   Healthy growth in the diamond jewelry retail market
                    supported a 2% increase in cutting and polishing
                    revenue, putting the segment on positive ground in 2017.

                •   While the cutting and polishing segment grew overall,
                    profit gains in 2017 were mostly limited to producers
                    of small stones. Companies that specialize in large,
                    high-quality stones experienced pressure from retailers
Cutting             in 2017. That trend reversed in the first part of 2018.
                    To sustain profitability, cutting and polishing companies
and polishing       are focusing on four strategies: managing inventory
                    levels, shortening production cycles, optimizing yields
                    and expanding operations. Technology is leading
                    improvements in the cutting and polishing segment,
                    from digitally mapping and modeling stones
                    to automating cutting processes.

                •   Because of its low labor costs, favorable regulatory
                    environment and relatively easier access to financing,
                    India continued to gain market share in 2017. India’s
                    growth came primarily at the expense of China and
                    other countries. India accounts for more than 90%
                    of global polished diamond manufacturing by value,
                    and it dominates in all size segments, including
                    the value-add segment of larger stones.

                •   In China, cutting and polishing revenue increased
                    in 2017, backed by strong domestic jewelry demand.

                •   Access to affordable financing continues to be an issue
                    for some midstream players. Following several defaults
                    in India, some banks have tightened credit requirements.
                    However, transparent and financially healthy players
                    in the cutting and polishing segment reported only
                    limited influence on their ability to secure funding.
The Global Diamond Report 2018

Figure 11: India’s dominance of the cutting and polishing industry grew in 2017

Net import of rough diamonds to cutting and polishing countries, $
                                                                                                                                                                                   YOY growth
                                                                                                                                                                                    (2016–17)
                                                                                                                                                                                         10%
100%
                                                                                                                                                     Other                               −6%
                                                                                                                                                     China                                2%

    80

    60

                                                                                                                                                      India                              11%
    40

    20

     0
                       2013                             14                              15                              16                             17

Sources: Gem & Jewellery Export Promotion Council; International Trade Centre; Antwerp World Diamond Centre; China Customs Statistics; Israeli Central Bureau of Statistics; Bain & Company

Figure 12: Differences in cost efficiency accounted for regional market-share changes
in the cutting and polishing segment

                                                      • Continuous cost optimization attracted volumes from other regions
                                                      • Advancement of technologies and skills led to share gain in larger stones
                    India
                                                      • Relatively more developed diamond financing infrastructure is in place
                                                        (India accounted for ~40% of all borrowings), but affordable financing remains an issue

                    China and                         • China is the No. 2 country by cost efficiency, but its relatively higher cost structure proved
                    Southeast                           sensitive to margin pressures in 2015
                    Asia                              • Cutting and polishing sector grew in line with domestic diamond jewelry demand in 2017

                                                      • Market stagnation occurred due to relatively low productivity and high cost structure
                    Africa                              despite efforts to increase role in global cutting and polishing industry
                                                      • Increase in volumes available for beneficiation due to production growth in region in 2018

                                                      • Traditionally strong in large stone manufacturing, but slowly relinquishing positions
                                                        to India even in more expensive categories due to aging workforce and high costs

                    Other                             • Lack of affordable financing available to cutting and polishing companies in selected
                                                        countries (Israel, US, Russia)
                                                      • Efforts underway in Russia to consolidate local cutting and polishing industry to make
                                                        it more competitive

Sources: Expert interviews; Bain & Company

                                                                                             Page 13
The Global Diamond Report 2018

Figure 13: Labor and financing are key factors in the manufacturing costs of polished diamonds

Cost structure of cutting and polishing*                                                                                    Key factors that affect profit
for a typical Indian C&P player ($/ct, 2017)
300
                                                                                                                                Revenue
                                                                                                                                • Effective assortment management
                                                                                                                                • Diverse client base

                                                                                                                                Financing
200                                                                                                                             • Financial transparency to secure low interest rate
                                                                                                                                • Shorten cutting and polishing cycles to reduce
                                                                                                                                  requirements for working capital
                                                                                  Financing
                                                                                                                                • Access to affordable financing

                                                                                                                                SG&A
                                                                                                                                • Online distribution system to reduce selling costs
100                                                                           Selling & admin**
                                                                                                                                • Lean management organization

                                                                                                                                Production
                                                                                 Production                                     • Automation of production processes
                                                                                                                                • Optimization of yields
                                                                                                                                • Access to skilled talent pool
   0
                  Small size                       Midsize                       Large size
                 (0.2–0.3 ct)                     (0.3–1 ct)                       (1+ ct)

*Excluding raw materials costs
**Includes management and administrative compensation, insurance, utilities, logistics, marketing and certification costs
Note: C&P is cutting and polishing
Sources: Company data; expert interviews; Bain & Company

                                                                                               Page 14
4.
                  •   The luxury category has been stable compared
                      with global GDP for the past five years, marking
                      a resilience to generational shifts. The luxury segment
                      has adapted to changing consumer preferences
                      and behavior. Keeping in line with luxury market
                      trends, global diamond jewelry sales grew 2% in US
                      dollar terms in 2017. Demand for diamond jewelry
                      is expected to continue or even accelerate in 2018,
Diamond jewelry       steered by high demand from affluent consumers.
retail            •   An increase in retail diamond jewelry sales is attributed
                      to a strong economy and favorable macroeconomics
                      in the US, namely growing consumer credit, shrinking
                      unemployment and higher wages.

                  •   Demand in China grew for the first time since 2013,
                      picking up momentum from millennial buyers. Favorable
                      adjustments to tax and customs policies should support
                      continued Chinese growth. The online channel
                      is expected to bring additional diamond jewelry sales
                      to regions in China with limited physical retail footprint.

                  •   As in years past, India had the highest potential
                      for diamond jewelry retail growth, yet its revenues
                      remained flat. Despite inflation and a weaker rupee
                      in the first half of 2018, personal disposable income
                      is expected to grow in India and provide basis
                      for increase in demand.

                  •   In 2017, performance was tempered in Europe
                      by lower consumer confidence and in Japan by weak
                      economic fundamentals. Both are positioned to rebound
                      in 2018, thanks to higher tourism volume and euro
                      appreciation in Europe and decreased unemployment
                      in Japan.

                  •   If the US and China continue to dispute trade terms,
                      economic growth prospects in both countries could be
                      negatively affected, or consumer confidence could
                      dwindle. While nothing detrimental has materialized,
                      the potential outcomes of an ongoing trade war should
                      be considered.
The Global Diamond Report 2018

Figure 14: Personal luxury and diamond jewelry spending remained stable relative to GDP over
the past five years

Global nominal GDP, personal luxury goods* and diamond jewelry markets (2013=index 100, 2013–18E)                                                          CAGR
                                                                                                                                                         (2013–18E)

120

                                                                                                                                       Personal luxury      ~3%

                                                                                                                                       Diamond jewelry      ~2%
110                                                                                                                                    Global GDP           ~2%

100

  90

  80
       2013                         14                         15                         16                   17                   18E

*Personal luxury goods include luxury jewelry, watches, beauty goods, apparel and accessories
Sources: The Economist Intelligence Unit; Bain & Company Luxury Goods Worldwide Market Study, 2013–18

Figure 15: Global sales of diamond jewelry in 2018 are expected to see the highest growth
in five years

Worldwide diamond jewelry retail sales YOY growth rate, $

            9%                                                                                                                 Constant exchange rates*

                                          5%                                                                                                     3‒5%
                                                                          3%
                                                                                                                          2%              4‒6%
                                                                                                        0‒1%
                                                                                                                    2%
                                                                                                0‒1%

                                                                    –2%

Worldwide personal luxury goods market YOY growth rate, $

                                                                                                                                                 6–8%
                                                                                                                          6%
            6%
                                          4%
                                                                          1%                            0%          4%

                                                                                                 –1%

                                                                    –6%

           2013                           14                         15                           16                     17                       18Е

                 Stabilization                                                   Moderation                                            Revival

*Compared with previous year
Sources: Euromonitor; Bain & Company Luxury Goods Worldwide Market Study, 2013–18

                                                                                       Page 17
The Global Diamond Report 2018

Figure 16: The diamond jewelry market is expected to grow across most major geographical
regions

Global diamond jewelry market in 2017, $                                      Key trends and performance in 2017–18

                                         CAGR               CAGR
                                                                                 • Slow recovery from demonetization and Goods and Services Tax introduction
                                       (2016–17)          (2017–18E)
                                                                                 • Rising inflation and depreciating rupee
                                                                                 • Shift to organized retailing amid continued struggles of the less formal sector
              Other

                                                                                 • Weak economic fundamentals balanced by yen appreciation
            The Gulf*
              India                                                              • Labor market and consumer spending improvement
              Japan
              Europe                                                             • Steady inbound tourism growth in luxury retail capitals
              China                                                              • Decreasing consumer confidence following Brexit and US tensions
                                                                                 • Acceleration of euro appreciation catalyzing domestic consumption

                                                                                 • Increasing demand for nonbridal jewelry from millennials
                                                                                 • Government adjustment on tax and customs to boost consumption
               US

                                                                                 • Healthy GDP growth and consumer-confidence upward trend
                                                                                 • Robust employment with job creation and wage growth

              2017                                                               • Tax cuts positively affecting consumption
                                                                                 • Increasing demand from affluent customers
*Includes Saudi Arabia, United Arab Emirates, Oman, Bahrain and Qatar
Note: China includes Hong Kong
Sources: Publication analysis; Euromonitor; Bain & Company

Figure 17: Currency movements in 2018 support diamond jewelry retail growth, in US dollar
terms

                        Change of currency value vs. $,                                                      Change of currency value vs. $,
                        2017 average vs. 2016 average                                                       2018E** average vs. 2017 average

     China                     −2%                                                            China                                                         4%

      India                                                             3%                     India              −3%

     Japan             −3%                                                                   Japan                                                 2%

Eurozone                                                       2%                         Eurozone                                                                   6%

The Gulf*                                          No change                             The Gulf*                                     No change

         −6            −4         −2           0           2             4     6%                 −6         −4         −2         0          2         4        6%

*Includes Saudi Arabia, United Arab Emirates, Oman, Bahrain and Qatar
**Estimate based on average of first 9 months of 2018
Sources: Thomson Reuters; Bain & Company

                                                                                    Page 18
5.
               •   Three trends have the highest potential to affect
                   the diamond industry in the near term: advancements
                   in digital technologies, the development of lab-grown
                   diamonds and generational shifts in consumer
                   preferences.

               •   Among other benefits, digital technologies are aiding
                   transparency and efficiency efforts across all segments
Key industry       of the value chain. For example, in 2017 and early
                   2018, blockchain projects were launched to help
trends             consumers confidently identify the origin of their
                   diamonds. Mining companies are using predictive
                   maintenance, real-time controls and artificial
                   intelligence to mitigate rising operating costs. Cutting
                   and polishing players are pursuing advanced solutions
                   in digital mapping, modeling and manufacturing
                   to shorten production cycles and ultimately move
                   toward fully automated processes to manufacture
                   polished diamonds. Consumer behavior is also
                   changing as technology matures; social media,
                   for example, is enabling and influencing new
                   direct-to-consumer and online sales models.

               •   Two important events occurred in 2018 regarding
                   the lab-grown diamond market. In July, the US Federal
                   Trade Commission amended its Jewelry Guides,
                   clarifying “a diamond is a diamond” regardless
                   of its origin. In September, De Beers Group launched
                   a lab-grown fashion jewelery retailer called Lightbox
                   Jewelery that introduced a new pricing paradigm.
                   Lightbox uses a linear pricing model, reflecting
                   the linear cost of production, whereby all lab-grown
                   stones cost $800 per carat, regardless of size.
                   Lightbox also does not provide grading reports for its
                   products. As the lab-grown industry continues to evolve
                   and lab-grown diamond prices decline, players along
                   the entire natural diamond value chain will need
                   to determine how to respond and how to position
                   their products with consumers.

               •   While much attention has been paid to millennial
                   buyers, their successors in Generation Z have been
                   gaining buying power, forcing the industry to rethink
                   marketing and sales strategies. Self-purchase sales
                   and social media shopping are expected to increase,
                   attracting younger generations of diamond buyers
                   with distinct preferences.
The Global Diamond Report 2018

Figure 18: Digital technologies affect all segments of the value chain

                                                Diamond                 Cutters and           Jewelry             Retailers
                                                producers               polishers             manufacturers

                Internet                      Real-time controls     Inventory tracking
                of Things (IoT)               Remote operating                              Quality controls    Omnichannel
                                              center                                                            touchpoints

                                                                                                                Personalized
                                              Predictive             3D mapping                                 marketing and
                Data science,                 maintenance            and modeling                               loyalty campaigns
                advanced analytics            Predictive analytics/demand forecasting
                and artificial intelligence

                                              Autonomous             Automated cutting
                Autonomous                    vehicles               and polishing          3D printing         In-store assistance
                activities                    Fully automated        Automated
                                              sorting                diamond grading

                Cybersecurity                 Distributed ledger/blockchain
                and design for veracity                              Digital inscription/digital watermarking

Source: Bain & Company

Figure 19: Digital is redefining business models for diamond jewelry retailers

 Seamless integration of                         Transformation                                Growing role of influencers
 physical and digital worlds                     of the retail experience                      and social media shopping

 • Digital-savvy customers switch                • Strategy for fewer but “bigger and         • Digital-age customers select and
   between offline and online channels             better” stores with focus on in-store        buy products via social networks
 • Functions like “click and collect,”             experience                                 • Disrupters like Catbird challenge
   online returns and online stock               • Facing price competition from                big brands with Instagram campaigns
   availability are becoming industry              online players, retailers spur traffic       and microinfluencer partnerships
   standard                                        to physical stores with shopping
                                                   and entertainment

Source: Bain & Company

                                                                Page 21
The Global Diamond Report 2018

Figure 20: Industry players must adapt their marketing strategies to attract younger consumers

                          Today’s customers                                           Tomorrow’s customers
                         (Generation X & late millennials)                             (Early millennials & Generation Z)

                                              Tech-literate                      Tech-innate

                          Independent and self-reliant                           Collaborative and global-minded

                                Value work-life balance                          Work toward own definition of success

                                   Require omnichannel                           Keen on social media shopping

                                                 Pragmatic                       Ethical

Source: Bain & Company

Figure 21: Strategic questions for different industry players

                 Mining                         Cutters                                                      Lab-grown
               companies                      and polishers                   Retailers                      producers
       • How can we use                    • How can we use             • How can we make use             • What changes are
         digital to improve                  digital to further           of social influencers             required to the business
         our operations?                     optimize yields and          and ensure readiness              model of the future with
                                             shorten cutting and          for social media                  increased competition
                                             polishing cycles?            shopping?                         and rapid price decrease?
                                        • What opportunities                                                 • Should the bet be
                                          can an automated                                                     on industrial or jewelry
  • What assortment                       process offer?             • Should lab-grown                        segment?
    will be affected                                                   diamonds be introduced
    by lab-grown                                                       into portfolio? How
    diamonds?                                                          could this affect our
    What does it mean                   • How can we redesign          brand and reputation?                 • How can we achieve
    for our asset portfolio?              our distribution system                                              cost leadership?
                                          to ensure confidence
                                          from retailers?
    • What should the                                                 • How should we adjust
      approach to marketing                                             footprint, product
      strategy be? How can                • How do we ensure            design, assortment                 • Is it necessary,
      we build a successful                 profitable growth of        and marketing messages               and if so, how do we
      brand around our supply?              our business?               to remain competitive                build a successful
                                                                        with other products?                 consumer brand?

Source: Bain & Company

                                                                    Page 22
6.
                   •   Lab-grown diamonds have existed for more than
                       60 years, with limited effect on the natural gem-quality
                       market. But advancements in technology have pushed
                       the lab-grown market into a more competitive position.
                       Most notably, new chemical vapor deposition (CVD)
                       technology deeply cut the cost to produce larger,
                       higher-quality diamonds. Today, it costs $300 to $500
                       per carat to produce a CVD lab-grown diamond,
Recent                 compared with $4,000 per carat in 2008.
developments       •   As production costs have dropped, retail prices have
                       followed. The retail price of gem-quality lab-grown
in the lab-grown       diamonds nearly halved in the past two years, while
market                 wholesale prices dropped threefold. Prices are
                       expected to decrease even further as production
                       efficiencies increase, new competitors enter the market
                       and the segment commoditizes.

                   •   Lab-grown diamond producers have two options:
                       to pursue gem-quality production for retail jewelry sales
                       or to produce diamonds for high-tech applications.
                       The latter option has the greatest potential for long-term
                       growth and profitability, as well as low barriers to entry.
                       Sensors, semiconductors and medical cutting tools,
                       for example, present an emerging market
                       for CVD-produced diamonds.

                   •   The current gem-quality, lab-grown polished diamond
                       capacity is estimated at 2 million carats majority
                       of which is melee (diamonds size less than 0.18 carats).
                       By 2030, the market could grow to between 10 million
                       and 17 million carats, if the segment can sustain its
                       current growth rate of 15% to 20% annually supported
                       by consumer demand and attractive economics. But we
                       believe manufacturing capacity will be a major limiting
                       factor in the short to medium term.

                   •   Ultimately, marketing and consumer perception
                       will determine the effect of lab-grown diamonds
                       on the natural diamond market. Three scenarios exist:
                       Consumers could perceive lab-grown and natural
                       diamonds as interchangeable, as two different products,
                       or somewhere in between. Marketing could uphold
                       the value of natural diamonds, especially if the prices
                       of lab-grown diamonds continue to drop. It’s probable
                       that consumers will view lab-grown diamonds as fashion
                       jewelry but not luxury goods, limiting the effect
                       on natural diamond demand.
The Global Diamond Report 2018

Figure 22: Lab-grown diamonds have existed for more than 60 years

           1960s                                              1970                              2000s                                      2018
    Commercialization                                 First lab-grown                       Commercialization                        De Beers Group
       of HPHT                                      gem-quality diamond                     of CVD technology                     launched “Lightbox” —
      technology                                     crystals produced                                                              lab-grown fashion
                                                                                                                                         diamond
                                                                                                                                      jewelry brand

    1950                      1960                     1970                  1980            1990                2000                 2010

             1953                                            1960s                               1970s                                     2016
      First successful                                       First CVD                        Volume of lab-                      International Grown
      HPHT diamond                                         diamond films                     grown diamonds                       Diamond Association
        synthesized                                         synthesized                      exceeded those                            is founded
                                                                                              for natural bort
                                                                                                and drilling

Note: CVD is chemical vapor deposition
Sources: Company data; expert interviews; Bain & Company

Figure 23: There are two technologies for producing lab-grown diamonds (industrial and jewelry)

                                             HPHT               High pressure,
                                                                high temperature                          CVD           Chemical vapor
                                                                                                                        deposition

                                             Imitation of the natural circumstances                       Produced layer by layer in a chamber
                                             for diamond growth                                           filled with ionized gas

Share of lab-grown
diamond market
by volume (industrial                        ~99%                                                         ~1%
and jewelry)

                                             • Cheap in comparison with CVD                               • Optical transparency

Special features                             • Variety in terms of structure and sizes                    • Excellent semiconducting properties

                                             • High mechanical properties                                 • High thermal conductivity

                                             • Largely used in construction industry                      • Mostly used in high-tech, medical
Applications
                                               for abrasive qualities                                       and jewelry manufacturing industries

Sources: Expert interviews; Bain & Company

                                                                                  Page 25
The Global Diamond Report 2018

Figure 24: Since 2008, CVD production costs have decreased tenfold, with further reductions
expected

Production cost of lab-grown 1ct G VS polished diamond (industry average estimate)

                             ~$4.0K
                                                            −50% to −60%

                                                                                               ~$1.6–$2.0K
                                                                                                                                ~−70% to −80%                         Including electricity
                                                                                                                                                                      cost of ~$15–$30

                                                                                                                                                                    ~$0.3–$0.5K

                              2008                                                                  2013                                                                 2018

Notes: Carat (ct) refers to final weight of polished diamond; production cost excludes polishing and certification; electricity cost of ~$15–$30 is equivalent to ~200–400 kWh
Sources: Expert interviews; Bain & Company

Figure 25: The retail price of gem-quality lab-grown diamonds nearly halved in the past two
years, while wholesale prices dropped threefold

Price of lab-grown diamond as a percentage of natural (1ct G VS polished)

                  ~80%

                                          ~70%
                                                                                        ~65%

                                                                                                               ~55%
                                                                                                                                                             ~50%

               Retail price
                                       Wholesale
                                         price

                                                                                                                                                                                  ~20%

                            Q4 2016                                                              Q4 2017                                                               Q4 2018

Note: Values calculated with the average discount and price for the given period
Sources: Thomson Reuters; expert interviews; online retailers’ websites; Bain & Company

                                                                                                Page 26
The Global Diamond Report 2018

Figure 26: The high-tech segment has the highest growth and margin potential for lab-grown
diamonds

Major applications of lab-grown diamonds

                                      Traditional use                     High-tech use                  Jewelry use

Technology                           • HPHT                              • Mostly CVD                   • Mostly CVD

                                     • Grinding and cutting tools        • Sensors, semiconductors,     • Colorless and colored
Use                                    for construction, energy            acoustics, medical cutting     gem-quality diamonds
                                       and mining companies                tools, optics and lasers       for jewelry

Maturity
of market
                                                     Mature                        Emerging                     Developing

Growth
potential
                                                       Low                         Very high                       High

Current                                               Low                           High                          High
profitability

Expected                                              Low                          Medium                          Low
profitability
Sources: Expert interviews; Bain & Company

Figure 27: Production capacity will limit lab-grown market growth in the short to medium term

Expected growth in lab-grown diamond capacity (aggressive expansion scenario), Mct gem-quality polished

                                                                        CAGR: 15%–20%                   ~17

                                                                                                        ~10

                                             ~2

                                             2018                                                       2030

Sources: Company data; expert interviews; Bain & Company

                                                                         Page 27
The Global Diamond Report 2018

Figure 28: Three potential market scenarios exist based on how consumers perceive lab-grown
diamonds

      Low                                                  Medium                                     High
      differentiation                                      differentiation                            differentiation
      Customers will see lab-grown                         Customers will differentiate               Customers will consider natural
      and natural diamonds as interchangeable              two products on occasion except            and lab-grown diamonds
      except for highest-quality stones                    for low-quality stones                     as two different products

      Lab-grown,                                              Lab-grown,                            Lab-grown,
      Mct                                                     Mct                                   Mct

                           Natural,                                                    Natural,                                    Natural,
                           Mct                                                         Mct                                         Mct

                            Unmet demand due
                            to capacity constraints

–25% to –30%                                      –10% to –15%                                      –0% to –5%
impact on natural value (2030)                        impact on natural value (2030)              impact on natural value (2030)

Source: Bain & Company

                                                                    Page 28
7.
                 •   Based on our analysis, we expect natural rough
                     diamond supply to change at an average annual rate
                     of negative 1% to 1% in volume terms through 2030.
                     We expect demand to grow 0% to 2% in real value
                     terms during the same time frame. Our current outlook
                     versus the forecast from the previous year incorporates
                     revised macroeconomic forecast, possible demand
                     substitution from lab-grown diamonds, and reflects
Updated supply       fundamental supply and demand factors rather than
and demand           short-term fluctuations. The short-term supply-demand
                     balance depends on the actions of major producers
model                and efficiencies along the diamond pipeline.

                 •   We expect China and the US to maintain their
                     leading roles in the diamond jewelry market.
                     Real GDP growth of 2% to 3% per year will fuel US
                     demand, and expansion of the middle class will
                     reinforce China’s positive long-term demand trend.

                 •   India continues to show promising signs of growth,
                     even amid its current market challenges. As India’s
                     middle class expands and bridal jewelry is adopted,
                     demand should follow.

                 •   Europe and Japan are expected to remain relatively
                     stable, with modest long-term growth prospects.

                 •   The rough diamond supply is reasonably predictable
                     over the next 5 to 10 years. However, financial
                     challenges, production mix updates and overall
                     uncertainty over future market conditions could force
                     or delay production. As mining companies can adjust
                     output to react to changing market conditions,
                     production may fluctuate at existing mines.

                 •   We based our rough diamond supply forecast
                     on an analysis of existing mines and anticipated
                     production at planned new mines. Our projections
                     also include potential supply from new sources, such
                     as tailings from older mines, reopening of distressed
                     mines, activation of options in resource development
                     plans and recycling of secondhand diamonds.
The Global Diamond Report 2018

Figure 29: Long- and short-term factors are driving the rough and polished diamond supply-demand
balance, as well as prices

                      Long-term factors                                                                                             Short-term factors

                       • Consumer preference trends                                                                                 • Short-term volatility of macroeconomic
                           – Diamond jewelry share in total jewelry
                                                                                                                                      factors (e.g., regional or global crises)
                             consumption
                                                                                                                                    • Geopolitical conflicts affecting
                           – Usage of diamonds in engagement and                                                                      consumer confidence
                             wedding jewelry

                           – Acceptance of lab-grown diamond jewelry                                                                • Pipeline efficiency as indicated
                                                                                                                                      by accumulating inventories

                       • Macroeconomic fundamentals                                                                                 • Market confidence of midstream
                                                                                                                                      players
                           – PDI and GDP growth for developed markets

                           – Dynamics of middle-class households                                                                    • Liquidity of midstream players

                       •     Supply fundamentals
                           – Long-term performance of current mines
                             (including depletion)

                           – Introduction of new mines

                           – Exploration of new deposits and tailings processing

Note: PDI is personal disposable income
Source: Bain & Company

Figure 30: Announced new projects could add up to 21 million carats per year in rough diamond
production

Forecasted rough diamond production of new mines, million carats, optimistic scenario

25

20

                                                                                                                                               Jay (Ekati)              Dominion Diamond
                                                                                                                                                                        Mines

10
                                                                                                                                               Luaxe                    Endiama/ALROSA

                                                                                                                                               Chidliak                 De Beers Group
                                                                                                                                               Star-Orion South         Star Diamond Corp
                                                                                                                                               Zarya                    ALROSA

 0                                                                                                                                             Other smaller projects
           2017               2019F              2021F               2023F              2025F                2027F              2029F 2030F

Note: Other smaller projects include Lace and Ghaghoo mines in case they start being operational in future in optimistic scenario
Sources: Company data; expert interviews; Bain & Company

                                                                                              Page 31
The Global Diamond Report 2018

Figure 31: Even in optimistic scenarios, rough diamond production is expected to decrease
in short term, led by the depletion of existing mines

                     Rough diamond supply, million carats,                                                                   Rough diamond supply, million carats,
                        2017–30, optimistic scenario                                                                               2017–30, base scenario

                                                                                       CAGR                                                                                                     CAGR
                                 Argyle closure;
180                             Ekati and Diavik                                     (2018–30)            180                                                                                 (2018–30)
                              production decrease                                    ~0% to 1%                                                                                               ~−2% to 1%
150                                                                                                       150

120                                                                                                       120

 90                                                                                                         90

 60                                                                                                         60

 30                                                                                                         30

   0                                                                                                         0
        2018E                  2022F                  2026F                  2030F                                2018E                  2022F                  2026F                  2030F

                                                                    Existing mines         New mines/projects           Additional production

Notes: Additional sources can come from tailings retreatment and production from new reserves that are identified in existing mines as a result of brownfield exploration and development; additional
sources also could include potential projects that are not in development now but may become viable should rough prices increase
Sources: Company data; Kimberley Process; expert interviews; Bain & Company

Figure 32: Real global GDP and PDI are expected to grow at 3% annually, fueling demand
for diamond jewelry

Real (2017 prices) global GDP, $ trillions
                                                                                                                                                                                                CAGR
                                                                                                                                                                                              (2018–30)
                                                                                                                                                                                                   3%
                                                                                                                                                                              125
                                                                                                                                                  117
                                                                                                                       110
                                                                                            103                                                                              Other                 5%
                                                                  96
                                      90
           83
                                                                                                                                                                            Japan                  1%
                                                                                                                                                                             India                 6%

                                                                                                                                                                            China                  5%

                                                                                                                                                                              US                   2%

                                                                                                                                                                           Europe                  2%

          2018                       2020                       2022                       2024                       2026                        2028                       2030

Real (2017 prices) PDI, $ trillions

           53                         56                          60                         63                         67                         70                         74                   3%

Note: PDI is personal disposable income
Sources: Euromonitor; Bain & Company

                                                                                               Page 32
The Global Diamond Report 2018

Figure 33: Growth of middle class in China and India is expected to reinforce positive long-term
demand trend

Middle class in China and India (estimated), millions of people
                                                                                                                                                                                CAGR
                                                                                                                                                                              (2018–30)
                                                                                                                                                                                   6%

                                                                                                                                                                 519
                                                                                                                                        478
                                                                                                               436
                                                                                                                                                                India              8%
                                                                                        393
                                                             352
                                    308
           264

                                                                                                                                                               China               5%

          2018                     2020                     2022                        2024                  2026                     2028                     2030

Note: Middle class is defined as the population between 75% and 125% of median income
Sources: Euromonitor; Bain & Company

Figure 34: The supply-demand outlook is moderately optimistic, with growth estimated at 0%–2%
in real terms (2%–4% in nominal)

Rough diamond supply and demand, $ billions (in real terms), 2000–30,
2018 prices, constant exchange rates, optimistic and base scenarios
                                                                                                                                                                                  CAGR
                                                                                                                                                                                (2018–30)
25

                                                                                                                        Optimistic demand and high
                                                                                                                        differentiation (lab-grown vs. natural)                    ~2%

20
                                                                                                                        Base demand and medium
                                                                                                                        differentiation (lab-grown vs. natural)                    ~0%

                                                                                                                        Optimistic supply                                       ~0–1%
15
                                                                                                                        Base supply                                               ~−1%

10

 5
 2000 2002             2006           2010           2014          2018F          2022F         2026F          2030F

Note: Rough diamond demand has been converted from polished diamond demand using historical ratio of rough diamond and polished diamond values; сhange in 2030 demand outlook versus
previous year's forecast is driven mostly by revised macroeconomic forecast and potential substitution from lab-grown diamonds
Sources: Kimberley Process; Euromonitor; Economist Intelligence Unit; company reports; expert interviews; Bain & Company

                                                                                          Page 33
The Global Diamond Report 2018

Figure 35: Delayed production of 2014–16 materialized in production growth in 2017–18,
exceeding previously announced plans

Actual rough diamond production vs. publicly announced plans, million carats

                        −17%                                  −16%                                     −13%                                  8%                2%

                        −14%                                  −10%                                      −7%                                  6%                4%

                                             152                                                                                             151
       150
                                                                                                                                                               147
                146                                                                   146
                                                                                                                                                   144
                                                      142                                                                         142                    142
                                                                                                                        140
                                                                                              137

                                                               127                                      127
                         125

               2014                                    15                                      16                                  17                    18E

                                                         Plan 2 years before actual         Plan 1 year before actual   Actual / estimated

Sources: Company data; Kimberley Process; expert interviews; Bain & Company

                                                                                            Page 34
The Global Diamond Report 2018

Glossary

•   Average price per carat sold — indicator used to estimate change in value of diamond assortment
    realized in specific period (including sales of stock produced in previous periods); to estimate
    average price per carat sold, total value of diamonds sold is divided by total volume of diamonds sold.

•   Beneficiation — the process by which producing governments seek to extract more value from their
    natural resources by developing downstream industries in their own countries; typically it involves
    commitments by producer companies to set up local cutting centers and hire local workers.

•   CAGR — compound annual growth rate, a year-on-year growth rate over a specified period
    of time.

•   Carat — one of the four main diamond characteristics, the others being color, cut and clarity;
    1 carat=250 mg.

•   CVD — chemical vapor deposition, a high-temperature but normal-pressure process to grow
    lab-grown diamonds.

•   Gem-quality diamonds — diamonds used for jewelry manufacturing.

•   HPHT — high-pressure, high-temperature; a process using large presses to grow lab-grown
    diamonds.

•   Kimberley Process — certification commitment aimed at prevention of conflict diamond sales.

•   Lab-grown diamonds — diamonds produced in laboratories using HPHT or CVD methods;
    also known as synthetic diamonds.

•   Market price index — indicator that shows change in market price for like-for-like diamond
    categories weighted according to global rough and polished product mix.

•   Operating profit — profit from main operations before interest and tax.

•   Personal disposable income — amount of money that households have available for spending
    and saving after paying income taxes.

•   Reserves — resources known to be economically feasible for extraction.

•   Resources — valuable deposits that could potentially be economically extracted at a later point.

                                                 Page 35
The Global Diamond Report 2018

Key contacts for this report

This report was prepared by Olya Linde, a partner with Bain & Company, and Oleg Geyler, a principal
with Bain, together with Ari Epstein, chief executive officer, AWDC. The authors were supported
by a global team including Ivan Grishchenko, Sophia Kravchenko, Benoit Menardo, Anton Matalygin,
Julia Gavrilova, Masha Shiroyan, and Bain’s Mining and Luxury Goods practices.

Media contacts:
Dan Pinkney
Bain & Company
Phone: +1 646 562 8102
Email: dan.pinkney@bain.com

Margaux Donckier
AWDC
Phone: +32 47 832 4797
Email: margaux.donckier@awdc.eu

                                              Page 36
Shared Ambition, True Results

Bain & Company is the management consulting firm that the world’s business leaders come
to when they want results.

Bain advises clients on strategy, operations, technology, organization, private equity and mergers
and acquisitions. We develop practical, customized insights that clients act on and transfer skills that
make change stick. Founded in 1973, Bain has 57 offices in 36 countries, and our deep expertise
and client roster cross every industry and economic sector. Our clients have outperformed the stock
market 4 to 1.

What sets us apart

We believe a consulting firm should be more than an adviser. So we put ourselves in our clients’ shoes,
selling outcomes, not projects. We align our incentives with our clients’ by linking our fees to their results
and collaborate to unlock the full potential of their business. Our Results Delivery® process builds our
clients’ capabilities, and our True North values mean we do the right thing for our clients, people
and communities—always.
For more information, visit www.bain.com
You can also read