New Mexico Clean Fuel Standard Evaluation - Adelante ...
←
→
Page content transcription
If your browser does not render page correctly, please read the page content below
New Mexico Clean Fuel Standard Evaluation
Adelante Consulting, Inc.
NM CFS Evaluation – January 7, 2021

CONTENTS

EXECUTIVE SUMMARY ....................................................................................................................... ES-1
1.0 NEW MEXICO TRANSPORTATION FUEL SUPPLY CHAIN ............................................................ 1
   1.1         NEW MEXICO PETROLEUM FUEL SUPPLY, DISTRIBUTION, AND DEMAND ................................................................... 1
   1.1.1       CRUDE OIL PRODUCTION.................................................................................................................................. 1
   1.1.2       CRUDE OIL DISTRIBUTION................................................................................................................................. 1
   1.1.2.1        CRUDE OIL PIPELINES.................................................................................................................................. 1
   1.1.2.2        CRUDE OIL RAIL TERMINALS......................................................................................................................... 1
   1.1.2       REFINERIES .................................................................................................................................................... 3
   1.1.3       PETROLEUM PRODUCT DISTRIBUTION ................................................................................................................. 3
   1.1.3.1        PETROLEUM PRODUCT PIPELINES .................................................................................................................. 3
   1.1.3.2        PETROLEUM PRODUCT TERMINALS ................................................................................................................ 3
   1.1.4       PETROLEUM PRODUCT DEMAND ....................................................................................................................... 3
1.2 NEW MEXICO NATURAL GAS AND HGL FUEL SUPPLY, DISTRIBUTION, AND DEMAND ......... 4
   1.2.1       NATURAL GAS PRODUCTION ............................................................................................................................. 4
   1.2.2       NATURAL GAS AND HGL DISTRIBUTION .............................................................................................................. 4
   1.2.3       NATURAL GAS AND HGL DEMAND ..................................................................................................................... 6
   1.3.1       ALTERNATIVE FUEL PRODUCTION ....................................................................................................................... 6
1.4 ELECTRICITY ..................................................................................................................................... 9
   1.4.1       ELECTRICITY SUPPLY ........................................................................................................................................ 9
   1.4.2       ELECTRIC VEHICLES........................................................................................................................................ 12
   1.4.3       EV CHARGING PROVIDERS .............................................................................................................................. 12
2.0 CFS COSTS, BENEFITS, AND OPPORTUNITIES .......................................................................... 13
   2.1         MACROECONOMIC IMPACTS ........................................................................................................................... 13
   2.1.1       FINANCIAL INVESTMENT ................................................................................................................................. 13
   2.1.2       EMPLOYMENT TRENDS ................................................................................................................................... 14
2.2 TRANSPORTATION FUELS ............................................................................................................ 14
   2.2.1       CONVENTIONAL FUEL PRICES .......................................................................................................................... 14
   2.2.2       PETROLEUM REDUCTIONS .............................................................................................................................. 14
   2.2.3       SECTORAL IMPACTS ....................................................................................................................................... 15
   2.2.4       CFS REGULATED PARTIES ............................................................................................................................... 15
2.3 FUELS AND CREDIT GENERATION ............................................................................................... 16
   2.3.1       LIQUID BIOFUELS .......................................................................................................................................... 16
   2.3.1.1        ETHANOL................................................................................................................................................ 16
   2.3.1.2        BIODIESEL ............................................................................................................................................... 16
   2.3.1.3        RENEWABLE DIESEL .................................................................................................................................. 17
   2.3.2       ELECTRICITY ................................................................................................................................................. 17
   2.3.3       NATURAL GAS AND RENEWABLE NATURAL GAS .................................................................................................. 17
   2.3.4       HYDROGEN .................................................................................................................................................. 17
   2.3.5       REFINERIES .................................................................................................................................................. 18
   2.3.5.1        REFINERY EFFICIENCY ................................................................................................................................ 18
   2.3.5.2        RENEWABLE HYDROGEN ............................................................................................................................ 18
   2.3.6       CARBON CAPTURE AND SEQUESTRATION (CCS) .................................................................................................. 18
   2.3.7       OFF-ROAD .................................................................................................................................................. 18

                                                                                     i
Adelante Consulting, Inc.
NM CFS Evaluation – January 7, 2021
2.3.7.1 ELECTRICITY AND ELECTRIFICATION .............................................................................................................. 18
2.3.7.2 INNOVATIVE HYDROCARBONS ..................................................................................................................... 18
3.0 CONCLUSIONS ................................................................................................................................ 19
TABLES AND FIGURES
TABLE 1 PUBLICLY ACCESSIBLE EV CHARGING OUTLETS IN NEW MEXICO ........................................................................... 12
FIGURE 1 PETROLEUM REFINERIES, CRUDE OIL RAIL TERMINALS, AND PETROLEUM PIPELINES IN NEW MEXICO ................................ 2
FIGURE 2 INTERSTATE NATURAL GAS PIPELINES AND PROCESSING FACILITIES AND HGL PIPELINES IN NEW MEXICO........................... 5
FIGURE 3 INTRASTATE NATURAL GAS PIPELINES IN NEW MEXICO ........................................................................................... 7
FIGURE 4 ELECTRICAL TRANSMISSION LINES IN NEW MEXICO .............................................................................................. 11
iiAdelante Consulting, Inc.
NM CFS Evaluation – January 7, 2021
Executive Summary
With the passage of the Energy Transition Act in 2019, the State Legislature set New Mexico on a path to
reduce its greenhouse gas (GHG) emissions from electrical power generation to net zero by 2050. The
New Mexico Environment Department and the Energy, Minerals and Natural Resources Department have
issued draft regulations designed to curb methane emissions from oil and gas exploration and production.
With transportation fuels contributing 22 percent of statewide emissions of GHGs in 2018, instituting a
program to reduce GHG emissions from the transportation sector is the logical next step.
This report presents a preliminary evaluation of the environmental and economic impacts of implementing
a clean fuel standard (CFS)1 in New Mexico. A CFS is a market-based trading program under which the
State specifies a schedule on which the carbon intensity (CI) of transportation fuels must be reduced, and
the regulated entities must either adjust their operations to meet the rate of reduction, or buy credits from
those whose reductions have exceeded the requirements. This type of program incentivizes investment in
innovative technologies that deliver early, deep reductions, with a revenue stream from the sale of carbon
credits accelerating the return on investment. It also relieves the financial pressure on entities for whom
technology upgrades would cost more than purchasing carbon credits. Importantly, a CFS is fuel neutral;
each regulated entity is incentivized equally for innovation, and each such entity can choose instead to
pay the going market rate for carbon credits. Fuel diversification, including the buildout of infrastructure
and the increased use of a diversified transportation fuel mix, would facilitate economic and employment
growth in New Mexico.
Similar programs have been implemented in the U.S. by California and Oregon, and are currently being
considered by other states including Washington2, Nevada3, Colorado4 and New York5. Policy experts are
forecasting that by 2025, half of the states in the U.S. will have adopted a CFS6 -- muting the advantage
that early adopters will enjoy in recruiting innovative enterprises and attracting investment dollars to build
a 21st Century Energy Economy.
A New Mexico Clean Fuel Standard can provide significant economic benefits to the state and have very
minimal, if any, impact on fuel costs to customers. Our analysis determined that a CFS will generate up to
$46.3M/yr in investments in New Mexico decarbonization projects.7
As for the cost of a CFS to the consumer, we relied on two data sources: California and Colorado’s worst-
case estimates of an increase of $0.12/gal in the retail price of fuel8 assuming that the full cost of
1
The terms Clean Fuel Standard and Low Carbon Fuel Standard are used interchangeably throughout this report to
describe the same type of program.
2
Washington State Energy Strategy 2021 (Draft), November 2020. https://www.commerce.wa.gov/wp-
content/uploads/2020/11/WA-2021-State-Energy-Strategy-FIRST-DRAFT.pdf
3
State of Nevada Climate Initiative, December 2020. https://climateaction.nv.gov/our-strategy/
4
Low Carbon Fuel Standard Feasibility Study Final Report, ICF, September 2020.
5
NY State Senate Bill S4003A. https://www.nysenate.gov/legislation/bills/2019/s4003
6
Jim Lane, Biofuels Digest, in a presentation at the Advanced Bioeconomy Leadership Conference, Washington,
DC, April 2019.
7
Based on statewide transportation fuel consumption in 2018, and assuming 1) that a clean fuel standard would
require a one percent reduction in carbon intensity (CI) per year, and 2) that a credit is valued at $200/MT, which
was the 2019-2020 trading price under CA’s Low Carbon Fuel Standard (LCFS).
8
California Petroleum Market Advisory Committee 2017.
https://efiling.energy.ca.gov/GetDocument.aspx?tn=221306&DocumentContentId=22709
ES-1Adelante Consulting, Inc.
NM CFS Evaluation – January 7, 2021
compliance is passed through to the retail customer, and an analysis by Biofuels Digest 9 of California fuel
prices compared to the nationwide average in 2010 (baseline), 2014 (LCFS), and 2020 (present day).
The author concluded that “There is no difference between fuel prices for gasoline or diesel, that can be
assigned from price data to the impact of a Low Carbon Fuel Standard.”
Adoption of a Clean Fuel Standard would offer benefits across industry sectors. It is well established that
the oil and gas industry contributes significantly to the New Mexico economy, and the elements of a CFS
can, and should, be tailored to assure that oil and gas operations are afforded ample opportunity to
incentivize reductions in the CI of fossil fuels. Such incentives will not diminish the opportunities available
to alternative fuel producers. Alternative fuels and related products could be provided by electricity
providers, the dairy industry, agriculture, and forest management activities. The bottom line is that,
regardless of industrial sector, a project that delivers the greatest reduction in CI will be the most
valuable. The remainder of the Executive Summary will provide examples (by no means an exhaustive
list) of the types of projects that might be available to producers of different types of fuels.
Crude Oil and Natural Gas Production
The persistence of a methane cloud over the San Juan Basin has been reported nationwide, and
attributed to vented, flared and fugitive methane from coal seams and natural gas operations. Oil and gas
operations in the Permian Basin are also a significant source of methane emissions. There are some
installations that are of themselves significant sources of methane emissions, and these will be regulated
under the NMED’s and EMNRD’s impending regulations. However, there are also many more sources –
insignificant when appraised individually, but collectively very significant – that will not fall under the new
regulations because it is economically infeasible for them to comply. A CFS could be naturally
complementary to the regulatory program if the CFS’ economic incentives allow small-scale methane
capture projects to pencil out.
As an example, fugitive methane emissions, captured and aggregated to a sufficient volume, could
become a feedstock for hydrogen fuel production and its carbon dioxide by-product could be used for
enhanced oil recovery (EOR) and sequestered geologically. Alternatively, production equipment could be
converted from fossil fuel to solar- or wind-powered electric; or solar arrays could be used to generate
steam for thermal EOR. Larger companies such as Occidental Petroleum Corporation (OXY) – which in
August 2020 committed to reducing its GHG emissions to net-zero by 2040 – can leverage the market
incentives of a CFS to accelerate construction of a direct air capture unit on the New Mexico side of the
Permian Basin. Captured carbon dioxide could then be used as a feedstock for low carbon fuels or
products, further amplifying the local positive economic impact.
Refineries
HollyFrontier owns New Mexico’s sole operational refinery. Located in in Artesia, it has a production
capacity of 110,000 barrels/day.10 Early in 2020, the company announced its intention to make a $350M
capital expenditure to add a renewable diesel production line to the refinery11 Then, on June 1, 2020, the
9
Jim Lane, “What Effect do Low carbon Fuel Standards Have on Fuel Prices?,” Biofuels Digest, Feb. 17, 2020.
https://www.biofuelsdigest.com/bdigest/2020/02/17/what-impact-do-low-carbon-fuel-standards-have-on-fuel-
prices/
10
http://www.eia.gov/petroleum/refinerycapacity/
11
Robert Brelsford, “HollyFrontier lets contract for renewable diesel unit at Navajo refinery,” Oil and Gas Journal,
March 23, 2020. https://www.ogj.com/refining-processing/refining/construction/article/14170289/hollyfrontier-
lets-contract-for-renewable-diesel-unit-at-navajo-refinery
ES-2Adelante Consulting, Inc.
NM CFS Evaluation – January 7, 2021
company issued a press release12 on the construction of a pretreatment unit at the Artesia refinery. The
press release reads, in part, as follows: “HollyFrontier also plans to construct a PTU that will process over
80% of the feedstock for both of HollyFrontier’s renewable diesel plants. The PTU is expected to provide
feedstock flexibility, mitigating single feedstock risk and generating value through the use of lower carbon
intensity feed. HollyFrontier estimates the capital cost of the PTU to be $175-$225 million and the in-
service date to be in the first half of 2022. The PTU has an expected internal rate of return of 10-15% but
is intended to protect the returns of HollyFrontier’s renewables business against potential volatility in the
feedstock markets.” With a NM CFS, HollyFrontier could generate and sell credits for projects such as
these.
Alternative Fuels
Ethanol
New Mexico is brimming with unrealized potential in the alternative fuels arena. It imported 100 percent of
the 2,400,000 barrels of ethanol it consumed. With the market-based incentives provided by a CFS, New
Mexico could be positioned to attract a second-generation, cellulosic ethanol producer to the state. Such
a plant could be located in the eastern part of the state, and use as its feedstock agricultural waste such
as corn stover, if an ample supply exists. Alternatively, a cellulosic ethanol plant could be built in the
central part of the state and use low/no-value woody biomass as its feedstock. A feedstock supply chain
analysis performed for Sandoval County under a USFS Wood Innovations Grant determined that there is
a 25-year supply of forest, green waste and agricultural biomass, combined, that could be delivered to a
production facility at rate of 80,000 bone-dry ton (BDT)/yr and a cost of $45/BDT.13 A cellulosic ethanol
plant would present an opportunity to co-locate it with a bio-based carbon fiber manufacturing plant that
uses waste lignin from ethanol production as its feedstock.
Biodiesel
New Mexico does not currently produce biodiesel and all biodiesel is supplied from out of state. The
statewide demand of 400,000 barrels in 2018 would be tripled, but for the continuous renewal of the
statewide exemption from the biodiesel blending mandate due to cost considerations. Such cost
considerations could disappear under a NM CFS, given that the current CI market value of biodiesel is
approximately $1.57/gal.14
Renewable Natural Gas
Renewable natural gas (RNG) is currently collected and beneficially reused onsite (e.g., for heating or
electrical power generation) at nine municipal wastewater treatment plants and two municipal landfills (out
of nine candidates)15 The largest, and as yet untapped, source of RNG in New Mexico is its dairies. New
Mexico has approximately 130 dairies, with the largest average herd size (2,357) in the nation. New
Mexico is currently ranked 9th in the nation for milk production and 5th in the nation for cheese
12
https://www.hollyfrontier.com/investor-relations/press-releases/Press-Release-Details/2020/HollyFrontier-
Announces-Expansion-of-Renewables-Business/default.aspx
13
Adelante Consulting, Inc., “Final Report to Sandoval County: Biomass Utilization Feasibility Study for Bio-Based
Manufacturing,” December 9, 2020.
14
Biofuels Digest, “A Digest Connect Presentation: California’s Green Rush,” August 2020.
https://www.biofuelsdigest.com/bdigest/2020/08/18/17-projects-with-4-billion-gallons-9-fast-emerging-players-
the-digests-2020-multi-slide-guide-to-californias-green-rush/
15
Project and Landfill Data by State, USEPA, https://www.epa.gov/lmop/project-and-landfill-data-state
ES-3Adelante Consulting, Inc.
NM CFS Evaluation – January 7, 2021
production.16 On December 31, 2019, Biofuels Digest reported that Tucumcari Bio-Energy would start
construction in February on an $8M project to convert New Mexico’s sole (and shuttered) ethanol plant
into a cellulosic biogas producer, converting cattle waste to RNG; the current status of this project is
unknown. In March 2020, Dominion Energy and Vanguard Renewables Ag announced a $200M
partnership to fund such projects at dairy farms in five states, including New Mexico.17 Additionally, at
least one California-based company that produces a low-carbon fuel blend from renewable natural gas
expressed interest in early 2020 in exploring partnerships with New Mexico dairies on livestock manure
projects.18 The availability of credits under a New Mexico CFS would surely accelerate such projects.
Renewable Electricity
New Mexico is a net exporter of both conventional and renewable electricity, which as a transportation
fuel is used primarily to charge electric vehicles (EVs). Of the approximately 650,000 passenger vehicles
registered in New Mexico19 , 1,260 are EVs.20 Growth in this sector is currently constrained by the lack of
incentives and statewide availability of public charging stations. Consequently, EVs are most frequently
charged at home, and are typically used for intracity travel. There remains significant potential for growth
in the EV market as the charging infrastructure becomes more robust. Electric utilities could use revenues
from CFS credits to invest in EV infrastructure and incentives to increase EV adoption.
Hydrogen
New Mexico neither produces nor consumes hydrogen as a transportation fuel. The current situation
belies the potential for New Mexico to develop a robust hydrogen economy. Nearly all hydrogen is
produced from methane, via the process of steam methane reformation. Traditional steam methane
reformers are large pieces of equipment that are fixed in place, once constructed. Now, a New Mexico-
based company, BayoTech, is building mobile, modular reformers – which can be transported to places
where methane is being generated. If fugitive methane emissions from the Permian and the San Juan
Basins can be captured in sufficient quantity and used for feedstock in hydrogen fuel production, it could
incentivize the development of a network of hydrogen fueling stations.
16
Dairy Producers of New Mexico. www.nmdairy.org
17
https://www.sltrib.com/news/nation-world/2020/02/03/project-seeks-convert/
18
Confidential client, Adelante Consulting, Inc.
19
https://www.statista.com/statistics/196060/number-of-registered-automobiles-in-new-mexico/
20
USDOE Alternative Fuels Data Center, August 2020. https://afdc.energy.gov/data/10962
ES-4Adelante Consulting, Inc.
NM CFS Evaluation – January 7, 2021
1.0 New Mexico Transportation Fuel Supply Chain
The following discusses the transportation fuel supply chain in New Mexico, including supply, distribution,
and demand. The evaluation includes petroleum fuels, natural gas and hydrocarbon gas liquids (HGL),
and alternative fuels. The transportation fuel supply chain evaluation provides information needed to help
identify strategies for implementing a clean fuels program in New Mexico.
1.1 New Mexico Petroleum Fuel Supply, Distribution, and Demand
Petroleum fuels currently provide the majority of transportation fuels used in New Mexico. New Mexico is
supplied with refined petroleum products produced in state, as well as refined petroleum products
supplied from out-of-state via pipelines, rail, and tanker trucks. The following sections describe
production, distribution, and refining of crude oil in New Mexico; distribution of refined petroleum products,
and demand for petroleum transportation fuels within New Mexico.
1.1.1 Crude Oil Production
New Mexico is one of the largest producers of crude oil in the United States. Crude oil is produced
primarily in southeast New Mexico, in the Permian Basin region, and in the northwest corner of New
Mexico. The total production of crude oil in New Mexico in 2018 was 248,958,000 barrels (682,000
barrels/day)21, which was third in the U.S. behind Texas and North Dakota.
1.1.2 Crude Oil Distribution
Crude oil in New Mexico is distributed within New Mexico using pipelines and by rail.
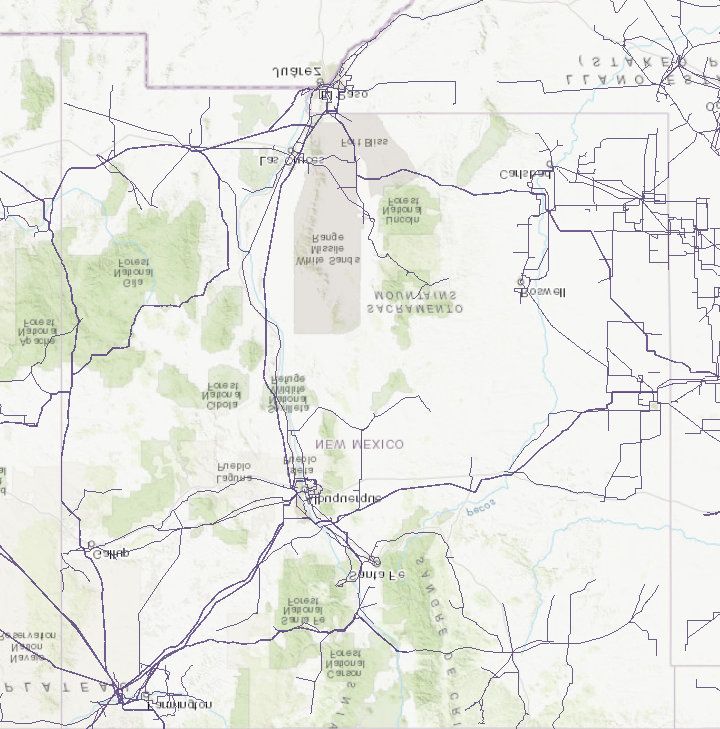
1.1.2.1 Crude Oil Pipelines
Western Refining operates a pipeline between the southeast corner of New Mexico and the Farmington
area (Figure 1). The southern end of the line is connected to other pipelines operated by Centurion
Pipeline, which connect to the Carlsbad, NM, area and to western Texas, and by Magellan Midstream,
which connects to the Hobbs, NM, area. The northern end of the pipeline includes a loop that connects
with the Marathon refinery in Gallup, NM.
1.1.2.2 Crude Oil Rail Terminals
The following crude oil rail terminals are operated in New Mexico (Figure 1)
(https://www.eia.gov/state/maps.php):
• Centane Rail Loading Terminal – Carlsbad
• Gallup Refinery – Gallup
• Navajo Refinery – Artesia
21
https://www.eia.gov/state/seds/sep_prod/pdf/P1.pdf
1Adelante Consulting, Inc.
NM CFS Evaluation – January 7, 2021
mN
0 20 40 80 Miles
layer0:Sources: Esri, HERE, Garmin, Interm ap, increment P Corp., GEBCO, USGS,
Petroleum Refinery
Crude Oil Pipeline (z)
Petroleum Product Pipeline (z)
HGL Pipeline (z)
Crude Oil Rail Terminal
Figure 1 Petroleum refineries, crude oil rail terminals, and petroleum pipelines in New Mexico
(https://www.eia.gov/state/?sid=NM)
2Adelante Consulting, Inc.
NM CFS Evaluation – January 7, 2021
1.1.2 Refineries
There are two refineries in New Mexico. The HollyFrontier Navajo Refinery is located in Artesia and has
an operating capacity of 110,000 bbl/day22. The Marathon refinery is located in Gallup and has an
operating capacity of 27,000 bbl/day23. Operations at this facility were recently halted and there are no
plans to resume. The total in-state refining capacity is far less than the in-state crude oil production rate
(section 1.1.1), so New Mexico is a net exporter of crude oil.
1.1.3 Petroleum Product Distribution
Petroleum products are distributed throughout New Mexico via pipelines, rail, and trucks. Pipelines and
rail are used to transport products to distribution terminals where they are loaded onto trucks for delivery
customers.
1.1.3.1 Petroleum Product Pipelines
The petroleum product network within New Mexico is shown in Figure 1. Nustar Energy operates two
pipeline segments within New Mexico. One connects Albuquerque with Amarillo, TX, and the other
connects Sunray, TX, with El Paso, TX, passing through New Mexico. The Magellan Midstream
Pipeline connects Albuquerque with El Paso, TX and the Enterprise Rocky Mountain Pipeline connects
Borger, TX, with Farmington, NM.
1.1.3.2 Petroleum Product Terminals
Petroleum Product Terminals
Twelve petroleum product terminals are located in New Mexico. The operators and locations are as
follows (https://www.eia.gov/state/?sid=NM):
• Andeavor Logistics24, Albuquerque (2)
• Andeavor Logistics, Bloomfield
• Andeavor Logistics, Jal
• Andeavor Logistics, Wingate
• Dansk Wholesale, Lordsburg
• Hollly Energy Partners, Moriarty
• IMTT Epic, Alamogordo
• NK Asphalt Partners, Albuquerque
• NK Asphalt Partners, Artesia
• Nustar Energy, Santa Domingo
• Phillips 66, Albuquerque
1.1.4 Petroleum Product Demand
Total consumption of motor gasoline in New Mexico in 2018 was 24,100,000 barrels (66,000
barrels/day)25.
22
http://www.eia.gov/petroleum/refinerycapacity/
23
(http://www.eia.gov/petroleum/refinerycapacity/
24
Andeavor was acquired by Marathon in October 2018
25
https://www.eia.gov/state/seds/data.php?incfile=/state/seds/sep_sum/html/sum_use_tot.html&sid=NM
3Adelante Consulting, Inc.
NM CFS Evaluation – January 7, 2021
Total consumption of distillate fuel oil in New Mexico in 2018 was 18,600,000 barrels (51,000
barrels/day), including biodiesel blended into distillate fuel oils26.
Total consumption of jet fuel in New Mexico in 2018 was 1,300,000 barrels (3560 barrels/day)27).
Although refinery capacity was not broken out into specific products (section 1.1.2), based on total
refinery capacity and total transportation fuel use, the total consumption of petroleum transportation fuels
in New Mexico exceeds the in-state production capacity.
1.2 New Mexico Natural Gas and HGL Fuel Supply, Distribution, and Demand
Natural gas and HGL are not widely used as transportation fuels in New Mexico. A clean fuels program,
however, provides an opportunity for increased use of natural gas and propane for transportation use.
The following sections summarize natural gas and propane production, distribution, and demand in New
Mexico.
1.2.1 Natural Gas Production
New Mexico is one of the largest producers of natural gas in the United States. As with crude oil, natural
gas is produced primarily in southeast New Mexico, in the Permian Basin region, and in the northwest
corner of New Mexico. The total production of natural gas in New Mexico in 2018 was 1485 billion cubic
feet (4.1 billion cubic feet/day)28, which was ninth in the U.S. Natural gas processing facilities are shown
in Figure 2 and are concentrated in the southeastern corner of New Mexico and the Farmington area.
1.2.2 Natural Gas and HGL Distribution
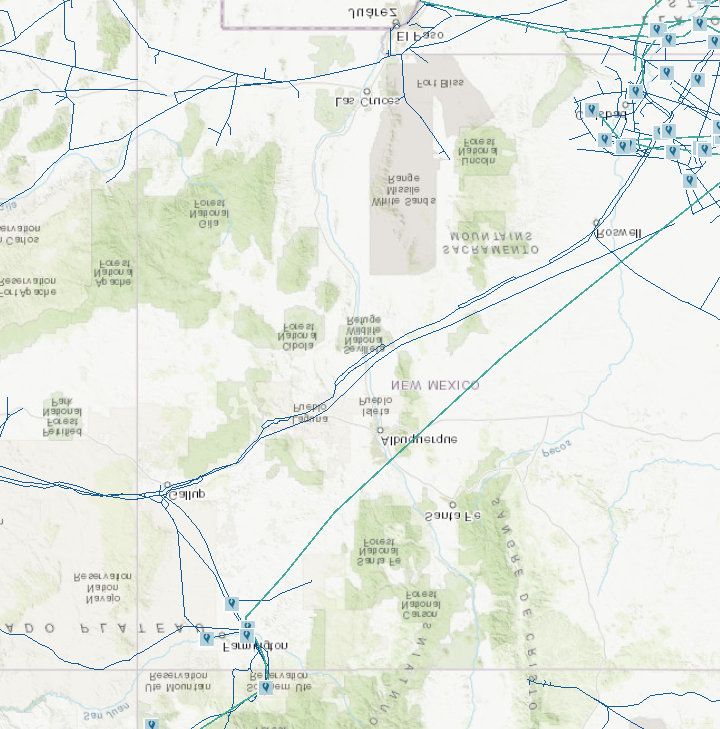
Natural gas and HGL are distributed in New Mexico through pipelines. Interstate natural gas pipeline
locations are shown in Figure 2 and are similar to petroleum pipeline locations, connecting major
production areas in southeast and northwest New Mexico with the neighboring states of Arizona,
Colorado, and Texas. El Paso Natural Gas and Transwestern Gas Company each operate a pipeline
running from the Permian Basin region of Texas through Gallup, NM, to Arizona. From Gallup, the lines
also connect north through Farmington to Colorado. El Paso Natural Gas also operates multiple pipelines
from the Permian Basin to the Carlsbad, NM, area as well as from El Paso, through Deming, NM, to
Arizona. The TransColorado Gas Transport pipeline and the Questar Southern Trails Line run from
Farmington to Colorado.
HGL is transported through the Enterprise Mid-America pipeline from the Permian Basin through
Farmington and north to Colorado (Figure 2).
Natural gas is also transported within the state through intrastate pipelines (Figure 3). Gas Company of
New Mexico operates a series of pipelines in the northern portion of the state serving the Albuquerque,
Farmington, Gallup, Grants, Santa Fe, and Taos areas. Public Service Company of New Mexico also
operates a series of pipelines in southeast New Mexico serving the Carlsbad, Hobbs, and Roswell areas.
26
https://www.eia.gov/state/seds/data.php?incfile=/state/seds/sep_sum/html/sum_use_tot.html&sid=NM
27
https://www.eia.gov/state/seds/data.php?incfile=/state/seds/sep_sum/html/sum_use_tot.html&sid=NM
28
https://www.eia.gov/state/seds/sep_prod/pdf/P1.pdf
4Adelante Consulting, Inc.
NM CFS Evaluation – January 7, 2021
mN
0 20 40 80 Miles
layer0:Sources: Esri, HERE, Garmin, Interm ap, increment P Corp., GEBCO, USGS,
Natural Gas Processing Plant
HGL Pipeline (z)
Natural Gas Interstate Pipeline (z)
Figure 2 Interstate natural gas pipelines and processing facilities and HGL pipelines in New
Mexico (https://www.eia.gov/state/?sid=NM)
5Adelante Consulting, Inc.
NM CFS Evaluation – January 7, 2021
1.2.3 Natural Gas and HGL Demand
Total consumption of natural gas in New Mexico in 2018 was 271.5 billion cubic feet29. This amount is
equal to approximately 18% of the natural gas produced in the state during the same period. Natural gas
consumption in New Mexico in 2018 in the transportation sector was 28.4 trillion BTU, which is equivalent
to approximately 27.4 billion cubic feet, or approximately 10% of the total consumption
(https://www.eia.gov/state/seds/data.php?incfile=/state/seds/sep_sum/html/sum_btu_tra.html&sid=NM).
Natural gas consumption in the transportation sector is gas consumed in the operation of pipelines,
primarily in compressors, and compressed natural gas (CNG) consumed as vehicle fuel. As of November
2020, there were 11 CNG fueling stations (8 public and 3 private), 1 public LNG fueling station, and 55
public LPG fueling stations in New Mexico30.
Total consumption of HGL in New Mexico in 2018, which included natural gas liquids and refinery olefins
was 1,900,000 barrels31. HGL consumption in the transportation section, which is assumed to be
propane, was 100 billion BTU, which is equivalent to approximately 26,000 barrels, or approximately
1.4% of the total consumption.
1.3 New Mexico Alternative Fuel Supply, Distribution, and Demand
1.3.1 Alternative Fuel Production
Alternative transportation fuels currently include fuel ethanol, biodiesel, renewable diesel, renewable
natural gas, and hydrogen.
Ethanol, which can be produced from corn, sugar cane, or cellulosic biomass (e.g., wood waste), is
blended into gasoline, typically at 10%, to reduce air pollution. Ethanol may also be blended at 85% (E85)
for use in “flex fuel” vehicles. There was no production of fuel ethanol in New Mexico in 201832 , although
almost all of the gasoline sold in the state contains at least 10% ethanol. As of November 2020, there
were 14 E85 fueling stations in New Mexico (9 public and 5 private)33. These are located in Albuquerque,
Artesia, Clovis, Las Cruces, Santa Fe, and Taos.
Biodiesel is an alternative fuel that can be used in diesel engines and is produced from vegetable oils,
animal fats, or recycled restaurant grease. Biodiesel is blended into petroleum diesel (typically 5% to
20%). New Mexico has a mandate that all diesel fuel sold for use in on-road motor vehicles to state
agencies, political subdivisions of the state, and public schools must contain at least 5% biodiesel (B5).
All diesel fuel sold to consumers for use in on-road motor vehicles is mandated to contain at least B5.
Since the introduction of the mandate in 2010 the New Mexico Department of Agriculture has suspended
the mandate every six months citing insufficient supply of biodiesel fuel and biodiesel prices exceeding
those of diesel fuel34.
29
https://www.eia.gov/state/seds/data.php?incfile=/state/seds/sep_sum/html/sum_use_tot.html&sid=NM
30
https://afdc.energy.gov/states/nm
31
https://www.eia.gov/state/seds/data.php?incfile=/state/seds/sep_sum/html/sum_use_tot.html&sid=NM
32
https://www.eia.gov/state/data.php?sid=NM#Environment
33
https://afdc.energy.gov/states/nm
34
https://www.nmlegis.gov/Sessions/17%20Regular/firs/HB0245.PDF
6Adelante Consulting, Inc.
NM CFS Evaluation – January 7, 2021
mN
0 20 40 80 Miles
layer0:Sources: Esri, HERE, Garmin, Interm ap, increment P Corp., GEBCO, USGS,
Natural Gas Intrastate Pipeline (z)
Figure 3 Intrastate natural gas pipelines lines in New Mexico
(https://www.eia.gov/state/?sid=NM)
7Adelante Consulting, Inc.
NM CFS Evaluation – January 7, 2021
There is currently no production of biodiesel in New Mexico. Biodiesel consumption in New Mexico in
2018 was 400,000 barrels35. As of November 2020, there were 3 biodiesel (B20 or above) fueling stations
in New Mexico. These were located at Holloman Air Force Base, Kirtland Air Force Base, and Sandia
National Laboratories36.
Renewable diesel is produced from similar sources as biodiesel, but uses a production process similar to
petroleum diesel so that it is chemically more similar to petroleum diesel than biodiesel. As a result,
renewable diesel may be used as a direct substitute for petroleum diesel rather than as a blend stock like
biodiesel.
In 2019 HollyFrontier announced the construction of a renewable diesel unit (RDU) at its Artesia Refinery.
With a scheduled completion date in Q1 2022, the Artesia RDU is projected to produce 125,000,000
gallons of renewable diesel per year (6,000 bbl/day) utilizing soybean oil, bleachable fancy tallow and
distillers corn oil feedstocks. In June of 2020 HollyFrontier announced the additional construction of a pre-
treatment unit at the Navajo Refinery which will process 80% of the feedstock used within the Artesia
RDU and the HollyFrontier Cheyenne Refinery37.
Renewable natural gas is typically produced from anaerobic degradation of organic matter (e.g., sewage
sludge, animal manure, agricultural waste, etc.). After cleanup to remove moisture, carbon dioxide, and
other impurities, this biogas may be used as a vehicle fuel in the same manner as compressed natural
gas. Biogas is produced in New Mexico from anaerobic digesters and from landfill gas, but none of this is
currently undergoes sufficient cleanup to produce renewable natural gas.
The Water Environment Federation database of wastewater treatment facilities producing biogas with
anaerobic digestion includes treatment plants located in Albuquerque (two plants), Anthony, Carlsbad,
Farmington, Los Cruces, Rio Rancho, Roswell, and Santa Fe38. Most of the facilities use the biogas for
heating, on-site electrical generation, and/or powering machinery. The database indicates the plant in Rio
Rancho injects gas into a pipeline. The production of biogas at facilities digesting sewage sludge can be
enhanced through addition of food waste as digester feed. EPA’s 2016 survey of facilities digesting food
waste did not identify any facilities in New Mexico39. EPA’s 2020 database of livestock anaerobic digester
facilities did not identify any facilities in New Mexico40.
EPA’s 2020 database of landfill gas energy projects identified two projects in New Mexico41 . The Waste
Connections Inc. facility at the Camino Real Landfill in Sunland Park uses landfill gas to generate
electricity from reciprocating engine generators. The project has a capacity of 3.2 MW and sells the
electricity to El Paso Electric. The City of Albuquerque operates a project at the Cerro Colorado landfill in
Albuquerque. The project uses landfill gas to fuel three boilers at the county detention center to heat
water. The gas is transported from the landfill to the detention center through a 2-mile pipeline.
Argonne National Laboratory’s 2020 database of renewable natural gas projects generating gas from
food waste, landfills, livestock manure, or wastewater treatment residues for pipeline injection or vehicle
35
https://www.eia.gov/state/seds/data.php?incfile=/state/seds/sep_sum/html/sum_use_tot.html&sid=NM
36
https://afdc.energy.gov/states/nm
37
https://www.hollyfrontier.com/investor-relations/press-releases/Press-Release-Details/2020/HollyFrontier-
Announces-Expansion-of-Renewables-Business/default.aspx
38
http://www.resourcerecoverydata.org/biogasdata.php
39
https://www.epa.gov/anaerobic-digestion/anaerobic-digestion-facilities-processing-food-waste-united-states-
survey
40
https://www.epa.gov/agstar/livestock-anaerobic-digester-database
41
https://www.epa.gov/sites/production/files/2020-08/opprjslmopdata-detailed.xlsx
8Adelante Consulting, Inc.
NM CFS Evaluation – January 7, 2021
fuel did not identify any projects in New Mexico42. However, since New Mexico is the nation’s sixth-largest
dairy state, with approximately 130 dairy farms and an average herd size of 2,350, there is ample
opportunity for the dairy industry to capitalize on manure-to-renewable natural gas projects. In March
2020, Dominion Energy and Vanguard Renewables Ag announced a $200M partnership to fund such
projects at dairy farms in five states, including New Mexico43. Additionally, at least one California-based
company that produces a low-carbon fuel blend from renewable natural gas expressed interest in early
2020 in exploring partnerships with New Mexico dairies on livestock manure methane projects44.
There is no production of hydrogen for use as vehicle fuels in New Mexico. As of November 2020, there
were no hydrogen fueling stations in New Mexico. The current situation belies the potential opportunity for
New Mexico to develop a hydrogen economy. Nearly all hydrogen is produced from methane, via the
process of steam methane reformation. Traditional steam methane reformers are large pieces of
equipment that are fixed in place, once constructed. Now, a New Mexico-based company, BayoTech, is
building mobile, modular reformers – which can be transported to places where methane is being
generated. If fugitive methane emissions from the Permian and the San Juan Basins can be captured in
sufficient quantity and used for feedstock in hydrogen fuel production, it could incentivize the
development of a network of hydrogen fueling stations.
1.4 Electricity
1.4.1 Electricity Supply
Electricity is generated in New Mexico using fossil fuels and renewable sources. New Mexico produces
more electricity than it consumes. In 2018, New Mexico exported 69.8 trillion BTU (20,500,000 MWH) of
electricity. Figure 4 shows major electrical transmission lines in New Mexico.
There are three coal-fired power generating facilities in New Mexico. Public Service Company of New
Mexico and Arizona Public Service operate coal-fired power plants in San Juan County. The plants have
a combined nameplate capacity of 2560 MW. A third coal-fired power plant is operated by Tri-State G&T
Association in Prewitt, NM. This plant has a nameplate capacity of 257 MW. Total electrical generation
from coal in New Mexico in 2019 was 14,692,000 MWH45. All three coal-fired power generating facilities
are slated for closure. The Tri-State, Prewitt, NM power generating facility will close by the end of
2020.The San Juan Generating station operated in part by the Public Service Company of New Mexico is
slated for closure in 2022 while the Four Corners Power Plant operated by Arizona Public Service is
slated for closure in 2031.
Natural gas is a major source of the electricity generated in New Mexico. There are 5 natural gas-fired
power plants in New Mexico with nameplate capacities greater than 200 MW. The Afton power plant in La
Mesa and the Luna power plant in Deming, operated by Public Service Company of New Mexico, have
nameplate capacities of 287 MW and 650 MW, respectively. The Cunningham power plant and Maddow
power plant in Hobbs are operated by Southwestern Public Service Company and have nameplate
capacities of 519 MW and 212 MW, respectively. The Lea Power Partners facility in Hobbs has a
nameplate capacity of 665 MW. There are also 13 natural gas-fired power plants having nameplate
capacities less than 200 MW. Nameplate capacities of these facilities range from 4.7 MW to 186 MW, with
42
https://www.anl.gov/es/reference/renewable-natural-gas-database
43
https://www.sltrib.com/news/nation-world/2020/02/03/project-seeks-convert/
44
Confidential conversation, Adelante Consulting, Inc.
45
https://www.eia.gov/electricity/data/browser
9Adelante Consulting, Inc.
NM CFS Evaluation – January 7, 2021
a total combined nameplate capacity of 970 MW. Total electrical generation from natural gas in New
Mexico in 2019 was 11,803,000 MWH46.
Electricity is generated from petroleum fuel at three facilities in New Mexico. The TSGT Mobile Generator
facility in Dulce has a nameplate capacity of 2 MW. The Southwestern Public Service facility in Tucumcari
has a nameplate capacity of 27 MW. The Freeport McMoRan facility in Tyrone has a nameplate capacity
of 30.4 MW. Total electrical generation from petroleum liquids in New Mexico in 2019 was 184,000
MWH47.
Renewable electricity is generated in New Mexico from wind, solar, and hydro power and geothermal
energy and from biomass.
Wind generating facilities are located primarily in eastern New Mexico. Total electrical generation from
wind in New Mexico in 2019 was 6,892,000 MWH48.
Solar generating facilities are located throughout the state, with the highest concentration in the
Albuquerque metropolitan area. Total electrical generation from solar in New Mexico in 2019 was
1,366,000 MWH49. Of this total, 317,000 MWH was from electrical utilities and 1,049,000 MWH was from
independent producers.
Four hydroelectric plants operate in New Mexico. These are located at Abiquiu Dam near Abiquiu,
Elephant Butte Dam near Truth or Consequences, El Vado Dam near Tierra Amarillo, and Navajo Dam
near Farmington. The Abiquiu plant is operated by the U.S. Bureau of Reclamation and has a nameplate
capacity of 27.9 MW. The Abiquiu and El Vado plants are operated by the County of Los Alamos and
have nameplate capacities of 15.6 MW and 8 MW, respectively. The Navajo plant is operated by the City
of Farmington and has a nameplate capacity of 30 MW. Total electrical generation from hydropower in
New Mexico in 2019 was 158,000 MWH50.
There is one power plant in New Mexico generating electricity from geothermal energy. The Lightning
Dock Geothermal plant in Animas has a nameplate capacity of 19.7 MW. Total electrical generation from
geothermal in New Mexico in 2019 was 58,000 MWH51.
The is one power plant in New Mexico generating electricity from biomass. The Four Peaks Camino Real
plant in Sunland Park generates electricity from landfill gas and has a nameplate capacity of 3.2 MW.
Total electrical generation from biomass in New Mexico in 2019 was 23,000 MWH52.
46
https://www.eia.gov/electricity/data/browser
47
https://www.eia.gov/electricity/data/browser
48
https://www.eia.gov/electricity/data/browser
49
https://www.eia.gov/electricity/data/browser
50
https://www.eia.gov/electricity/data/browser
51
https://www.eia.gov/electricity/data/browser
52
https://www.eia.gov/electricity/data/browser
10Adelante Consulting, Inc.
NM CFS Evaluation – January 7, 2021
mN
0 20 40 80 Miles
layer0:Sources: Esri, HERE, Garmin, Interm ap, increment P Corp., GEBCO, USGS,
Electric Transmission Line >= 345 kV
Electric Transmission Line < 345 kV
Figure 4 Electrical transmission lines in New Mexico (https://www.eia.gov/state/?sid=NM)
11Adelante Consulting, Inc.
NM CFS Evaluation – January 7, 2021
1.4.2 Electric Vehicles
Electric vehicles are charged using EV supply equipment (EVSE) categorized both by location and the
level of charging EVSEs can provide. EVSEs are distinguished between at-home charging stations
incorporating EV charging stations at a place of residence and away-from-home charging which
encompasses charging stations present at workplaces, shopping malls and other destinations.
On average over 80% of EV charging occurs at home using level 1 or level 2 EVSEs with delivered power
ratings of 1.5 kW at 110 V for level 1 EVSEs and 19kW at 240 V for level 2 EVSEs53. Away-from-home
charging primarily utilizes level 2 EVSEs and DC fast charging which can deliver electricity between 50
and 150 kW. As of June 2019, there were over 1,100 battery EVs and 1,300 plug-in hybrid EVs registered
in New Mexico54. Based on an average EV efficiency of 189 Wh/km and an average of 14,900 miles
traveled per vehicle in New Mexico the typical battery EV will consume about 2,800 kWh per year55. It is
assumed that 45% of plug-in hybrid (PHEV) electric vehicle travel will utilize electricity versus gasoline
constituting an average electricity consumption of 1,200 kWh per PHEV vehicle per year56.
It is estimated that battery and PHEV vehicles consume about 4.9 GWh of electricity annually.
1.4.3 EV Charging Providers
There are over 90 public EV charging stations in New Mexico. Table 1 identifies the number of total
charging stations by provider and provides a count available charge ports by the type of charging, level 1,
level 2 and DCFC.
Table 1 Publicly Accessible EV Charging Outlets in New Mexico57
Entities Providing EV DC Fast Total Total Charging
Level 1 Level 2
Charging Charging (DCFC) Outlets Stations
ChargePoint Network 2 93 1 96 39
Tesla 0 52 56 108 32
Electrify America 0 0 42 42 9
eVgo Network 0 0 2 2 2
Greenlots 0 0 6 6 2
Other 1 25 1 27 11
Total 3 170 108 281 95
53
https://www.energy.gov/eere/electricvehicles/charging-home
54
https://autoalliance.org/energy-environment/advanced-technology-vehicle-sales-dashboard/
55
https://www.bts.gov/state-highway-travel
56
https://ev-database.org/cheatsheet/energy-consumption-electric-car
57
https://afdc.energy.gov/stations#/analyze?region=US-NM
12Adelante Consulting, Inc.
NM CFS Evaluation – January 7, 2021
2.0 CFS Costs, Benefits, and Opportunities
This section evaluates the costs, benefits, and opportunities of a CFS program, including supply,
distribution, and demand. The evaluation includes petroleum fuels, natural gas and HGL, and alternative
fuels. The various costs, benefits and opportunities relevant to a potential LCFS program in Colorado
were evaluated by ICF58. The ICF evaluation was based primarily on comparison of conditions in
Colorado to California, which has the largest and longest running LCFS program. This section discusses
how conclusions presented in the report relative to Colorado may apply to a CFS program in New Mexico.
It also incorporates calculations made by Adelante Consulting, Inc. of the annual statewide economic
investment that a CFS will stimulate based on annual statewide fuel demand, and information from two
Adelante reports on biomass feedstock availability in central, north central, and northeastern New Mexico
to support power generation and biofuels/bio-products production59 60 .
2.1 Macroeconomic Impacts
The Colorado evaluation concluded that greater fuel diversification related to an LCFS program, including
increased use of electricity and natural gas as transportation fuels, facilitates economic and employment
growth. Given the limited alternative fuel infrastructure in New Mexico, there should be opportunities for
economic and employment growth associated with infrastructure development.
The Colorado report noted that over the long-term, participants in carbon-intensive fuel supply chains
(e.g., petroleum) may experience slowed or lower growth. Such an outcome can be mitigated in an oil
and gas state like New Mexico by assuring that a CFS builds in incentives for producers of petroleum
fuels to lower the carbon intensity of such fuels through process improvements, carbon capture and
sequestration, and other initiatives. Overall, the Colorado report noted that the direct impacts from an
LCFS program are likely to be negligible relative to broader macroeconomic factors and trends, and that
the net impacts of an LCFS on employment and economic growth trends are typically in the region of less
than 0.1%. Short-term macroeconomic impact can be mitigated by a backloaded carbon intensity (CI)
compliance curve, such as has been adopted in California and Oregon.
2.1.1 Financial Investment
Investment related to implementation of a CFS program can fall into four areas:
1. alternative fuel production,
2. fueling infrastructure,
3. alternative fuel vehicles, and
4. carbon capture and sequestration.
Implementation of a CFS does not necessarily require all fuel producers and suppliers to make such
investments. In the absence of investment, however, fuel producers and suppliers will have to purchase
credits. The value of credits will then create an incentive for investment by alternative fuel producers and
suppliers.
58
Low Carbon Fuel Standard Feasibility Study Final Report, ICF, September 2020.
59
Adelante Consulting, Inc., “Final Report to NM Energy, Minerals and Natural Resources Department: North
Eastern and North Central New Mexico Wood Biomass Electric Generating and Biochar Production Facility:
Feasibility Assessment and Business Model,” December 31, 2018.
60
Adelante Consulting, Inc., “Final Report to Sandoval County: Biomass Utilization Feasibility Study for Bio-Based
Manufacturing,” December 9, 2020.
13Adelante Consulting, Inc.
NM CFS Evaluation – January 7, 2021
Adelante calculated the potential magnitude of the CFS credit market in New Mexico based on reported
transportation fuel consumption. As noted in section 1.1.4, the consumption of gasoline in New Mexico in
2018 was 24,100,000 bbl. Based on an energy content of 121 MJ/gal and a CI of 100.8 g CO2e/MJ, the
total CO2 equivalence of gasoline use in New Mexico would be 12,300,000 MT/yr. A typical LCFS target
for CI reduction is 1% per year, which would result in a target reduction for gasoline use of
123,000 MT/yr. Assuming a credit price of $200/MT, which is the approximate current price for the
California market, these credits would have a value of $24.7M/yr. A similar analysis for diesel use in
New Mexico, based on 18,600,000 bbl/yr use (section 1.1.4), an energy content of 138 MJ/gal, and CI of
100.4 g CO2e/MJ, yields a credit value of $21.6M/yr. Thus, the current use of carbon-intensive
transportation fuel in New Mexico has the potential to generate approximately $46.3M/yr in carbon
reduction investments.
2.1.2 Employment Trends
Investments in developing alternative fuels production, infrastructure, and vehicles has the potential to
generate additional jobs needed to sustain this development. The Colorado report indicated that
employment impacts need to be assessed relative to regional economies. The report also indicated that
at a high level, industries related to the in-state production of low carbon fuels could have the potential to
experience job growth, and that these fuels can be produced in rural and non-urban areas, stimulating job
growth in these areas. Similar conditions exist in New Mexico, creating potential opportunities for rural
and non-urban areas.
2.2 Transportation Fuels
2.2.1 Conventional Fuel Prices
CFS compliance costs for refineries and other fuel distributors are generally assumed to have full pass-
through to the end user of the fuel, leading to an increase in wholesale and retail fuel prices paid by
consumers. For fossil fuel producers and distributors purchasing credits, the compliance costs will depend
on the price of credits. The Colorado report referred to a study performed in California which showed a
credit price of $60 per credit would result in a cost of approximately 3 cents per gallon for retail sales of
gasoline or diesel. The current California trading price of approximately $190 per credit would result in a
compliance cost of approximately 12 cents per gallon. The report notes, however, that this compliance
cost is less than the historic changes in fuel prices due to crude oil price fluctuations. Further, the report
notes that over time, credit and revenue generation through the CFS has the potential to deliver lower
consumer prices for lower carbon fuels, which could reduce energy expenditures, particularly over the
long-term.
2.2.2 Petroleum Reductions
A CFS program will facilitate the displacement of high carbon intensity petroleum fuels with alternative
fuels, including lower intensity petroleum fuels. Nationally, reduced dependence on fossil fuel and
diversification of the transportation fuel pool should improve fuel security and buffer large swings in
energy prices from external economic shocks. In the case of New Mexico, petroleum production is a
major part of the economy, and petroleum reductions will have larger economic impacts than for states
which do not produce petroleum (e.g., Oregon) or are large importers of petroleum (e.g., California). This
may require a different implementation strategy for New Mexico to dampen impacts on the in-state
petroleum industry. For example, a New Mexico program might need to offer incentives for decarbonizing
petroleum products or transitioning petroleum processing infrastructure to producing bio-based products.
14Adelante Consulting, Inc.
NM CFS Evaluation – January 7, 2021
2.2.3 Sectoral Impacts
Implementation of a CFS program will impact various sectors of the economy differently. The objective of
phasing-in CI reductions is to avoid large immediate impacts and allow impacted sectors to adapt to
changes. Impacts on the transportation sector are evaluated in the Colorado report and summarized
below.
Credit Generators – Current fossil and renewable carbon fuel producers and distributors could see an
increase in revenue through sales of credits for in-state fuel use.
Consumers – Consumers will see slightly higher fuel prices due to compliance costs. As previously noted,
these costs will initially be low and small compared to normal price fluctuations. The costs of alternative-
fuel vehicles are expected to decrease over time, providing an incentive to switch from conventionally
produced and refined fossil fuels. This will increase demand for low-carbon fuels, which should increase
production and result in lower costs.
Fleets – Initial impacts to fleets are expected to be low due to initial low compliance costs. Over time,
fleets may be able to realize lower lifetime fuel and operations and maintenance costs through fuel
switching.
Vehicle Producers – Demand for alternative-fuel vehicles should increase over time, which should
increase research and development investment, leading to improvements in technology. This could result
in increased opportunities for New Mexico’s national laboratories and universities. Advances in vehicle
technology could spin off advances in off-road applications, such as forklifts or light rail, which are less
directly affected by the CFS program.
Petroleum and Natural Gas Producers – An LCFS program will provide incentives for petroleum and
natural gas producers to increase the efficiency of their operations and lower the CI of the fuels they
produce. Given that New Mexico is a net exporter or petroleum and natural gas, impacts from a state
program are expected to be less than from a national program. Increased emphasis in decarbonization on
a national scale is expected to occur, regardless of whether New Mexico implements an LCFS program.
Transportation Fuel Infrastructure – An LCFS program will require improvements to the low-carbon fuel
distribution infrastructure. For example, there will be a need for improved electric vehicle charging
networks. Similarly, there may be a need for improved compressed natural gas (CNG) or hydrogen
distribution. Infrastructure improvements should result in increased employment opportunities in
engineering, construction, and related sectors.
2.2.4 CFS Regulated Parties
Regulated parties in New Mexico would include those producing and distributing transportation fuels. The
major producer of carbon-intensive fuel in New Mexico would be HollyFrontier’s Artesia refinery. An LCFS
program would generate a compliance obligation for this refinery – and at the same time, its renewable
diesel production unit would generate credits. This refinery does not produce all the carbon-intensive
transportation fuels used in New Mexico, however, and the balance is imported from out of state. These
out-of-state producers would be subject to the same compliance obligation as the in-state producers, and
would not have an advantage over in-state producers.
Similarly, the in-state distribution network would incur compliance obligations. As previously described,
these compliance costs are typically passed through to consumers and are not borne by the distributors.
15You can also read