MYANMAR OPIUM SURVEY 2019 - COVER CULTIVATION, PRODUCTION AND IMPLICATIONS DRAFT 2020-01-27 JANUARY 2020 - United Nations Office on ...
←
→
Page content transcription
If your browser does not render page correctly, please read the page content below
COVER

MYANMAR OPIUM SURVEY 2019
 CULTIVATION, PRODUCTION AND IMPLICATIONS

 DRAFT 2020-01-27

 JANUARY 2020
In Southeast Asia, UNODC supports Member States to develop and implement evidence-
based rule of law, drug control and related criminal justice responses through the Regional
Programme 2014-2021 and aligned country programmes including the Myanmar Country
Programme 2014-2021. This study is connected to the Mekong MOU on Drug Control which
UNODC actively supports through the Regional Programme, including the commitment to
develop data and evidence as the basis for countries of the Mekong region to respond to
challenges of drug production, trafficking and use. UNODC’s Research and Trend Analysis
Branch promotes and supports the development and implementation of surveys globally,
including through its Illicit Crop Monitoring Programme (ICMP).
The implementation of Myanmar opium survey was made possible thanks to the financial
support of the Governments of Japan and the United States of America.

UNODC Regional Office for Southeast Asia and the Pacific
Telephone: +6622882100
Fax: +6622812129
Email: unodc‐thailandfieldoffice@un.org
Website: www.unodc.org/southeastasiaandpacific
 Twitter: @UNODC_SEAP

The designations employed and the presentation of material in this publication do not imply
the expression of any opinion whatsoever on the part of UNODC concerning the legal status
of any country, territory or city, or its authorities, or concerning the delimitation of its frontiers
or boundaries.
Contents
Acknowledgements ............................................................................................................................ i
Abbreviations ..................................................................................................................................... i
Key Findings ...................................................................................................................................... iii
Fact Sheet ......................................................................................................................................... iv
1. Introduction .............................................................................................................................. 1
2. Findings ..................................................................................................................................... 7
 2.1 Estimated area under opium poppy cultivation ..................................................................... 7
 2.2 Opium yield and production estimates ................................................................................. 13
 2.3 Opium farm-gate price .......................................................................................................... 16
 2.4 Opium economy in Myanmar ............................................................................................... 18
3. Eradication and Seizures .......................................................................................................... 23
 3.1 Eradication ............................................................................................................................ 23
 3.2 Seizures ................................................................................................................................. 26
4. Methodology ........................................................................................................................... 31
 4.1 Area estimation ..................................................................................................................... 31
 4.2 Yield and potential opium production estimation ................................................................ 45
 4.3 Estimating the value of opium economy in Myanmar .......................................................... 51
Myanmar Opium Survey 2019

Acknowledgements
Central Committee for Drug Abuse Control
Pol. Lt. Gen. Aung Win Oo Chief of Myanmar Police Force, Secretary of CCDAC
Pol. Brig. Gen. Win Naing Commander of Drug Enforcement Division, Joint Secretary
 of CCDAC
Pol. Col. Win Ko Ko Head of Project Management Department, CCDAC

The implementation of the survey would not have been possible without the support from
the local administrations.

UNODC Regional Office for Southeast Asia and the Pacific
Jeremy Douglas Regional Representative, Southeast Asia and the Pacific
Akara Umapornsakula Web Assistant

UNODC Myanmar
Troels Vester Country Manager
San Lwin Htwe GIS Specialist and Survey Coordinator
Naing Lin Aung Data Analyst

UNODC Headquarters
Angela Me Chief, Research and Trend Analysis Branch
Anja Korenblik Chief, Programme Development and Management Unit
Antero Keskinen Remote Sensing & GIS Officer, PDMU
Lorenzo Vita Research officer, PDMU
Irmgard Zeiler Statistician, PDMU

Abbreviations
CCDAC Central Committee for Drug Abuse Control
GOUM Government of the Republic of the Union on Myanmar
HR High Resolution
ICMP UNODC Illicit Crop Monitoring Programme
LCLU Land Cover Land Use
QA/QC Quality Assurance/Quality Control
SR Special Region
UNODC United Nations Office on Drugs and Crime
USG United States Government
VHR Very High Resolution

 i
Myanmar Opium Survey 2019

ii
Myanmar Opium Survey 2019

Key Findings
 • In 2019, the area under opium poppy cultivation in Myanmar was estimated at 33,100
 hectares. In comparison to 2018, the area under opium cultivation decreased, which
 is a continuation of the downward trend that started in 2014. In comparison to 2018,
 the area under opium poppy cultivation in 2019 decreased by 11 per cent or 4,200
 hectares from 37,300 hectares in 2018 to 33,100 hectares.1
 180,000

 160,000

 140,000

 120,000
 Hectares

 100,000

 80,000

 60,000

 40,000

 20,000

 0
 2004
 1996
 1997
 1998
 1999
 2000
 2001
 2002
 2003

 2005
 2006
 2007
 2008
 2009
 2010
 2011
 2012
 2013
 2014
 2015
 2016
 2017
 2018
 2019
 Best estimate Upper and lower limits

 • Reductions have taken place in North, East and South Shan with decreases of 7%, 8%
 and 17% respectively. In Kachin State the cultivation increased by 15% from 2018.
 • The average opium yield was estimated at 15.4 kilograms per hectare, with a 9%
 increase compared to 2018.
 • Potential opium production was estimated at 508 metric tons (mt) in 2019. Shan
 State, which supplied 87% of the total, remained the main producing region with 442
 mt, a decrease of 4% compared to last year.
 • Eradication, as reported by the Government, showed a similar trend to opium poppy
 cultivation over the last nine years, with increases from 2010 to 2012-2014 and a
 decrease since 2015. The eradication numbers for the 2019 growing season (from
 September 2018 to March 2019) were 6% lower than for the same period in 2018.
 • For the period January to September 2019, approximately 2,000 kg of seized opiates
 were reported; the total reported seizures for 2018 were 4,658 kg.
 • With an estimated gross value ranging from 0.6 to 1.4 billion US$, the illegal opiate
 market in Myanmar represented a notable share of the country’s economy in 2019
 (0.9 - 1.9% of the GDP in 2018).
 • Of this total, 8 - 9%, corresponding to an estimated amount of 61 - 107 million US$,
 or 0.5% of the agricultural sector’s value2, were earned by farmers cultivating opium.
 • The largest share of the 2019 opiate market value was income generated by heroin
 manufacturing and trafficking. Domestic heroin consumption of 6 tons was valued at
 152 - 290 million US$, whereas the export of heroin (23 - 52 tons) was worth between
 458 and 1,042 million US$.
 • Between 2015 and 2019, farm-gate prices3 of fresh and dry opium decreased by 63
 and 51%, respectively. Decreasing prices together with a reduced supply of opium can
 be an indication of a decreased demand for opiates from Myanmar in the country and
 the region.

1The 2019 total area estimate uses latest available (2018) cultivation estimates in Chin and Kayah States.
2The agricultural sector contributes 25.7% of the total GDP in Myanmar (Source: World Bank 2018).
3Average weighted based on production. Prices are inflation adjusted on the base of the Consumer Price Indices provided by the

World Bank (base 2010=100) for the analysis of trends. The Index for 2019 was linearly extrapolated from the 2004-2018 series.

 iii
Myanmar Opium Survey 2019

Fact Sheet
 Year 2018 Year 2019 Change
 (rounded numbers) (rounded numbers) 2018-2019 *

 Total opium poppy cultivation 37,300 33,100 5
 -11%
 (ha)4 (29,700 to 47,200) (25,800 to 42,800)

 Opium poppy cultivation 32,700 28,000
 -14%
 in Shan State (ha) (25,300 to 42,400) (21,000 to 37,100)

 Opium poppy cultivation 3,400 3,900
 +15%
 in Kachin State (ha) (1,800 to 5,800) (1,900 to 7,200)

 Opium poppy cultivation 630 630 Data from
 in Chin State (ha) (573 to 677) (573 to 677) 2018 6

 Opium poppy cultivation 570 570 Data from
 in Kayah State (ha) (434 to 706) (434 to 706) 2018 6

 Total potential production of dry 520 508 7
 -2%
 opium (mt) (410 to 664) (380 to 672)

 Potential dry opium
 461 442
 production in Shan -4%
 (348 to 605) (316 to 599)
 State (mt)

 Potential dry opium
 42 48
 production in Kachin +15%
 (21 to 74) (21 to 92)
 State (mt) 8

 Potential dry opium
 8.7 9.6 9
 production in Chin State +10%
 (5.9 to 12.3) (6.2 to 14.0)
 (mt)

 Potential dry opium
 8.0 8.8 9
 production in Kayah +9%
 (4.8 to 11.7) (5.1 to 13.2)
 State (mt)

 13.9 15.4
 Average opium yield (kg/ha) 10 +11%
 (9.5 to 19.7) (10.0 to 22.3)

*Numbers in the table are rounded, percentage changes are calculated with exact estimates.
Chin and Kayah States were not surveyed in 2019 due to budget constraints. To maintain comparability with 2018 estimates, 2018
area estimates of Kayah and Chin were used to calculate totals of area under cultivation. Kayah and Chin yields of 2018 and 2019
are approximated by a weighted average of Shan State data of the respective years.

4
 The estimates may include areas that were eradicated after the acquisition date of the satellite images.
5 The 2019 total area estimate uses latest available (2018) cultivation estimates in Chin and Kayah States.
6
 Chin and Kayah States were not surveyed in 2019 due to budget constraints and therefore cultivation estimates for 2018 were
used for 2019.
7The total potential production in 2019 calculates production estimates for Chin and Kayah States with the latest available (2018)
cultivation estimates and the 2019 weighted national average yield (15.4 kg/ha).
8
 Yield data for Kachin State is from 2015 since the yield survey could not be implemented there after that year.
9No yield survey was conducted in Chin and Kayah States in 2019. Production in these States was calculated the same way as in
2018 by applying a weighted average of Shan State yields of the current year (2019).
10National average weighted by regional area estimates. National average in 2019 is based on yield and area data in Shan and
Kachin States only. Yield data for Kachin State is from 2015.

iv
Myanmar Opium Survey 2019

 Year 2018 Year 2019 Change
 (rounded numbers) (rounded numbers) 2018-2019

 136 US$/kg (216,166 145 US$/kg (217,076
 Farm-gate price of fresh opium 11 +7% 13
 Kyat/kg) Kyat/kg) 12

 154 US$/kg (243,783 160 US$/kg (239,489 +4% 13
 Farm-gate price of dry opium 11
 Kyat/kg) Kyat/kg) 12

 Farm-gate value of opium in million
 62 to 103 61 to 107 -2 to +4%
 US$

 Value of the opiate economy (gross)
 718 to 1,488 14 649 to 1,370 -10 to -8%
 in million US$

 Value of the opiates economy (net)
 656 to 1,385 14 588 to 1,263 -10 to -9%
 in million US$

 Total opium poppy eradication
 reported by the Government of 2,605 2,460 -6%
 Myanmar (ha)

11 National average weighted by regional production estimates.
12
 Exchange rate on 20 December 2019 (https://www.xe.com/)
13
 Change calculated in US$. Not adjusted for inflation. Due to changes in the exchange rate, the difference appears smaller in
Kyat, for fresh and dry opium +0.4 % and -1.8% respectively. From 2018 to 2019, average farm-gate prices for fresh and dry opium
decreased by 4% and 7%, respectively, taking inflation into account.
14The values presented here are revised from the 2018 report (Myanmar Opium Cultivation 2018 – Cultivation, Production and
Implications) based on updated price information from CCDAC in 2019. The values for 2018 were linearly interpolated from the
2010-2019 price series.

 v
Myanmar Opium Survey 2019

 Divider

vi
Myanmar Opium Survey 2019

Divider

 vii
Myanmar Opium Survey 2019

1. Introduction
This report presents the results of the seventeenth opium survey in Myanmar. It was
conducted jointly by the Central Committee for Drug Abuse Control (CCDAC) of the Ministry
of Home Affairs and UNODC, which has been collecting statistical information on illicit crop
cultivation in Myanmar within the framework of its Illicit Crop Monitoring Programme. The
methodology used in this report combines satellite imagery, yield and village surveys to
evaluate the extent of opium poppy cultivation and production in the country.
The 2019 report builds on years of data regarding illicit opium production in Myanmar,
estimating and comparing the area under cultivation, and assessing yield and production.
Although the area of opium cultivation experienced a considerable increase between 2006
and 2014 to just under 60,000 ha, it has been in sharp decline ever since. In 2019, the total
area of opium poppy fell to 33,100 ha, declining by 11% from the 37,300 ha recorded in 2018,
connected to the continuing shift of the regional drug market to synthetic drugs. As in previous
years, the majority of opium poppy is again cultivated in Shan State, accounting for 85%
(28,000 ha) of the total opium poppy area in 2019, followed by Kachin State 12% (3,900 ha),
and Chin and Kayah States together accounting for 3% (1,200 ha).15
Prices for fresh and dry opium have also been decreasing in recent years. For instance, the
price for fresh opium has declined by more than 60% between 2015 and 2019. The continuing
drop in areas under opium poppy cultivation and prices point to decreasing demand for
opiates produced in Myanmar for the regional drug market. This means opium poppy farmers
now have less opportunities to earn necessary income for their subsistence. According to our
estimates, opium farmers make less than 10 per cent of the money generated by the opiate
economy in the country.
Despite decreasing demand for opiates, organised crime groups that traffic heroin continue
to make substantial amounts of money. The market value for heroin manufacturing and
trafficking makes up the vast majority of this value. Domestic heroin consumption of 6 tons
was valued at 152 - 290 million US$, whereas the export of heroin from Myanmar to
neighbouring countries was worth around 1 billion US$ locally.
In addition, despite of the downward trend in opium cultivation and related heroin
production, the drug continues to pose a significant public health and security challenge
throughout the region as the country remains the major supplier of opium and heroin in East
and Southeast Asia, as well as Australia. There are more than 3 million heroin users in these
regions who, together, consume about 10 billion US$ worth of the drug annually, confirming
heroin remains an importance source of income for organized crime.
Opium cultivation, heroin manufacturing and the illicit drug economy itself are also important
elements to consider in the context of the peace process and the establishment of long-term
stability in Myanmar. There is a connection between drugs and conflict in Myanmar, with the
drug economy supporting the conflict and in turn the conflict facilitating the drug economy.
Providing solutions to the conflict requires breaking this cycle. The influence of the drug
economy can be mitigated through alternative development programmes that provide viable
sources of legitimate income, as well as by addressing the threat of transnational organised
crime groups that continue to produce and traffic heroin and that have significantly scaled-up
the production of methamphetamine and other synthetic drugs for the regional drug market.

15 Chin and Kayah States were not surveyed in 2019 but 2018 area estimates were used to calculate totals of area under cultivation

and maintain comparability with 2018 estimates.

 1
Myanmar Opium Survey 2019

Countering drug production and organised crime networks is vital for providing peace and
security in Kachin and Shan.
The annual opium survey report remains an essential tool for assessing the extent of opium
poppy cultivation in Myanmar, as well as understanding changes in cultivation patterns and
the links between drugs and the rural economy. This information is useful for understanding
cultivation techniques, rural livelihoods and for designing effective alternative development
options. It is also essential for supporting decision makers to develop effective strategies to
sustain the transition from an illicit to a licit economy, and as a basis for understanding the
connection between the drug economy and ongoing conflict.

2
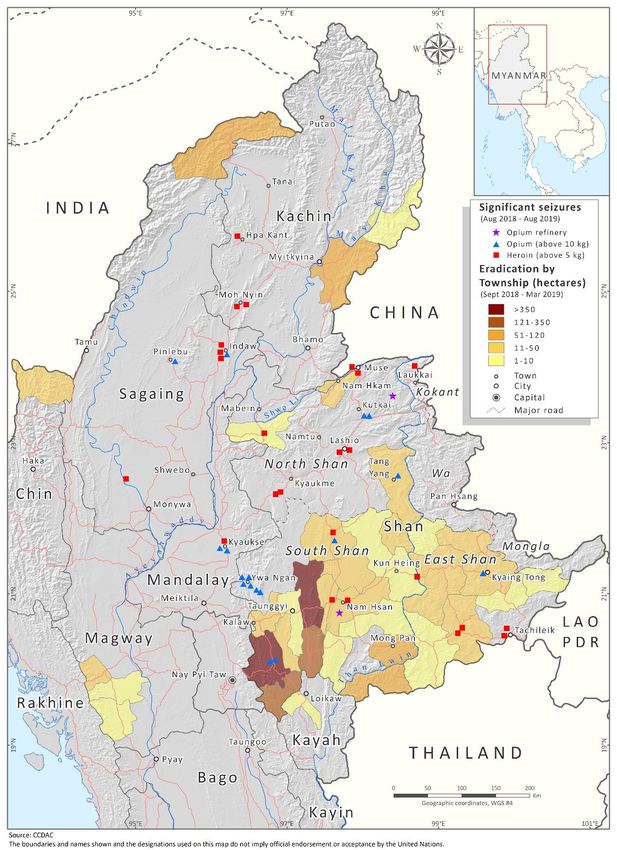
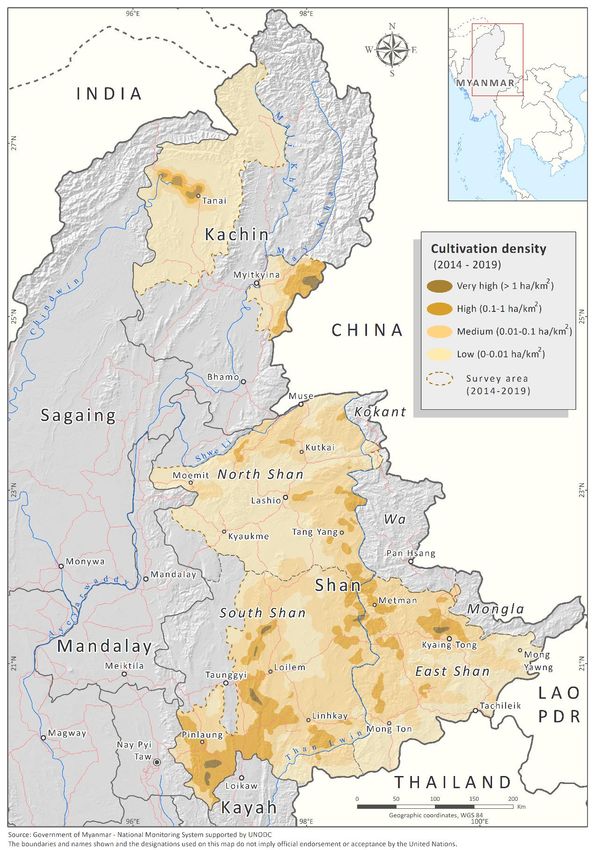
Myanmar Opium Survey 2019

Map 1: Cultivation density map (2014-2019) in Myanmar, October 2018 - March 2019

 3
Myanmar Opium Survey 2019

4
Myanmar Opium Survey 2019

 5
Myanmar Opium Survey 2019

Divider

6
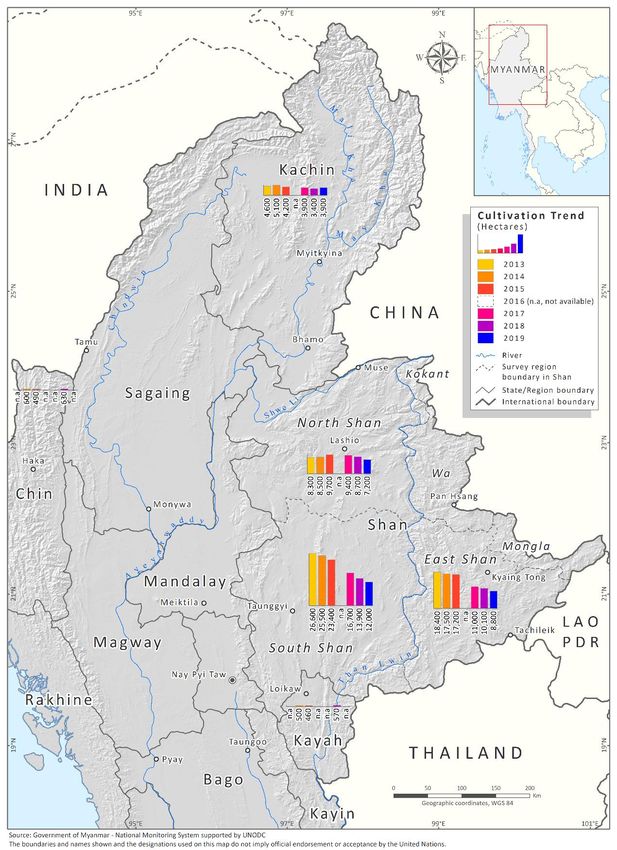
Myanmar Opium Survey 2019

2. Findings
2.1 Estimated area under opium poppy cultivation
In 2019, the total amount of opium poppy cultivation area in Myanmar was estimated at
33,100 ha. Contrary to the survey in 2018 when all four producing States were covered, this
year’s survey covered only the major producing States, Shan and Kachin similar to the survey
in 2017. Chin and Kayah States were not surveyed in 2019 but the 2018 area estimates were
used to calculate totals of area under cultivation to maintain comparability with 2018
estimates. A decrease in cultivation of 11% was recorded, from 37,300 ha in 2018 to 33,100
ha in 2019. The national trend has been declining since 2014 when the total cultivation was
estimated at 57,600 ha (Figure 1:).
 Opium poppy cultivation in Myanmar, 1996-2019 (ha)*
 180,000

 160,000

 140,000

 120,000
 Hectares

 100,000

 80,000

 60,000

 40,000

 20,000

 0
 2004
 1996
 1997
 1998
 1999
 2000
 2001
 2002
 2003

 2005
 2006
 2007
 2008
 2009
 2010
 2011
 2012
 2013
 2014
 2015
 2016
 2017
 2018
 2019
 Best estimate Upper and lower limits
*Sources: fr om 1996 to 2001 U SG, fr om 2002 to 20 1 9 GOUM- UNODC. The s urvey s in 2014, 2 015 and 2018
inc luded sate llite im age es tim ates for Kay ah and Chin States. I n 2016 no surv ey was conducte d . The surve y
in 20 19 uses lates t available (2018) es tim ates for Kay ah and Chin States.

Compared to 2018, moderate decreases were observed in all surveyed regions except in
Kachin State where cultivation increased (Table 1). In Shan State alone, cultivation decreased
by 4,700 hectares (-14%). In South Shan the reduction was of 1,900 hectares (-14%). Decreases
of 1,300 ha (-12%) and 1,500 ha (-17%) were also observed in East and North Shan,
respectively. The only increase was observed in Kachin State amounting to 500 hectares
(+15%).
All in all, Shan continued to be by far the major cultivating State in Myanmar, accounting for
85% (28,000 ha) of the total opium poppy area (Table 1:). The trend in Shan State has been
declining since 2015 when the total cultivation area was estimated at 50,300 ha (Map 3:).
Within Shan State, the sub-regions of South, East and North Shan accounted for 36%, 27% and
22% of total cultivation in 2019, respectively (Figure 2:). Kachin State accounted for 12% (3,900
ha), and Chin and Kayah States together for 3% (1,200 ha).16

16 Chin and Kayah States were not surveyed in 2019 but 2018 area estimates were used to calculate totals of area under cultivation

and maintain comparability with 2018 estimates.

 7
Myanmar Opium Survey 2019

Table 1: Areas under opium poppy cultivation in Myanmar (ha), 2018 and 2019*
 Year 2018
 Region Year 2018 Year 2019
 Change 2018-2019
 (rounded numbers) (rounded numbers)

 13,900 12,000 -14%
 South Shan
 (8,800 to 20,900) (7,300 to 18,600)

 10,100 8,800
 East Shan -12%
 (6,900 to 14,000) (5,800 to 12,300)

 8,700 7,200
 North Shan -17%
 (4,400 to 14,200) (2,900 to 12,400)

 32,700 28,000
 Shan State total -14%
 (25,300 to 42,400) (21,000 to 37,100)

 3,400 3,900
 Kachin +15%
 (1,800 to 5,800) (1,900 to 7,200)

 630 630
 Chin Data from 2018
 (573 to 677) (573 to 677)

 570 570
 Kayah Data from 2018
 (434 to 706) (434 to 706)

 37,300 33,100
 National total -11%
 (29,700 to 47,200) (25,800 to 42,800)

* Values in br acke ts indic ate the 95% confide nce interval. Numbers in the table are rounded, perce ntage
changes are calculate d with ex act estimates .

Chin and Kay ah States were not surveye d in 2019 due to budge t c ons traints. To m aintain comparability
with 2018 es tim ates, 2018 are a es timates of K ayah and Chin wer e use d to c alc ulate totals of are a under
cultiv ation.

 Regional distribution of opium poppy cultivation areas in Myanmar, 2019*

 Chin and
 Kayah
 3%
 Kachin
 12%
 East Shan
 27%

 North
 Shan
 22%

 South
 Shan
 36%

*Chin and Kay ah States were not surv eyed in 2019 but 2018 area e stimates were use d to c alculate totals
of are a under c ultiv ation and maintain c omparability w ith 2 018 estimates.

8
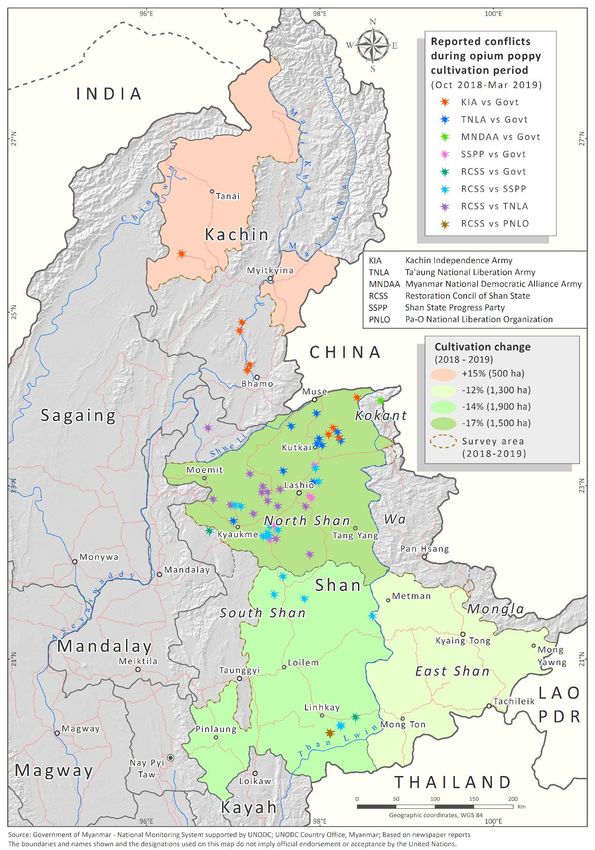
Myanmar Opium Survey 2019

Opium poppy cultivation is now concentrated in areas characterised by a combination of
specific topographical conditions, socio-economic circumstances and security. For example,
from a geographic perspective the south-western mountains in South Shan provide a good
environment for opium poppy cultivation (Figure 3: &Figure 4: & Figure 5:). In this region large
areas with high to very high density of opium poppy cultivation has been reported in 2019
(see Map 1:). The majority of East Shan State present areas with medium cultivation levels.
The northern area of Kyaing Tong city in East Shan and the areas near the boundaries of East
and South Shan, on both sides of the Than Lwin river, also present some extensive areas of
poppy, although the cultivation is dispersed, and the density is slightly lower than in South
Shan region.
Most of the reduction in cultivation between 2018 and 2019 took place in areas well-suited
for opium cultivation but with a relatively good security situation (see Map 2:). Decreases were
also observed in major growing regions with security incidents. The only increase in cultivation
this year was observed in Kachin State, where only a very few conflicts were reported during
the opium poppy cultivation period. It should be noted, however, that no field survey to
provide ground truthing of satellite image analysis has been conducted in Kachin since 2015,
due to security concerns.
Until 2005, Special Region 2 - or Wa region - showed high levels of poppy cultivation, but after
2005 there has been hardly any poppy fields due to the ban on opium poppy cultivation. In
2019, the eastern part of North Shan, bordering the Wa region, showed high concentrations
of poppy. The majority of North Shan region presents areas with medium cultivation levels. In
Kachin State, the north-western zone of Tanai town and the area east from Myitkyina city next
to the international border with China present some areas with very high cultivation density.
In the past surveys, UNODC conducted risk assessments to the areas with opium poppy
cultivation reported by local communities in order to establish the cultivation status of that
area, for example, the assessment mission to Naga in three townships in Sagaing region during
2015 survey. In 2019, some local communities reported opium poppy cultivations in Putao
and Sumprabum townships of Kachin where the past UNODC surveys in 2014 and 2015
observed insignificant cultivation in that areas. For such areas, an assessment is planned in
order to establish the cultivation status in future surveys.
 Poppy field in South Shan, 2019

 9
Myanmar Opium Survey 2019

Map 2: Cultivation change map (2018-2019) with reported conflicts in Myanmar, October
2018 - March 2019

10
Myanmar Opium Survey 2019

 Poppy field in North San, 2019

 Irrigated young-stage poppy field in South Shan, 2019. Irrigated late cultivation
(after monsoon cultivation) was observed ion southern townships of South Shan (See also
Table 12 for opium cultivation calendar 2018-2019)

 11
Myanmar Opium Survey 2019

Map 3: Opium poppy cultivation trends in Myanmar, 2013-2019

12
Myanmar Opium Survey 2019

2.2 Opium yield and production estimates
In 2019, the field work was carried out in Shan State only due to security constraints in Kachin.
Chin and Kayah States were not surveyed in 2019 due to budget constraints. Several field
studies were carried out to measure opium yields in three different regions of Shan State.
North Shan was the region with highest yield values (22.4kg/ha) followed by South Shan (13.8
kg/ha) and East Shan (13.0 kg/ha) (Table 2:). It should be noted, however, that the number of
villages and fields visited in North Shan was rather low compared to South and East Shan due
to security constraints.17 The national average yield was estimated at 15.4kg/ha18, a 9%
increase compared to 2018 (Figure 6:). For the opium production calculation in Kachin State
the 2015 yield estimate (12.5kg/ha) was used, similarly to the previous years’ surveys. The
total potential production estimates for Chin and Kayah were calculated with the latest
available (2018) cultivation estimates and the 2019 weighted national average yield.
 Average opium yield in Myanmar, 2002 – 2019
 24.0
 22.0
 20.0
 18.0 16.6
 15.1 15.0 15.4
 16.0 14.6 14.4 14.0 13.5 13.4 14.0
 Yield (kg/ha)

 14.0 13.0
 11.7 11.7
 12.0 10.4
 10.0 9.5
 10.0
 8.0
 8.0
 6.0
 4.0
 2.0
 0.0
 2002 2003 2004 2005 2006 2007 2008 2009 2010 2011 2012 2013 2014 2015 2016 2017 2018 2019

 National aver age we ighted by regional are a e stimates. In 20 16 no survey was conduc ted .

Table 2: Potential opium yield by region (kg/ha), 2018 and 2019*

 Change
 Region 2018 2019
 2018-2019

 13.3 13.8
 South Shan +3%
 (12.3 to 14.3) (12.8 to 14.8)

 13.5 13.0
 East Shan -4%
 (12.3 to 14.6) (12.4 to 13.7)

 16.1 22.4
 North Shan +28%
 (14.7 to 17.5) (19.1 to 25.8)

 14.0 15.4
 Average yield +9%
 (9.5 to 19.7) (10.0 to 22.2)

*Values in br ackets indic ate the 95% confidence interval. Numbers in the table are rounded, percentage
changes are calculate d with ex act estimates.

17
 In 2019, 118 fields were surveyed in 40 villages in East Shan, 93 fields in 31 villages in South Shan, and 21 fields in 7 villages in
North Shan.
18National average weighted by regional area estimates. National average in 2019 is based on yield and area data in Shan and
Kachin States only. Yield data for Kachin State is from 2015.

 13
Myanmar Opium Survey 2019

The resulting estimate of potential dry opium production in 2019 was 508 metric tons. Shan
State, with 442mt accounted for 87% of the total production. However, the estimates for this
State are not equally distributed and a trend similar to 2018 continued also in 2019; whilst the
South and East Shan regions showed moderate decreases of 11% (-11mt) and 15% (-21mt),
North Shan showed an increase of 15% (+21mt), even though the greatest percentage
decrease (-17%) in the cultivation area of all Shan regions was observed in North Shan (Table
3:). The increase of production in North Shan can be explained by the yield which increased
by more than 6 kg/ha (+28%) compared to the value of 2018. The production in Kachin State
increased by 15% (+6mt)19 which can be explained by the 500ha increase in the cultivation
area, +15% respectively. The total potential production estimates for Chin and Kayah were
calculated with the latest available (2018) cultivation estimates and the 2019 weighted
national average yield (15.4kg/ha). The total potential opium production in Myanmar resulted
in a decrease of 2%, from 520mt to 508mt (Figure 7:).

Table 3: Potential opium production by region (mt), 2018 and 2019*

 Potential Potential
 Change 2019 proportion
 Region production production
 2018-2019 by State
 2018 2019

 185 165
 South Shan -11% 33%
 (116 to 279) (100 to 257)

 136 115
 East Shan -15% 23%
 (91 to 189) (76 to 160)

 140 161
 North Shan +15% 32%
 (70 to 231) (62 to 282)

 461 442
 Shan State total -4% 87%
 (348 to 605) (316 to 599)

 42 48
 Kachin State +15% 9%
 (21 to 74) (21 to 92)

 8.7 9.6
 Chin State +10% 2%
 (5.9 to 12.3) (6.2 to 14.0)

 8.0 8.8
 Kayah State +9% 2%
 (4.8 to 11.7) (5.1 to 13.2)

 520 508
 Total (rounded) -2% 100%
 (410 to 664) (380 to 672)

*Values in br ackets indic ate the 95% confidence interval. Numbers in the table are rounded, percentage
changes are calculate d with ex act estimates.

Chin and Kay ah States were not surveye d in 2019 due to budge t c ons traints. To m aintain comparability
with 2018 es timates, the total potential produc tion in 2019 c alc ulate s produc tion es timates for Chin and
Kayah States with the latest available (2018 ) cult iv ation estim ates and the 2019 weighte d national
average yie ld (15.4 kg/ ha). Yield data (12.5 kg/ ha, 95% confide nce interval: 9.7 -15.3kg/ha) for the
produc tion calculation of K achin State is fr om 2015 since the yield s urvey c ould not be im ple mente d ther e
after that year.

19 Yield data for Kachin State is from 2015 since the yield survey could not be implemented there after that year.

14
Myanmar Opium Survey 2019

 Potential opium production in Myanmar, 1996-2019 (mt)
 2,000

 1,760
 1,680
 1,800

 1,600

 1,300
 1,400

 1,100
 1,090

 870
 1,200

 673
 900

 690
 610
 1,000

 830

 580

 647
 810
Metric tons

 550

 508
 520
 800

 330
 460
 600

 410
 370

 320
 310
 400

 200

 0
 1998

 2017
 1996
 1997

 1999
 2000
 2001
 2002
 2003
 2004
 2005
 2006
 2007
 2008
 2009
 2010
 2011
 2012
 2013
 2014
 2015
 2016

 2018
 2019
 Best estimate Upper and lower limits
 Sourc e: from 1996 to 2001 USG, fr om 2002 to 2019 GOUM -U NODC. In 2016 no surve y was
 conduc ted.

 Lancing poppy capsules, South Shan, 2019

 Lancing poppy capsules, East Shan, 2019

 15
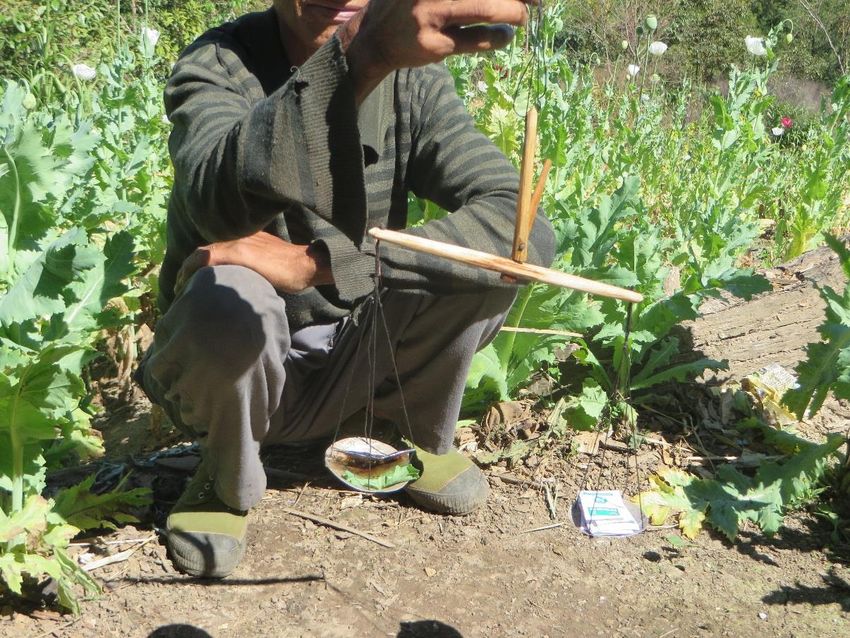
Myanmar Opium Survey 2019

 Harvested fresh opium gum, Easth Shan, 2019

 Dried opium poppy capsules to extract seed for next cultivation season, South
Shan, 2019

2.3 Opium farm-gate price
In 2019, a village survey was implemented, and opium price data were collected.20 The
average farm-gate prices21 at harvest time of fresh and dry opium were assessed at 217,076
Kyat (145 US$) and 239,489 Kyat (160 US$) per kilogramme, respectively. In 2018, average
farm-gate prices of fresh and dry opium were estimated at 216,666 Kyat (136 US$) and
243,783 Kyat (154 US$) per kg, respectively. From 2018 to 2019, average farm-gate prices for
fresh and dry opium decreased by 4% and 7%, respectively, taking inflation into account.22
Over the four years span from 2015, the corresponding farm-gate prices of fresh and dry
opium dropped significantly by 63% and 51%, respectively (Figure 12:). The fact that farm-gate
opium prices fell strongly, despite the concurrent reduction of opium supply, suggests that
the demand for opiates in Myanmar may be lower than before and supports the hypothesis
that the heroin market has declined in the region. At the same time, lower prices make opium
cultivation less attractive, which might be contributing to the declining area under cultivation.

20 The socio-economic report will be published later in 2020.
21 Weighted average based on opium production, see Methodology chapter.
22Change calculated in Kyat. Prices were adjusted for inflation on the basis of the Consumer Price Index information provided by
the World Bank (base 2010=100). The Consumer Price Index for 2019 was linearly extrapolated from the 2004-2018 series.

16
Myanmar Opium Survey 2019

 Inflation‐adjusted farm‐gate prices (weighted average) of fresh and dry opium in
poppy‐growing villages, Myanmar, 2004‐2019, (Kyat per kilogram)*

 700,000

 600,000

 500,000
 Kyat per kilogram

 400,000

 300,000

 200,000

 100,000

 -
 2004 2005 2006 2007 2008 2009 2010 2011 2012 2013 2014 2015 2016 2017 2018 2019
 Fresh-opium price (farm-gate), kyat per kilogram, inflation adjusted
 Dry opium price, kyat per kilogram, inflation adjusted

*Prices we re adj usted for inflation on the bas is of the Consumer Price I nde x inform ation pr ovided by the
World Bank (base 2010 =100). The Consum er Price Index for 2 019 was line arly ex trapolated from the
2004-2018 serie s.

 Weighting fresh opium gum in poppy field, Easth Shan, 2019

 17
Myanmar Opium Survey 2019

2.4 Opium economy in Myanmar
Every year, hundreds of tons of opium are harvested in Myanmar and further commercialised.
Opium can be either consumed as raw opium or further processed into heroin. Both raw
opium and heroin reach the end-consumer markets in and outside Myanmar (Table 4:).

Table 4: Estimated quantities of the different opiate market´s components

 Unprocessed
 Domestic opium for Heroin
 Domestic
 Opium demand for consumption potentially
 demand for
 production 2019 unprocessed potentially available for
 heroin
 opium available for export
 export

 508
 5.1 tons 6.1 tons 75 tons 23 - 52 tons
 (380 to 672)
Note: A r atio of 10:1 is use d for conve rting opium to he roin of unknown pur ity.

The farm-gate value of opium is an important measure of the gross income of farmers
generated by opium poppy cultivation and it was estimated to range between 61 to 107
million US$ (mid-point 81 million US$). These values were calculated using information on
farm-gate prices collected in the 2019 socio-economic survey23 and the amount of potential
opium production which ranged between 380 and 672 tons (mid-point 508 tons).

Table 5: Estimated values of the opiates economy, 2019

 Gross value Value in relation
 Millions of US$ to GDP* %

 Value of the opiates economy (gross)** 649 – 1,370 0.9 - 1.9

 Value of opiates potentially available for export 490 - 1,073 0.7 - 1.5

 Raw opium 31
 Heroin 458 - 1,042

 Value of the opiates market for domestic consumption 159 - 297 0.2 - 0.4

 Raw opium 7
 Heroin 152 - 290

 Farm-gate value of opium 61 - 107 0.1 - 0.2

 Value of the opiates economy after farm-gate to the
 588 – 1,263 0.8 - 1.8
 border
Number s in the table are rounded, sums and perce ntages are calc ulated with exac t es tim ates.
Ranges are c alc ulated base d on lower and upper bounds of opium produc tion and on assum ptions about
the differe nt puritie s of e xported and domes tic her oin. See m ore details in the Methodology chapte r.
*Source: W orld Bank.
**The sum of the value o f the domes tic mar ke t and the v alue of opiate s believed to be ex ported.

23 The socio-economic report was published in November 2019.

18
Myanmar Opium Survey 2019

After deducting the seizures of opiates reported by relevant law enforcement agencies24, it
can be estimated that 80 tons of raw opium and some 30 to 59 tons of heroin reached the
illicit market.25 Out of these 80 tons of opium, 5 tons were destined for domestic consumption,
with a market value of 7 million US$; the remaining 75 tons of opium were exported with a
revenue of 31 million US$. The main value of the opiate market is generated by the
manufacturing and trafficking of heroin. In 2019 domestic consumption of 6 tons of heroin led
to an income between 152 and 290 million US$, whereas the export of heroin (23 - 52 tons)
was deemed to be worth between 458 million and 1.04 billion US$ for Myanmar traffickers.
The overall gross value of the Myanmar opium economy for the year 2019 ranged between
649 and 1,370 million US$, equivalent to 0.9 - 1.9% share of the 2018 national GDP.26 The
value of manufacturing and trafficking after farm-gate up to the border of Myanmar ranges
between 588 and 1,263 million US$ (0.8 - 1.8% of the GDP). These values represent the income
generated by the traffickers after deducting the costs of buying the dry opium from the
farmers.
These estimates have some limitations. There is great uncertainty around the conversion ratio
of opium to heroin, which depends on three main factors: the morphine content of opium,
the efficiency of traffickers to extract morphine from opium and convert morphine to heroin,
and the purity of the heroin estimated.27 None of these factors are well researched in the
context of Myanmar but can have a strong impact on the estimated values of the opiate
economy. Estimates on demand in the region are based on 2011 data and may have changed
since then. Moreover, the estimates presented are gross estimates before deducting any cost,
e.g. costs for precursor substances, such as acetic anhydride, which can substantially reduce
the profits of manufacturers and traffickers of heroin. To assess the profits made, other cost
components such as transportation, labour costs and costs of bribery also need to be
considered.
The estimates presented here need to be understood as an indication of the order of
magnitude rather than as precise measurements. UNODC, in collaboration with CCDAC of
Myanmar, are working on improving the accuracy of the estimates.

24
 HONLEA by October 2019 reported the seizure of 1.381 tons of opium and 0.6471 tons of heroin. The quantities of opiates
seized in the whole year 2019 was extrapolated based on these figures, 1.537 and 0.777 tons respectively.
25 See more in Methodology chapter.
26 Source: World Bank.
27For a detailed description of the calculation of conversion ratios see “UNODC/MCN Afghanistan opium survey 2014” and
“UNODC/MCN Afghanistan opium survey 2017 – Challenges to sustainable development, peace and security”.

 19
Myanmar Opium Survey 2019

20
Myanmar Opium Survey 2019

Divider

 21
Myanmar Opium Survey 2019

Divider

22
Myanmar Opium Survey 2019

3. Eradication and Seizures
As in former years, the Government of the Republic of the Union of Myanmar (GOUM)
provided the data on eradication of opium poppy and seizures of opium in 2019.

3.1 Eradication
By the end of the 2019 growing season (March 2019), a total amount of 2,460 ha of opium
poppy eradication was reported by GOUM/CCDAC, representing a decrease of 6% compared
to 2018 (Table 6:). As in previous years, most of the eradication, 2,144ha (87%) occurred in
Shan State and in particular in South Shan region (2,000ha, 81%), followed by Kachin State,
Sagaing region and East Shan State with 126ha (5%), 118ha (5%) and 100ha (4%), respectively.
The decline in eradication started in 2015 and shows a similar trend as the area under opium
poppy cultivation (Figure 14:).

Table 6: Reported eradication in Myanmar (ha), 2007-2019

 2006- 2007- 2008- 2009- 2010- 2011- 2012- 2013- 2014- 2015- 2016- 2017- 2018-
 Region
 2007 2008 2009 2010 2011 2012 2013 2014 2015 2016 2017 2018 2019

 East Shan 1,101 1,249 702 868 1,230 1,257 537 356 378 482 264 224 100
 North
 916 932 546 1,309 1,315 977 532 337 532 69 97 29 44
 Shan
 South
 1,316 1,748 1,466 3,138 3,579 21,157 10,869 13,696 10,715 4,947 3,019 2,209 2,000
 Shan
 Shan
 State 3,333 3,929 2,714 5,315 6,124 23,391 11,939 14,389 11,625 5,498 3,381 2,462 2,144
 total
 Kachin 189 790 1,350 2,936 847 83 250 395 1,495 1,504 28 65 126
 Kayah 12 12 14 13 38 84 59 67 54 16 47 12 3

 Magway 45 1 1 4 7 60 8 9 47 44 19

 Chin 10 86 5 2 10 110 32 277 267 534 28 22 50
 Mandalay 3 2 39 45 1

 Sagaing 9 1 2 1 118
 Other
 64
 States
 National
 3,662 4,820 4,087 8,267 7,058 23,718 12,288 15,188 13,450 7,561 3,533 2,605 2,460
 total

Sourc e: GOUM /CCDAC
Figures for 201 9 are par tial and re fers to the per iod Se ptember 201 8 – March 2019

 Eradication versus opium poppy cultivation in Myanmar, 2007-2019

 70,000

 60,000

 50,000

 40,000

 30,000 23,718

 20,000 15,188 13,450
 12,288
 8,267 7,058 7,561
 10,000 3,662 4,820 4,087 3,533 2,605 2,460
 0
 2007 2008 2009 2010 2011 2012 2013 2014 2015 2016* 2017 2018 2019

 Eradication (ha) Cultivation (ha)

*Opium poppy cultiv ation for the ye ar 2016 , whe n survey w as not c onduc ted, w as plotte d with linear
interpolation.

 23
Myanmar Opium Survey 2019

Most of the locations in South Shan where eradication took place overlapped with areas with
high to very high opium poppy density. Map 4: shows eradication patterns in South Shan which
principally follow the high to very high density cultivation in mountainous areas. On the
contrary, eradication activities in East Shan presented a more irregular and dispersed pattern,
covering different density levels, from low to very high. In North Shan only very little
eradication was reported, equivalent to 44ha. This was concentrated in the south, near the
border with Wa State and in the north next to Shwe Li river.
In Kachin State, eradication was reported at the border with China whilst there was no
reporting from other medium to high density areas such as the region surrounding Tanai town.
In the Sagaing region 118ha eradication was reported in the north next to the border with
India. Finally, in the north of Chin State 50ha eradication was reported, located at the eastern
side of the Manipur River.

 GOUM eradication in South Shan, 2019

The opium poppy cultivation estimates presented in this report refer to the fields that were
identified at the time that the satellite images were taken. Therefore, if any effective
eradication was carried out after the satellite image acquisition date, it is not reflected in the
presented cultivation figures. Besides, data provided by GOUM may include eradication
implemented during the monsoon poppy season, prior to the main growing season when the
remote sensing survey was implemented. The eradication figures reported by GOUM were
not verified by UNODC.

24
Myanmar Opium Survey 2019

Map 4: Reported eradication of opium poppy and seizures of opium products in
Myanmar (2018-2019)

 25
Myanmar Opium Survey 2019

3.2 Seizures
Similarly, to the eradication figures, the seizures of different opium products reported by
GOUM showed decreases in all opiate types. Most of the opium and heroin seizures took place
near the larger towns, such as Muse, Lashio, Tachileik, and the other towns along trafficking
routes, such as Moh Nyin, Indaw, Kyaukse, Ywa Ngan, and Kutkai, as shown in Map 4:.

Table 7: Seizures of drugs (opiates) in Myanmar (kg), 1988-2019*

 Year Raw Opium Heroin Brown Opium Liquid Opium Low-grade opium

 1988-1997 22992 3722 186 118 306
 1998 5394 404 96 206 312
 1999 1473 245 24 333 314
 2000 1528 159 23 16 245
 2001 1629 97 7 19 142
 2002 1863 334 314 18 126
 2003 1482 568 156 52 204
 2004 607 974 59 39 396
 2005 773 812 44 21 128
 2006 2321 192 1371 29 6154
 2007 1274 68 1121 56 10972
 2008 1463 88 206 80 2453
 2009 752 1076 326 27 465
 2010 765 89 98 35 147
 2011 828 42 37 60 282
 2012 1470 336 46 29 81
 2013 2357 239 72 115 66
 2014 1828 435 1109 102 134
 2015 889 186 539 38 35
 2016 944 769 472 47 22
 2017 1256 754 348 146 6
 2018 2829 1099 554 146 30
 2019 (Sep) 1299 633 5 58 64
Sourc e: GOUM/CCDAC
* Figure s for 2019 correspond to January – September only.

26
Myanmar Opium Survey 2019

 Seizures of drugs (opiates) in Myanmar (kg), 2007-2019*
 14,000

 12,000

 10,000
 Kilograms

 8,000

 6,000

 4,000

 2,000

 0
 2007 2008 2009 2010 2011 2012 2013 2014 2015 2016 2017 2018 2019
 Raw Opium Herion Brown Opium Liquid Opium Low-grade opium

Sourc e: GOUM/CCDAC
* Figu res for 2019 correspond to Jan uary – Sep temb er on ly

 Opium process refinery and mixer, North Shan, 2018

 27
Myanmar Opium Survey 2019

28
Myanmar Opium Survey 2019

Divider

 29
Myanmar Opium Survey 2019

Divider

30
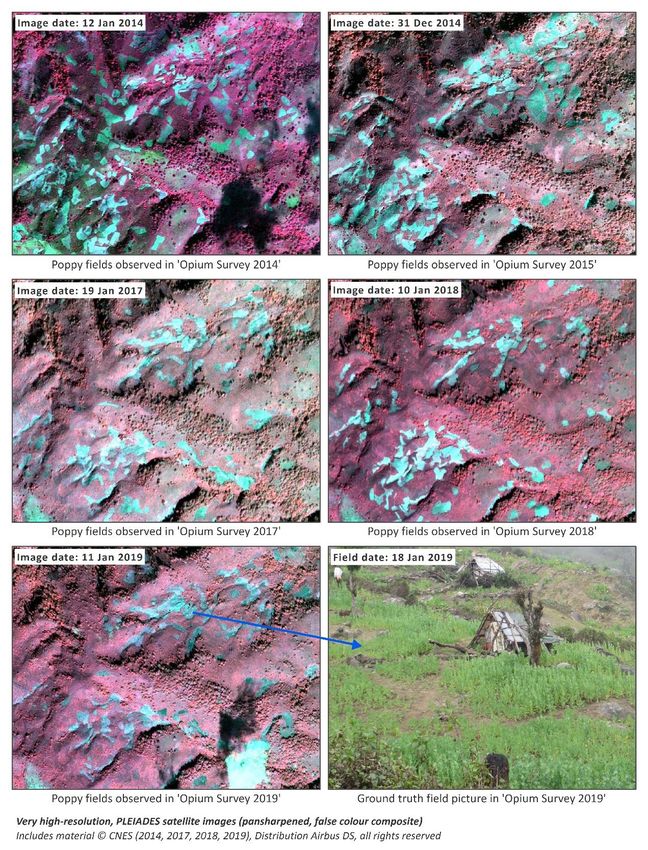
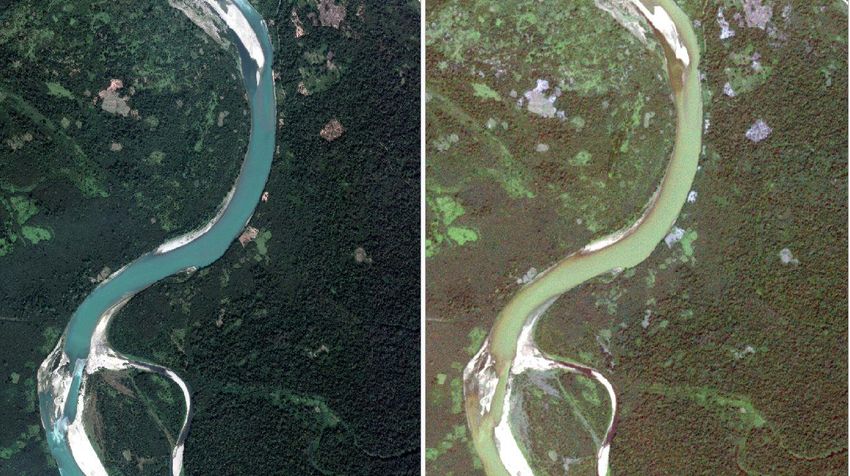
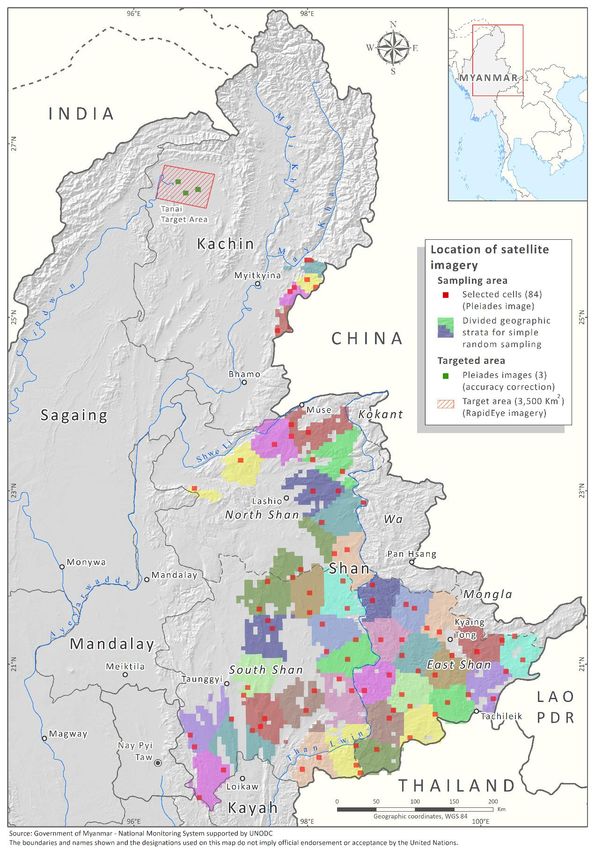
Myanmar Opium Survey 2019

4. Methodology
The 2019 opium survey included three components:
 1. Estimation of opium poppy cultivation area throughout North Shan, East Shan, South
 Shan, and Kachin. The area estimation survey was based on the use of satellite images
 as the primary source of data, which was supplemented by field surveys to provide
 ground-truthing that supports the interpretation of opium poppy fields;
 2. Crop yield estimation survey throughout South Shan, North Shan and East Shan. Due
 to insecure situation crop yield measurements could not be conducted in Kachin
 State;
 3. A socio-economic (village) survey in poppy growing areas of North Shan, East Shan
 and South Shan. An in-depth analysis of the results will be presented in a separate
 report, expected to be ready later in 2020.

 4.1 Area estimation
Remote sensing imagery
The area estimation to monitor the extent of opium poppy cultivation in Myanmar was carried
out by means of remote sensing techniques. North, East and South Shan regions in Shan State,
and Tanai area and the eastern zone of Kachin State were surveyed. Satellite imagery were
acquired following two approaches (Map 5:):
 1. A sampling approach with a selection of randomly selected squared segments; this was
 used for the three Shan regions and the south-eastern part of Kachin (see Sample
 approach section);
 2. A full coverage approach with larger, targeted images; this was applied for the Tanai
 area of Kachin State (see Target area selection and interpretation section).
The images used for the sampling areas were very high resolution (VHR) satellite images,
whilst a combination of VHR and high resolution (HR) images were used for the targeted areas.
The VHR images at the sample locations were acquired by Pleiades satellites, which provides
images of 2 metre ground resolution with four spectral bands (blue, green, red and infra-red)
and a 50 centimetre panchromatic band. For every location (sample segment), two images
were acquired with an approximate five-week interval; one image was taken in December or
January and the other one between February and March. These two dates correspond to the
pre- and post-harvest periods of poppy, thus facilitating the identification and discrimination
from other land cover classes. To determine the image acquisition dates, the regional
differences between the crop calendars were considered.

 31
Myanmar Opium Survey 2019

 VHR image (Pleiades) on the left vs. HR image (RapidEye) on the right

The images covering the Tanai area in Kachin State were acquired by RapidEye satellites, with
6.5 metre nominal ground resolution or 5 metre resolution for orthorectified products. It
provides five spectral bands, ranging from blue to near infrared colours. A few VHR Pleiades
images were acquired for the same areas, to correct for interpretation errors caused by the
lower spatial resolution of the RapidEye images. By interpreting both image types
independently, a factor was determined that provides the difference in area estimates from a
RapidEye image compared to Pleiades images. This factor was applied to the fields that were
only covered by the RapidEye images, to correct for the differences in spatial resolution.

32
Myanmar Opium Survey 2019

Map 5: Different types of satellite imagery approaches used for the survey, 2019.

 33
Myanmar Opium Survey 2019

Risk area and sampling frame for the selection of satellite image locations
A risk area describes the geographic area considered in the area estimation survey. Basically,
the risk area for the opium survey was developed by the combination of the following
factors:
 1) Land Cover;
 2) Altitude;
 3) Opium poppy free28 areas according to ground information.
Land cover was the first important factor in defining the sampling frame. From the 2012 survey
onwards, a land cover map, which was developed by classifying 5 DMC images with 22 metre
resolution, acquired in February 2011, was used. From this map, large agricultural areas were
extracted and considered to be poppy-free, since the cultivation of opium poppy was
practised in small agricultural areas, often surrounded by natural vegetation. Wetlands and
settlements were also excluded. Other classes of land use were considered to have the
potential for opium poppy cultivation.
Prior to 2013, only altitudes between 800 and 1,800 metres were to be considered within the
risk area. This was based on survey findings which had revealed that 95% of opium poppy was
cultivated at such altitudes. However, later evidence showed the existence of poppy fields at
600 metre altitude and above, without a specific higher limit. Consequently, the sampling
frame for the selection of the sample locations was updated since 2013 using this finding.
Several opium poppy-free areas were identified based on ground information. The special
regions; Wa (former S.R.2), Mongla (former S.R.4), and Kokant (former S.R.1); were excluded
from the sampling frame. The townships; Mabein, Kyaukme, Nawng Hkio and Kunlon in North
Shan; and Kalaw, Pindaya, Yak Sauk and Ywa Ngan in South Shan; were excluded from the
sampling frame for the same reason. A 10-km buffer zone along the border with Thailand,
which were considered opium poppy-free in earlier surveys, was included again in sampling
frame since 2013 because ground information from the 2012 survey indicated a certain poppy
risk.
The above-mentioned factors were combined in a Geographic Information System (GIS) to
calculate the sampling frame in Shan State. The sampling frame for Waingmaw Township in
Kachin State was developed only considering an altitude factor of more than 800 metres.

28 Opium poppy free in the sense of no indication for significant levels of opium poppy cultivation.

34
Myanmar Opium Survey 2019

 Altitude ranges (metres) of poppy fields detected in satellite images, 2018/2019

 1600

 100%
 % of poppy fields found

 80%

 60%

 40%

 20%

 0%
 South Shan East Shan North Shan Kachin (Waingmaw)

 Regions

Sampling approach, sample size and sample selection
Because of the dispersed distribution of poppy cultivation in the North, East and South Shan
regions and in southern Kachin, a sampling approach is the most cost-efficient method given
the required accuracy.
The sampling frame for this survey was a set of 5x5 km segments used to select the locations
for obtaining satellite imagery. For that purpose, a 5x5 km regular grid was superimposed on
the risk area. To increase the efficiency of the sample (thus to reduce the number of images
purchased that only cover a small part of the risk area), a threshold of a minimum of 30% of
risk area was set: if a segment contained less than 30% of risk area (e.g. is a cell at the
boundary of the risk area), it was not included in the sampling frame. Nevertheless, in the
extrapolation, the whole risk area is considered, with the underlying assumption that the area
outside of the frame behaves on average as the area inside the sampling frame.

In 2019, the same samples were used as selected for survey of 2018, totalling 84 segments
(Table 8:). Since the same samples are used in 2018 and 2019, the 2018 selection method is
explained. Firstly, the frame was separated by region. Here, each segment had to be assigned
to exactly one per region: if the majority of the risk area is within that region, the segment
was assigned to that region. Therefore, regional boundaries were in some sense generalised
to fit the 5x5 km grid. Secondly, each sub frame (region) was divided into compact
geographical strata of approximately equal area. In former surveys the definition of the strata
was done manually but a clustering algorithm (“k-means”) in the statistical software R29
package Spcosa was applied since the 2014 survey. In each stratum, two sampling locations
were selected by simple random sampling. This sampling method provides a geographically
well distributed sample and allowed the variance (uncertainty) to be estimated in an unbiased
manner. See for more details the Myanmar Opium Survey of 2015.30

29 http://www.r-project.org/ and package http://cran.r-project.org/web/packages/spcosa/index.html
30 https://www.unodc.org/documents/crop-monitoring/sea/Southeast_Asia_Opium_Survey_2015_web.pdf

 35
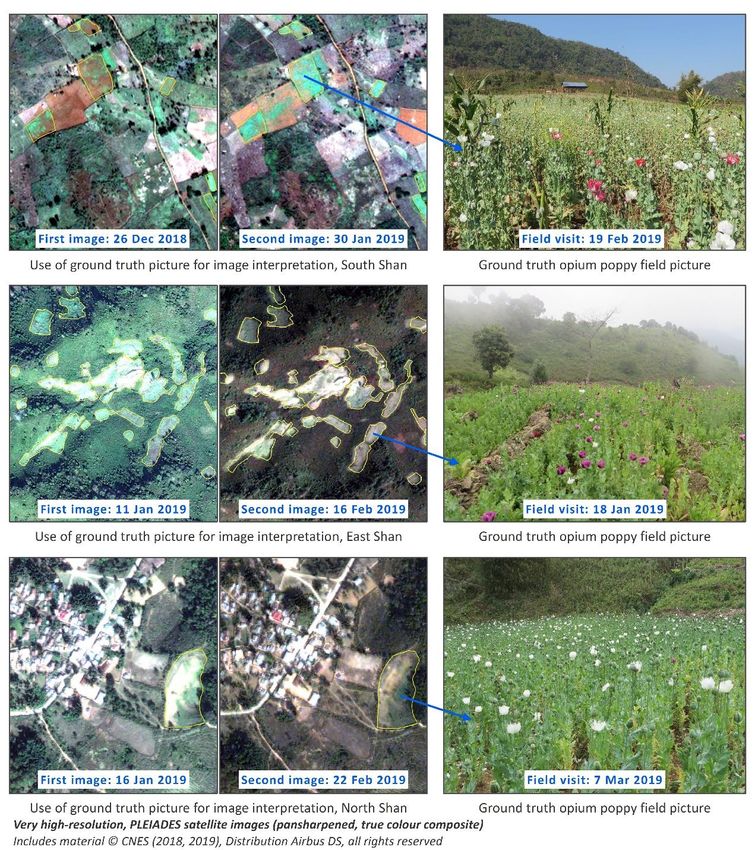
Myanmar Opium Survey 2019

Table 8: Sample size allocation in 2019
 Number of geo- Number of geo-
 Region Sample size 2019 Sample size 2019
 strata 2018 strata 2019
 East Shan 30 30 15 15
 South Shan 30 30 15 15
 North Shan 16 16 8 8
 Kachin 8 8 4 4
 Total 84 84 42 42

Ground truth data collection
In previous surveys, the ground truth data collection was conducted in collaboration with the
Remote Sensing and GIS Section of the Forest Department, Ministry of Natural Resources
and Environmental Conservation. Each year, field teams organized by the Department carried
out ground truthing at the selected sample locations. In 2019, the Forest Department was not
involved in the opium survey activities. A technical team from UNODC Myanmar office,
including four members, visited 32 satellite image sites out of target 36 locations and collected
ground truth data (Table 9:). The team, in collaboration with the local drug enforcement
police, visited selected satellite sample sites during the period of December 2018 to March
2019.

 “Ground truthing” in South Shan, 2019

The ground verification teams visited selected sites with printouts of the satellite images (see
Map 6:). Once they reached the area represented in each single scene, they annotated the
printouts with the land use classes and relative boundaries proceeding with specific transect
itineraries. They collected GPS coordinates taking field photos from 32 selected satellite image
sites in Shan State. Back in the office, poppy fields were visually interpreted by an UNODC
national expert from the Myanmar office. The results were assessed, and quality control
procedures were applied by international experts at UNODC Headquarters, Vienna.

36
Myanmar Opium Survey 2019

Table 9: Ground truth data collection, 2007-2019

 No. of Segment No. of segment No. of
 Survey Ground VHR images
 Satellite image VHR segments size visited (ground segments
 Year truth % area (km²)
 in Shan (km) truth) in Kachin

 2007 Ikonos 22 8x8 17 77% 2,816
 2008 Ikonos 28 8x8 19 68% 3,584
 2009 Ikonos 40 8x8 34 85% 5,120
 2010 GeoEye, WorldView 40 6.5 x 6.5 32 80% 3 3,634
 2011 WorldView, QuickBird 51 6x6 40 78% 3 3,888
 2012 GeoEye, WorldView 58 5x5 47 81% 8 3,300
 2013 GeoEye, WorldView 66 5x5 46 70% 8 3,700
 GeoEye, WorldView,
 2014 76 5x5 49 64% 8 4,200
 QuickBird
 2015 Pleiades 76 5x5 47 62% 8 4,200
 2016 No survey -- -- -- -- -- --
 2017 Pleiades 38 5x5 3 8% 8 4,200
 2018 Pleiades 76 5x5 30 39% 8 4,200
 2019 Pleiades 76 5x5 32 42% 8 4,200

 37
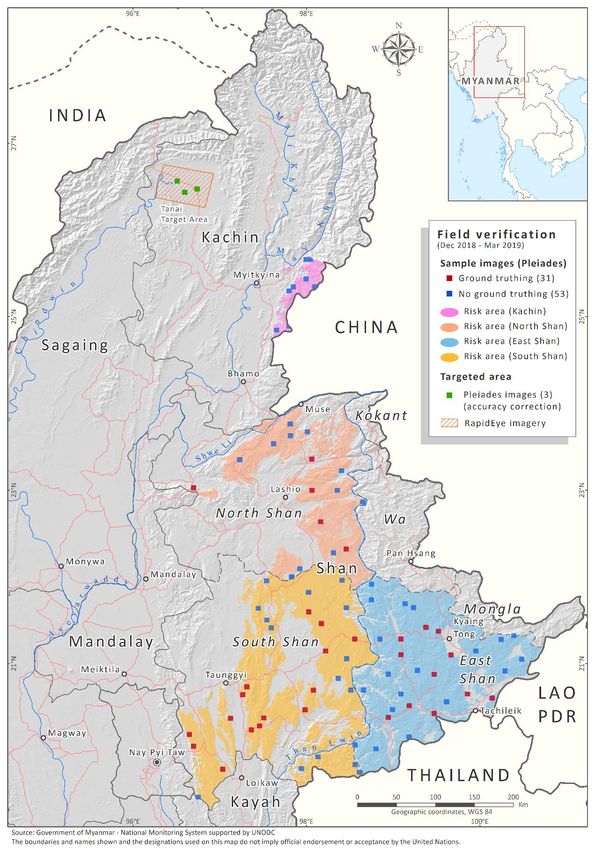
Myanmar Opium Survey 2019

Map 6: Field verification status of the survey with satellite images, 2019

38
Myanmar Opium Survey 2019

Target area selection and interpretation
The area estimates for Tanai area in Kachin State were based on a so-called target approach.31
These areas were fully covered by high resolution (HR) satellite imagery (RapidEye). In addition
to the HR images, very high resolution (VHR) images (Pleiades) were acquired (Map 5: & Map
6:), which allowed for an estimation of the omission/commission and geometric errors that
stem from the use of lower resolution imagery.
To that end, the area of opium poppy fields was first interpreted on the lower resolution
imagery (full coverage) and then on the VHR images (three selected locations) (Figure 21:),
the latter producing more accurate interpretations. The difference between the areas of the
two interpretations was used to calculate a correction factor that was applied subsequently
to the estimates interpreted with the HR images (Table 11:).32
 Poppy fields interpreted on Pleiades and RapidEye satellite imagery

31The target areas were defined based on information on poppy cultivation from previous surveys. Three VHR images were
acquired for Tanai in Kachin State.
32 95% confidence intervalsfor each targeted area were calculated assuming a t-student distribution and two degrees of freedom.
See https://www.itl.nist.gov/div898/handbook/mpc/section5/mpc552.htm for further information on the method to calculate
the standard deviation.

 39
Myanmar Opium Survey 2019

Satellite image processing and interpretation
The collected ground truth data, namely the geotagged field photos, were used as reference
information to visually identify, interpret and delineate poppy fields. This task was conducted
by a UNODC national experts in the Myanmar office, with a long-time experience in poppy
detection and interpretation of the fields.
The classification procedure of the very high resolution images is illustrated in the flowchart
below (Figure 22:). Before the interpretation phase, the acquired imagery is pre-processed
through a number of steps into a stable, uniform format for the visual analysis. The main pre-
processing step is pansharpening (merging) of the Pleiades multispectral image with the
panchromatic image resulting in a pansharpened VHR imagery with the spatial resolution of
the panchromatic band (50 cm) and with all multispectral bands. This is a fundamental step to
better discriminate poppy fields from other landcover classes. In addition, visual enhancement
procedures are applied, when appropriate.
 Satellite image interpretation flowchart

 Sampling
 selection frame

 Very high resolution Very high resolution
 images images
 (December/January) (February/March)

 Ground truth
 Visual interpretation
 data

 Suspicious poppy fields
 pre-harvest

 Historical data on
 poppy growing locations
 Visual overlay
 and decision

 Pansharpened real color
 very high resolution images

 Classified sample area
 with opium
 poppy area estimates

The satellite image interpretation was conducted in a visual manner. The latest ground truth
data, historical ground truth data, data collected from the yield measurements and
eradication activities were used as reference material during the interpretation process. In
visual interpretation, accuracy and precision of the result vary with the experience and the
skills of those conducting the interpretation. Therefore, interpretation keys (decision rules)
were used that bring the interpreters to a comparable level of knowledge, experience and

40
You can also read