Waitaki/Mackenzie Visitor Survey 2020 - Lena Mkwara David Simmons Geoffrey Kerr May 2021
←
→
Page content transcription
If your browser does not render page correctly, please read the page content below

LEAP Research Report
No. 58

Waitaki/Mackenzie Visitor
Survey 2020

Lena Mkwara
David Simmons
Geoffrey Kerr

May 2021
Waitaki/Mackenzie Visitor Survey
 2020

 Lena Mkwara
 David Simmons
 Geoffrey Kerr

 Land Environment and People Research Report
 No.58
 2021

 1172-0859 (Print)
 1172-0891 (PDF)
 978-0-86476-466-9 (Print)
 978-0-86476-467-6 (PDF)

 Lincoln University, Canterbury, New Zealand
Abstract
This report presents the findings from a 2020 survey of visitors to tourist attractions in
Waitaki and Mackenzie districts. COVID-19 cancelled fieldwork before data collection
was complete. The limited data indicate that most visitors tend to visit a number of
tourist attractions in the Waitaki/Mackenzie area and make substantial expenditures
associated with these attractions. No single tourist attraction was a strong attractant
to visitors, the large majority of whom would have visited the districts in the absence
of the attractions at which they were invited to complete the survey.

Keywords: Tourist attractions, tourism spending, economic attribution model, Mackenzie
District, Waitaki District

Acknowledgements
This project benefitted immensely from the contributions of others. We wish to thank the
following people for their generosity and assistance. Waitaki District Council and Tourism
Waitaki for their guidance and support. Operators at Oamaru Blue Penguin Colony, Dark Sky
Project at Tekapo, Vanished World Centre, and Kurow Museum and Information Centre who
assisted with the distribution of survey cards. Lincoln University colleagues who peer reviewed
the survey instrument. Dr Sally Driml, University of Queensland, for peer review of the survey
instrument and the economic attribution model. Dr Yvonne Mathews, University of
Waikato/Waikato Regional Council, for structuring the interactive mapping inputs. Dr Bentry
Mkwara for GIS mapping assistance. Kathy Kise and Yifan Cheng for fieldwork assistance.
The project was funded by the Lincoln University Centre of Excellence, Sustainable Tourism
for Regions Landscapes and Communities.

 ii
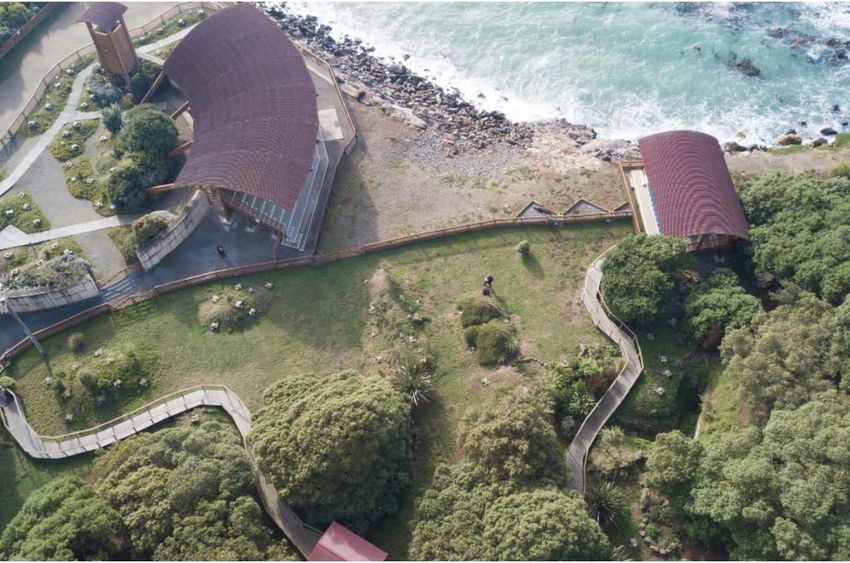
Table of Contents
Table of Contents ....................................................................................................... iii
Executive Summary ...................................................................................................vi
1 Introduction ......................................................................................................... 7
2 Objectives ........................................................................................................... 9
3 Methodology ..................................................................................................... 10
 3.1 Survey design ............................................................................................. 10
 3.2 Sampling design.......................................................................................... 10
 3.3 Data collection............................................................................................. 11
 3.4 Methods of data analysis ............................................................................ 20
 3.4.1 Economic attribution model .................................................................. 20
4 Results .............................................................................................................. 26
 4.1 Responses and data preparation ................................................................ 26
 4.2 User profiles ................................................................................................ 27
 4.3 Activity ......................................................................................................... 30
 4.4 Travel route in Waitaki/Mackenzie area ...................................................... 34
 4.5 Logistics ...................................................................................................... 35
 4.6 Expenditure attributable to tourist attractions .............................................. 36
5 Conclusions and recommendation .................................................................... 41
References ............................................................................................................... 42
Appendix 1: Waitaki/Mackenzie Questionnaire ........................................................ 43
Appendix 2: Waitaki/Mackenzie tour operators and visitor centers survey briefing .. 55

 iii
List of Figures
Figure 1: Waitaki and Mackenzie districts ................................................................................. 8
Figure 2: Visitors’ sub-groups .................................................................................................. 11
Figure 3: Fieldwork key milestones ......................................................................................... 20
Figure 4: Expenditure categories ............................................................................................. 23
Figure 5: Expenditure in the Waitaki/Mackenzie area ............................................................ 25
Figure 6: Age (n=167) ............................................................................................................... 27
Figure 7: New Zealand residents’ home locations (n=74) ....................................................... 28
Figure 8: Overseas residents (n=117) ...................................................................................... 29
Figure 9: Overseas visitors’ trip origins in New Zealand (n=117) ............................................ 29
Figure 10: Reasons for a visit to the Waitaki/Mackenzie area ................................................ 30
Figure 11: Importance of visit to the attraction (n=191) ......................................................... 31
Figure 12: Intercept site role in visit (n=191)........................................................................... 31
Figure 13: The importance of tourist attraction to overall visit in the area (n=191) .............. 32
Figure 14: Type of accommodation (n=186)............................................................................ 35
Figure 15: Heat maps of expenditure locations by category................................................... 40

 iv
List of Tables
Table 1: Survey invitation intercept sites ................................................................................ 17
Table 2: Survey response ......................................................................................................... 26
Table 3: Commercial activities ................................................................................................. 33
Table 4: Cultural or historic sites ............................................................................................. 33
Table 5: Leisure and recreation sites or activities ................................................................... 33
Table 6: Starting and finishing points into Waitaki/Mackenzie districts ................................. 34
Table 7: Average TA associated expenditure/visitor/visit (NZ$) ............................................. 36
Table 8: TA attributed expenditure: Waitaki and Mackenzie Districts combined .................. 37
Table 9: Average expenditure/visitor/visit (NZ$) .................................................................... 37
Table 10: Average expenditure per category .......................................................................... 39

 v
Executive Summary
Data from a survey of visitors to tourist attractions in Waitaki and Mackenzie Districts
from January to March 2020 describes visitors’ use and spending attributable to the
Waitaki Whitestone Geopark, Oamaru Blue Penguin Colony and Dark Sky Project,
and its economic significance to the local economies. This research was part of a
broader project aimed at assessing the impact and effectiveness of different forms of
public investment in visitor attractions on local and regional economic development in
the Waitaki and Mackenzie Districts. COVID-19 cancelled fieldwork before data
collection was complete.

No single tourist attraction is a major drawcard ̶ 86% of respondents would have visited
without the attraction where they were intercepted.

Three related measures of spending are assessed:
 (i) Tourist attraction (TA) associated expenditure: All expenditure by visitors over
 the time spent Waitaki and Mackenzie area.
 (ii) TA attributed expenditure: Expenditure, which is closely dependent on the tourist
 attraction.
 (iii) TA substitutable expenditure: This is all expenditure by a subset of visitors who
 would not have travelled to the Waitaki/Mackenzie area if the tourist attraction were
 not available.

The average TA associated expenditure per visitor per visit was $299 for Waitaki
District and $444 for Mackenzie District. The difference in expenditure between the
two districts is not statistically significant.

Per-capita TA attributed expenditure for all tourist attractions ($464) is very similar to
TA associated expenditure ($542). Only 36% of respondents were members of the TA
attributed expenditure category. Insufficient data precluded estimation of TA
substitutable expenditure. It was not possible to estimate expenditure associated with
each tourist attraction due to limited data.

Results support further investigation of visitors’ spending attributable to different
attractions, which would help to guide councils and central government in identifying
the right mix of tourist projects and initiatives to promote, support and invest in.

 vi
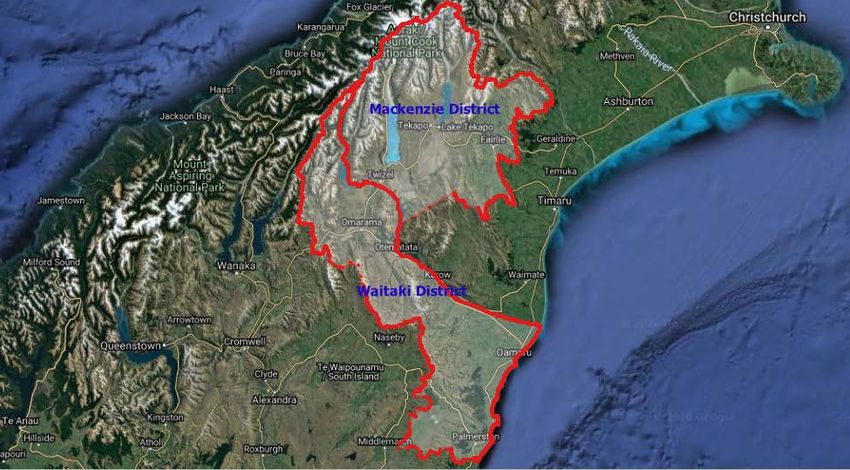
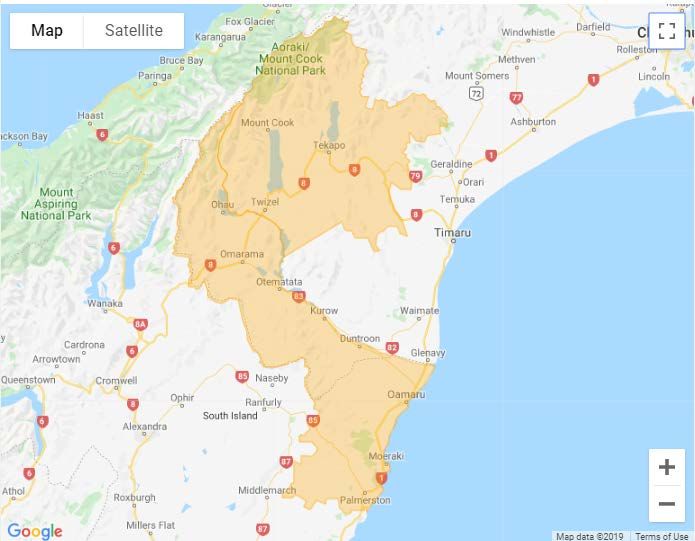
1. Introduction
Waitaki and Mackenzie districts (Figure 1) are endowed with many iconic tourist attractions.
Visitors are attracted to the Waitaki District by its unique geology, cultural and historic
heritage. It is home to the Waitaki Whitestone Geopark. The main town of Oamaru is a tourism
destination in its own right, with attractions such as the Blue Penguin Colony and the Victorian
Precinct. The town is the Steampunk Capital of the World, attracting thousands of visitors
with its annual steampunk festival 1. It also acts as a gateway to the Waitaki River and hydro
lakes. In 2018, there were 1.7m annual visitors to the Waitaki District, of whom 83% were
domestic2.

The Mackenzie District is popular for astral tourism including the Dark Sky Project at Tekapo.
It is also home to Aoraki/Mount Cook National Park, with its inspiring alpine landscape
extending over 700 km2, with headquarters at Aoraki/Mt Cook Village. Aoraki/Mt Cook is New
Zealand's highest mountain, rising 3,754 metres above sea level, and the park includes most
New Zealand peaks over 3,000 metres high.

The Waitaki and Mackenzie districts host the Alps 2 Ocean (A2O) Cycle Trail, New Zealand’s
longest continuous cycle trail. In 2018, approximately 2.0m tourists visited the Mackenzie
District and 45% were from overseas 3.

Together, international and domestic visitors are estimated to have spent $163 million in
Waitaki District and $184 million in Mackenzie District in the year ended June 2020 (MBIE,
2020).

There is anecdotal evidence that many communities in the Waitaki and Mackenzie districts
have benefitted from a number of new businesses established to support these tourist
attractions, and existing business revitalisation. A previous research project found that
regeneration of the Victorian Precinct of Oamaru, the Oamaru Blue Penguin Colony, the
Waitaki Whitestone Geopark and A2O Cycle Trail were among the key catalysts for
revitalising the town of Oamaru after a period of marked economic decline and population
loss in the 1980s (Taylor, Mackay, Johnston, & Perkins, 2019).

1
 https://waitakinz.com/steampunk-nz-festival/
2
 https://www.christchurchnz.com/media/0ohna4hz/dsimmons_cnz_tourism_webinar_post_covid19.pdf
3
 ibid

 7
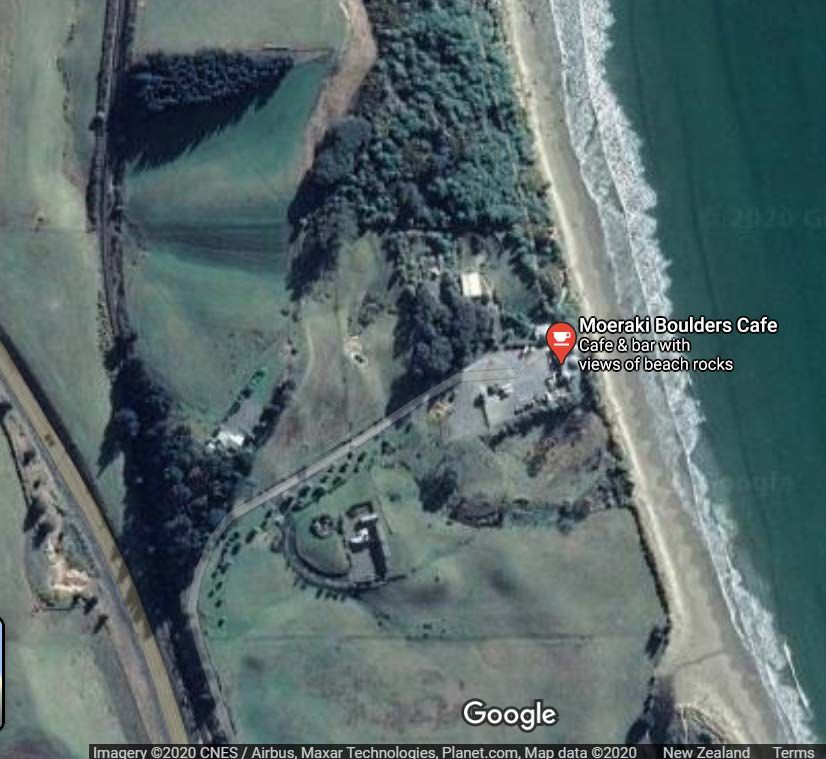
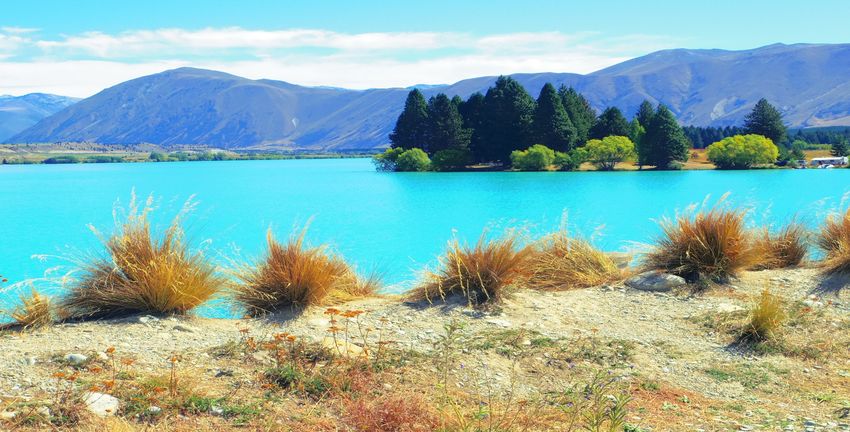
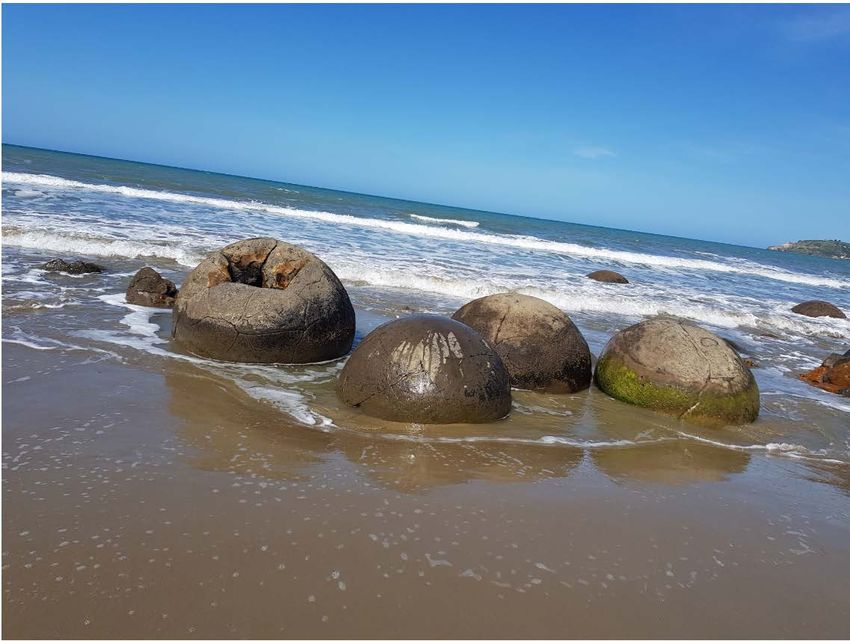
Figure 1: Waitaki and Mackenzie districts

The town of Tekapo in Mackenzie District is another example of revitalisation, where the Dark
Sky Project is among the key catalysts to the growth in visitor numbers and business
opportunities. Pre-COVID-19, the town was struggling to keep pace with visitors’ demand for
infrastructure, including accommodation and public facilities.

The role of attractions in drawing and retaining visitors to regions is acknowledged by the
Government in the recently launched Tourism Investment Attraction Programme (NZTE,
2019). However, the evidential basis on the extent to which public sector support for and
investment in tourist attractions influence tourist and expenditure flows to local economies is
limited. There are gaps in knowledge on tourism expenditure attributable to different tourist
attractions.

This report presents the results of a survey of visitors to Waitaki and Mackenzie districts
carried out from January to March 2020. It was designed to capture the level of visitors’ use
of attractions and tourism expenditure that is attributable to different tourist attractions in the
area.

This survey was part of a broader project aimed at assessing the impact and effectiveness of
different forms of public investment in visitor attractions on local and regional economic
development involving four key tourist attractions in Waitaki and Mackenzie Districts. These
are:
 (i) The Waitaki Whitestone Geopark (Moeraki Boulders, Elephant Rocks and Clay Cliffs)
 (ii) The Oamaru Blue Penguin Colony
 (iii) The Dark Sky Project (Tekapo)
 (iv) A2O Cycle Trail (the results of a survey of A2O users are reported separately (Mkwara,
 Simmons, & Kerr, 2020)).

 8
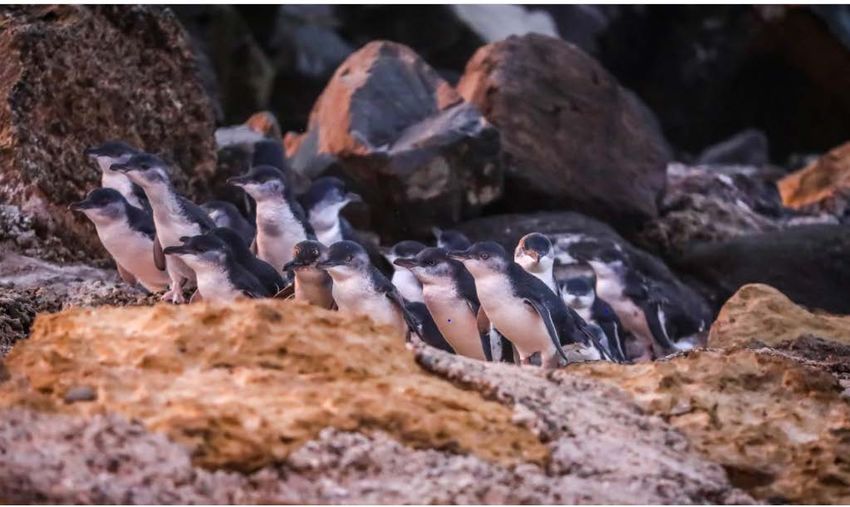
The Waitaki Whitestone Geopark covers 7,200 square kilometres and includes 101
geological sites designated for their local, national and international significance. It is
managed by the Waitaki Whitestone Geopark Trust. Submissions are underway to advance
it into New Zealand’s first United Nations Educational, Scientific and Cultural Organization
(UNESCO) Global Geopark (Waitaki District Council, 2018). Our survey included the three
most significant geological sites (Moeraki Boulders, Elephant Rocks and Clay Cliffs). There
are no estimates of annual visitors to the Geopark.

The Oamaru Blue Penguin Colony opened in 1992 and offers roosting and breeding areas
for the blue penguins, which were threatened by extinction in the early 1990s4. The colony is
managed by Tourism Waitaki and is Oamaru’s largest tourist attraction. Pre-COVID-19, over
70,000 people visited the colony each year and 88% were overseas visitors 5. It has the added
benefit of encouraging people to stay overnight in order to enjoy the evening viewing of
penguins returning from the sea at dusk.

The Dark Sky Project (Formerly Earth & Sky Stargazing) is a Ngāi Tahu astro-tourism
initiative founded in 2004. Pre-COVID-19, it was estimated to host over 40,000 visitors each
year on a range of exclusive stargazing experiences (Ngāi Tahu Tourism, 2020) and 72%
were overseas visitors (International Dark-Sky Association, 2017). Like the penguin colony,
the Dark Sky Project has the benefit of encouraging people to stay overnight in order to enjoy
night sky viewing.

2 Objectives
This research aimed to:
 (i) Describe visitors’ use of key tourist attractions in Waitaki and Mackenzie districts;
 (ii) Estimate spending attributable to Waitaki Whitestone Geopark, Oamaru Blue Penguin
 Colony and Dark Sky Project; and
 (iii) Estimate the significance of spending by visitors to these attractions to the local
 economies.

4
 https://www.penguins.co.nz/about-us/conservation
5
 https://www.waitaki.govt.nz/our-council/news-and-public-notices/news/Pages/some-facts-about-tourism-waitaki.aspx

 9
3 Methodology
This section outlines methods used, including survey design, data collection and data
analysis.

3.1 Survey design
An online survey collected data from a large number of visitors to tourist attractions. It allowed
more in-depth questioning than field intercepts and was more cost-effective. The survey was
developed based on previous practice, including the Queensland national park tourist
expenditure survey by Driml, Brown, Ballantyne, Pegg, and Scott (2011). It was available in
English, Mandarin, Japanese and German.

The online survey included questions on user profiles, visits to tourist attractions, and the
importance of these attractions to travel decisions, logistics and spending. The economic
component of the questionnaire included a request for respondents to indicate how much
money they had spent on package holidays as well as their spending in the area (delineated
by a map) on:
 • travel;
 • accommodation;
 • food and drinks;
 • activities and trips;
 • other (equipment, souvenirs etc.).
Respondents were asked to specify whether their answers were for themselves or their
group, and the time period they applied to. Questions mirrored the classification of tourism
characteristic industries and tourism related industries defined in the New Zealand Tourism
Satellite Account (TSA) 6. The online questionnaire used Qualtrics software. The full survey
appears in Appendix 1. The Lincoln University Human Subjects Ethics Committee approved
the survey.

3.2 Sampling design
It was anticipated that tourist attraction use and spending by visitors might vary for sub-groups
e.g. overseas versus New Zealand residents, package holiday versus independent, and
overnight and day trips (Figure 2).

6
 https://www.stats.govt.nz/information-releases/tourism-satellite-account-2018

 10
Figure 2: Visitors’ sub-groups

 Visitors to selected tourist attractions
 aged 16+

 Overseas New Zealand

 Package holiday Independent Package holiday Independent

 Overnight Day Overnight Day Overnight Day Overnight Day
 trip trip trip trip trip trip trip trip

Previous research on tourism expenditure suggests that random sampling with minimum
samples of 30 to 40 participants for each subgroup of interest may meet the criteria for within-
group representativeness (e.g. Driml et al., 2011). This would require a minimum sample of
320 tourists per attraction if visitors were evenly distributed across sub-groups. Annual
estimates of visitors and the proportion of overseas versus New Zealand residents are
available only for Oamaru Blue Penguin Colony and the Dark Sky Project. However, data on
the proportions of visitors who are on package holidays and who are travelling independently
do not exist. Due to these limitations, it was difficult to design an appropriate sampling frame.
Therefore, we invited as many tourists as possible to complete the survey.

3.3 Data collection
Respondents were invited to participate in the online survey through (i) intercepts and (ii)
survey invitation cards distributed by operators at Oamaru Blue Penguin Colony, Dark Sky
Project, Vanished World Centre, and Kurow Museum and Information Centre. Survey
invitation through intercepts was the primary approach used for the Waitaki Whitestone
Geopark, whereas both approaches were used for the Oamaru Blue Penguin Colony and the
Dark Sky Project.

Survey invitation through intercepts
Visitors were intercepted at tourist attractions and briefed about the online survey prior to a
request to provide their email address for online survey distribution. Assurance was given
that participation in both the intercept survey and the subsequent online survey was voluntary
and that completing the survey and providing an email address did not in any way obligate
them to complete the online survey.

The survey invitations by intercepts were carried out for a total of eleven days (mid-January
to 1 March). Twelve more survey invitation days were planned for March and April (over the
Easter holiday) but were not carried out due to COVID-19. The selection of survey invitation
intercept sites was informed by stakeholder consultation and preliminary field observations.

Moeraki Boulders had the highest flow of visitors. However, it was a short stopover for most
visitors, typically travelling between Dunedin and Christchurch. Consequently, many visitors

 11
were unwilling to be intercepted, and the time to engage with those intercepted was very
limited. Preliminary field observations showed that visitors were more likely to respond at the
car park than at the beach. Therefore, survey invitation intercepts were mainly carried out at
the Moeraki Boulders café car park. The length of time survey distributors spent at the site
varied from 2 to 6 hours.

Moeraki Boulders café car park

Moeraki Boulders

 12
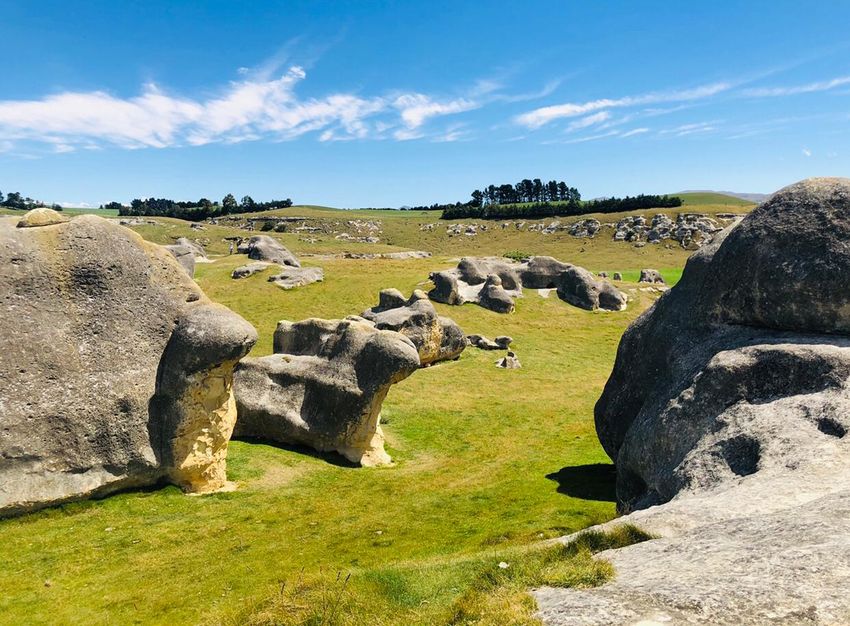
In contrast, at Elephant Rocks, visitor flow was generally lower, visitors seemed more relaxed,
and this provided an opportunity to engage more with them. Intercepts were carried out inside
the paddock. Visitors were approached either immediately after entry/before exit, or as
visitors sat down to relax. The length of time survey distributors stayed at the site varied from
4 to 6 hours. The busiest times were typically from noon to 3 pm.

Elephant Rocks

Likewise, at Clay Cliffs, the flow of people was relatively low and the average time spent at
the site was longer than at Moeraki Boulders. Many people were relaxed and willing to be
stopped. Survey invitation intercepts were conducted at the public car park. The length of
time survey distributors spent at the site varied from 4 to 6 hours. The busiest times were
from 11 am to 4 pm.

 13
Clay Cliffs’ car park

 14
Clay Cliffs

 15
At the Oamaru Blue Penguin Colony, survey invitation by intercepts were carried out for 3
evenings from 26-28 February 2020. Operators introduced and briefed visitors about the
survey at the stadium while they waited for penguins to arrive at the shore. Survey distributors
recorded the email addresses of visitors who were willing to participate in the online survey.
To avoid disrupting visitors’ viewing experiences, email addresses were recorded for only 30
minutes each night, before the first penguin arrival.

Oamaru Blue Penguin Colony
Source: https://waitakinz.com/oamaru-blue-penguin-colony/

 16
At the Dark Sky Project, survey invitation intercepts were carried out for 2 evenings from 2-3
March 2020. Survey distributors intercepted visitors at the foyer as they entered to register
for departure to night sky viewing in two 30-minute periods each night [8-8.30 pm and 10-
10.30 pm]. Most visitors were in a hurry to depart for night sky viewing and were unwilling to
stop.

Operators confirmed that the number of visitors was very low compared to previous years
due to COVID-19 travel restrictions. Pre-COVID-19, the Oamaru Blue Penguin Colony and
the Darky Sky Project were primary drawcards for Chinese visitors, particularly during
Chinese New Year, who were unable to visit during this survey period.

Table 1 shows the number of visitors invited to complete the online survey at each site.

Table 1: Survey invitation intercept sites
 Site Number of visitors intercepted

 Oamaru Blue Penguin Colony 97

 Dark Sky Project 46

 Moeraki Boulders 190

 Elephant Rocks 73

 Clay Cliffs 81

 Total 487

 17
Dark Sky Project at Tekapo

 18
Survey invitation through survey invitation
cards
It was initially planned that survey invitations would
be made through survey cards distributed by
operators at Oamaru Blue Penguin Colony and
Dark Sky Project.

Survey briefings with operators were carried out
from December 2019 to mid-January 2020. Initially,
to avoid disruptions to business operations, survey
invitation cards were to be distributed to customers
for only eight days across the summer season over
selected sampling times and days (Appendix 2).
Experience showed that this approach was
restrictive. By the end of January, operators agreed
to distribute survey invitation cards any time they
had customers. Survey cards were distributed from January to March.

To incentivise participation, operators received bottles of wine and one lucky survey
respondent got e-gift vouchers. Despite this, there was a very low response rate from
operator-distributed survey invitation cards. Therefore, survey invitations by intercepts as
described above were carried out to complement survey invitation by cards.

 Incentives:
 Bottles of wine for accommodation A prize draw of $250 e-gift voucher at
 providers Kathmandu for respondents

 19
Fieldwork key milestones
Fieldwork commenced in January 2020 and was expected to conclude in April 2020.
However, it was discontinued on 2nd March 2020 due to COVID-19. Fieldwork key milestones
are shown in Figure 3.

Figure 3: Fieldwork key milestones

3.4 Methods of data analysis
Descriptive statistics were used to analyse the data in terms of the means and deviations,
and frequencies and percentages. For categorical data, Chi-squared tests of the hypothesis
of differences between various groups of tourists were carried out. For continuous or ordinal
data, normality tests were carried out objectively using a Shapiro-Wilk test, as well as
subjectively by observing histograms and box plot outputs in Stata and R console. T-tests
evaluated the significance of differences between group means. Where the assumption of
normality was not met, the Kolmogorov–Smirnov (K-S) test was applied instead of the t-test.
Mapping of visitors’ home origins, start and end of their Waitaki/Mackenzie visit was carried
out using a Geographic Information System (GIS). Sensitivity analysis of estimates of tourist
expenditure was carried out using Monte Carlo simulation in R console.

3.4.1 Economic attribution model
In cases where there is more than one key tourist attraction, it can be valuable to assess the
level of tourist spending that is directly attributable to specific tourist attractions.

An economic attribution model gauged the importance of each tourist attraction and the level
of spending that is attributable to it. There are limited studies in this subject area. This project
adapted the attribution model applied by Driml et al. (2011) to assess the economic
significance of National Park tourism in Queensland, Australia.

Tourist attraction associated expenditure
The approach taken here counts total expenditure by all visitors to an attraction as a start
point, which we term “tourist attraction associated expenditure”. This measure does not
gauge the impact on expenditure of the importance of an attraction to visitors (Driml et al.,
2011), which is addressed by attribution and substitution expenditure estimates (e.g.Carlsen
& Wood, 2004; Driml et al., 2011; Stoeckl, Smith, Newsome, & Lee, 2005).

 20
Attribution expenditure: This is the proportion of all direct expenditure by visitors to a
region/state/country that can be attributed to a specific attraction (Carlsen & Wood, 2004;
Jones & Wood, 2008). Typically, researchers use a range of motivational, behavioural and
importance measures from surveys to estimate the proportion of expenditure attributed
directly to a tourist attraction. For instance, Carlsen and Wood (2004) use the following
findings from the Southern Forest region in Australia to estimate attribution:
 (i) 80% of respondents reported that ‘natural environments’ were the number one reason
 for visiting the region;
 (ii) 90% of activities undertaken were nature-based;
 (iii) 95% of visitors ranked forests as ‘important’ in attracting them to the region.
They conclude that 88% (an average of the three measures) of visitor expenditure could be
attributed to the national parks and forests in the study area.

However, the concern with this approach is that while a visitor’s choice of particular tourist
activity and resulting expenditure could be highly motivated by the existence of a tourist
attraction, it does not always follow that visitors would not have undertaken some other
activity (and its associated expenditure) in that same region, in the absence of an attraction
(Carlsen & Wood, 2004). For example, in the absence of the Oamaru Blue Penguin Colony,
some visitors may still opt for alternative activities in the area and make expenditures
associated with these activities.

Substitution expenditure: Some studies have focused on identifying additional expenditure
in a region due to an attraction. That is the expenditure that would not have occurred in the
study area if the opportunity to visit an attraction did not exist. This component has been
termed the “substitution” effect (Carlsen & Wood, 2004). Substitution expenditure is identified
using information from visitors on whether they would have substituted their visit to the region
with a visit to another region, state or country if the attraction did not exist

We define and estimate variations of the attribution expenditure and substitution expenditure
effects, which we term “TA attributed” and “TA substitutable” expenditures, respectively.

 21
In this study:

TA attributed expenditure: This component of expenditure is defined as all spending by
visitors who stated that the tourist attraction at which they were invited to complete the survey
was “very important” to their travel and spending decisions. It captures expenditure that is
closely dependent on an attraction in the face of possible alternatives that visitors could
choose. We asked several questions about the significance of each attraction to visitors’
travel decisions and preferences and used this information to classify respondents as TA
attributed expenditure respondents, who met at least one of the criteria below:

 Inclusion criterion 1
 Tourists for whom an attraction was the only or main reason for visiting the Waitaki
 /Mackenzie area (Appendix 1, question 12)
 Inclusion criterion 2
 Tourists who indicated that the importance of an attraction to their trip was 70% or
 greater (Appendix 1, question 13)

TA substitutable expenditure: This is all spending by visitors who answered that they would
not have travelled to the Waitaki or Mackenzie area if the opportunity to visit a specific tourist
attraction was not available. TA substitutable expenditure is unambiguously due to the tourist
attraction, defined as that spending that would not have been made in the area if the
opportunity to visit the tourist attraction was not available. This component of expenditure is
based on a hypothetical scenario of the tourist attraction not being open to visitors at the time
of their travel to the area (Appendix 1; questions 14 and 15). Respondents in this category
stated that they would have:
 (i) Stayed at home;
 (ii) Travelled outside the Waitaki/Mackenzie area

 22
Steps used in this analysis
Our approach takes into account differences in spending by individuals in each category,
outlined below.

Step 1: Identify spend for each individual
Step 2: Identify each individual’s spending-generation category
All respondents’ fall within the TA associated expenditure category. A subset of these
respondents meet the criteria for membership of the TA attributed expenditure category.
Likewise, a subset of TA attributed tourists meet the criteria for membership of the TA
substitutable expenditure category (Figure 4).
Figure 4: Expenditure categories

 TA associated expenditure

 TA attributed
 Other
 expenditure

 TA substitutable
 Other
 expenditure

Step 3: Calculate the mean and variance of spend for relevant groups
Average TA associated expenditure is;

 �∑ =1 �
 / / = = (1)

Where, is the number of people in respondent ′ travel party (aged at least 16
years) with whom expenses were shared and is the number of tourists who provided
information on expenditures in the area.

 �∑ =1 �
 / / = = (2)

Where, includes only visitors in the TA attributed expenditure category

 23
 �∑
 =1
 �
 / / = = (3)

Where, includes only visitors in the TA substitutable expenditure category and ≤ ≤

Step 4: Aggregate over groups to find total expenditure in each category

(i) Annual estimates of TA associated expenditure
 = × (4)

Where is the annual number of visitors.

(ii) Annual estimates of TA attributed expenditure
 = × × (5)

Where is the proportion of visitors in the attributed expenditure category.

(iii)Annual estimates of TA substitutable expenditure
 = × × (6)

Where is the proportion of visitors in the TA substitutable expenditure category.

 24
Expenditure associated with tourist attractions
The interactive mapping feature (Figure 5) enabled respondents to provide detailed
information on expenditure along their travel route. Interactive maps allowed participants to
place markers of their purchases while in the Waitaki/Mackenzie area. Those on a tour
package were asked how much they paid for their package and what this package
constituted. Package tourists were also asked if they had spent any money additional to the
cost of the tour package, which they recorded on the map.

Figure 5: Expenditure in the Waitaki/Mackenzie area

 25
4 Results
4.1 Responses and data preparation
In total, 487 visitors were invited to participate in the online survey over three periods:
 • Two days from 10 -12 January (n=67)
 • Four days from 31 January – 5 February (n=133)
 • Five days from 26 February to 1 March (n=287)
Of these, 158 respondents completed the survey, a response rate of 32%. Thirty-three usable
responses came from survey cards distributed through operators and visitor centres and
through intercepts (a few respondents who did not feel comfortable giving their emails were
given a survey card instead). However, it was not possible to ascertain the response rate
from survey cards since the total number of cards distributed is unknown. Operators and
visitor centre staff were not asked to record the total number of cards distributed to their
customers to avoid overburdening them. Altogether, there were 191 usable responses from
the online survey (83% from invitations by intercepts and 17% from survey cards) (Table 2).

Table 2: Survey response
 Tourist Intercept Response Response Survey Combined response:
 attraction invitations rate cards Invitations by
 response intercepts and
 survey cards

 Oamaru Blue 97 41 42% 5 46
 Penguin
 Colony

 Dark Sky 46 6 13% 9 15
 Project

 Moeraki 190 55 29% 7 62
 Boulders

 Elephant 73 29 40% 5 34
 Rocks

 Clay Cliffs 81 27 33% 1 28

 Vanished - - - 6 6
 World Centre,
 and Kurow
 Museum and
 Information
 Centre

 Total 487 158 (83%) 32% 33 (17%) 191

 26
Overall, the response rates for the Oamaru Blue Penguin Colony, Elephant Rocks and Clay
Cliffs were within the range of 33% to 42%. The response rate was lower for Moeraki Boulders
at 29% and was lowest for the Dark Sky Project (13%).

Survey data for the two recruitment methods were combined, checked for irregularities, coded
for analysis using Microsoft Excel, and uploaded into Stata Version 14.2 and R Console for
quantitative analysis.

4.2 User profiles
The first and last sets of questions in the online survey were designed to identify attributes
of tourist attraction visitors.

Age
As shown in Figure 6, the modal age was 25-29 years (14.4%, n=24), followed by those 30-
34 years (13.8%, n=23), those aged 45-49 years, and then 65-69 years (10.2%, n=17 each).

Figure 6: Age (n=167)
 16.0
 14.4
 13.8
 14.0

 12.0
 10.2 10.2
 9.6
 10.0 9.0
 Percent

 7.8
 8.0 7.2
 6.0
 6.0 5.4

 3.6
 4.0 3.0

 2.0

 0.0
 16-19 20-24 25-29 30-34 35-39 40-44 45-49 50-54 55-59 60-64 65-69 70+
 Years

Gender and country of residence
A slightly higher percentage of males (51%, n=85) than females (49%, n=82) completed the
survey.

Thirty-nine percent of respondents were New Zealanders (n= 74) and 61% were overseas
visitors (n=117). Of the 74 New Zealand respondents, 35% (n=26) came from the North Island
and 65% (n=48) from the South Island (Figure 7). The largest numbers of respondents were
from Canterbury (31%), followed by Otago (24%) and Auckland (18%). Only 2 respondents
(1% of the total sample) lived locally, in Oamaru.

 27
Figure 7: New Zealand residents’ home locations (n=74)

 28
Out of 117 non-New Zealand respondents, 38% came from the United Kingdom (UK), 13%
from Australia and 9% from each of the United States of America (USA), Germany and
China (Figure 8).
Figure 8: Overseas residents (n=117)

Where overseas visitors started their trip in New Zealand
The largest numbers of overseas respondents started their trip from Auckland (44%, n=51)
followed by Christchurch (43%, n=50), and Queenstown (11%, n=13) (Figure 9).

Figure 9: Overseas visitors’ trip origins in New Zealand (n=117)

 50

 45 44 43

 40

 35

 30
 Percent

 25

 20

 15
 11
 10

 5 2 1
 0
 Auckland Christchurch Queenstown Dunedin Wellington

 29
4.3 Activity
Type of trip
About 82% (n=157) of respondents were on overnight trips. Only 108 respondents provided
information on where they spent their nights in the area.

Nights spent in the area
Domestic visitors spent an average of 1.9 nights in Waitaki District and 2.6 nights in
Mackenzie District. Whereas, overseas visitors spent an average of 1.7 nights in Waitaki
District and 1.9 nights in Mackenzie District. Overall, more nights were spent in Mackenzie
District, with an average of 2.1 nights compared to 1.8 nights in Waitaki District.

Trip purpose
Most respondents indicated that the reason for their visit to the area was for holiday/leisure
(n=58 for New Zealand residents and n=108 for overseas visitors) (Figure 10).
Figure 10: Reasons for a visit to the Waitaki/Mackenzie area
 120
 108

 100
 Number of respondents

 80

 58
 60

 40

 20
 6 4 6 4 4
 0
 0
 New Zealand Overseas

 Holiday/leisure Visiting friends/relations Business Other

Reason for a visit to selected tourist attractions
The largest numbers of respondents indicated that the visit to attractions where they were
intercepted was just something they were doing (45%, n=86), or was one reason for their visit
(30%, n= 58). Very few said the attraction was the main reason for their visit (13%, n=24)
(Figure 11).

 30
Figure 11: Importance of visit to the attraction (n=191)
 50%
 45%
 45%
 Percentage of respondents

 40%

 35%
 30%
 30%

 25%

 20%

 15% 13%

 10% 6% 6%
 5%

 0%
 ONLY reason MAIN reason ONE of the JUST something OTHER reasons
 reasons I was doing

Figure 12 shows the importance of each tourist attraction to the visit. “Just something I was
doing” was by far the most stated reason for respondents’ visits to Elephant Rocks (68%),
Clay Cliffs (82%) and Moeraki Boulders (42%). This was followed by “one of the reasons” for
Oamaru Blue Penguin Colony (37%) and Moeraki Boulders (35%). Altogether, the visit was
the “ONLY or MAIN reason” for 39%, of respondents at Oamaru Blue Penguin Colony, 33%
at Dark Sky Project, 9% at Elephant Rocks, no-one at Clay Cliffs, and 15% at Moeraki
Boulders.

Figure 12: Intercept site role in visit (n=191)

 90%
 80%
 Percentage of respondents

 70%
 60%
 50%
 40%
 30%
 20%
 10%
 0%
 Oamaru
 Blue Dark Sky Elephant Moeraki Visitor
 Clay Cliffs
 Penguin Project Rocks Boulders centres
 Colony
 ONLY reason 11% 0% 3% 0% 10% 0%
 MAIN reason 28% 33% 6% 0% 5% 17%
 ONE of the reasons 37% 33% 18% 18% 35% 50%
 JUST something I was doing 15% 33% 68% 82% 42% 33%
 OTHER reasons 9% 0% 6% 0% 8% 0%
 Number of respondents 46 15 34 28 62 6

 31
Importance of visit to selected tourist attractions to the trip to the area
The importance of the Oamaru Blue Penguin Colony for making the trip was rated 90% -
100% by 39% of respondents. The other attractions were not very highly rated. Altogether,
the importance of visit was rated at least 50% of the reason for the visit by 65% of respondents
at the Oamaru Blue Penguin Colony, 67% at the Dark Sky Project, 42% at Elephant Rocks,
29% at Clay Cliffs, and 50% at Moeraki Boulders (Figure 13).

Figure 13: The importance of tourist attraction to overall visit in the area (n=191)

 70%
 Percentage of respondents

 60%
 50%
 40%
 30%
 20%
 10%
 0%
 Oamaru
 Blue Dark Sky Elephant Moeraki Visitor
 Clay Cliffs
 Penguin Project Rocks Boulders centres
 Colony
 Less than 10% 4% 0% 15% 18% 19% 17%
 10% up to < 50% 30% 33% 44% 54% 31% 17%
 50% up to
The most popular commercial activities were winery visits, Sir Edmund Hillary Alpine Centre
and the Dark Sky Project (Table 3). The numbers are not additive since some respondents
were involved in more than one activity.
Table 3: Commercial activities
 Commercial activities Number of respondents

 Winery visit 19
 Sir Edmund Hillary Alpine Centre 15
 Dark Sky (Lake Tekapo) 14
 Glacier Explorers 13
 Big Sky Stargazing (Aoraki/Mt Cook) 11
 Scenic flight (e.g., fixed wing, helicopter, glider) 10
 Hot Tubs Omarama 7
 Heli-hike 3
 N/A 71

Steampunk HQ and the Aoraki / Mt Cook DOC Visitor Centre were the most popular cultural
or historic sites, followed by Vanished World Centre (Table 4).
Table 4: Cultural or historic sites
 Cultural or historic sites Number of respondents
 Steampunk HQ 45
 Aoraki / Mt Cook DOC Visitor Centre 44
 Vanished World Centre 19
 Kurow Museum and Information Centre 3
 Benmore Visitor Centre 1
 N/A 55

The most visited leisure and recreation site or activity were walking tracks, which received
almost twice as many visits as Moeraki Boulders (Table 5). The Oamaru Blue Penguin Colony
was the third most popular, followed by swimming.

Table 5: Leisure and recreation sites or activities
 Leisure and recreation sites or activities Number of respondents
 Walking tracks 94
 Moeraki Boulders 49
 Oamaru Blue Penguin Colony 41
 Swimming 36
 Elephant Rocks 19
 Clay Cliffs 19
 Fishing 10
 A2O Cycle Trail 9
 Quailburn Historic Woolshed 5
 N/A 8

 33
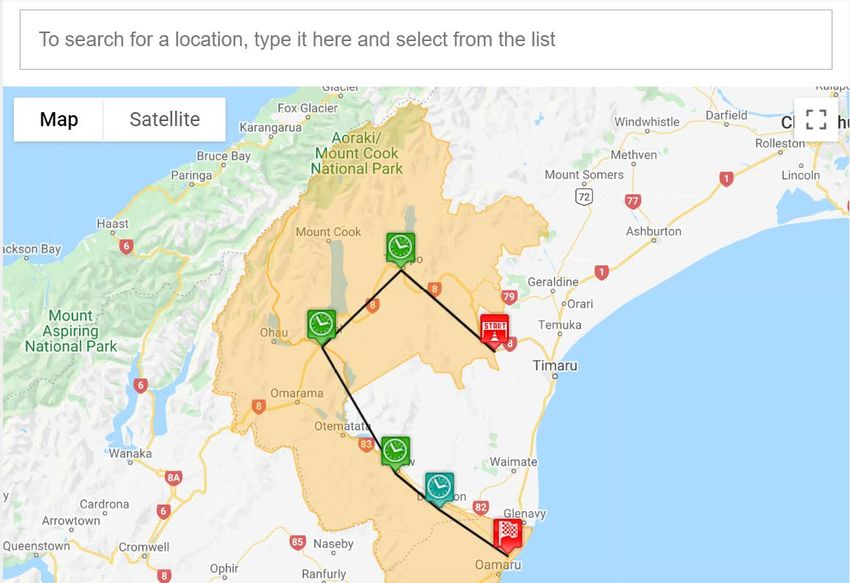
4.4 Travel route in Waitaki/Mackenzie area
Respondents were asked to provide detailed information about their travel while in the
Waitaki/Mackenzie area using the interactive mapping features (Appendix 1, question 9).
Information collected included where they entered the area, where they stopped for at least
10 minutes and where they planned to exit the area.

Starting and finishing points in the Waitaki/Mackenzie area
In all, 162 respondents provided latitude/longitude information on where they started and
finished their trip in the Waitaki/Mackenzie area. Of these, 66 were domestic and 96 were
overseas visitors. Table 6 shows visitors’ starting and finishing points for the
Waitaki/Mackenzie area. Some “starting” and “finishing” points are excluded because they
were placed outside the study area. The largest number of respondents indicated starting
their trip in the Waitaki/Mackenzie districts through Fairlie, followed by Palmerston and
Oamaru. Fairlie and Palmerston were the most common finishing points.

Table 6: Starting and finishing points into Waitaki/Mackenzie districts
 Starting points Finishing points
 Area Domestic Overseas Total Domestic Overseas Total
 Oamaru 14 (23%) 18 (23%) 32 (23%) 16 (28%) 18 (23%) 34 (25%)
 Palmerston 16 (26%) 23 (29%) 39 (28%) 12 (21%) 25 (31%) 37 (27%)
 Fairlie 20 (33%) 27 (34%) 47 (34%) 17 (29%) 20 (25%) 37 (27%)
 Omarama 7 (11%) 11 (14%) 18 (13%) 7 (12%) 16 (20%) 23 (17%)
 Other 4 (7%) 0 (0%) 4 (3%) 6 (10%) 1 (1%) 7 (5%)
 Total 61 (100%) 79 (100%) 140 (100%) 58 (100%) 80 (100%) 138 (100%)

 34
4.5 Logistics
Support from tour operators
One hundred and eighty-six (186) respondents provided information on their
Waitaki/Mackenzie travel logistics, of whom 90% (n=167) were independent travellers and
10% (n=19) were on a package holiday.

Type of accommodation
The type of accommodation used most frequently was hotel/motel/serviced apartment
(Figure 14). Self-supported (e.g. caravan, freedom camping vehicle) and rented
house/apartment/flat or unit were also common. Respondents frequently used multiple types
of accommodation, so these responses are not additive

Figure 14: Type of accommodation (n=186)
 80

 69
 70

 60
 53

 50
 Number of respondents

 42
 40

 30
 21
 20

 10
 4

 0
 Hotel, motel, Rented house, Non-commercial Self-supported e.g. Other
 serviced apartment, flat or e.g. own holiday caravan or
 apartment unit and family/friend freedom camping
 property vehicle

 35
Travel party
The average party size was 2.9 people, with 62% of New Zealand residents (n=71) travelling
in a group of two or more people, compared to 43% for overseas residents (n=115). Overall,
the proportion of respondents travelling alone is higher than expected. This could be due to
people travelling alone being more likely to complete the survey than those travelling as a
group.

4.6 Expenditure attributable to tourist attractions
Only 118 respondents provided data on their expenditures (Table 7). Of these, 49 were New
Zealand residents and 69 were overseas residents. Out of 19 visitors who were on a
packaged holiday, 15 provided information on how much they paid for their tour package and
eight provided information on additional money they spent while in Waitaki and Mackenzie
districts. Only expenditure additional to the tour package is included in the estimates in Tables
7-10. As defined in equations 1-3, expenditures are per-person. Due to small sample sizes,
it was not possible to estimate the average per-person expenditure for each tourist attraction.

TA associated expenditure for Waitaki and Mackenzie districts
Table 7 shows the average TA associated expenditure per visitor per visit for Waitaki and
Mackenzie districts combined.
Table 7: Average TA associated expenditure/visitor/visit (NZ$)
 Expenditure Respondents Number of Average Std. Dev. 95% Conf.
 category respondents expenditure/ Interval (CI) for
 visitor/visit (NZ$) the mean
 Accommodation New Zealand 26 $325 $285 [$209 $440]
 Overseas 55 $323 $411 [$212 $435]
 All respondents 81 $324 $373 [$241 $406]
 Cafés/restaurants/ New Zealand 37 $178 $356 [$59 $297]
 bars/takeaways
 Overseas 44 $132 $142 [$89 $176]
 All respondents 81 $153 $261 [$95 $211]
 Groceries All respondents 49 $75 $70 [$54 $95]
 Non-food related All respondents 24 $105 $151 [$39 $170]
 shopping
 Fuel All respondents 45 $91 $48 [$77 $106]
 Activities All respondents 43 $137 $222 [$69 $205]
 Total expenditure New Zealand 49 $454 $514 [$306 $602]
 Overseas 69 $486 $603 [$341 $631]
 All respondents 118 $464 $550 [$363 $564]

There are no significant differences between New Zealand and overseas residents in mean
expenditure on accommodation, food and drink, and total spending.

 36
TA attributed and TA substitutable expenditures
Out of 118 respondents who provided expenditure data, 42 (36%) were in the TA attributed
expenditure category and fourteen (11%) were in the TA substitutable expenditure category
(Table 8).

Table 8: TA attributed expenditure: Waitaki and Mackenzie Districts combined
 Expenditure Number of Average Std. Dev. 95% CI
 category respondents expenditure/
 visitor/visit (NZ$)
 TA associated 118 (100%) $464 $550 [$363 $564]
 TA attributed 42 (36%) $542 $471 [$395 $689]
 TA substitutable 14 (11%) Insufficient data

Average TA attributed expenditure is very similar to average TA associated expenditure. The
differences in expenditure are not statistically significant. It was not meaningful to estimate
TA substitutable expenditure because of the very small sample size. Only 36% of visitors
were members of the TA attributed expenditure category, implying that no single tourist
attraction was a critical drawcard for most visitors.

TA associated expenditure for each district
Average TA associated expenditure per visitor per visit is $299 for Waitaki District and $444
for Mackenzie District (Table 9). Each sub-sample passed a normality test, so means were
compared with a t-test. The difference in means is not statistically significant (p=0.0544). The
total number of respondents is greater than 118 because some respondents made
expenditures in both districts. Due to small sample sizes and potential sample biases, these
levels of expenditure are indicative only.

Table 9: Average expenditure/visitor/visit (NZ$)
 District Number of Average Std. 95% CI
 respondents expenditure/visitor/visit Dev.
 (NZ$)
 Waitaki 88 $299 $370 [$220 $377]
 Mackenzie 64 $444 $508 [$317 $571]
 Difference -$145 [-$293 $3]

 37
TA associated expenditure for each district by expenditure category
There are some differences in expenditure patterns between the two districts. In both districts,
accommodation is the major expenditure item. For the Mackenzie District, this is followed by
cafes/restaurants. Whereas, in the Waitaki District, expenditure on activities is second (Table
10). The average expenditure on accommodation and cafes/restaurants is higher in
Mackenzie District. However, the average expenditure on groceries, non-food related
shopping, fuel and activities is higher in Waitaki District. On the other hand, the overlapping
confidence intervals suggest the differences in expenditures between the two districts are not
significant across all categories. Comparison of expenditure categories within each district
shows that for the Waitaki District, expenditure on accommodation is not significantly more
than for activities or for non-food shopping, but significantly higher than expenditure on
cafes/restaurants, groceries and fuel. In the Mackenzie District, expenditure on
accommodation is not significantly more than at cafes/restaurants but is significantly higher
than expenditure on groceries, non-food shopping, fuel and activities.

 38
Table 10: Average expenditure per category
 Waitaki District Mackenzie District
 Expenditure Number of Average Std. Dev. 95% CI Number of Average Std. Dev. 95% CI
 category respondents expenditure/ respondents expenditure/
 visitor/visit visitor/visit
 Accommodation 49 $211 $183 $158 $263 47 $338 $444 $208 $469
 Cafés/restaurants/ 54 $109 $133 $72 $145 40 $164 $332 $58 $270
 bars/takeaways
 Groceries 22 $74 $71 $43 $106 30 $67 $56 $47 $88
 Non-food related 15 $124 $184 $22 $225 8 $69 $50 $27 $111
 shopping
 Fuel 31 $89 $56 $68 $110 16 $84 $27 $70 $99
 Activities 28 $138 $213 $55 $220 17 $120 $119 $58 $181

 39
Figure 15 illustrates where expenditures were made.

Figure 15: Heat maps of expenditure locations by category

In the Waitaki District, Oamaru was the most common location for all expenditure categories.
Omarama came second for fuel and to a lesser extent on activities and at cafes/restaurants.
In the Mackenzie District, Tekapo dominated across all expenditure categories, followed by
Twizel, for groceries and fuel, and to a lesser extent cafes/restaurants. There was very little
expenditure reported in the Waitaki valley between Oamaru and Omarama.

 40
5 Conclusions and recommendation
The main objective of this research was to describe visitors’ use and estimate spending
attributable to Waitaki Whitestone Geopark, Oamaru Blue Penguin Colony and Dark Sky
Project and their economic significance to the local economies. COVID-19 halted data
collection, resulting in sparse data.

Results suggest that visitors make a substantial contribution to the local economy, but the
closure of individual attractions would have relatively minor impacts on spending in the study
area. If any individual attraction closed, most respondents would still visit the
Waitaki/Mackenzie area. However, potential changes in time spent in the area and resultant
spending changes were not investigated.

Economic attribution model results are extremely tentative due to limited expenditure data
and non-representativeness in the sample. More comprehensive sampling would enrich
economic attribution model results, enabling the application of input-output (I-O) models to
identify the economic significance of each tourist attraction to the local economies in terms of
value added and employment. Cost-benefit analysis could compare benefits to local costs
(e.g. maintenance costs) to assess whether public sector investments in tourist attractions
generate a net benefit to local economies.

Future research would benefit from adopting a sampling scheme that (1) ensures adequate
representative responses from each group, and (2) allows identification of the proportions of
users in each group.

Our results support further investigation of visitors’ spending that is attributable to different
tourist attractions. Efficient public sector investments in tourist attractions require good data
on where the costs and benefits arise and fall. Our study provides a useful start to this
investigation. This kind of research would help in generating new knowledge for guiding
councils and central government in identifying the right mix of tourist projects and initiatives
to promote, support and invest in. It would also help to identify interventions that could
facilitate broader private sector investment in tourist attraction.

 41
References
Carlsen, J., & Wood, D. (2004). Assessment of the Economic Value of Recreation and
 Tourism in Western Australia's National Parks, Marine Parks and Forests.
Driml, S., Brown, R., Ballantyne, R., Pegg, S., & Scott, N. (2011). A Method for Estimating
 the State-Wide Economic Significance of National Park Tourism: The Case of
 Queensland. Tourism Analysis, 16(3), 243-257. Retrieved from
 https://doi.org/10.3727/108354211X13110944386960.
 doi:10.3727/108354211X13110944386960
International Dark-Sky Association. (2017). Dark Sky Places Program Annual Report
 OCTOBER 2017. Aoraki Mackenzie International Dark Sky Reserve 2016-2017
 Report. Retrieved from https://www.darksky.org/wp-
 content/uploads/2015/01/AorakiMackenzie-IDSR-2017-Annual-Report.pdf
Jones, T., & Wood, D. (2008). Research Note: Attribution, Substitution and Confusion in
 Wildlife and Natural Area Tourism Expenditure Research. Tourism Economics, 14(2),
 431-434. Retrieved from https://doi.org/10.5367/000000008784460364.
 doi:10.5367/000000008784460364
MBIE. (2020). Annual tourism spend grouped by TA, region, country of origin and product
 category. Retrieved from https://www.mbie.govt.nz/immigration-and-tourism/tourism-
 research-and-data/tourism-data-releases/monthly-regional-tourism-estimates/latest-
 update/annual-tourism-spend-grouped-by-ta-region-country-of-origin-and-product-
 category/
Mkwara, L., Simmons, D., & Kerr, G. (2020). Alps 2 Ocean Cycle Trail Visitor Survey 2020.
 Land Environment & People Research Report series [Forthcoming].
Morton, S. M., Bandara, D. K., Robinson, E. M., & Carr, P. E. A. (2012). In the 21st century,
 what is an acceptable response rate? Australian and New Zealand journal of public
 health, 36(2), 106-108.
Ngāi Tahu Tourism. (2020). Ngāi Tahu Tourism 2020. Retrieved from
 https://www.darkskyproject.co.nz/learn/our-
 story/#:~:text=Founded%20in%202004%20by%20Takap%C5%8D,range%20of%20
 exclusive%20stargazing%20experiences
Nulty, D. D. (2008). The adequacy of response rates to online and paper surveys: what can
 be done? Assessment & evaluation in higher education, 33(3), 301-314.
NZTE. (2019). Invest in New Zealand's Tourism Sector. Retrieved from
 https://www.nzte.govt.nz/about/news/resources/invest-in-nz-tourism
Stoeckl, N., Smith, A., Newsome, D., & Lee, D. (2005). Regional economic dependence on
 iconic wildlife tourism: Case studies of Monkey Mia and Hervey Bay. Journal of
 Tourism Studies, 16, 69-81.
Taylor, N., Mackay, M., Johnston, K., & Perkins, H. (2019). Regeneration in the town of
 Oamaru. Special session at the Regional Studies Association Conference,
 Christchurch, February 2019. Retrieved from
 https://www.buildingbetter.nz/news/2019/SRA3_The_regeneration_of_Oamaru.html
Waitaki District Council. (2018). The Waitaki Whitestone Geopark - UNESCO Expression of
 Interest Application 2018.

 42
Appendix 1: Waitaki/Mackenzie
Questionnaire
Research Information Sheet
Lincoln University,
Faculty of Environment, Society and Design

Waitaki/Mackenzie Visitor/Tourist Attractions Survey 2020

Welcome to the Waitaki/Mackenzie tourist attraction survey. The aim of this survey is to find
out how visitors or tourists utilize different attractions in the region.

This research is being undertaken by Dr Lena Mkwara. It is funded by Lincoln University
Centre of Excellence, Sustainable Tourism for Regions Landscapes and Communities.

This survey will focus on your travel in the region. You will be asked some questions
regarding your travel and spending in the region, your visits to attractions and yourself. The
results of this survey may be used to inform management of tourist attractions in the region
and elsewhere in New Zealand. The results may also directly contribute to the preparation of
future funding proposals.

The results of this survey may be published in journals and conference papers. However,
you may be assured of your anonymity in this investigation. There is no connection between
the email addresses and the survey responses.

This survey will take approximately 10-15 minutes.

This project has been approved by the Lincoln University Human Ethics Committee. If you
have any questions about your participation in this survey, please feel free to contact us.
Your assistance in participating in this survey is greatly appreciated.

Thank you.

Researcher:
Dr Lena Mkwara,
Postdoctoral Fellow,
Lena.Mkwara@lincoln.ac.nz
Ph 03 4230504

Head of Centre:
Prof. David Simmons,
David.Simmons@lincoln.ac.nz
Ph 03 4230498

 43
You can also read