DOCUMENTS Does the Brazilian soybean production increase pose a threat on the Amazon rainforest?
←
→
Page content transcription
If your browser does not render page correctly, please read the page content below
ISSN 2176-2937
                                             July/2019
DOCUMENTS
    414

Does the Brazilian soybean production increase
   pose a threat on the Amazon rainforest?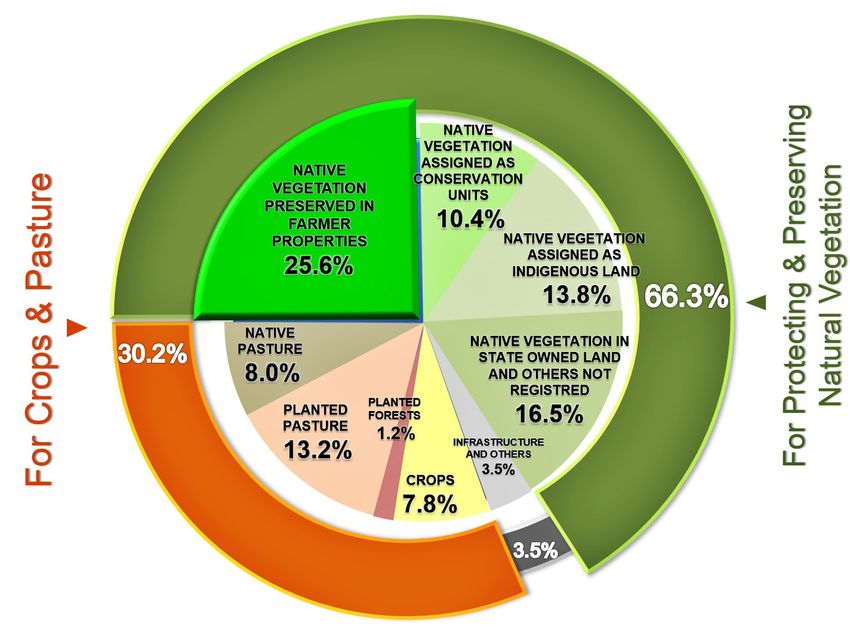
ISSN 2176-2937
                                                                   July/2019

            Brazilian Agricultural Research Coporation
                         Embrapa Soybean
        Ministry of Agriculture, Livestock and Food Supply

                     DOCUMENTS 414

Does the Brazilian soybean production increase
   pose a threat on the Amazon rainforest?

                       Decio Luiz Gazzoni
                     Alexandre José Cattelan
                     Marco Antonio Nogueira

                       Embrapa Soybean
                       Londrina, PR, Brazil
                              2019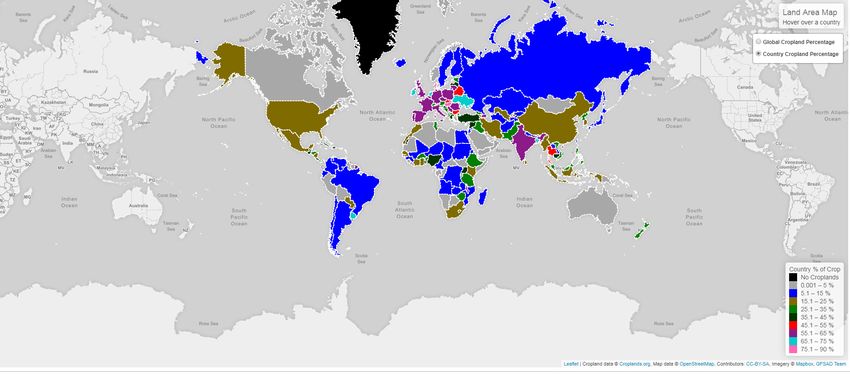
Copies of this publication can be adquired at:      Local Committee of Publication

                           Embrapa Soja             President: Ricardo Vilela Abdelnoor
              Rod. Carlos João Strass, s/n          Executive Secretary: Regina Maria Villas Bôas
                  Acesso Orlando Amaral             de Campos Leite
                         Caixa Postal 231
                          CEP 86001-970             Members: Alvadi Antonio Balbinot Junior,
                         Distrito da Warta          Claudine Dinali Santos Seixas, José Marcos
                             Londrina, PR           Gontijo Mandarino, Fernando Augusto Henning,
                    www.embrapa.br/soja             Liliane Márcia Hertz Henning, Maria Cristina
          www.embrapa.br/fale-conosco/sac           Neves de Oliveira, Norman Neumaier and Vera
                                                    de Toledo Benassi.

                                                    Editorial supervision: Vanessa Fuzinatto
                                                    Dall´Agnol

                                                    Bibliografic standardization: Ademir Benedito
                                                    Alves de Lima

                                                    Desktop publishing: Vanessa Fuzinatto
                                                    Dall´Agnol

                                                    Cover photography: Decio Luiz Gazzoni

                                                    1st edition
                                                    Digitalized PDF (2019).

                                   All rights reserved
             Unauthorized reproduction of this publication, or any part of it,
                 constitutes a copyright infringement (Law 9,610/98).
                 International Cataloging in Publication (CIP) Data
                                 Embrapa Soybean

   Gazzoni, Décio Luiz
       Does the Brazilian soybean production increase pose a threat on the Amazon
   rainforest? / Décio Luiz Gazzoni, Alexandre José Cattelan, Marco Antonio Noguei-
   ra. – Londrina: Embrapa Soybean, 2019.
        PDF (31 p.) : il. (Documents / Embrapa Soja, ISSN : 2176-2937 ; n. 414).

        1.Soja-Produção. 2.Cattelan, Alexandre José. 3.Nogueira, Marco Antonio.
   4.Título. I.Série.

                                                           CDD: 633.34 (21.ed.)

   Ademir Benedito Alves de Lima (CRB 9/530 )		                ©
                                                                   Embrapa, 2019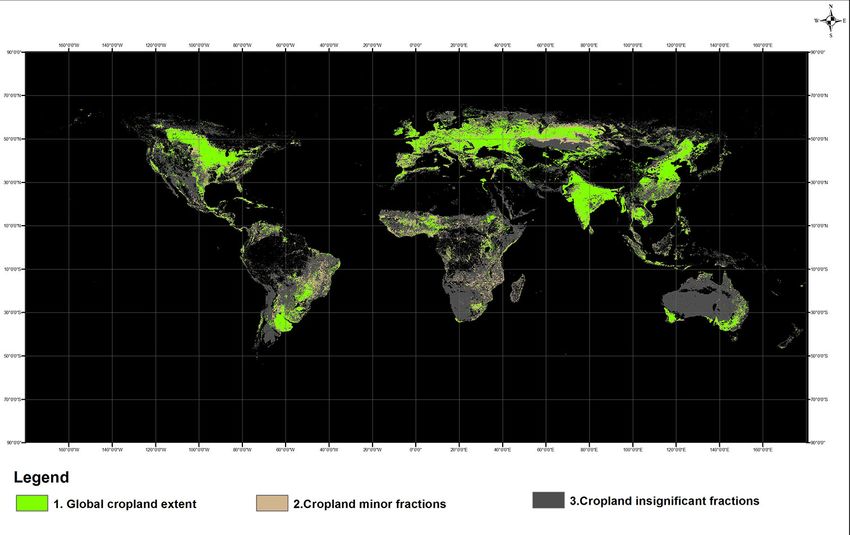
Authors
Decio Luiz Gazzoni
Agronomist, M.Sc. in Entomology, Researcher at
Embrapa Soybean, Londrina, PR, Brazil

Alexandre José Cattelan
Agronomist, Ph.D. in Agronomy, Researcher at
Embrapa Soybean, Londrina, PR, Brazil

Marco Antonio Nogueira
Agronomist, Dr. in Soil and Plant Nutrition, Researcher at
Embrapa Soybean, Londrina, PR, Brazil
Presentation
The mission of Embrapa has a unique commitment, which is the technological
development strongly linked to sustainable solutions. This vision has been
a constant throughout its 46 years of existence, reflecting a position of the
Government, a yearning of the society and a posture of the Brazilian farmers.
Sustainability implies better agricultural practices, more environmentally frien-
dly, with respect to the condition of the workers in agriculture, and that allow
the adequate return to the farmer’s investments. This vision applies to all cul-
tures, husbandry and regions where Embrapa operates.

Nevertheless, due to the extension of the area currently occupied - about 36
million hectares - and to the perspectives of strong demand in the coming
decades, soybean production is the most challenging, requiring increasing
attention not only from Embrapa, but also from all public and private sectors,
involved with Brazilian agriculture.

At the United Nations Conference on Sustainable Development (Rio+20),
held in Rio de Janeiro, Brazil (June 2012), Member States adopted the outco-
me document “The Future We Want”. As a result, it was decided, among other
resolutions, to launch a process to develop a set of Sustainable Development
Goals (SDGs) to build upon the Millennium Development Goals (MDGs) and
to establish the UN High-Level Political Forum on Sustainable Development.

Brazil is fully aware of its commitment to the UN’s 17 SDGs, reflected in public
policies and attitudes aimed at eliminating illegal deforestation and drastically
reducing greenhouse gas emissions. To do so, Brazil has the most severe
forestry legislation in the world, imposing restrictions on land use change that
have no parallel in other countries. For this reason, Brazil uses only 7.8% of
its territory for agriculture, preserving almost nine times more area. Embrapa
demonstrated that Brazilian growers preserve inside their properties, at their
own costs and responsibilities, 25.6% of the Brazilian territory, which is far
superior to most other countries.
This publication has the specific objective of demonstrating that there is no
risk of the Amazon forest being threatened by deforestation as a consequence
to the need of expand soybean production in Brazil, either due to short-term
circumstances - such as the tariff war between the United States of America
and China - or by market factors as long-term demand. This is because all
sectors involved with the soybean production chain in Brazil, public or private,
have a clear agenda that foresees the sustainable advancement of soybean
production in Brazil. This advance will occur primarily in anthropic areas, es-
pecially those currently occupied by pastures – liberated by the continuous
improving of the zootechnical parameters -, and by the increase of soybean
productivity. Definitively, Brazil will not admit illegal deforestation in any biome,
for occupation by agricultural activities.

                           José Renato Bouças Farias
                         Head General, Embrapa Soybean
Table of Contents
Introduction...................................................................................................... 9
Restrictions for soybean cropping in the Amazon Biome.............................. 10
Markets always seek equilibrium................................................................... 11
The soybean market is now adapting to the tariff war................................... 13
Worldwide agricultural area........................................................................... 15
Sustainable agriculture in Brazil.................................................................... 18
Sustainable agriculture in numbers............................................................... 21
Brazilian agriculture and reduced GHG emissions........................................ 24
Biological nitrogen fixation........................................................................ 25
No-tillage.................................................................................................. 25
Reduction of pesticide use....................................................................... 26
Conclusions................................................................................................... 27
References.................................................................................................... 279
Introduction
Many articles in the international press and even scientific papers have ques-
tioned the sustainability of the soybean production in Brazil. Many infer that the
increase in production is directly proportional to the increase in the Amazon
rainforest deforestation. One example of this is the comment “Why the US–
China trade war spells disaster for the Amazon” (Fuchs et al., 2019) published
in the online edition of Nature (March 27, 2019). The authors concluded that
“Governments, producers, regulators and consumers must act now. If they
don’t, the Amazon rainforest could become the greatest casualty of the US-
China trade war.” The present article seeks to shed light on this discussion by
bringing consistent data on the subject.
In order to contextualize the US-China tariff war scenario, the following consi-
derations must be taken into account:
• Analysts agree that impacts on the soybean market should take June
2018 as the base line, when the new tariffs and rules turned into effect.
• The peak on US soybean exports to China occurred on the 2016/17 sea-
son, consisting of 36 million metric t (Mt) (United States, 2019a).
• During the 2019 season, to end in next September, the US still exported
10 Mt (United States, 2019a).
• Considering the worst case (no more soybeans exported from US to
China along this season), the discussion will restrict to less than 26 Mt,
as China is reducing its soybean import for several reasons (not because
the tariff war).
• The 26 Mt of soybeans exported represents roughly 7% of the global
production in the last season (United States, 2019a).
• This amount of soybean would demand ca. 7.5 Mha, considering the
Brazilian yield in 2018/19 season (Conab, 2019a).
• For comparative purposes, the Brazilian Amazon covers more than
4,196 Mha (Brasil, 2019).10 DOCUMENTS 414 In this article, we discuss the impact of the so-called “US-China tariff war” on the international soybean market and other similar allegations that soybean production in Brazil is not sustainable, and present several reasons why the soybean production will not affect the Amazon Forest, as the country has been prepared to continue increasing its production (not depending on short range intercurrences like the tariff war), based on sound sustainable production sys- tems, regulations and processes. Restrictions for soybean cropping in the Amazon Biome The Brazilian legislation that regulates the private land use and conversion is called Código Florestal (Forest Code), consubstantiated on the Federal Law 12.651, issued by the National Congress on May 25, 2012. According to the Law, a private land owner can not use more than 20% of its property in the Amazon Biome, for agricultural or other objective, not considering the Permanent Preservation Areas (riverbanks or any water course, hillsides or mountain tops, wetlands, etc.). For example, a property with total area of 100 ha, where 20 ha constitute Permanent Preservation Area, can only use 16 ha (20% of the remaining 80 ha) for any land use. The rest of the property should be kept with native vegetation under the penalties of the law. According to the Brazilian law (the strictest in the world according to Chiavari; Lopes, 2019) it is perfectly legal to deforestate those 16 ha. To demonstrate their commitment with the preservation of the Amazon Biome, private sector traders set even more restrictive standards, not even accepting deforestation legally allowed by the Brazilian law. That is specifically the case of the Soybean Moratorium, a private initiative created in 2006, sponsored by the Brazilian Association of Vegetable Oil Industries (ABIOVE) and the National Association of Cereal Exporters (ANEC), which together account for the commercialization of more than 90% of the soybean produced in Brazil. The initiative has pledged not to buy or finance soybean crops established in the Amazon Biome after 2008. Nearly 100% of the Brazilian soybean produced in the Amazon Biome is being monitored by this initiative. The surveillance is aided by the National Institute of Space Research (INPE), which through periodic satellite images can iden-
Does the Brazilian soybean production increase pose a threat on the Amazon rainforest?   11

tify soybean farms with more than 25 ha that violate the Moratorium (Kastens
et al., 2017).

As a result of the Soybean Moratorium, during the last 11 years, soy plan-
tations that do not comply with the Moratorium directives were identified on
just 64,316 ha illegally deforested between 2009 and 2017, which represent
roughly 0.17% of the Brazilian soybean area. Growers that cultivate those 64
kha face tremendous problems for buying inputs and selling their production,
as none of the traditional traders accept the soybean that do not comply with
the Soy Moratorium (Abiove, 2019).

Considering the 26 Mt of soybean impacted by the US-China tariff war in the
global market, and the unlikely use of 0.18% of the Amazon Biome for its
additional cultivation, this is not a concrete fact inducing a surge of tropical
deforestation as a result of the demand being placed on the major suppliers to
eventually substitute US soybean exports to China.

Other fundaments supporting this affirmative are based on market mecha-
nisms and logics, soybean historical data and, specially, on how Brazil and
the soybean growers will approach the projected future demand on soybean
products - and this does not mean only China´s demand or substitution of
suppliers.

Brazil has projected the scenarios of the international soybean market for the
next decades and how to approach it in a sustainable way (Gazzoni; Dall’Agnol,
2018). Cultivating soybean in the Amazon Biome is out of all considered sce-
neries, due not only to environmental concerns and legal restrictions, but also
for economics, logistics, practical, technical and financial reasons.

Markets always seek equilibrium
Natural market rules point to equilibrium and rationality. Some imbalances
might occur on the short range – as is the case of the present dispute for tariffs
and quotas. Focusing on the medium and long range, the market is always
seeking to fine-tune the balance between demand and supply. One indicator
of this equilibrium is the relationship between ending stocks and production.
If the stocks go down, demand is greater than supply; the reverse is true if
stocks are up. Table 1 shows that the proportion of ending stocks over total
12                                                                     DOCUMENTS 414

production has increased along the previous seasons, but remained almost
stable between 2017/18 and 2018/19 seasons. These figures indicate a sta-
ble or demand-excess market, even after the new Chinese tariffs on the US
soybean exports were applied.

Table 1. Global soybean production, ending stocks and proportion of ending stocks
over production.

 Factor                  Unit    2014/15   2015/16   2016/17   2017/18     2018/19
 Production (A)           Mt      321       317       349       340          361
 Stocks (B)               Mt       79        80        96        99          107
 B/A                      %       24.6      25.2      27.5      29.1        29.6
Source: United States (2019a).

Stocks may go up or down due to short range or structural reasons, which are
clarified and screened by market mechanisms and afterwards transmitted to
the prices. This is the primary sign for growers: prices up stimulate production;
inversely, prices down inhibit it.

It is important to identify if a price sign is anchored on conjunctural or
structural reasons. In this last case, the sign sent to the growers is a trend
indicating a long range new production ceiling. In the case of short-range un-
balance – as in the China x US dispute – there are other market mechanisms
to solve it and rearrange the trade of a given commodity. That is why Figure
1 shows positive premiums for Argentinian and Brazilian soybeans com-
pared with the US, but restricted from June to November 2018. It must be
considered that higher tariffs were imposed in June (identified by the arrow
on Figure 1), but by November the market absorbed the fact and went back
to normal relative prices.

For short range, limited unbalances, the main market adjustment mechanism
is a redistribution of the network between suppliers and consuming countries.
If a given country decides not to import from one of its traditional suppliers,
then it will look for substitute supplier(s) – given that not only bilateral, blocks
and multilateral treaties but also the World Trade Organization rules have
to be observed. In the case of establishment of new trade contracts, these
suppliers, at first, will not increase its production (because the sign does not
Does the Brazilian soybean production increase pose a threat on the Amazon rainforest?           13

involve a new demand plateau by itself); they will only rearrange its export
fluxes. In the end, new trade fluxes will be established, with a rearrangement
between exporting and importing countries.

                             440    Argentina (Up River)    Brazil (Paranagua)           US (Gulf)
Soybean prices (US$ / ton)

                             420

                             400

                             380

                             360

                             340

                             320

                             300
                                     3/1/2018

                                     4/4/2018

                                     5/8/2018

                                     9/3/2018

                                     3/5/2019
                                   10/23/2018

                                   11/26/2018
                                   12/12/2018
                                   12/28/2018
                                    3/19/2018

                                    4/20/2018

                                    5/24/2018
                                    6/11/2018
                                    6/27/2018
                                    7/13/2018
                                    7/31/2018
                                    8/16/2018

                                    9/19/2018
                                    10/5/2018

                                    11/8/2018

                                    1/15/2019
                                    1/31/2019
                                    2/18/2019
Figure 1. Soybean export prices.
Source: United States (2019a).

The soybean market is now
adapting to the tariff war
The signs that the soybean international market is seeking for accommo-
dation to overcome an eventual prolonged China x US tariff war are getting
clearer. Above all, the US will never reduce its soybean production in the
same amount of frustrated exports to China that could lead to an equivalent
increase in the production by other countries. Instead, the US will maintain its
soybean production with sound financial government support (United States,
2019b) and look for other partners, like expanding its exports to the European
Union, the second largest global soybean importer. If Brazil is to redirect its
exports to China, a market opportunity opens with EU, quickly captured by the
US, as demonstrated in Figure 2.
14 DOCUMENTS 414
10
9
8
Million t
7
6
5
4
9/30/2017
1/31/2018
5/31/2018
8/31/2017
10/31/2017
11/30/2017
12/31/2017
2/28/2018
3/31/2018
4/30/2018
6/30/2018
7/31/2018
8/31/2018
9/30/2018
10/31/2018
11/30/2018
12/31/2018
1/31/2019
2/28/2019
3/31/2019
Figure 2. 12-month moving-total of US soybean exports to the European Union.
Source: United States (2019a).
Secondly, China is reducing its soybean imports, for several reasons, but
specially because the country is facing a reduction in its pig production due
to sanitary reasons. Pig production is one of the major drivers for Chinese
soybean imports. Less pork meat production in China is leading to larger
imports of pork meat – chiefly from the US. Pork meat exports from US to
China are projected to increase from 100 kton (2018) to 300 kton (2019)
(Bloomberg, 2019).
Ironically, part of the soybean that would be exported by the US as grain will
reach China with added value, as pork meat. Importing pork meat from the US
means less soybean importation from other suppliers. This market movement
helps mitigating the impact of the tariff war, giving the necessary time and
tranquility to market mechanisms to accommodate, if an eventual structural
change of market fluxes becomes permanent.
Thirdly, Canada dramatically incremented by 80% its soybean exports to
China in recent months, partially substituting US exports (Powell, 2019).Does the Brazilian soybean production increase pose a threat on the Amazon rainforest? 15 Worldwide agricultural area The NASA-funded GFSAD30 project resulted in databases and maps, in which the Earth’s surface was scanned in 30 m2 resolution, during two deca- des (USGS, 2019a). According to the study, the world has 1.87 billion hecta- res (Gha) of crops (Figure 3). The largest cultivated areas are located in India (179.8 million hectares - Mha), United States (167.8 Mha), China (165.2 Mha) and Russia (155.8 Mha). One of the applications of the study is the possibility of identifying which countries can possible expand the agricultural frontier in a sustainable way, if it did not reach or surpassed a reasonable proportion between agricultural area and native vegetation. The results of this study are very close to those published in 2018 by Embrapa Territorial (Embrapa, 2019a), which calculated the cultivated area of Brazil in 65,913,738 ha, equivalent to 7.8% of its territory. The GFSAD30 project estimated the area of crops in Brazil at 63,994,479 ha (7.6% of the territory), a small difference. It is possible to clearly identify in Figure 3 that the Amazon region (arrow) is outside of the cropped area and involves not only Brazil, but also Peru, Colombia, Venezuela, Guyana, French Guyana, and Suriname. Figure 3. World distribution of land used for agricultural purposes in 2017. Source: USGS (2019a).
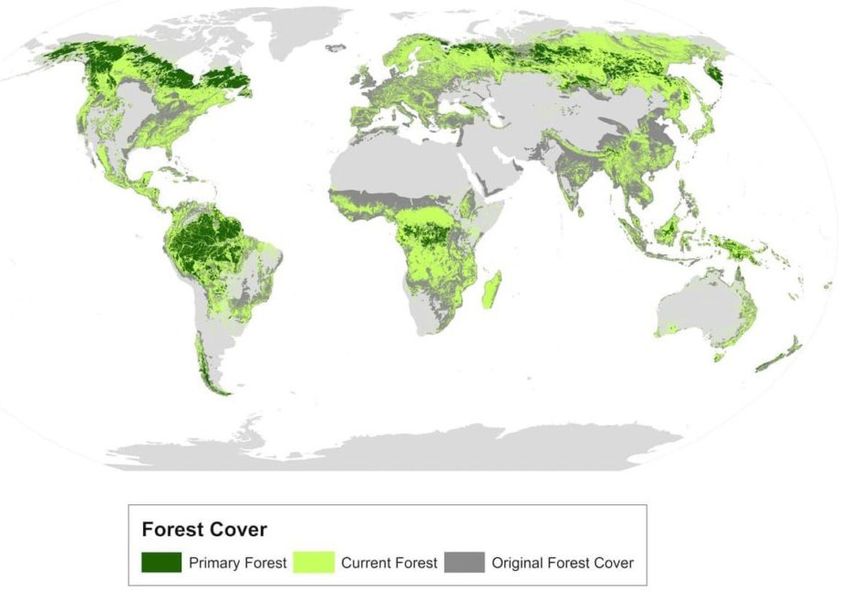
16                                                                      DOCUMENTS 414

Brazil cultivates 7.6% of its area and protects or preserves almost nine ti-
mes more (66.3 % of its territory). Just for comparison purposes, Denmark
cultivates 76.8% of its area; Ireland, 74.7%; the Netherlands, 66.2%; United
Kingdom 63.9%, and Germany 56.9%. The use of farmland is not different in
the rest of Europe, with agriculture using 55-65% of the territory for the majo-
rity of the countries, according to GFSAD30 (Figure 4).

Figure 4. Cropland areas as a percent of the country geographic area.
Source: USGS (2019b).

According to the Food and Agriculture Organization of the United Nations,
the four countries with the largest primary forest area are Brazil (495 Mha),
Canada (330 Mha), USA (280 Mha), and China (145 Mha) (FAO, 2015). The
location of world’s primary forests is shown on Figure 5.

A recent study comparing the legislation regarding native forests protec-
tion indicated that Brazil has the most rigorous rules, the only one obli-
gating farmers to preserve native vegetation at their own expenses and
responsibilities, one of the key reasons for the country showing up the world
highest level of primary forest preservation (Chiavari; Lopes, 2019).

Brazilian growers preserve 25.6 % of the Brazilian territory (ca. 219 Mha) at
their own costs and responsibilities. Embrapa estimated the value of this area
in the land market as over US$ 627 billion. If the growers were not legally
forbidden to cultivate this area, their yearly estimated additional gross income
would be over US$70 billion (Embrapa, 2018).
Does the Brazilian soybean production increase pose a threat on the Amazon rainforest?   17

Figure 5. Location of primary forests around the world.
Source: International Action for Primary Forests (2019).

As a rule, Europeans deforested their territory in order to exploit it intensely
and not only for agricultural use, but also for urban, road or industrial occu-
pation. Prior to intensive exploitation, Europe (excluding Russia) represented
more than 7% of the world’s original forests, while Brazil had 9.8%. Today,
Europe has only 0.3 % while Brazil has 28.3 % of the world’s forests (World
Resources Institute, 2019). As an example, in 2016 France (28.7 Mha), Spain
(26.3 Mha), and Germany (16.7 Mha) (World Bank, 2019a) together cultiva-
ted 13% more area than Brazil. However, the sum of the total area of the
three countries represents only 16.7 % of Brazil’s territorial area (World Bank,
2019b), meaning that the pressure of agriculture on the environment is far
higher in those countries than in Brazil.
18                                                               DOCUMENTS 414

Sustainable agriculture in Brazil
After these market and agriculture introductory considerations, it is important
to understand how Brazilian growers and the Government will behave in
order to keep pace with the sustainable development targets, according to
the country commitments on international fora and with the recent history of
Brazilian agriculture.

The land use and occupation in Brazil, as for 2017, is presented in Figure
6. Considering all preserved areas (On-farm, Indian lands, Conservation
Units and Government owned), Brazil preserves 66.3% of its territory, who-
se original vegetation has remained untouched for millennia (Embrapa,
2019a).

The Brazilian law severely restricts any use of the area in a farm, no matter
if it is for agriculture or other use. According to the Brazilian Federal Law
12.651/2012 (Brasil, 2012), a farmer can only use up to 20% of the area of
its property if it is located in the Amazon Biome; 65% in the Cerrado Biome;
and 80% in the Atlantic Forest and Pampas Biomes. The farmer is respon-
sible for preserving the native vegetation in the rest of the farm, under the
penalties of the law, specially the so-called Permanent Preservation Areas
(border of rivers, lakes and other water sources, top and slope of hills of
high declivity, etc.), and the Legal Reserve, a forest reservoir.

Considering these aspects, sometimes a grower is enforced by law to pre-
serve more than the legal minimum limits described above. Even for the
legally permitted deforestation of a farm, the process is bureaucratic, tire-
some and the permit is difficult to obtain, but is always required prior to
changing the land use from native vegetation to other purposes. Brazilian
growers preserves 25.6 % of the Brazilian territory at their own costs and
responsibilities (Figure 6). Embrapa estimated the value of this area in the
land market as over US$ 627 billion. If the growers were not legally for-
bidden to cultivate this area, the yearly estimated gross income would be
over US$ 70 billion.
Does the Brazilian soybean production increase pose a threat on the Amazon rainforest?   19

Figure 6. Use and occupation of the Brazilian land.
Source: Embrapa (2019a).

In recent decades, Brazil has primarily incremented its agricultural production
in other ways rather than by deforestation and these key drivers will continue
for the expansion of the production in the next decades:

    • Use of degraded pastures, currently abandoned or underutilized, due
      to migratory agriculture and former inadequate production systems,
      a phenomenon that occurred in the country before the 1970’s. In the
      1990’s, Brazilian pasture area reached ca. 220 Mha, 55 Mha more
      than the present 165 Mha. Even now, it is estimated that ca. 30 Mha
      represents degraded pastures that can immediately be reincorporated
      for agricultural purposes (UFG, 2019).

    • Conversion of good pastures area to agricultural use, as a result of the
      continuous improvement of zootechnical parameters and nutritional qua-
20 DOCUMENTS 414
lity of pastures, allowing a higher number of cattle heads per hectare
and earlier slaughter, meaning that Brazil is continuously producing more
meat using progressively less area. It has been estimated that more than
30 Mha of presently used pastures will be available to crops in the next
20 years, regardless of the rate of increase in meat production (Gazzoni;
Dall’Agnol, 2018).
• Improvement of pastures by inserting a year of agriculture between se-
veral years of occupation with pastures to enable investments in soil
improvement, or using a production system called “Integration agricultu-
re-livestock-forest (iLPF in Portuguese)”. This system allows using part
of the pasture area for agricultural purposes each year. As for 2016 esti-
mated 11.5 Mha were cropped using the iLPF system (Embrapa, 2019b),
and it is surely greater now.
• Agricultural intensification, meaning the use of two, sometimes three
cropping cycles a year, in the same area, which implies reducing the
area needed for the same agricultural production. The expansion of irri-
gation can further support the intensification. It is estimated that at least
50% of the Brazilian grain area will be cropped under such approach in
the next decades, leading to reduced cropping area.
• Continuous increment of soybean yield supported by technology-based
improved productions systems to partially offset the need for additional
area.
The Figure 7 is an example of the “area saving” resulting from the agri-
cultural intensification system largely used by Brazilian growers. On the
present season (2019) more than 12 Mha will be “saved”, by cultivating
maize just after harvesting soybean, on the same area. The former maize
area - now used for soybean cultivation during the summer - means the
production of over 39 Mt, 50% above the possible amount of soybean that
presumably would not be exported by the US to China as a consequence
of the tariff war.Does the Brazilian soybean production increase pose a threat on the Amazon rainforest? 21
14
1st cropping
12 2nd cropping
10
Million ha
8
6
4
2
0
2003
2007
2018
1997
1998
1999
2000
2001
2002
2004
2005
2006
2008
2009
2010
2011
2012
2013
2014
2015
2016
2017
2019
Figure 7. Area used for maize production on summer (1st cropping) and autumn (2nd
cropping) in Brazil.
Source: Conab (2019).
Sustainable agriculture in numbers
The great expansion of Brazilian grain production started at the end of the
1980s. From 1990 to 2019, the production of grains increased 304%, with a
yield increment of 145%, while the area expansion was limited to 66% (Figure
8). This way, Brazilian growers demonstrated the feasibility of expanding the
agricultural production increasing the crop yields instead of additional lands.
This trend will surely remain in the forthcoming years, not only because of
legal restrictions, but mainly because growers understood the importance of
preserving the environment and because increasing yield is financially more
profitable than incorporating new areas, as this option implies in higher invest-
ment and production costs. The potential for expansion of soybean cultiva-
tion in Brazil has been discussed in more detail in an earlier paper (Cattelan;
Dall’Agnol, 2018).22 DOCUMENTS 414
300 4
Area and production (Mha or Mton)
Area
Production
250
Yield 3
200
Yield (t/ha)
150 2
100
1
50
0 0
1990
1992
1994
1996
1998
2000
2002
2004
2006
2008
2010
2012
2014
2016
2018
Figure 8. Evolution of area, production and yield of grain crops in Brazil.
Source: Conab (2019).
Specifically regarding to soybean yield, the World Bank points out: “[…] agri-
culture has been an island of success in terms of productivity growth in the last
decades compared to other sectors of the Brazilian economy and compared
to other country’s agriculture sector” (World Bank, 2019c). Figure 9 presents
the results of the Soybean Yield Challenge, conducted by the Brazil Soybean
Strategic Committee (CESB) in 2016. Results indicate the availability of com-
mercial technology to achieve higher yields, with improved profitability.
In the 2016/17 Challenge, the winner yield was 117% higher than the Brazilian
average soybean yield. The present soybean yield record in Brazil is 8,520 kg/
ha, reached in 2015, representing 184% over the average Brazilian soybean
yield for that year. These data demonstrate the enormous potential for increa-
sing soybean yield in Brazil, with profitability for the growers.
A quick analysis of the available data comparing deforestation of the Amazon
region and the area used for soybean cultivation demonstrates that while the
soybean area has expanded from 2005 to 2018, deforestation has reduced
(Figure 10). The correlation coefficient between the two series is negative
(-0.618).Does the Brazilian soybean production increase pose a threat on the Amazon rainforest? 23
Brazilian Average
Participants Average
200 top
100 top
50 top
20 top
10 top
5 top
Winner
0 1000 2000 3000 4000 5000 6000 7000
kg/ha
Figure 9. Soybean yield by group of producers participating in the Soybean Yield
Challenge (CESB), compared with the winner of the Challenge and with all participants
(1,500) for the 2016/17 season.
Source: Gazzoni and Dall´Agnol (2018).
32 400
Deforestation Soybean area
28 350
Deforestation (1,000 km2)
Soybean area (1,000 km2)
24 300
20 250
16 200
12 150
8 100
4 50
0 0
2004
2011
2005
2006
2007
2008
2009
2010
2012
2013
2014
2015
2016
2017
2018
Figure 10. Comparison between deforestation in the Amazon forest and the soybean
area. (r=-0.618).
Source: Gazzoni and Dall’Agnol (2018).24 DOCUMENTS 414
Brazilian agriculture and
reduced GHG emissions
Brazil is a signatory to the UNFCCC Paris Agreement. Accordingly, the
country has committed to reduce its greenhouse gas (GHG) emissions
by 37% in 2025 and by 43% in 2030 as compared to 2005 (Federative
Republic of Brazil, 2015). Data presented at the Climate Conference (COP
24) in Poland showed that in 2018 Brazil had already achieved its goal of
reducing greenhouse gas emissions proposed for 2020. The objective was
met based on the actions of the forestry sector, which allowed the reduction of
1.28 billion tons of carbon equivalent only in 2018. The country also announ-
ced an 11% decrease in deforestation in the Cerrado biome and recovery of
areas previously deforested.
In order to reach the above-mentioned targets in the agricultural sector, Brazil
has committed to:
• Restore 12 Mha of forests for multiple uses by 2030.
• Restore 15 Mha of degraded pastures and increment by 5 Mha the agri-
culture-livestock-forest integration systems.
• Enhance the current ABC (Low Carbon Emissions Agriculture) Program
(Magalhães; Lima, 2014).
• Enforce the Forest Code Legislation.
• Eliminate illegal deforestation by 2030.
• Compensate the emissions derived from legal deforestation.
• Increment the use of renewable sustainable energy like eolics, solar, and
biomass, reaching at least 23% of the electricity generation matrix, by
2030.Does the Brazilian soybean production increase pose a threat on the Amazon rainforest? 25 Brazil is deeply committed with agricultural production systems involving tech- nologies that reduce the emission of GHG. Among them, it is worth mentioning: Biological nitrogen fixation Brazilian soybean production uses inoculation with nitrogen fixing bacteria (rhizobia), avoiding the use of mineral nitrogen fertilizer. This is the most suc- cessful case in the world for the use of microorganisms in agriculture. The trade of inoculants has increased from about 23 million doses in 2010 to 78 million doses by 2018, most of it destined to soybean crop, resulting in an estimated adoption of inoculation ranging from 60 to 90% of the soybean gro- wers, depending on the region. Consistent results have shown that inoculation with Bradyrhizobium spp. results in an average yield gain by 8%, whereas the use of recently recommended plant-growth promoting bacteria in co-inocu- lation, Azospirillum brasilense, increases the yield gains by 16% (Hungria et al, 2013a), thus requiring less area for the same production. Considering the soybean area in 2017, the average grain yield, and the GHG emissions that would be necessary for the synthesis and use of mineral N-fertilizers, 62 Mt of CO2-equivalent were avoided to be launched into the atmosphere (Hungria et al, 2013b). Replacement of N-fertilizers by biological N fixation decreases not only GHG emissions, but also environmental contamination of stream water and groundwater with nitrites and nitrates (Hungria; Mendes, 2015). No-tillage No-tillage (NT) is the dominant system for grain production in Brazil, occupy- ing almost 70% of the grain-cropped area (Figure 11) and over 90% of soy- bean area (Gazzoni; Dall’Agnol, 2018). The estimated average annual rates of soil C-sequestration based on the chronosequence approach were respectively 1.61 and 1.48 Mg C ha−1 yr−1 for samplings performed in 2003 and 2011. The accomplishment of the Brazilian Government target to convert an extra 8 million ha of cropland to NT represents an estimated soil C-storage of about 8 Tg C yr−1 during 10 to 15 years, thus strongly reducing GHG emissions (Corbeels et al., 2016).
26                                                                                           DOCUMENTS 414

                        40                                                                           70

                        35                                                                           60
                                     No-tillage area    Percent of no-tillage area
No-tillage area (Mha)

                                                                                                          Percent of grain area
                        30
                                                                                                     50
                        25
                                                                                                     40
                        20
                                                                                                     30
                        15
                                                                                                     20
                        10

                         5                                                                           10

                         0                                                                           0
                             1975   1980       1985    1990      1995         2000   2005   2010

   Figure 11. No-tillage area and percent of the Brazilian grain area cultivated using
   no-tillage technique.
   Source: Gazzoni and Dall’Agnol (2018).

 Reduction of pesticide use

 The total amount of pesticides (as active ingredients) used in Brazil in 2015
 was estimated in ca. 395.6 kt (Menten, 2016). While agrichemicals use in
 Brazil grew 14% in the previous five years, grain production increased by
 40% in the same period. Consequently, lower quantity is being used per unit
 of produced grain (1.4 g a.i./kg). Considering the area of grains, coffee, sugar-
 cane, fruits, and vegetables, which consumed 96.8% of the agrichemicals, the
 annual consumption was 4.99 kg a.i./ha. The available data on consumption
 of agrichemicals in the world show that Brazil uses a much lesser total amount
 of products when compared with the world’s largest agricultural producing
 countries (Menten; Banzato, 2016). Less pesticide use represents smaller
 GHG emissions along the whole chain (synthesis, transportation, application).
 Field studies carried out directly with growers demonstrated a reduction by
 50% in insecticide application for soybean pest control, in farms that followed
 the technical recommendations for integrated pest management (Conte et al.,
 2018).
Does the Brazilian soybean production increase pose a threat on the Amazon rainforest? 27 Conclusions Based on the facts, data and maps presented, we do not forecast any risk of increasing deforestation rates in the Amazon region, or even in other native vegetation, due to soybean production in Brazil, linked or not to the US-China tariff war. In order to cope with short or long-term increasing market demands, including the war tariff between China and the US, the Brazilian farmers are able to ex- pand soybean production by increasing yields of current soybean producing areas with available and future technology, and by reclaiming and occupying vast areas of degraded pastures. In addition, the Brazilian soybean cropping system relies on eco-friendly technologies like biological nitrogen fixation, no-tillage, and pests and disea- ses integrated managements that increase its sustainability and reduces the emissions of GHG. References ABIOVE. 11th Soybean Moratorium Report. 2019. Available at: . Accessed on: Apr. 5, 2019. BLOOMBERG. China plans record U.S. pork imports to resolve trade war. 2019. Available at: . Accessed on: Apr. 5, 2019. BRASIL. Ministério do Meio Ambiente. Mapa de cobertura vegetal: Amazônia. 2019. Available at: . Accessed on: June 25, 2019. BRASIL. Presidência da República. Casa Civil. Subchefia para Assuntos. Lei no 12.651, de 25 de maio de 2012. Dispõe sobre a proteção da vegetação nativa. Diário Oficial [da] República Federativa do Brasil, Brasília, DF, n. 102, p. 1-8, 28 maio 2012. Seção 1. Available at: . Accessed on: Apr. 14, 2019.
28                                                             DOCUMENTS 414

CATTELAN, A. J.; DALL’AGNOL, A. The rapid soybean growth in Brazil.
Oilseeds and fats, Crops and Lipids, v. 25, n. 1, D102, 2018. 12 p.

CHIAVARI, J.; LOPES, C.L. Forest and land use policies on private lands:
an International comparison. Input, 2019. Report. Available at: . Accessed
on: Apr. 5, 2019..

CONAB. Acompanhamento da safra brasileira: grãos. 2019. Available
at: . Accessed on: Apr. 5,
2019.

CONTE, O.; OLIVEIRA, F.T.; HARGER, N., CORRÊA-FERREIRA, B.S.;
ROGGIA, S.; PRANDO, A.M.; SERATTO, C.D. Resultados do manejo inte-
grado de pragas da soja da safra 2017/18 no Paraná. Londrina: Embrapa
Soja, 2018. 66 p. (Embrapa Soja. Documentos, 402).

CORBEELS, M.; MARCHÃO, R. L.; SIQUEIRA NETO, M.; FERREIRA, E.
G.; MADARI, B. E.; SCOPEL, E.; BRITO, O. R. Evidence of limited car-
bon sequestration in soils under no-tillage systems in the Cerrado of Brazil.
Scientific Reports, n. 6, article 21450, 2016.

EMBRAPA. Agricultura e preservação ambiental. 2018. Available at: www.
embrapa.br/car. Accessed on: Apr. 9, 2019.

EMBRAPA. ILPF em números. 2019b. Available at: .
Accessed on: Apr. 5, 2019.

EMBRAPA. Síntese ocupação e uso das terras no Brasil. In: EMBRAPA.
Agricultura e preservação ambiental: uma análise do cadastro ambiental
rural. 2019a. Available at: . Accessed on: Apr.
9, 2019.

FAO. Global forest resources assessment. 2015. Roma: FAO, 2015. Desk
Reference. Available at: . Accessed on: Apr. 5, 2019.
Does the Brazilian soybean production increase pose a threat on the Amazon rainforest?   29

FEDERATIVE REPUBLIC OF BRAZIL. Intended nationally determined
contribution towards achieving the objective of the United Nations
Framework Convention on Climate Change. 2015. Available at: . Accessed on: Apr. 22, 2019.

FUCHS, R.; ALEXANDER, P.; BROWN, C.; COSSAR, F.; HENRY R. C.;
ROUNSEVELL, M. Why the US-China trade war spells disaster for the
Amazon. Nature, v. 567, p. 451-454, 2019.

GAZZONI, D. L.; DALL’AGNOL, A. A saga da soja: de 1050 a.C. a 2050 d.C.
Brasília, DF: Embrapa, 2018. 199 p.

HUNGRIA, M.; MENDES, I. C.; MERCANTE, F. M. A fixação biológica de
nitrogênio como tecnologia de baixa emissão de carbono para as cultu-
ras do feijoeiro e da soja. Londrina: Embrapa Soja, 2013b. (Embrapa Soja.
Documentos, 337).

HUNGRIA, M.; NOGUEIRA, M. A.; ARAUJO, R. S. Co-inoculation of soy-
beans and common beans with rhizobiaand azospirilla: strategies to improve
sustainability. Biology and Fertility of Soils, v. 49, n.7, p. 791-801, 2013a.

HUNGRIA, M; MENDES, I. C. Nitrogen fixation with soybean: the perfect sym-
biosis? In: DE BRUIJN, F.J. (Ed.). Biological nitrogen fixation. New Jersey:
John Wiley & Sons, 2015. v. 2, p. 1009-1023.

INTERNATIONAL ACTION FOR PRIMARY FORESTS. Forest Cover 2017.
2019. Available at: .
Accessed on: Apr. 11, 2019.

KASTENS, J. H.; BROWN, J.; COUTINHO, A. C.; BISHOP, C. R.; ESQUERDO,
J. C. D. M. Soy moratorium impacts on soybean and deforestation dynam-
ics in Mato Grosso, Brazil. Plos One, v. 12, e0176168, 2017. Available at:
.
Accessed on: Apr. 10, 2019.
30                                                              DOCUMENTS 414

MAGALHÃES, M. M.; LIMA, D. A. L. L. Low-carbon agriculture in Brazil:
the environmental and trade impact of current farm policies. Geneva:
International Centre for Trade and Sustainable Development (ICTSD), 2014.
18 p. (Agriculture. Issue paper, 54). Available at: .
Accessed on: Apr. 22, 2019.

MENTEN, J. O. Consumo de produtos fitossanitários no Brasil. 2016.
Available    at:    . Accessed on: Apr. 5, 2019.

MENTEN, J. O.; BANZATO, T. C. Setor de produtos fitossanitários no
Brasil. 2016. Available at: . Accessed on: Apr. 5,
2019.

POWELL, N. Canadian soybean exports to China jumped 80% last year.
Financial Post, April 1, 2019. Available at: . Accessed on: Apr. 5, 2019.

UFG. UNIVERSIDADE FEDERAL DE GOIÁS. Lapig maps. 2019. Available
at: . Accessed on: Apr. 9, 2019.

UNITED STATES. Department of Agriculture. Oilseeds: world markets and
trade. 2019a. Available at: . Accessed on: Apr. 5, 2019.

UNITED STATES. Department of Agriculture. USDA announces support for
farmers impacted by unjustified retaliation and trade disruption. 2019b.
Available  at:   .
Accessed on: May 25, 2019.

USGS. Cropland percent to country land area. 2019b. Available at: <
https://croplands.org/app/map/statsMap>. Accessed on: Apr. 5, 2019.
Does the Brazilian soybean production increase pose a threat on the Amazon rainforest?   31

USGS. Global croplands: GFSAD30 Figure C1. 2019a. Available at: . Accessed on: Apr. 5, 2019.

WORLD BANK. Agricultural land (% of land area). 2019a. Available at:
. Accessed on: Apr. 5,
2019.

WORLD BANK. Agriculture productivity growth in Brazil: recent trends
and future prospects. 2019c. Available at: . Accessed on: Apr. 22, 2019.

WORLD BANK. Land area (sq. km). 2019b. Available at: . Accessed on: Apr. 5, 2019.

WORLD RESOURCES INSTITUTE. Forest atlases. 2019. Available at: . Accessed on: Apr. 9,
2019.
Soybean

                                 CGPE 15344

          BRAZILIAN GOVERNMENT
You can also read