INVESTOR INFORMATION Q1 2019

Page created by Ana Banks
 
CONTINUE READING
INVESTOR INFORMATION Q1 2019
INVESTOR
INFORMATION
Q1 2019
Published May 1, 2019
INVESTOR INFORMATION Q1 2019
2

Canada’s leading integrated energy company

    $85B                  ~940 mbpd             ~600 mbpd                     28+ years           ~460 mbpd            ~1750
   Enterprise   value1      Oil production       Heavy upgrading                2P Reserve life   Refining nameplate
                                                                                                                       Retail sites4
   As at March 31, 2019   nameplate capacity2   nameplate capacity2                 index3             capacity2

                                                   1, 2, 3, 4 See Slide Notes and Advisories
INVESTOR INFORMATION Q1 2019
3

Suncor – A resilient business focused on shareholder returns
                     Cash flow growth                                                                                     Cash generation
Strong potential FFO1 increase largely independent of market conditions                              Significant upside FFO1 sensitivity to WTI, based on TTM5 actuals
                                                                                                              US$62.80 WTI, 0.76 C$/US$, US$18.00 NYH 3-2-1 crack spread

                      ~5% CAGR2                                                              (C$ billion)
                                                                                              $16
                       (Based on 2019 price guidance)
                                                                                                            TTM average production 750 mbbls/d
                                                                                              $14
                                                                                              $12

                                         Debottlenecks,                                       $10
                                         cost reductions                                        $8
                       Fort Hills,         and margin
                       Syncrude,         improvements                                           $6
                      and Hebron                                                                        $5.5B Sustaining capital6 + dividend
                                                                                                $4
                                                                                                $2      $2.8B Sustaining capital6
                                                                                                $0
               1
     2018 FFO          Production        Free funds flow       2023E FFO1                                     $60           $63             $70             $75             $80
                                                                                                                            TTM
                         growth 3            growth 4                                                                     WTI ($USD)

                    Shareholder returns                                                                                           Resilience
      Commitment to reliable returns through the commodity cycles                                                Managing the balance sheet as a strategic asset

      Dividend per share7                                                                                                  Liquidity
      Buyback per share7,8,9
      Anticipated buyback per share7,9
      Dividend + buyback yield
                                                        7%                                      $5 3B   .                  $1.9B cash and $3.4B in available lines of credit
                                                                                                                           As at March 31, 2019

                                                                                                            —
       5%                                  5%
                                                                                                  A low                    Credit rating
                                                                                                                           Investment grade
       1.14        3%           3%
                                           0.85         1.88
                                                                                                  Baa1                     DBRS (A Low) Stable, S&P(A-) stable, Moody’s (Baa1) Stable

                                                                                                                           WTI FFO Break-Even10 (USD)
       1.02        1.14        1.16        1.28         1.44         1.68                       ~$45                       Sustaining capital6 + dividend
                                                                                                                           2019
      2014         2015        2016        2017         2018       2019E

                                                               1, 2, 3, 4, 5, 6, 7, 8, 9, 10 See Slide Notes and Advisories.
INVESTOR INFORMATION Q1 2019
4

Multi-year focus on structural free funds flow growth1,2

                                              Production
                                              growth5                                                    Growth
                        Free funds            In situ replication
                        flow growth
                        projects1,5                                                                  Opportunistic
 Production                                                                                         share buybacks
                        Debottlenecks, cost
 growth                 reductions & margin
 Fort Hills, Syncrude   improvements
 and Hebron                                   ~4% anticipated                                   Sustain the business &
                        ~5% anticipated       production CAGR
                                                                                                 continually grow the
 ~10% anticipated       FFO CAGR               (Refer to slide 9)                                      dividend
 production growth
 per share4             (Refer to slide 8)    2023/2024 forward2
                        2020 – 2023                                                              Structural FFO3 growth
 2019 – 2020                                                                                    & balance sheet strength
                                                                                                       (Refer to slide 7)

                                                1, 2, 3, 4, 5 See Slide Notes and Advisories.
INVESTOR INFORMATION Q1 2019
5

The Suncor business advantage

Long life, low decline                     Unique business                                                 Financial strength
   and low cost                              integration                                                 through market cycles
                                         ~800 mbpd 2019 production guidance midpoint5
                                              ~1000 mbpd of conversion capacity6
                                                                                                           Resilient free funds flow8
         ~31yrs                             ~600 mbpd of heavy upgrading capacity7
                                                                                                           ~$93
                                                                                                                                                                           ~$65
           Oil Sands 2P                                                                                                        ~$49                       ~$51
                                                                                                                                            ~$43
         Reserve Life Index1
                                                                                         Oil
                                       E&P                                               Sands                                                                          ~$10.2B
                                                           Resources                                      ~$9.0B                                         ~$9.1B

                                                                                                                        ~$6.8B
       Minimal                                       Suncor’s ~560mbpd                                                                   ~$6.0B

                                                                                                                                                                           turnaround year
                                                       Fort McMurray

                                                                                                                                                                           Major planned
                                                         upgrading

       decline

                                                                                                                                          forest fires
                                                                                                                                          McMurray
     ~1% anticipated near term oil

                                                                                                                                          Fort
         sands decline rate2
                                                                                                           2014               2015          2016           2017             2018
                                                                                                                  Dividends                                Sustaining Capital
                                                           Suncor’s                                                                               8
                                                          ~460mbpd                                                Discretionary Free Funds Flow            WTI Average Price
                                                           refining
                                                           network
            ~$30                                                                                                     Capital discipline
      2018 Oil Sands operations
     sustaining capex + cash cost                                                                          1.6x Net debt to FFO9
              USD / bbl3                                                                                                1.5x under the previous leasing standard10
                                               Global                          Global                                   Target < 3x
                                               markets                         markets
                                                                                                           30% Total debt to capitalization
                                                                                                                        28% under the previous leasing standard10
                                                                                                                        Target 20-35%

            ~$45                                         Suncor and 3rd party
                                                           global markets                                $5.3B Liquidity
     2019 break-even4 WTI (USD)                                                                                         Cash & cash equivalents ($1.9B) plus
     sustaining capital + dividend                                                                                      Available credit facilities ($3.4B)11

                                     1, 2, 3, 4, 5, 6, 7, 8, 9, 10, 11 See Slide Notes and Advisories.
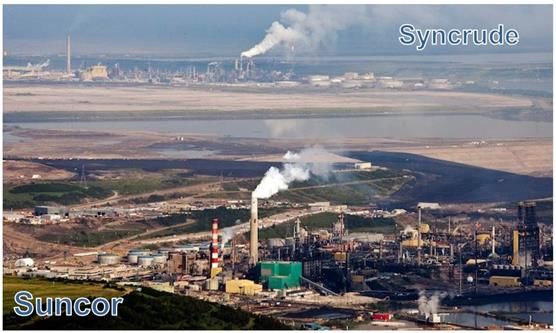
INVESTOR INFORMATION Q1 2019
6

The foundation of our business
Operational excellence
 Reliability
   Continuously improve the reliability of our business

 Personal and process safety
   Journey to Zero – goal to eliminate all workplace incidents

 Cost management
   Continuous focus on structural cost reduction initiatives

 Environmental excellence and sustainability
   Aiming to improve environmental performance, go beyond compliance in key areas                        Autonomous Haul Systems can reduce costs by ~$1/bbl1 and
                                                                                                         improve safety, productivity, reliability, and environmental
                                                                                                         performance
Capital discipline
 Flexible allocation plan
   Significant portfolio of high quality assets across the business

 Balance sheet strength
                                                                                                      17               years of dividend increases2
                                                                                                                       % Q1 2019 dividend increase

                                                                                                                   Opportunistic share buybacks
   Liquidity and strong investment-grade credit rating                                                             through the commodity cycle
                                                                                                                 80                                      $100

 Shareholder returns                                                                                             60                                      $80
                                                                                                                                                         $60
   Competitive & sustainable dividends, opportunistic share buybacks                                             40
                                                                                                                                                         $40
                                                                                                                 20                                      $20
 Profitable growth                                                                                                0
                                                                                                                      2013 2014 2015 2016 2017 2018
                                                                                                                                                         $0
   Strategic acquisitions & divestments; high-quality organic growth potential
                                                                                                                               Shares          WTI

                                                                      1, 2 See Slide Notes and Advisories.
INVESTOR INFORMATION Q1 2019
7

Capital discipline – flexible capital allocation plan1
$10/bbl increase in Brent price would generate approximately $2.4 billion of additional FFO2
                                                              Capital commitment                                         Discretionary capital
                       Balance
 Sustained                                 Production
                         sheet
   price                                    growth to
                       leverage                                                    Sustaining                                                    Buyback4
  outlook*                                    20203          Dividend4                                             Growth Capital1
                        metrics                                                     Capital1,6                                                    target

                                                                                                                                 Invest
INVESTOR INFORMATION Q1 2019
8

 Medium-term investment proposition1 – free funds flow2 growth
Free funds flow2 improvement potential for years 2020 - 2023 inclusive3                                 Examples of anticipated high return investment opportunities3
Excluding commodity price changes & largely independent of production growth
                                                                                                     Suncor – Syncrude pipeline                             Tailings management
                                                                                                            investment                                             savings

                                                                                   $2.0B             ~$200M at >25% IRR                                         ~$4 per bbl
                                                                                   Potential to
                                                                                       deliver            Conservative return based on                Average go forward expected sustaining
                                                                                   incremental                 planned outages                         capital, reclamation & opex savings for
                                                                                    free funds                                                           base plant mined bitumen versus
                                                                                      flow2 of
                                                                                    ~$500M/yr
                                                                                                         Further potential value upside                              2018 spend
                                                                                                       including mitigation of unplanned
                                                                                                      outages and product sharing during              Tailings placement in pit - less land use
                                                                                                               normal operations                         Less tailings transport & handling
       Growth             Margin          Opex savings       Sustaining           Total value add         (slide 21 for further details)                 Accelerated dewatering of ponds
                       improvements                        capital savings                                                                                   (slide 23 for further details)

         Examples of short lead time & high quality initiatives independent of commodity market conditions

                  Growth                            Margin improvements                                             Opex and sustaining capital savings
                                                                                                                                      Asset synergies
                     E&P                         Coke fired boiler replacement                               Coordinated maintenance strategy, timing, materials, critical trades, etc.
            Value developments &               Cogeneration with lower cost, high efficiency
              asset extensions                     steam and power revenue upside                                                    AHS4 deployment
                                                                                                                              Base mine & Fort Hills implementation

                                                  Suncor - Syncrude pipeline
                                               Optimizing Syncrude assets & Suncor’s sour
                                                                                                                               Supply chain optimization
                Debottlenecks                                                                                    Equipment standardization and inventory consolidation/reduction
           Fort Hills, MacKay River &                        SCO margins
          Firebag processing facilities
                                                         Supply & trading                                                         Tailings management
                                                         Value chain optimization                                                   Implementation of PASS5

                                                                              Digital technology adoption
       Wireless employee badges (worker safety & optimization), Advanced process analytics (operational optimization), Robotic process automation (cost reduction), etc.

                                                                             1, 2, 3, 4, 5 See Slide Notes and Advisories.
INVESTOR INFORMATION Q1 2019
9

Longer term organic growth – Replication1
                     Targeting less than $50 WTI (USD) cost of capital breakeven1
                      Planned phases of 40 mbpd next
             ~10      generation in situ facilities (replication)

                      Phases submitted for regulatory approval
                 7    2 approved and 5 pending approval

2023/24               Potential first oil from first phase                                        3

                      Months expected between first oil
12 to 15              from successive phases

        360+          Mbpd production growth plans2

       Potential replication production growth profile
       400
                                                                                                      Replication facilities approved by
       300                                                                                            the regulator

                                                                                                      Replication facility application
mbpd

                                                                                                      submitted
       200

       100

         0
          2023   2025     2027      2029     2031      2033

                                                        1, 2, 3 See Slide Notes and Advisories.
INVESTOR INFORMATION Q1 2019
10

Disciplined cost management

 History of structural cost reductions                                                                          Medium-term cash operating
 Consistent reduction in Oil Sands operations cash operating costs (C$/bbl)
 (Fort Hills and Syncrude cash operating costs are not included)
                                                                                                                   cost targets4 (C$/bbl)
   $40         Oil Sands1                                                                                                    Oil Sands ≤ $20/bbl
               $37.00
                                                                                                                              Fort Hills ≤ $20/bbl
                                                                     Reflects a heavy                                        Syncrude ≤ $30/bbl
                                                                     maintenance year

               Mining2
               $27.55                                                                                                      Enterprise-wide
                                                                             $25.55
                                                                                                                       cost reduction initiatives
                                                                             $25.25                                            Operational
                                                                                                                               Improved reliability across assets
   $20                                                                                                                         through sharing technology and
               In situ3                                                                                                        procedures, coordinated maintenance
               $16.50                                                                                                          planning and asset connectivity

                                                                                                                               Technology
                                                                                                                               Technology applications such as
                                                                                                                               robotic process automation, advanced
                                                                                                                               analytics, Autonomous Haul Trucks
                                                                               $8.45                                           and Artificial Intelligence

                                                                                                                               Supply chain & business processes
                                                                                                                               Improved cost and efficiency across assets
    $0                                                                                                                         through contractor and parts
              2013           2014           2015           2016    2017         2018                                           standardization, bulk procurement and
                                                                                                                               streamlined processes

                                                                          1, 2, 3, 4 See Slide Notes and Advisories.
11

Generating discretionary free funds flow1
 FFO2 consistently exceeds sustaining capital, associated capitalized interest and dividends (C$ billions)
$12

$10
                                                                                                                 $10.2

 $8                                                                           $9.1

 $6
                   $6.8
                                             $6.0                                                                    $2.3

 $4                                                                                    $2.1
                           $1.6                     $1.9

 $2                                                                                                                  $3.9
                           $2.7                                                        $3.0
                                                    $2.3

 $0
                   2015                      2016                             2017                               2018                           2019E
WTI US$3           $48.75                    $43.35                           $50.95                             $64.80                         $58.00

NYH 3-2-1 US$4     $19.70                    $14.05                           $17.70                             $18.00                         $17.00

      Sustaining capital          Dividend   FFO2           Illustrative 2019 FFO2,5          2019 Estimated sustaining capital6 + dividends7

                                                           1, 2, 3, 4, 5, 6, 7 See Slide Notes and Advisories.
12

          Returning value to shareholders
   17 consecutive years of dividend increases1 & opportunistic share buybacks with increased share repurchase program2

                17%                          $0.42                     ~$5 billion                             ~$514 million                                 $2 billion
                                                                                                                       Share repurchases                  Share repurchase
          Q1 2019 dividend            Q1 2019 dividend per          NCIB programs executed3
                                                                                                                          completed                     program commenced
              increase                      share                       (May 2017 - Dec 2018)
                                                                                                                       (Jan 2019 - Mar 2019)                March 20194

     $100                                                                                                                          Expected buyback in 20192                $3.50
                       Buyback per share (Actual)2,5,6,7
                       Buyback per share (Expected)2,5,7
                                                                                                                                                                            $3.00
                       Dividend per share5
          $80
                       WTI US$
                                                                                                                                                              Dividends     $2.50
                                                                                                                                                             expected to
          $60                                                                                                                                                grow in line
                                                                                                                                                                 with       $2.00

                                                                                                                                                                                    C$/share
US$/bbl

                                                                                                                                                             sustainable
                                                                                                                                                                FFO8
                                                                                                                                                                            $1.50
          $40                                                                                                                                                increases7

                                                                                                                                                                            $1.00

          $20
                                                                                                                                                                            $0.50

          $0                                                                                                                                                                $0.00
                2002   2003    2004   2005    2006   2007   2008   2009    2010     2011     2012     2013     2014     2015   2016   2017     2018   2019

                                                                   1, 2, 3, 4, 5, 6, 7, 8 See Slide Notes and Advisories.
13

Strong balance sheet
                                                                                                         1.6x Net debt to FFO1
                                    Net debt to            FFO1                                                    1.5x under the previous leasing standard2
                       Has remained within target range throughout all price cycles                                Target < 3x
                                                                                                         30% Total debt to capitalization
                       97.95                                                                                       28% under the previous leasing standard2
               94.20               93.00                                                                           Target 20-35%
                 WTI                                                                                  $5.3B Liquidity
                 ($US/bbl)                                                                                         Cash & cash equivalents ($1.9B) plus available credit
                                                                                                                   facilities ($3.4B)1 as at March 31, 2019
                                                                         64.80
                                                                                      54.90            A           Investment grade credit rating
                                              48.75            50.95                                               DBRS Rating Limited (A Low) Stable
                                                                                                           low
                                                                                                                   Standard and Poor’s Rating Services (A-) Stable
                                                      43.35                                            Baa1        Moody’s Corp (Baa1) Stable
3x

                                                       2.4                                            Manageable debt maturity profile3
                                                                                                      (C$ billion)
                                                                   Increase due to new
                                                                   leasing standard2
                                             1.7
Target range

                                                                                                      2019-2020            $0.2
                                                                                       1.6
                                                                 1.4       1.5
                                                                                                      2021-2024                      $2.7

                                   0.9                                                                2025-2029              $1.5
                 0.7         0.7
                                                                                                      2030-2034               $1.7
                  Net debt to FFO1                                                                    2035-2039                                  $5.1

0x                                                                                                    2040-2047              $1.5
                2012     2013      2014     2015      2016      2017     2018 2019 Q1

                                                                             1, 2, 3 See Slide Notes and Advisories.
14

Generating industry-leading FFO1 per barrel and shareholder returns
   Delivering leading FFO1 per barrel2 and shareholder returns despite Canadian oil differential headwinds,
   demonstrating the value of our integrated business model and global competitiveness

                          Quality cash flow                                                                     Shareholder returns
               Reliable quality cash flow from Suncor’s unique                                          Growing dividends and executing opportunistic
                             integrated business                                                       share repurchases with sustainable discretionary
                                                                                                                       free funds flow
FFO1/boe                                                               WTI                      Total cash yield
($US/boe)                                                              ($US/bbl)                (dividend + buyback)

  $60                                                                      120                10%

                                                                                                9%
  $50                                                                      100
                                                                                                8%

                                                                                                7%
  $40                                                                      80
                                                                                                6%

  $30                                                                      60                   5%

                                                                                                4%
  $20                                                                      40
                                                                                                3%

                                                                                                2%
  $10                                                                      20
                                                                                                1%

   $-                                                                                           0%
        2012       2013     2014     2015    2016        2017         2018                              2012      2013      2014       2015     2016      2017      2018

                Suncor        WTI            Oil Sands peer range3                 Supermajor peer range3              Suncor dividend yield4          Suncor buyback yield5

                                                                1, 2, 3, 4, 5 See Slide Notes and Advisories.
15

Return on capital employed1 past the inflection point

Suncor's spending on major capital projects Fort Hills and Hebron completed
The 50-year, long-life, low-decline production profile of Fort Hills has begun
Focusing on near-term low capital intensity and high value added projects2
Debottleneck existing assets, product margin improvements and further cost reductions

                            ROCE1 compared to supermajors
                  20%                                                                                                                      $100

                                                                                                                                           $80
                  15%

                                                                                                                                           $60
                  10%

                                                                                                                                           $40

                   5%
                                                                                                                                           $20

                   0%
                                 2013                   2014                  2015                  2016              2017          2018   $0

                  -5%                                                                                                                      -$20

                                                         Supermajor peer range 3                 Suncor             WTI (US$/bbl)

                                                                          1, 2, 3 See Slide Notes and Advisories.
16

The value of Suncor’s integrated business
Benefiting from our crude and product strategy through all market cycles

   Exposure to high value product pricing provides significant cash flow upside potential
       BRENT                                         E&P production attracts Brent based pricing
      PRICING                 ~110     mbpd          Offshore production with access to tidewater

     SYNTHETIC                                       Bitumen conversion to a higher value synthetic oil1
      PRICING                ~600      mbpd          Heavy upgrading capacity1

      GLOBAL
                                                     Oil sands bitumen with direct access to global markets
       HEAVY
      PRICING
                             ~100      mbpd          Logistical flexibility for non-upgraded bitumen

      GLOBAL                                          Suncor’s refined products capacity1 sold for global pricing
     PRODUCT
      PRICING
                              ~460      mbpd          ~260 mbpd of oil sands synthetic and heavy feedstock capability2
                                                      Remaining light oil feedstock purchased in the market

   Integration between upstream, midstream & downstream businesses
   minimizes downside risks from differential volatility
   Heavy differential sensitivity                                  Synthetic differential sensitivity
   Up to $25M FFO3 impact anticipated (CAD) per $1 annual          Between $20M to $40M FFO3 impact anticipated (CAD) per $1
   change (USD) in a normalized Western Canadian L/H4              annual change (USD) in a normalized synthetic to WTI benchmark5

                                               1, 2, 3, 4, 5 See Slide Notes and Advisories.
17

IMO1 2020 – Positive FFO2 impact expected for Suncor
Expect IMO1 regulatory change will enhance demand for middle distillates used in new marine fuel

              Projected impacts                                                           Suncor advantages
   Decreasing global demand for bunker fuel3                                Minimal exposure to bunker fuel
                                                                            Sales from Suncor refineries (~1%)

   Widening global L/H4 differentials                                       Minimal impact of widening L/H4 spread
18

Regional synergy opportunities1 for existing assets

Crude logistics
Upgrader feedstock optionality from multiple oil sands assets
Crude feedstock optionality for Edmonton refinery

Supply chain
Sparing, warehousing and supply chain management
Consolidation of regional contracts (lodging, busing, flights, etc.)

Operational optimizations
Unplanned outage impact mitigations
Turnaround planning optimization
Process and technology sharing
                                                                                                      100% WI
                                                                                                      Joint ownership
                                                                                                       Base mine upgrader and terminal
Assets and resource developments                                                                  U    Syncrude upgrader
Lease development and asset utilization optimization                                              C    In situ central processing facility
                                                                                                  P    Fort Hills primary/secondary extraction
                                                                                                       Pipelines
                                                                                                       Proposed bi-directional pipelines1

                                                              1 See Slide Notes and Advisories.
19

   Market access for Suncor’s oil sands production
   Suncor has made strategic investments in refineries and current/proposed logistics infrastructure
   to mitigate Alberta egress limitations and market disconnects

                                                    Fort McMurray      ~750             Alberta
                                                                                  egress bottleneck
                                                                                   does not impact
                                                                                  the ability to move
                                                                                    Suncor barrels1
                                            142     Edmonton

                                                                       Hardisty                               Enbridge Line 3
                                                                                                             Potential Markets
                                                                                   Regina                    Central & Eastern
                                Vancouver                                                   Cromer          Canada, US Midwest
                                                                                                               & Gulf Coast

                                                                                                                                                 137
                                                                                                                                                 Montreal
                                        TMEP Potential                                                Superior
                                          Markets
                                        Asia & California                                                                          85

                                                                                                                                        Sarnia
                                                                                                      Steele City        Chicago
                                                                       98
                                                                       Denver
                                                                                                                      Patoka
                                             San Francisco                                                                                                         Suncor refinery capacity
                                                                                                                                                            mbpd
                                                                                            Cushing                                                                Industry approximate rail
Pipelines                                             Los Angeles
                                                                                                                         KXL Potential                      mbpd   loading capacity in
(current and forecasted gross capacity2)                                                                                   Markets                                 AB/SK
            Feeder lines
                                                                                                                        Heavy oil refineries
            Trans Mountain Pipeline, TMPL (300 mbpd)2                                                                  along the Gulf Coast
            Trans Mountain Expansion , TMEP – Proposed3 (+590 mbpd)2
            Express, Platte and Rocky Mountain (280 mbpd)2                         Houston/Texas City

            TransCanada Keystone (590 mbpd)2
            TransCanada Keystone XL – Proposed3 (+830 mbpd) 2
            Enbridge Mainline (2,600 mbpd)2
            Enbridge Line 3 – Proposed3 (+370 mbpd) 2
            Enbridge Line 9 (300 mbpd)2
            Flanagan South Pipeline (585 mbpd)2
            Marine opportunities

                                                                                    1, 2, 3 See Slide Notes and Advisories.
20

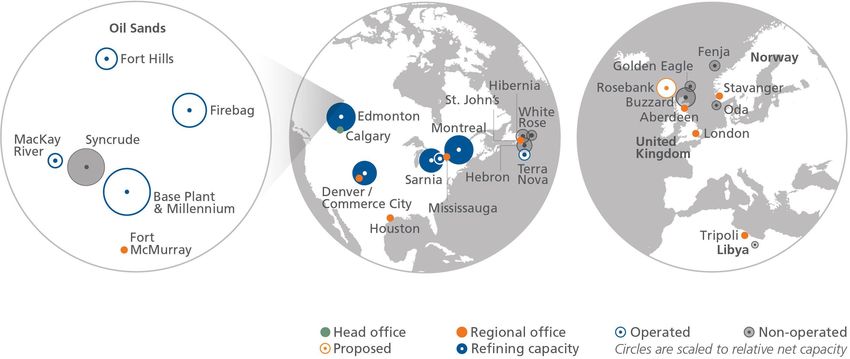
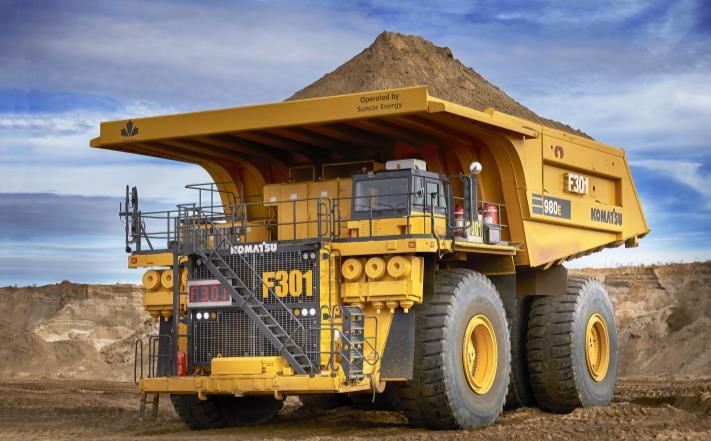
 Fort Hills – Leading deployment of mining technologies

         Higher quality, fungible product                                                      Enhanced reliability & efficiency
Secondary extraction – Paraffinic Froth Treatment                                                        Autonomous Haul Systems
 Bitumen froth mixed with solvents to remove water and minerals                        Heavy haulers are AHS ready, full deployment expected by 2021
                                                                                           Greater reliability & productivity
                                                                                              Designed to run 24/7 with no “breaks”

                                                         Shipped                           Lower costs
                                                                                              ~$1/bbl opex savings1
                         >75% bitumen                    directly to
                                                         market                            Safer operations
                         ~10% asphaltenes
                                                                                              Minimizes human interface in the mine, obstacle detection
                         2% water & sediment
                                                         back into                                    Improved tailings technology
                                                         mine pit
                                                                                                  Use of thickener process and PASS
   Partially upgraded                                                                   In process rapid dewatering coupled with in pit tailings storage
    Higher value due to reduced asphaltenes content
                                                                                           Reduced energy intensity & operating costs
   Lower GHG emissions                                                                       Flocculant2 added in process to aid in dewatering tailings
    In line with the average crude refined in the U.S.
                                                                                              Warm water from rapid dewatering is reused in the plant
   Less diluent required                                                                     Resulting lower energy demand reduces costs and GHG emissions
    ~20% diluent mix vs. ~30% for in situ barrel transportation
                                                                                           Faster reclamation
   Fungible product                                                                          Partially dewatered tailings feed into PASS process (slide 23)
    Meets pipeline, refinery specifications, no further upgrading

                                                               1, 2 See Slide Notes and Advisories.
21

Syncrude – Following Suncor’s proven reliability journey

  Suncor base plant upgrader reliability                                                                              91%                                       91%
  Multi-year journey to reach >90% reliability                                                                                             90%1

                                                                                                                             Reliability step-change after 4 years
                                                                                  83%                                                Not a gradual profile
                                                         81%

                                                                                              interconnect pipeline
           80%

                                                                                              Firebag to basemine
                                 79%

                                                                                              fully operational
         Suncor began focusing on upgrader reliability initiatives in 2011
            Culture – Operational excellence mindset
            Process – Integrated maintenance strategy/approach
            Infrastructure – Asset integration between Firebag and base plant

          2011                   2012                   2013                     2014                                 2015                 2016                 2017

  Syncrude plant reliability
  A similar multi year journey targeting >90% reliability2
   2016                 2017                    2018                     2019                          2020/21 (Target >90% reliability &
22

ESG leadership
                                                                       Environment

   Regulatory & policy leadership                             GHG & water performance                                    Technology & innovation
    Operate under one of the most stringent,           >60% reduction in Oil Sands Base GHG emissions                 $635M in technology investments in 20184
 transparent and compliance-focused regulatory                       intensity since 1990
                                                                                                                       Significant new technology deployment
                  frameworks1                            Goal to reduce corporate GHG intensity by 30%                     PFT, AHS, PASS, NCG co-injection5
  Participation in government-led initiatives to                            by 20302
                                                                                                                                External collaboration
  advance leadership in Canada’s O&G sector           Estimated carbon cost for upstream production is up to
                                                                                                                      Canada’s Oil Sands Innovation Alliance (COSIA)
    (e.g. 2018 co-chair Resources of the Future)              $0.60/bbl3 over the period 2018-2027
                                                                                                                           Clean Resource Innovation Network
 A strong voice for practical, effective policy and     ~30% reduction in water use intensity at Oil Sands                    NRG COSIA Carbon XPRIZE
       regulation development and design                       Base vs. the prior 4-year average                                    EVOK Innovations
            (e.g. Bill C-69 amendments)

                                                   Social                                                                          Governance

Advancing Aboriginal partnerships                             2018 economic contribution                                      Governance leadership
 $503M agreement with Fort McKay and Mikisew                           $5.3 billion capital spend                         Chief Sustainability Officer reports to CEO
      Cree First Nations for 49% of ETF6
                                                              $2.3 billion government royalties & taxes                     Climate risk is overseen by the Board
 Spent $700M with Aboriginal businesses in 2018
                 $5 billion since 1999                       Close to 5,000 vendors across Canada and                   Diverse and experienced Board of Directors8
                                                                           1,300 in the US                                          8 out of 9 are independent
  30 Petro-Canada branded retail sites owned or                                                                                      Aboriginal representation
             leased by First Nations                                  ~12,500 Suncor employees
                                                                                                                                         33% are women
 Working with multiple Aboriginal communities on
                                                                                                                         Executive compensation linked to financial,
             DPL7 to support PASS5
                                                                                                                                operational and ESG factors

                                                             1, 2, 3, 4, 5, 6, 7, 8 See Slide Notes and Advisories.
23

Suncor’s tailings reclamation – PASS
PASS technology aims to rapidly dewater and treat tailings to accelerate reclamation and
lower our environmental footprint at a lower cost
Advancing execution, with regulatory approval received October 2017
 Suncor pioneered TRO in 2010
 (Tailings Reduction Operations)

 Removal of MFT1 from tailings pond

 Rapid dewatering of MFT1 with addition of flocculant2
                                                                  Atmospheric drying of MFT1            Reclamation timeframe is extended
 Placement of MFT1 in thin layers for atmospheric drying          takes time and is area limited        due to drying process

 Building on TRO with PASS
 (Permanent Aquatic Storage Structure)

 Addition of coagulant3 to improve water quality

 Placement of tailings below grade, suitable for lake bottom
                                                                   PASS does not result in new
                                                                                                        Reclamation timeframe is reduced
 Capping with aquatic cover (E.g. Demonstration Pit Lake)          disturbed area

 Anticipated benefits of PASS4
   Faster reclamation                    Lower cost                Community engagement               Demonstrated results
               In 2018, PASS doubled tailings treatment capacity to 165% of total annual tailings production

                                                            1, 2, 3, 4 See Slide Notes and Advisories
24

Appendix
25

2019 Capital and production guidance1
                                             2019 Capital2              Economic Investment3                                       Production4
                                                $ millions                          percent                                           boepd

Oil Sands                                     3,050 –     3,400                         17%                       410,000 – 440,000       Oil Sands operations
E&P                                           1,000 –     1,200                         97%                        85,000 – 95,000        Fort Hills
Downstream                                      700 –     775                           23%                       160,000 – 180,000       Syncrude
Corporate                                       150 –     225                           53%                       105,000 – 115,000       E&P
                                                                                                                  430,000 – 450,000       Refinery throughput

 Total                                       $4,900 – $5,600                            37%                       780,000 – 820,000       Upstream production

2019 Planned maintenance for Suncor operated assets and Syncrude5,6

Upstream                     Timing             Impact on quarter                            Downstream                   Timing       Impact on quarter
Firebag                      Q2                 ~30 mbpd                                     Edmonton                     Q2           ~10 mbpd
U1                           Q2                 ~25 mbpd*                                    Commerce City                Q2           ~20 mbpd
Fort Hills                   Q2/Q4              ~15/10 mbpd                                  Montreal                     Q2           ~30 mbpd
U2                           Q3/Q4              ~25/15 mbpd*                                 Sarnia                       Q2           ~15 mbpd
Syncrude6                    Q3/Q4              ~20/20 mbpd

* A portion of the SCO volume impact will be supplemented by increasing bitumen sales

2019 Sensitivities7           +1$/bbl Brent          +$1/bbl NYH 3-2-1                  +$0.01 FX               +$1/GJ AECO           +$1L/H Diff      +$1L/L Diff
                                     (US$)                      (US$)                      (US$/C$)                      (C$)                 (US$)        (US$)

         FFO (C$ MM)                ~240                        ~150                       ~(205)                       ~(240)            ~(25)         ~(20 – 40)

                                                                  1, 2, 3, 4, 5, 6, 7 See Slide Notes and Advisories.
26

High quality mining, in situ and upgrading portfolio1

            In Situ                                                            Mining
               Firebag                                                            Base Plant
               203,000 bpd capacity                                               350,000 bpd capacity
               Suncor working interest 100%                                       Suncor working interest 100%
               2,553 mmbbls 2P reserves1                                          1,418 mmbbls 2P reserves1

               MacKay River                                                       Syncrude
               38,000 bpd capacity                                                Syncrude operated
               Suncor working interest 100%                                       205,600 bpd coking capacity (SU WI)
               508 mmbbls 2P   reserves1                                          Suncor working interest 58.74%
                                                                                  1,272 mmbbls 2P reserves1 (SU WI)

                Future opportunities                                              Fort Hills
                Lewis (SU WI 100%)                                                Suncor operated
                Meadow Creek (SU WI 75%)                                          105,000 bpd capacity (SU WI)
                                                                                  Suncor working interest 54.11%
                                                                                  1,438 mmbbls 2P reserves1 (SU WI)
                                                                                  First oil achieved in January 2018

                                           1 See Slide Notes and Advisories.
27

Focused on long life, low decline reserves base
                                                                    Typical attributes1 of North American oil plays
                                                              Initial         Decline       Sustaining       Operating       Reservoir   Recovery
         Illustrative annual   FFO2   profiles3              capital           rate           costs            cost            risk       factor

Mining                                                        High           Very low          Low            Medium         Very low    Very high

~85% of Suncor’s 2019
guidance production

In Situ                                                      Medium             Low            Low               Low           Low         High

Offshore
                                                              High            Medium         Medium           Very low       Medium      Medium
~15% of Suncor’s 2019
guidance production

Tight oil                                                     Low           Very high         High            Medium           High        Low
                                                  50 Years

                                                                     Beneficial attribute            Challenging attribute

                                                                1, 2, 3 See Slide Notes.
28

Canada’s largest Refining & Marketing business

              Edmonton refinery                                                     Sarnia refinery
              142,000 bpd capacity                                                  85,000 bpd capacity
              100% oil sands feedstock1                                             ~75% oil sands feedstock1

              Commerce City refinery                                                Montreal refinery
              98,000 bpd capacity                                                   137,000 bpd capacity
              ~20% oil sands feedstock1                                             ~30% oil sands feedstock1

              Marketing                                                             Other
              Over 500,000 bpd in product sales                                     4 wind farms3 (111 MW)
              1766 North American retail sites                                      St. Clair Ethanol plant (400 ML/yr)
              (~50% Suncor owned).                                                  51% interest in Parachem
              Petro-Canada remained as the brand                                    Global sulphur and petroleum coke
              with largest urban share of market in                                 marketing
              Canada for 20182
              300+ wholesale sites

                                          1, 2, 3 See Slide Notes and Advisories.
29

Refining & Marketing – Demonstrating cash flow resilience
R&M Funds from operations1                                            WTI – WCS ($US/bbl)         Refinery utilization vs. US average                                                         Suncor
Capturing the value of widening differentials                         FFO ($CAD billions)         Percent of refining capacity
                                                                                                                                                                                              US Average2
                                                                             26.30
                                                                                                                                                        Full turnaround
5

                  25.50                                                                30

                                                                                                    100%                                               at the Edmonton
      21.05                     19.40
                                                                                       20
                                                                                                                                                       refinery Q2 2018
4

                                           13.50     13.85       11.95
                                                                                 3.8   10

       3.2
3

                                            2.9                    2.8                 0

                   2.7                                   2.6                                          90%
2

                                2.3
                                                                                       -10

1
       US$/Cdn$ FX > $0.90
              (2012 – 2014)
                                                                                       -20

0                                                                                      -30

                                                                                                      80%
      2012        2013          2014       2015      2016         2017       2018                              2012      2013       2014        2015        2016        2017      2018 Q1 2019

Price realizations & refinery crude costs3                                                        Realized GM6/bbl vs. NYH 3-2-1 benchmark
All Suncor refineries Q1 2019, 40% equity          feedstock4                                     All Suncor refineries Q1 2019
                                                                                                                                                                                                  36.35
    $120

    $100                                                                                                                                                                  28.65
                              Brent C$84.255
    $80                                                                                                          20.75

                                                                                                     15.55      NYH
    $60
                                                                                                                3-2-1
                                                                    107                              NYH         C$
    $40                                                                                              3-2-1
                     62                      60                                                      US$
    $20

                                                                                                   Benchmark   Benchmark       Crude       Product mix       Yield/       Realized FIFO impact Realized
                                                                                                                                                                                                         7
     $0                                                                                              crack       crack      differential    & location     feedstock/    GM (LIFO) 7           GM (FIFO)
               OS realization           Feedstock cost         R&M realization                                                              differential      other

                                                                          1, 2, 3, 4, 5, 6, 7 See Slide Notes and Advisories.
30

Offshore with >390 million barrels of 2P reserves1

       East Coast Canada                                                                North Sea

            Hibernia
            ExxonMobil operated                                                          Buzzard
            Suncor working interest 20%                                                  CNOOC Petroleum Europe Limited operated
            63 mmboe 2P   reserves1   (Suncor WI)                                        Suncor working interest 29.89%
                                                                                         57 mmboe 2P reserves1 (Suncor WI)

            Hebron
            ExxonMobil operated
            Suncor working interest 21.034%
            31.6 mboepd planned net capacity
                                                                                         Golden Eagle
            147 mmboe 2P reserves1 (Suncor WI)
                                                                                         CNOOC Petroleum Europe Limited operated
            First oil achieved in November 2017
                                                                                         Suncor working interest 26.69%
                                                                                         13 mmboe 2P reserves1 (Suncor WI)

            Terra Nova
            Suncor Energy operated
            Suncor working interest 37.675%
            32 mmboe 2P reserves1 (Suncor WI)
                                                                                         Oda
                                                                                         Spirit Energy operated3
                                                                                         Suncor working interest 30%
                                                                                         11 mboepd planned net capacity
            White Rose                                                                   8 mmboe 2P reserves1 (Suncor WI)
            Husky Energy operated
            Suncor working interest 27.5%2
            54 mmboe 2P reserves1 (Suncor WI)

                                              1, 2, 3 See Slide Notes and Advisories.
31

E&P – Investing in high value, low risk projects

                             Recent performance                                                                   Sanctioned projects1
 mboe/d
                                                                                                             Fenja (Norway)
   120
                                                                                                             • 17.5% working interest
                                                                                                             • 6 mbbls/d anticipated net peak production
   100
                                                                                      Hebron                 • First oil expected 2021
       80                                                                             White Rose

       60                                                                             Hibernia
                                                                                      Terra Nova
       40                                                                                                    Buzzard Phase 2 (UK)
                                                                                      Golden Eagle
       20                                                                                                    • 29.89% working interest
                                                                                      Buzzard
        0
                                                                                                             • Production anticipated to offset natural declines
             2012     2013     2014    2015     2016      2017         2018                                  • First oil expected 2021
            111.70   108.75
                              98.85
                                                                                                             West White Rose Project (ECC4)
$billions
 2.5                                                                          Brent
                                                                                                             • ~26% working interest
                                                                    71.05
                                                       54.25
                                                                              ($US/bbl)                      • 20 mbbls/d anticipated net peak production
                                       52.40
 2.0                                                                                                         • First oil expected 2022
                                               43.75

 1.5
                                                                                     FFO2
                                                                                     Free funds flow3
                                                                                                                  Future opportunities
 1.0
                                                                                     Capital spend
                                                                                                             • Rosebank-UK (40% Suncor WI)
 0.5
                                                                                                             • Near field developments including subsea
   -                                                                                                           tie-backs, field extensions and infill drilling
            2012     2013     2014    2015     2016      2017        2018

                                                                1, 2, 3, 4 See Slide Notes and Advisories.
32

 Track record of counter-cyclical acquisitions and divestments

                                                                                  Non-core UK offshore                                                                    10% Fort Hills WI
$100            WTI US$/bbl                                                                                                                                           1
                                                                                                                                                                          Total E&P Canada
$80                                                                              $
                                                                                                                                                                      2   37% Syncrude WI
                                                                                                                                                                          Canadian Oil Sands
$60                                                                                                                                                               7
                                                       Petro -Canada                                                                                          6
                                                                                                                                    1                     5
                                                                                                                                        2      3
                                                                                                                                                    4
                                                                                                                                                                      3   Rosebank
$40                                                                                                                                                                       30% WI

$20
                                                                                                                                                                      4   5% Syncrude WI
                                                                                                                                                                          Murphy Oil
$40
                NYH 3-2-1 US$/bbl
                                                                                                                    Pioneer retail network                            5
                                                                                                                                                                          3.31% Fort Hills WI
$30                                                                                                                                                                       Total E&P Canada
                                                                                                                 $
$20                                                                                                                                                                       5% Syncrude WI4
          Conoco Commerce       Valero Commerce City                                                                                                                  6   Mocal Energy
            City refinery              refinery
$10
                                                                                                                                                                          17.5% Fenja WI5
                                                         Petro -Canada                                                                                                    Faroe Petroleum
 $0
                                                                                                                                                                      7   Rosebank
 $8                                                                               Colorado, Canadian &                                                                    10% WI6
                AECO US$/gj                                                        Trinidad & Tobago
 $6                                                                                    gas assets
                                                                                   $                          Canadian gas assets
 $4
                                                                                                             $
 $2                                                      Petro -Canada

 $0
         2002     2003   2004     2005    2006    2007      2008    2009      2010      2011     2012     2013     2014      2015       2016        2017      2018

       Other divestments: East Tank Farm1, Lubricants2, wind facilities3                                                                    Acquisition

                                                                                                                                    $       Divestment

                                                                       1, 2, 3, 4, 5, 6 See Slide Notes and Advisories.
33

Notes
34

Notes
35

 Advisories
Forward-Looking Statements – This presentation contains certain          in costs; the ability to access external sources of debt and equity        capital employed (ROCE) and last in, first out (LIFO) – are not
“forward-looking statements” within the meaning of the United States     capital; the timing and the costs of well and pipeline construction;       prescribed by GAAP. All non-GAAP measures presented herein do
Private Securities Litigation Reform Act of 1995 and “forward-looking    Suncor’s dependence on pipeline capacity and other logistical              not have any standardized meaning and therefore are unlikely to be
information” within the meaning of applicable Canadian securities        constraints, which may affect the company’s ability to distribute          comparable to similar measures presented by other companies.
legislation (collectively, “forward-looking statements”), including      products to market; mandatory production curtailments being greater        Therefore, these non-GAAP measures should not be considered in
statements about: Suncor’s strategy and business plans; expected         or imposed for longer than anticipated; the timely receipt of              isolation or as a substitute for measures of performance prepared in
compound annual growth rates, capital expenditures, shareholder          regulatory and other approvals; the timing of sanction decisions and       accordance with GAAP. All non-GAAP measures are included
return growth, WTI break-even, balance sheet leverage metrics, Oil       Board of Directors’ approval; the availability and cost of labour,         because management uses the information to analyze business
Sands decline rate, cost reductions, and operating and financial         services, and infrastructure; the satisfaction by third parties of their   performance, leverage and liquidity and therefore may be
results; reserves estimates and reserve life indices; expected           obligations to Suncor; the impact of royalty, tax, environmental and       considered useful information by investors. See the “Non-GAAP
utilization of assets; expectations for dividends, share repurchases,    other laws or regulations or the interpretations of such laws or           Financial Measures Advisory” section of the Q1 MD&A.
production growth, funds from operations, free funds flow growth,        regulations; applicable political and economic conditions; risks
and ROCE; anticipated impact of changes in crude oil price               associated with existing and potential future lawsuits and regulatory      Funds from operations (previously referred to as cash flow from
differentials; anticipated impact of IMO regulatory changes; potential   actions; improvements in performance of assets; and the timing and         operations) is defined in the Q1 MD&A, for the three months ended
future free funds flow growth projects, including the timing and         impact of technology development.                                          March 31, 2019 is reconciled to the GAAP measure in the Q1
impact thereof, and free funds flow improvement and cash flow                                                                                       MD&A, for 2012 to 2018 is reconciled to GAAP measures in
upside potential; illustrative funds from operations and discretionary   Although Suncor believes that the expectations represented by such         Suncor’s annual management’s discussion and analysis (MD&A) for
free funds flow; target break-even cost of capital; plans around in      forward-looking statements are reasonable, there can be no                 the respective year; annual E&P and R&M funds from operations for
situ growth; cash operating costs targets; Suncor’s GHG intensity        assurance that such expectations will prove to be correct. Suncor’s        2012 to 2017 are reconciled to GAAP measures in Suncor’s annual
reduction goal; estimated average carbon cost for upstream               Management’s Discussion and Analysis for the first quarter ended           MD&A for the respective year; Oil Sands operations cash operating
production; expectations, targets and potential opportunities with       March 31, 2019 and dated May 1, 2019 (the Q1 MD&A), Annual                 costs (previously referred to as Oil Sands cash operating costs) is
respect to Syncrude; expected IRR for Syncrude interconnecting           Report for the year ended December 31, 2018 (the 2018 Annual               defined in the Q1 MD&A, for the year ended December 31, 2018 is
pipeline and tailings management savings; Oil Sands regional             Report) and its most recently filed Annual Information Form/Form           reconciled to the GAAP measure in the 2018 Annual Report, and for
synergy opportunities; expectations for and potential benefits of        40-F and other documents it files from time to time with securities        2013 is reconciled to the GAAP measure in Suncor’s 2013 annual
autonomous haul trucks, and PASS, expectations about Fort Hills;         regulatory authorities describe the risks, uncertainties, material         MD&A; discretionary free funds flow (previously referred to as
capital and production guidance; expected peak production and first      assumptions and other factors that could influence actual results          discretionary free cash flow) is defined in the Q1 MD&A, for 2015 to
oil dates for sanctioned E&P projects; goals with respect to             and such factors are incorporated herein by reference. Copies of           2018 is reconciled to the GAAP measure in Suncor’s 2018 annual
reliability, safety, cost management and sustainability; and potential   these documents are available without charge from Suncor at 150            MD&A, and for 2014 is reconciled to the GAAP measure in Suncor’s
future pipelines and market access expectations that are based on        6th Avenue S.W., Calgary, Alberta T2P 3E3, by calling 1-800-558-           2016 annual MD&A; the estimated impact of the LIFO method for
Suncor’s current expectations, estimates, projections and                9071, or by email request to invest@suncor.com or by referring to          the three months ended March 31, 2019 is defined and reconciled in
assumptions that were made by Suncor in light of its experience and      the company’s profile on SEDAR at www.sedar.com or EDGAR at                the Q1 MD&A; and Fort Hills cash operating costs and Syncrude
its perception of historical trends. Some of the forward-looking         www.sec.gov. Except as required by applicable securities laws,             cash operating costs are defined and reconciled to the GAAP
statements may be identified by words such as “planned”,                 Suncor disclaims any intention or obligation to publicly update or         measures in the Q1 MD&A.
“estimated”, “target”, “goal”, “illustrative”, “strategy”, “expected”,   revise any forward-looking statements, whether as a result of new
“focused”, “opportunities”, “may”, “will”, “outlook”, “anticipated”,     information, future events or otherwise. Suncor’s actual results may       Reserves– Unless noted otherwise, reserves information presented
“potential”, “guidance”, “predicts”, “aims”, “proposed”, “seeking” and   differ materially from those expressed or implied by its forward-          herein for Suncor is presented as Suncor’s working interest
similar expressions. Forward-looking statements are not guarantees       looking statements, so readers are cautioned not to place undue            (operating and non-operating) before deduction of royalties, and
of future performance and involve a number of risks and                  reliance on them.                                                          without including any royalty interests of Suncor, and is at December
uncertainties, some that are similar to other oil and gas companies                                                                                 31, 2018. For more information on Suncor’s reserves, including
and some that are unique to Suncor. Users of this information are        Suncor’s corporate guidance includes a planned production range,           definitions of proved and probable reserves, Suncor’s interest,
cautioned that actual results may differ materially as a result of,      planned maintenance, capital expenditures and other information,           location of the reserves and the product types reasonably expected
among other things, assumptions regarding: commodity prices;             based on our current expectations, estimates, projections and              please see Suncor’s most recent Annual Information Form/Form 40-
timing of commissioning and start-up, cost, characteristics, and         assumptions (collectively, the “Factors”), including those outlined in     F dated February 28th, 2019 available at www.sedar.com and
capacity of capital projects; assumptions contained in or relevant to    our 2019 Corporate Guidance available on                                   www.sec.gov. Reserves data is based upon evaluations conducted
Suncor’s 2019 Corporate Guidance; fluctuations in foreign exchange       www.suncor.com/guidance, which Factors are incorporated herein             by independent qualified reserves evaluators as defined in NI 51-
and interest rates; product supply and demand; market competition;       by reference. Suncor includes forward-looking statements to assist         101.
future production rates; assets and facilities not performing as         readers in understanding the company’s future plans and
anticipated; expected debottlenecks, cost reductions and margin          expectations and the use of such information for other purposes            BOE (Barrels of oil equivalent) – Certain natural gas volumes
improvements not being achieved to the extent anticipated;               may not be appropriate.                                                    have been converted to barrels of oil on the basis of six thousand
dividends declared and share repurchases below expected levels;                                                                                     cubic feet to one boe. This industry convention is not indicative of
the sufficiency of budgeted capital expenditures in carrying out         Non-GAAP Measures – Certain financial measures in this                     relative market values, and thus may be misleading.
planned activities; risks inherent in marketing operations (including    presentation – namely funds from operations, free funds flow, Oil
credit risks); imprecision of reserves estimates and estimates of        Sands operations cash operating costs, discretionary free funds
recoverable quantities of oil, natural gas and liquids from Suncor’s     flow, Syncrude cash operating costs, Fort Hills cash operating costs,
properties; expected synergies and the ability to sustain reductions     In Situ cash operating costs, mining cash operating costs, return on
36

 Slide Notes
Slide 2-------------------------------------------------------------                All dividends are at the discretion of Suncor’s Board of Directors.     Slide 5---------------------------------------------------------------
(1) Market capitalization + debt - cash and cash equivalents.                       See Forward-Looking Statements in the Advisories.                       (1) As at December 31, 2018 and assumes that approximately 7.19
(2) Nameplate capacities as at March 31, 2019. Nameplate capacities           (8) Figure does not include the $43 million worth of shares repurchased             billion barrels of oil equivalent (boe) of proved and probable
      may not be reflective of actual utilization rates. See Forward-               in the twelve months ended December 31, 2015 ($0.03/share                     reserves (2P) are produced at a rate of 628.6 mboe/d, Oil Sands’
      Looking Statements in the Advisories.                                         repurchased in 2015).                                                         average daily production rate in 2018. Reserves are working interest
(3) As at December 31, 2018 and assumes that approximately 7.58               (9) 2017 buyback per share reflects $1.4 billion of actual spend under              before royalties. See Reserves in the Advisories.
      billion barrels of oil equivalent (boe) of proved and probable                the normal course issuer bid (NCIB). 2018 buyback per share             (2) Reflects Oil Sands’ anticipated compounded annual decrease in
      reserves (2P) are produced at a rate of 732.0 mboe/d, Suncor’s                reflects $3.1 billion of actual spend under Suncor’s NCIBs. 2019              production for 2019-2023 and is calculated on a production-
      average daily production rate in 2018. Reserves are working                   buyback per share assumes the repurchase of approximately $2.0                weighted basis using planned production for those years, and
      interest before royalties. See Reserves in the Advisories.                    billion in 2019. Suncor’s Board of Directors has approved the                 assumes no economic capital spend, no acquisitions and no
(4) 1527 retail sites are operated under the Petro-Canada brand.                    repurchase of up to $2.0 billion worth of the company’s common                divestments during that period.
Slide 3--------------------------------------------------------------               shares beginning March 1, 2019. Suncor’s share repurchases are          (3) Refers to Oil Sands operations sustaining capital per barrel, which is
(1) Funds from operations (FFO) is a non-GAAP financial measure.                    opportunistic. The actual number of shares that will be repurchased           calculated by dividing Oil Sands operations sustaining capital by Oil
      See Non-GAAP Measures in the Advisories. Funds from operations                and the timing of any such purchases will be determined by Suncor             Sands operations production, plus Oil Sands operations cash
      is calculated as cash flow provided by operating activities excluding         and will depend on market conditions, funds flow and other factors,           operating costs per barrel, all as indicated in the Q1 MD&A. Oil
      changes in non-cash working capital. FFO indicated for 2019 to                and could differ materially from this assumption. See Forward-                Sands operations cash operating costs is a non-GAAP financial
      2023 is illustrative and is not intended to be a forecast of Suncor’s         Looking Statements in the Advisories.                                         measure. See Non-GAAP Measures in the Advisories.
      FFO. It is indicative of FFO based on the 2019 pricing guidance         (10) Refers to estimated average WTI crude oil price for 2019 in US           (4) Refers to estimated average WTI crude oil price for 2019 in US
      released on May 1, 2019, as well as the production and free funds             dollars required for funds from operations for 2019 to equal                  dollars required for funds from operations for 2019 to equal
      flow growth assumptions outlined below. Actual results may differ             estimated 2019 sustaining capital expenditures inclusive of                   estimated 2019 sustaining capital expenditures inclusive of
      materially. See Forward-Looking Statements in the Advisories.                 associated capitalized interest and dividends. Sustaining capital             associated capitalized interest and dividends. Sustaining capital
(2) Compound annual growth rate (CAGR) is calculated for the years                  represents anticipated asset sustainment and maintenance capital              represents anticipated asset sustainment and maintenance capital
      2018 to 2023 using Suncor’s business plan. Actual results may vary            expenditures plus well pad spend (inclusive of associated                     expenditures plus well pad spend (inclusive of associated
      materially. See Forward-Looking Statements in the Advisories.                 capitalized interest) based on the company’s current business                 capitalized interest) based on the company’s current business
(3) Production growth assumes ~10% CAGR per share from 2018 to                      plans. Assumes production, sustaining capital and business                    plans. Assumes production, sustaining capital and business
      2020 and is calculated using the midpoint of 2019 guidance as well            environment at the midpoint of 2019 guidance released on May 1,               environment at the midpoint of 2019 guidance released on May 1,
      as Suncor’s production growth business plan for 2020. Actual                  2019 and a $0.42/share dividend for each quarter in 2019. All                 2019 and a $0.42/share dividend for each quarter in 2019. All
      production may vary materially. See Forward-Looking Statements in             dividends are at the discretion of Suncor’s Board of Directors.               dividends are at the discretion of Suncor’s Board of Directors. Actual
      the Advisories.                                                               Actual results may differ materially. See Forward-Looking                     results may differ materially. See Forward-Looking Statements in
(4) Free funds flow, previously referred to as free cash flow, is                   Statements in the Advisories.                                                 the Advisories.
      calculated by taking funds from operations (FFO) and subtracting        Slide 4---------------------------------------------------------------        (5) Full guidance is available at suncor.com/guidance. See Forward-
      capital expenditures, including capitalized interest. Free funds flow   (1) Free funds flow, previously referred to as free cash flow, is                   Looking Statements in the Advisories.
      is a non-GAAP measure. See Non-GAAP Measures in the                           calculated by taking funds from operations (FFO) and subtracting        (6) Conversion capacity as at March 31, 2019 and reflects Suncor’s
      Advisories. Illustrative free funds flow growth potential shown               capital expenditures, including capitalized interest. Free funds flow         upgrading and refining capacity. Conversion capacity may not be
      includes possible future opportunities currently being evaluated and          is a non-GAAP measure. See Non-GAAP Measures in the                           reflective of actual utilization rates. See Forward-Looking
      which may be subject to Board of Directors’, counterparty and                 Advisories.                                                                   Statements in the Advisories.
      regulatory approval. There can be no assurance these opportunities      (2) Based on the company’s current business plans and business                (7) Nameplate capacities as at March 31, 2019. Nameplate capacities
      will be pursued or if pursued that they will result in the expected           environment expectations, which are subject to change. Actual                 may not be reflective of actual utilization rates. See Forward-
      benefits. See Forward-Looking Statements in the Advisories.                   results may differ materially. See Forward-Looking Statements in              Looking Statements in the Advisories.
(5) Refers to Trailing Twelve Month average value as at March 31,                   the Advisories.                                                         (8) Free funds flow and discretionary free funds flow are non-GAAP
      2019.                                                                   (3) Funds from operations (FFO) is a non-GAAP financial measure.                    measures. See Non-GAAP Measures in the Advisories.
(6) The classification of the company’s capital expenditures has been               See Non-GAAP Measures in the Advisories. Funds from operations          (9) Funds from operations (FFO) is a non-GAAP financial measure.
      updated to “‘asset sustainment and maintenance’’ and ‘‘economic               is calculated as cash flow provided by operating activities excluding         See Non-GAAP Measures in the Advisories. Funds from operations
      investment’’ to better reflect the types of capital investments being         changes in non-cash working capital.                                          is calculated as cash flow provided by operating activities excluding
      made by the company. Sustaining capital represents asset                (4) Anticipated production growth per share is calculated using the                 changes in non-cash working capital.
      sustainment and maintenance capital expenditures (inclusive of                midpoint of 2019 guidance as well as Suncor’s business plan for         (10) New metrics include the impact for IFRS 16 which came into effect
      associated capitalized interest), which have been restated for April          2020. Actual results may vary materially. See Forward-Looking                 on January 1, 2019.
      1, 2018 to December 31, 2018 to reflect the change in classification.         Statements in the Advisories.                                           (11) All figures are in billions of CAD. U.S dollar facilities converted at a
      For a description of asset sustainment and maintenance capital          (5) Includes possible future opportunities currently being evaluated and            USD/CAD rate of $0.75, the exchange rate as at March 31, 2019.
      expenditures see the Capital Investment Update section of the Q1              which may be subject to Board of Directors’, counterparty and
      MD&A.                                                                         regulatory approval. Assumes the completion of incremental              continued …
(7) Based on the weighted average number of shares outstanding in                   pipeline capacity out of the Alberta market. There can be no
      each year for 2014 to 2018 and the weighted average number of                 assurance these opportunities will be pursued or if pursued that they
      shares outstanding for the three months ending March 31, 2019 for             will result in the expected benefits. See Forward-Looking
      2019. 2019 dividend amount assumes $0.42/share for each quarter.              Statements in the Advisories.
37

  Slide Notes (continued)
Slide 6---------------------------------------------------------------        Slide 9-------------------------------------------------------------              respective year. The WTI pricing for 2019 is based on Corporate
(1) Expected opex savings are upon full implementation and are                (1) Based on current business plans and business environment                      Guidance issued May 1, 2019.
      based on current plans and business environment expectations,                 expectations including completion of incremental pipeline capacity    (4) The NYH 3-2-1 benchmark numbers for 2015-2018 are actual
      which are subject to change. See Forward-Looking Statements in                out of the Alberta market. Includes projects subject to Board of            averages for each respective year. The 2019 price is based on
      the Advisories.                                                               Directors’, counterparty and regulatory approval. Actual results            Corporate Guidance issued May 1, 2019.
(2) Annualized dividend increases for 17 years assumes $0.42/share                  and breakeven cost of capital may differ materially from this         (5) Illustrative FFO is not intended to be a forecast of Suncor’s FFO.
      dividend for each quarter in 2019. All dividends are at the                   target. See Forward-Looking Statements in the Advisories.                   It is indicative of FFO based on the midpoint of 2019 guidance
      discretion of Suncor’s Board of Directors. See Forward-Looking          (2) Gross project volume including CNOOC International's 25%                      released on May 1, 2019. Also based on continued industry
      Statements in the Advisories.                                                 interest in Meadow Creek.                                                   growth fundamentals. Actual results may differ materially. See
Slide 7--------------------------------------------------------------         (3) Refers to Other Six Lease Operators (OSLO).                                   Forward-Looking Statements in the Advisories.
(1) Based on current business plans, which are subject to change.             Slide 10--------------------------------------------------------------      (6) 2019 sustaining capital represents anticipated asset sustainment
      See Forward-Looking Statements in the Advisories.                       (1) Refers to Oil Sands operations cash operating costs per barrel,               and estimated maintenance capital expenditures (inclusive of
(2) Baseline funds from operations (FFO) has been derived from                      which is a non-GAAP measure. See Non-GAAP Measures in the                   associated capitalized interest) based on the company’s current
      midpoint of 2019 guidance and the associated business                         Advisories.                                                                 business plans. Actual sustaining capital expenditures and
      environment. Sensitivities are based on changing a single factor        (2) Refers to Mining cash operating costs per barrel, which is a non-             associated capitalized interest along with the company’s business
      by its indicated range while holding the rest constant. FFO is a              GAAP measure, and is calculated by taking the sum of OS&G                   plans may differ materially from those anticipated and are subject
      non-GAAP financial measure and is calculated as cash flow                     expenses (a GAAP measure) for Oil Sands, subtracting costs that             to Board of Directors’ approval. For a description of asset
      provided by operating activities excluding changes in non-cash                are not directly attributed to Oil Sands operations Mining bitumen          sustainment and maintenance capital expenditures see the
      working capital. See Non-GAAP Measures in the Advisories.                     production, and dividing the resulting figure by Oil Sands                  Capital Investment Update section of the Q1 MD&A. See
(3) Based on 2018 full year production and planned volumes for                      operations Mining bitumen production, as indicated for the                  Forward-Looking Statements in the Advisories.
      2020. Actual production may vary materially. See Forward-                     applicable year in the Supplemental Financial and Operating           (7) Assumes 2019 quarterly dividend of $0.42/share. All dividends
      Looking Statements in the Advisories.                                         Information in the 2018 Annual Report and Suncor’s Annual                   are at the discretion of Suncor’s Board of Directors. See Forward-
(4) Dividends and future buybacks (NCIBs) are at the discretion of                  Report for the year ended December 31, 2017 (the 2017 Annual                Looking Statements in the Advisories.
      Suncor’s Board of Directors. NCIBs are subject to maximum limits              Report). See Non-GAAP Measures in the Advisories.                     Slide 12-------------------------------------------------------------
      permitted by law and stock exchange rules. See Forward-Looking          (3) Refers to In situ cash operating costs per barrel, which is a non-      (1) Annualized dividend increases for 17 years assumes $0.42/share
      Statements in the Advisories.                                                 GAAP measure, and is calculated by taking the sum of OS&G                   dividend for each quarter in 2019. All dividends are at the
(5) Funds from operations (FFO) is a non-GAAP financial measure                     expenses (a GAAP measure) for Oil Sands, subtracting costs that             discretion of Suncor’s Board of Directors. See Forward-Looking
      and is calculated as cash flow provided by operating activities               are not directly attributed to Oil Sands operations In situ bitumen         Statements in the Advisories.
      excluding changes in non-cash working capital. See Non-GAAP                   production, and dividing the resulting figure by Oil Sands            (2) 2019 buyback per share assumes $2.0 billion of share
      Measures in the Advisories.                                                   operations In situ bitumen production, as indicated for the                 repurchases in 2019. Suncor’s Board of Directors has approved
(6) Sustaining capital represents anticipated asset sustainment and                 applicable year in the Supplemental Financial and Operating                 the repurchase of up to $2.0 billion worth of its common shares
      maintenance capital expenditures (inclusive of associated                     Information in the 2018 Annual Report. See Non-GAAP Measures                beginning March 1, 2019. Suncor’s share repurchases are
      capitalized interest) based on the company’s current business                 in the Advisories.                                                          opportunistic. The actual number of shares that will be
      plans. See Non-GAAP Measures in the Advisories.                         (4) Refers to Oil Sands operations cash operating costs, Fort Hills               repurchased and the timing of any such purchases will be
Slide 8---------------------------------------------------------------              cash operating costs and Syncrude cash operating costs, which               determined by Suncor and will depend on market conditions,
(1) Based on possible future opportunities, including examples shown                are non-GAAP measures. See Non-GAAP Measures in the                         funds flow and other factors, and could differ materially from this
      on the slide, currently being evaluated and which may be subject              Advisories. Targets based on current business plans and                     assumption. See Forward-Looking Statements in the Advisories.
      to Board of Directors’, counterparty and regulatory approval.                 business environment expectations. Actual results may differ          (3) Refers to approximately $5 billion of shares repurchased under
      There can be no assurance these opportunities will be pursued or              materially from these targets. See Forward-Looking Statements in            Suncor’s normal course issuer bid (NCIB) programs from May 2,
      if pursued that they will result in the expected benefits. See                the Advisories.                                                             2017 to December 31, 2018.
      Forward-Looking Statements in the Advisories.                           Slide 11--------------------------------------------------------------      (4) Refers to Suncor’s announced share repurchase program of $2.0
(2) Free funds flow, previously referred to as free cash flow, is             (1) Discretionary free funds flow, previously referred to as                      billion, effective March 1, 2019. Suncor’s share repurchases are
      calculated by taking funds from operations (FFO) and subtracting              discretionary free cash flow, is calculated by taking funds from            opportunistic. The actual number of shares that will be
      capital expenditures, including capitalized interest. Free funds flow         operations (FFO) and subtracting sustaining capital, inclusive of           repurchased and the timing of any such purchases will be
      is a non-GAAP measure. See Non-GAAP Measures in the                           associated capitalized interest, and dividends. Discretionary free          determined by Suncor and will depend on market conditions,
      Advisories.                                                                   funds flow is a non-GAAP measure. See Non-GAAP Measures in                  funds flow and other factors, and could differ materially from this
(3) Based on company’s current business plans and the current                       the Advisories.                                                             amount. See Forward-Looking Statements in the Advisories.
      business environment, which are subject to change. Actual results       (2) Funds from operations (FFO) is defined as cash flow provided by
      may differ materially. See Forward-Looking Statements in the                  operating activities excluding changes in non-cash working            continued …
      Advisories.                                                                   capital. Funds from operations is a non-GAAP financial measure.
(4) Refers to Autonomous Haulage Systems (AHS).                                     See Non-GAAP Measures in the Advisories.
(5) Refers to Permanent Aquatic Storage Structure (PASS).                     (3) WTI pricing for 2015-2018 are actual averages for each
You can also read