AGM Presentation 9 September 2016 - This presentation is for one-on-one use with non-US professional investors only - Polar Capital Technology ...
←
→
Page content transcription
If your browser does not render page correctly, please read the page content below

AGM Presentation
9 September 2016

 This presentation is for one-on-one use with non-US professional investors only
 www.polarcapital.co.uk
Results As At 30 April 2016

                                                                       Year ended                Year ended    Change
                                                                        30/04/15                  30/04/16      (y/y)

                Net Assets                                           £793,019,000               £801,307,000   +1.0%

                NAV per ordinary share                                   599.25p                    605.51p    + 1.0%

                Price per ordinary share                                 592.00p                    566.00p    - 4.4%

                Benchmark Change                                                                               - 0.1%

                Ordinary shares in issue                              132,336,159               132,336,159      --

                GBP / USD                                                   1.53                      1.46     -5.0%

Source: Polar Capital, 30 April 2016.

For non-US investor use only. Please refer to the Important Information at the end of this presentation.                2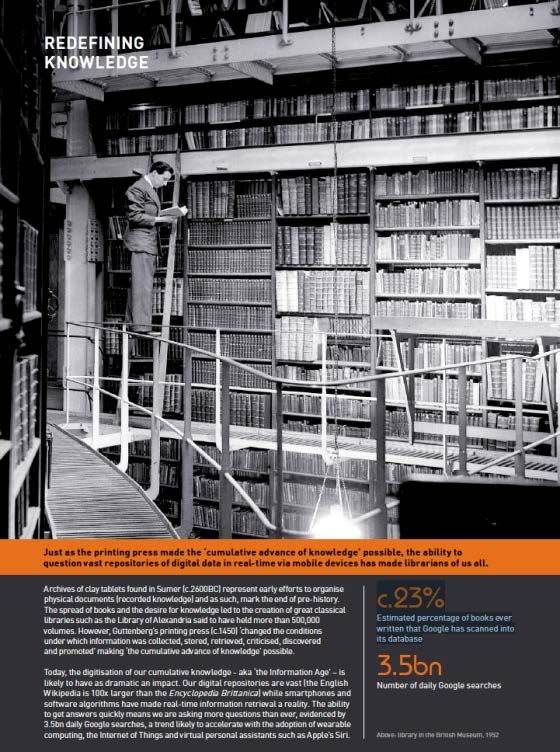
PCT As At 31 August 2016

                                                                       Year ended                Year ended    Change       As at
                                                                                                                                          FYTD
                                                                        30/04/15                  30/04/16      (y/y)      31/08/16

                Net Assets                                           £793,019,000               £801,307,000   +1.0%    £1,043,014,000   +30.2%

                NAV per ordinary share                                   599.25p                    605.51p    + 1.0%      788.16p       + 30.2%

                Price per ordinary share                                 592.00p                    566.00p    - 4.4%      731.50p       +29.2%

                Benchmark Change                                                                               - 0.1%                    +27.6%

                Ordinary shares in issue                              132,336,159               132,336,159      --      132,336,159       --

                GBP / USD                                                   1.53                      1.46     -5.0%         1.31        -10.2%

Source: Polar Capital, 31 August 2016.

For non-US investor use only. Please refer to the Important Information at the end of this presentation.                                           3
Full Year Review

DJ World Technology vs. FTSE World TR since Apr 2015                                                            • Global equities (FTSE World + 0.4%)
                                                                                                                  consolidated earlier gains amid downward
                                                                                                                  revisions to global growth, commodity
                                                                                                                  price weakness and Chinese economic
                                                                                                                  deceleration.

                                                                                                                • However, Sterling weakness (-5%/-7%/-
                                                                                                                  15% vs. Dollar / Euro / Yen) was a key
                                                                                                                  contributor to returns.

                                                                                                                • Technology stocks underperformed
                                                                                                                  modestly (DJ World Tech -0.1% in Sterling
                                                                                                                  terms) due to the underperformance of a
                                                                                                                  number of large legacy companies
                                                                                                                  including Apple, IBM and Qualcomm.

Source: Bloomberg, Data relates to Polar Capital Technology Trust (PCT) fiscal year, Chart as at 31 August 2016. It should not be assumed that recommendations made in future will be profitable or will equal
performance of the securities in this document. A list of all recommendations made within the immediately preceding 12 months is available upon request.

For non-US investor use only. Please refer to the Important Information at the end of this presentation.                                                                                                         4
Full Year Review

US technology small caps vs. large caps since Apr 2015                                                          • Small-cap US technology stocks
                                                                                                                  underperformed during the year (-0.2%
                                                                                                                  vs. 1.7%) ameliorated by a strong April.

                                                                                                                • NAV performance (+1.0%) exceeded the
                                                                                                                  benchmark by 1.1%.

                                                                                                                • New technology cycle appeared to have
                                                                                                                  entered a more pernicious phase,
                                                                                                                  although diverging fundamentals
                                                                                                                  continued to be obscured by next-
                                                                                                                  generation valuation compression.

Source: Bloomberg, Data relates to PCT fiscal year, Chart as at 31 August 2016. It should not be assumed that recommendations made in future will be profitable or will equal performance of the securities in this
document. A list of all recommendations made within the immediately preceding 12 months is available upon request.

For non-US investor use only. Please refer to the Important Information at the end of this presentation.                                                                                                              5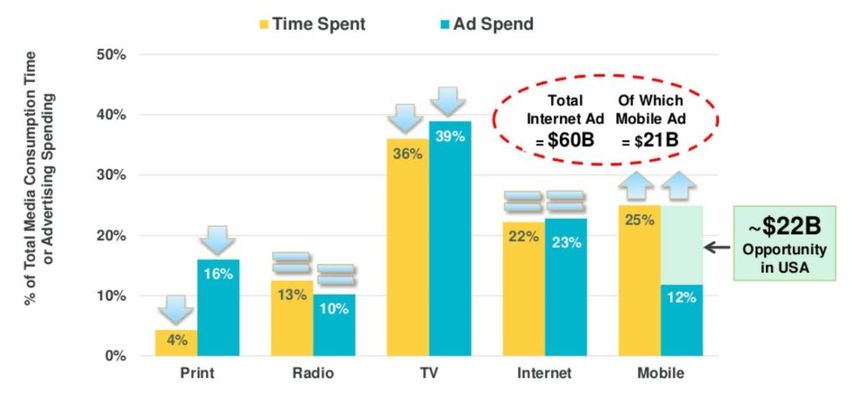
Current FY To Date

PCT NAV vs. FTSE World since Apr 2016                                                                           • Strong NAV progress (+30.2%) aided by
                                                                                                                  pronounced Sterling weakness (-10% /
                                                                                                                  -13% / -8% vs. USD / JPY / Euro) and
                                                                                                                  further equity market gains.

                                                                                                                • Technology stocks regained their prior
                                                                                                                  fiscal year underperformance led by
                                                                                                                  small caps

                                                                                                                • Relative performance has remained
                                                                                                                  positive (>2.5% ahead of benchmark)
                                                                                                                  aided by heightened M&A activity with
                                                                                                                  five holdings acquired since April
                                                                                                                    – QlikTech, LinkedIn, Demandware, Linear Technology,
                                                                                                                      Netsuite

Source: Bloomberg, Data relates to PCT fiscal year, Chart as at 31 August 2016. It should not be assumed that recommendations made in future will be profitable or will equal performance of the securities in this
document. A list of all recommendations made within the immediately preceding 12 months is available upon request.

For non-US investor use only. Please refer to the Important Information at the end of this presentation.                                                                                                              6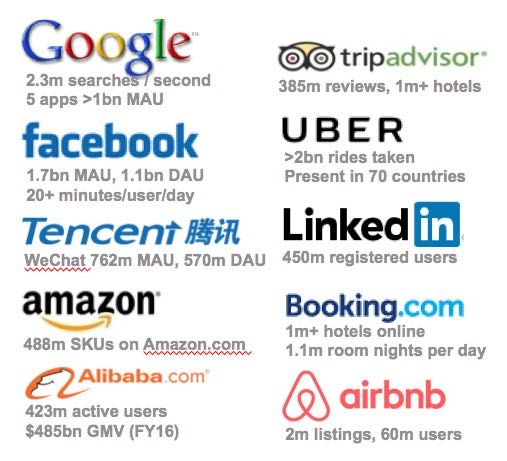
Revisiting Highs (But This Time With Earnings)

PCT share price performance (1997 – present)

                                                                                                                          June 2016
         March 2000                                                                                        S&P Tech earnings: $34.78
         S&P Tech earnings: $13.09                                                                                          PE: 21x
         PE: 70x

                                                                                                                        PCT in Sterling
                                                                                                                      PCT in US Dollars

Source: Bloomberg, 24 August 2016; NDR, July 2016.

For non-US investor use only. Please refer to the Important Information at the end of this presentation.                                  7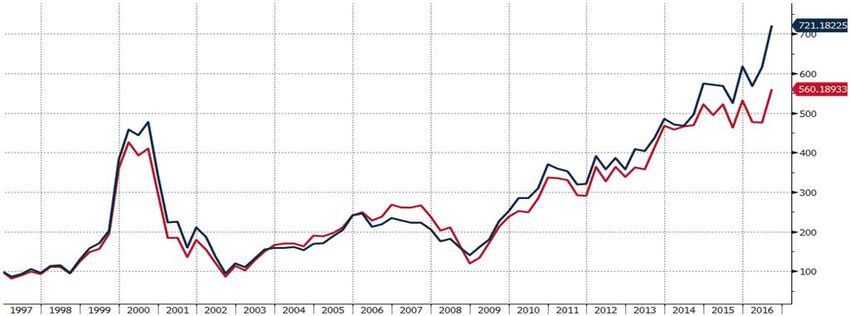
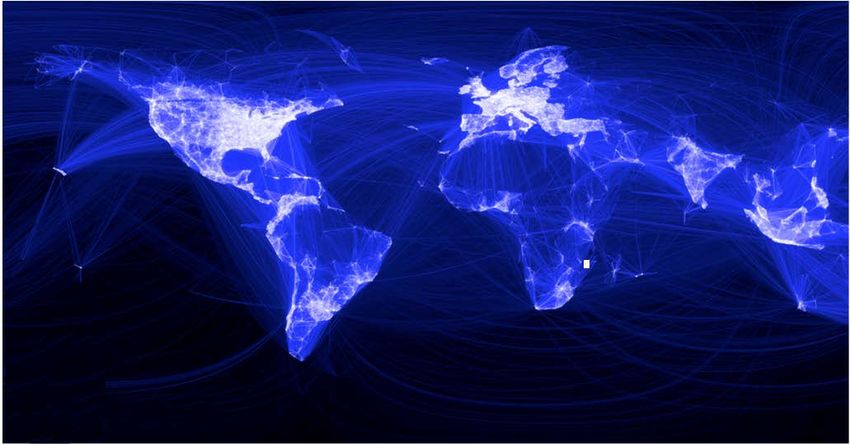
The Internet (At 25)

Source: Facebook.

For non-US investor use only. Please refer to the Important Information at the end of this presentation.   8
The Internet (At 25)

                           In 1995, 40,000
    Google queries are                                                                                 Internet traffic will reach 1.1
    searched and >2m emails                                                                                 zettabytes in 2016
    are sent
                                                                                                                      4.7bn Web pages*

                                                                       The number of connected devices will be >3x the
                                                                                            global population by 2020

Source: Facebook; internetlivestats.com; livescience.com; Cisco; IDC, March 2016.

For non-US investor use only. Please refer to the Important Information at the end of this presentation.                                 9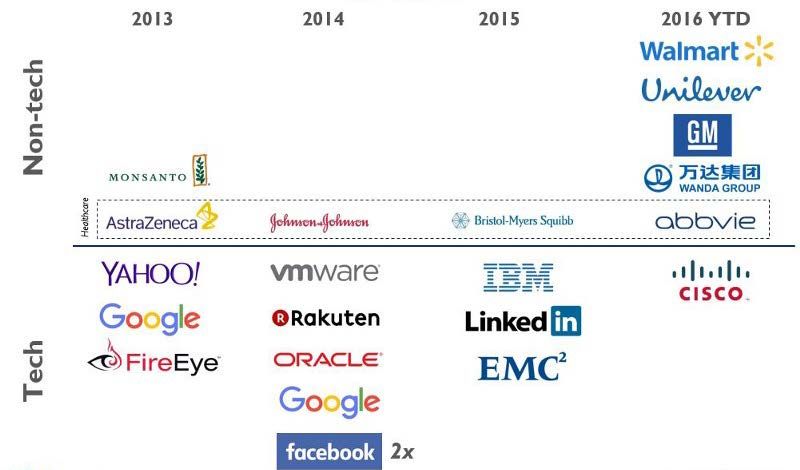
Deflation: Cost Of Bandwidth

The cost of 1,000Mbps of bandwidth

Source: KPCB, Deloitte, May 2014.

For non-US investor use only. Please refer to the Important Information at the end of this presentation.   10
Deflation: Cost Of Computing

The cost of 1m transistors

Source: KPCB, Deloitte, May 2014.

For non-US investor use only. Please refer to the Important Information at the end of this presentation.   11
Deflation: Cost Of Storage

The cost of storing one gigabyte of data

Source: KPCB, Deloitte, May 2014.

For non-US investor use only. Please refer to the Important Information at the end of this presentation.   12
Ubiquitous Computing

                                                                                                           ‒ PCT 2012

Source: Polar Capital.

For non-US investor use only. Please refer to the Important Information at the end of this presentation.                13
Ubiquitous Computing
Smartphone installed base: 2008 – 2017E
Smartphone penetration
has transformed the value
of the Internet
(Metcalfe’s Law)
Source: Statista, August 2016. All opinions and estimates constitute the best judgment of Polar Capital as of the date hereof, but are subject to change without notice, and do not necessarily represent the views of
Polar Capital.
For non-US investor use only. Please refer to the Important Information at the end of this presentation. 14Ubiquitous Computing
Cumulative number of apps downloaded from Apple Apps Store (bn)
Cumulative
payments to iOS
developers of $50bn
Source: Statista, 2016.
For non-US investor use only. Please refer to the Important Information at the end of this presentation. 15Ubiquitous Computing
Millennial smartphone behaviours, US 2014
Source: KPCB, 2015.
For non-US investor use only. Please refer to the Important Information at the end of this presentation. 16Cloud Computing (‘mass production of IT’)
‒ PCT 2011
Source: Polar Capital.
For non-US investor use only. Please refer to the Important Information at the end of this presentation. 17Cloud Computing (‘mass production of IT’)
IT workloads in public clouds, by company size
30%
25%
20%
15%
10%
5%
0%
End of 2013 End of 2014 End of 2015
Under US$5bn in Revenue Over US$5bn in Revenue
Source: Morgan Stanley, 2015.
For non-US investor use only. Please refer to the Important Information at the end of this presentation. 18Big Data
Volume of data stored (Zettabytes): 2009 – 2025E
180
Every day we create
2.5bn gigabytes of data*
The amount of data in
the world doubles
every 2 years**
0.8
2009 2025
Source: Polar Capital; IDC, March 2016. All opinions and estimates constitute the best judgment of Polar Capital as of the date hereof, but are subject to change without notice, and do not necessarily represent
the views of Polar Capital.
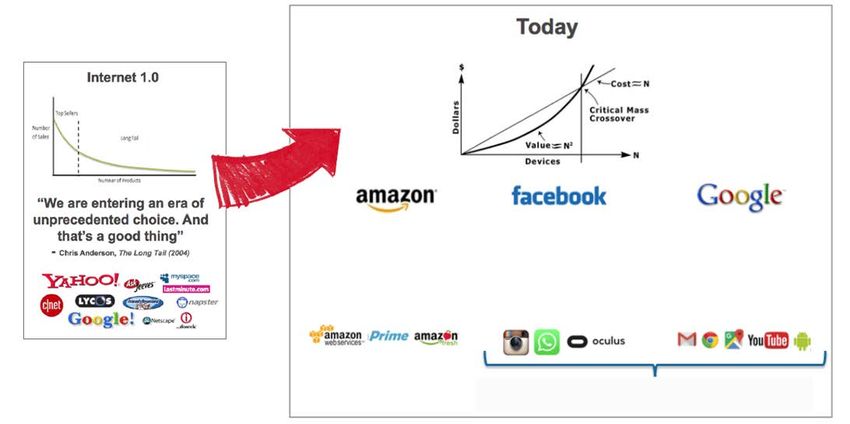
For non-US investor use only. Please refer to the Important Information at the end of this presentation. 19Low-innovation Internet Era.....??
A hundred years from now, we might look back
on the late 20th and early 21st centuries and
say, “It was an actively creative society. Then
the internet happened and everything got put
on hold for a generation.”
– Neal Stephenson
“Has the ideas machine broken down?”
– The Economist
“When will this low-innovation
internet era end?”
– Wired
“We wanted flying cars, instead
we got 140 characters”
– Peter Thiel
Source: worldpolicy.org.
For non-US investor use only. Please refer to the Important Information at the end of this presentation. 20The Information Age
‒ PCT 2014
Source: Polar Capital.
For non-US investor use only. Please refer to the Important Information at the end of this presentation. 21The Information Age
Number of annual Google searches (bn)
Source: Polar Capital, Business Insider 2013. All opinions and estimates constitute the best judgment of Polar Capital as of the date hereof, but are subject to change without notice, and do not necessarily
represent the views of Polar Capital.
For non-US investor use only. Please refer to the Important Information at the end of this presentation. 22The Information Age
Number of manuscripts / books produced in Europe: 500 - 1800
500,000,000
50,000,000
5,000,000
500,000
50,000
5,000
6th 7th 8th 9th 10th 11th 12th 13th 14th 15th 16th 17th 18th
Source: Polar Capital, Business Insider 2013, www.socialhistory.org.
For non-US investor use only. Please refer to the Important Information at the end of this presentation. 23The Information Age
Number of manuscripts / books produced in Europe: 500 - 1800
500,000,000
"Every single day 15% of the questions
50,000,000
people ask of Google are (ones) we've
never seen before”
5,000,000
500,000
50,000
5,000
6th 7th 8th 9th 10th 11th 12th 13th 14th 15th 16th 17th 18th
Source: Polar Capital, Business Insider 2013.
For non-US investor use only. Please refer to the Important Information at the end of this presentation. 24Big Data
‒ PCT 2013
Source: Polar Capital.
For non-US investor use only. Please refer to the Important Information at the end of this presentation. 25Big Data
“Ten years from now, when we look back at
how this era of big data evolved... We will be
stunned at how uninformed we used to be
when we made decisions”
‒ Billy Bosworth, CEO DataStax
Source: KPCB, 2015.
For non-US investor use only. Please refer to the Important Information at the end of this presentation. 26Disruptive New Networks / Unprecedented Scale Centralised, decentralised and distributed networks1 Source: 1. RAND corporation, ‘Where wizards stay up late’’ Other sources: LinkedIn, Statista, June 2016; Amazon, ExportX, December 2015; Alibaba, DMR, August 2016, revenuesandprofits.com, May 2016; Tencent, Statista, March 2016, expandedramblings.com, November 2015; TripAdvisor, June 2016; Facebook, zephoria.com, July 2015 / July 2016; Google, Hellas, July 2016; Booking.com, August 2016; Airbnb, expandedramblings.com, February / June 2016. The stocks represented herein do not reflect the entire holdings contained within the Fund. It should not be assumed that recommendations made in future will be profitable or will equal performance of the securities in this document. A list of all recommendations made within the immediately preceding 12 months is available upon request. For non-US investor use only. Please refer to the Important Information at the end of this presentation. 27
Natural monopolies being created?

                                                                        • 310m active users                                                                             • $74bn revenue in 2015
                                                                        • 63m Prime members                                                                             • 63% US search share
                                                                        • 20m items eligible for Prime                                                                  • 95% US smartphone paid
                                                                        • >350m total products offered                                                                  search clicks in Q1
                                                                        • Paid units grew 28% in Q2                                                                     • $12.3bn R&D spend (2015)
                                                                        • AWS @ $10bn trailing revs

                                                                                                                           76% of incremental US online advertising spend in 2015
                                                                                                                                   was captured by Google and Facebook

• Amazon: 1. Statista, Q1’16. 2. CIRP, Fortune July 16. 3. http://expandedramblings.com/index.php/amazon-statistics 4. 360pi, June 16. 5. Coburn, Amazon.
• Facebook: theatlantic.com
• Google: 1. http://www.statista.com/statistics/266206/googles-annual-global-revenue/ 2. Statista, July 2016 3. Searchengineland, Q116. 4. https://www.statista.com/topics/1001/google/
• 76% - KPCB, 2016
The stocks represented herein do not reflect the entire holdings contained within the Fund. t should not be assumed that recommendations made in future will be profitable or will equal performance of the
securities in this document. A list of all recommendations made within the immediately preceding 12 months is available upon request.

For non-US investor use only. Please refer to the Important Information at the end of this presentation.                                                                                                      28
Accelerating Pace Of Adoption Average company lifespan on S&P 500 index (in years) Source: innosight.com. For non-US investor use only. Please refer to the Important Information at the end of this presentation. 29
Accelerating Pace Of Adoption

Technology adoption (1900 – 2005)

Source: Michael Felton, New York Times, 2013.

For non-US investor use only. Please refer to the Important Information at the end of this presentation.   30
Accelerating Pace Of Adoption

Top 5 publicly traded companies (by market cap): 2001 – 2016

Source: visualcapitalist.com. The stocks represented herein do not reflect the entire holdings contained within the Fund. t should not be assumed that recommendations made in future will be profitable or will
equal performance of the securities in this document. A list of all recommendations made within the immediately preceding 12 months is available upon request.

For non-US investor use only. Please refer to the Important Information at the end of this presentation.                                                                                                           31
Accelerating Pace Of Adoption

Buyers of $1bn+ VC-backed US companies: Tech vs. Non-tech

Source: visualcapitalist.com. The stocks represented herein do not reflect the entire holdings contained within the Fund. It should not be assumed that recommendations made in future will be profitable or will equal
performance of the securities in this document. A list of all recommendations made within the immediately preceding 12 months is available upon request.

For non-US investor use only. Please refer to the Important Information at the end of this presentation.                                                                                                              32
Enterprise Computing Becoming Anachronistic

IT spending: Information Processing Equipment as % of GDP: 1945-present

Source: NDR June 2016.

For non-US investor use only. Please refer to the Important Information at the end of this presentation.   33
Enterprise Computing Becoming Anachronistic

      Modest IT Spending                                          +           Budget Reallocation =                                                        GDP + Growth?
                                                                                                                                                                     Rev.           Rev.            Rev.
                                                                                 2016 IT priorities                                                                 Growth         Growth          Growth
                                                                                                                                                                     20142          20152          2016E2

          1.5%
      in constant-currency
                                                                             1.
                                                                             2.
                                                                             3.
                                                                             4.
                                                                             5.
                                                                                   BI / Analytics
                                                                                   Infrastructure / Data Centre
                                                                                   Cloud
                                                                                   ERP
                                                                                   Digital Marketing
                                                                                                                                                 Cisco
                                                                                                                                                 EMC
                                                                                                                                                 HP
                                                                                                                                                                       -1%
                                                                                                                                                                       5%
                                                                                                                                                                       -1%
                                                                                                                                                                                      4%
                                                                                                                                                                                      1%
                                                                                                                                                                                     -15%
                                                                                                                                                                                                      -1%
                                                                                                                                                                                                      -1%
                                                                                                                                                                                                      5%*
                                                                                                                                                 Intel                 6%             -1%             4%
                                                                             6.    Mobile
          (0.0% in USD)                                                      7.    Security                                                      Microsoft            12%             -2%             1%
     Estimated IT spending                                                   8.    Networking                                                    Oracle                3%             -4%             1%
                                                                             9.    Legacy Modernization
         growth in 20161                                                     10.   Industry-specific Apps
                                                                                                                                                 SAP                   4%             19%             5%
                                                                                                                                                 IBM                   -7%           -12%             -3%

Source: 1. Gartner, July 2016. 2. Bloomberg, August 2016. *HP INC and Hewlett Packard Enterprise combined.
 It should not be assumed that recommendations made in future will be profitable or will equal performance of the securities in this document. A list of all recommendations made within the immediately preceding
12 months is available upon request. All opinions and estimates constitute the best judgment of Polar Capital as of the date hereof, but are subject to change without notice, and do not necessarily represent the
views of Polar Capital. Forecasts contained herein are for illustrative purposes only and does not constitute advice or a recommendation.

For non-US investor use only. Please refer to the Important Information at the end of this presentation.                                                                                                              34
Device Exhaustion • Overall device market will contract for the first time this year –> end user spend falling 0.5% y/y in c/c to $719bn in 2016E1 • 2015 was the worst yet for the PC market (2015: $200bn) with units and revenues declining 10% and 13% y/y respectively2 • Elsewhere, the tablet (2015: $60bn) units expected to contract by 5% this year after declining 8% in 20153 • Smartphone units are expected to increase only 7% this year while ASPs will continue to decline now penetration is c. 79%4 PC shipments: 1997 - 20155 Sample Holdings Source: Polar Capital unless otherwise stated. 1. Gartner, December 2015. 2. Goldman Sachs, January 2016, IDC January 2016. 3. Goldman Sachs, JPMorgan, January 2016. 4. Gartner, June 2016. 5. IDC, December 2015. It should not be assumed that recommendations made in future will be profitable or will equal performance of the securities in this document. A list of all recommendations made within the immediately preceding 12 months is available upon request. For non-US investor use only. Please refer to the Important Information at the end of this presentation. 35
Device Exhaustion
• Overall device market will contract for the first time this year –> end user spend falling 0.5% y/y in c/c to $719bn in 2016E1
• 2015 was the worst yet for the PC market (2015: $200bn) with units and revenues declining 10% and 13% y/y respectively2
• Elsewhere, the tablet (2015: $60bn) units expected to contract by 5% this year after declining 8% in 20153
• Smartphone units are expected to increase only 7% this year while ASPs will continue to decline now penetration is c. 79%4

Smartphone users / penetration: 2013 – 2018E5

Sample
Holdings
 Source: Polar Capital unless otherwise stated. 1. Gartner , December 2015. 2. Goldman Sachs, January 2016, IDC January 2016. 3. Goldman Sachs, JPMorgan, January 2016 4. Gartner, June 2016.
 5. eMarketeer, December 2014. It should not be assumed that recommendations made in future will be profitable or will equal performance of the securities in this document. A list of all recommendations made
 within the immediately preceding 12 months is available upon request. All opinions and estimates constitute the best judgment of Polar Capital as of the date hereof, but are subject to change without notice, and
 do not necessarily represent the views of Polar Capital.

For non-US investor use only. Please refer to the Important Information at the end of this presentation.                                                                                                               36
Cloud Became “inevitable” During 2015…
• Public cloud computing leader Amazon Web Services at c. $10bn of trailing twelve month sales (with operating margins > 20%)
• Growing number of traditional companies prepared to go ‘all in’ / evangelise the merits of public cloud computing during 2015
    – GE: move 60% of its workloads to the Cloud by 2020, close 30/34 datacentres and migrate half of their 9000 applications1
    – “The Cloud has gone from the probable to the inevitable” – Jim Fowler, GE CEO2
• Why now? Mobile centric computing, superior economics, broader reach, major risks addressed (security, vendor lock-in)
AWS: Trailing 12 month sales / operating margin3
     35%                                                                                                                                                                                3500
                                                                      AWS Sales and Operating Margin
     30%                      AWS Net Sales (US$ m; RHS)                                                                                                                                3000
                              AWS Operating Margin
     25%                                                                                                                                                                                2500

     20%                                                                                                                                                                                2000

     15%                                                                                                                                                                                1500

     10%                                                                                                                                                                                1000

      5%                                                                                                                                                                                500

      0%                                                                                                                                                                                0
                Q1 2014          Q2 2014          Q3 2014          Q4 2014          Q1 2015          Q2 2015         Q3 2015          Q4 2015          Q1 2016          Q2 2016

Sample
Holdings

 Source: Polar Capital unless otherwise stated. 1. Amazon, October 2015 2. Amazon, October 2015 3. Amazon, July 2016. It should not be assumed that recommendations made in future will be profitable or will equal
 performance of the securities in this document. A list of all recommendations made within the immediately preceding 12 months is available upon request.

For non-US investor use only. Please refer to the Important Information at the end of this presentation.                                                                                                      37
…And Disruption Only Just Beginning • Having debunked many of the earlier barriers to adoption, we expect Cloud migration to accelerate over the coming years. • Computing / storage costs headed lower: Amazon Web Services (AWS) has lowered prices 51 times since launch1 • Expect ‘all’ incremental capacity added beyond the enterprise: traditional IT budgets contract as Cloud c. 50% of spend by 20192 • Cloud deflation likely to be felt throughout the IT stack while pressuring pricing / volume in the $866bn IT services / BPO market3 Likely Cloud disruption within the IT stack (ISI) 4 Sample Holdings Source: Polar Capital unless otherwise stated. 1. Amazon, January 2016. 2. Deutsche Bank, January 2016. 3. BNP, Gartner, July 2016. 4. ISI, January 2016. It should not be assumed that recommendations made in future will be profitable or will equal performance of the securities in this document. A list of all recommendations made within the immediately preceding 12 months is available upon request. For non-US investor use only. Please refer to the Important Information at the end of this presentation. 38
Diminished Value Of Incumbency M&A
Technology M&A since 20061 Select M&A activity2
Date Target Acquirer Premium Value $m
May-12 Ariba SAP 19% 4,324
Aug-12 Kenexa IBM 42% 1,260
Oct -12 OPNET Riverbed 31% 912
June-13 ExactTarget Salesforce 50% 2,419
Jul -13 Sourcefire Cisco 29% 2,185
Dec-13 Responsys Oracle 38% 1,438
Dec-13 LSI Avago 41% 5,596
Sept-14 Concur SAP 28% 7,241
Nov-14 Sapient Publicis 70% 3,264
Feb-15 Freescale NXP 2% 17,469
Apr-15 Informatica PE consortium 11% 4,784
May-15 Broadcom Avago 17% 29,805
May-15 Altera Intel 18% 14,354
Oct-15 KLA-Tencor Lam Research 27% 10,955
Oct-15 EMC Dell 33% 63,491
Nov-15 King Digital Activision Blizzard 16% 4,881
Apr-16 Ruckus Wireless Brocade 45% 1,044
Apr-16 Cvent Vista Equity 68% 1,408
Jun-16 QLIK Technologies Thoma Bravo (PE) 5% 2,899
Jun-16 LinkedIn Microsoft 50% 26,401
Jun-16 Demandware Salesforce 56% 2,779
Jul-16 ARM Holdings SoftBank 43% 22,897
Jul-16 Netsuite Oracle 19% 8,716
Source: 1. Centaur Partners, December 2015. 2. Bloomberg; Polar Capital, August 2016. It should not be assumed that recommendations made in future will be profitable or will equal performance of the
securities in this document. A list of all recommendations made within the immediately preceding 12 months is available upon request.
For non-US investor use only. Please refer to the Important Information at the end of this presentation. 39Software As A Service • The rental / usage-based model is expanding the software market while threatening incumbent franchises / maintenance. • Enabled by Cloud, software as a service (SaaS) targets a $150bn opportunity, c. 27% penetrated today1 • Recent acceleration in M&A supportive of our view that Cloud disruption is intensifying (eg. Oracle / Netsuite) • Preferred areas: enterprise applications, digital marketing, unified communications as a service + new opportunities e.g. Taser Worldwide SaaS and Cloud Software (2012 – 2017E) 2 Sample Holdings Source: Polar Capital unless otherwise stated.1. UBS, January 2016. 2. IDC, Centaur Partners, 2014. It should not be assumed that recommendations made in future will be profitable or will equal performance of the securities in this document. A list of all recommendations made within the immediately preceding 12 months is available upon request. For non-US investor use only. Please refer to the Important Information at the end of this presentation. 40
Cyber Security
• Security remains one of the more attractive areas within traditional IT budgets, expected to grow c. 10% through 20201
• Favourable regulatory backdrop likely to persist – US National Action Plan calls for a c. 35% increase in spending to $19bn in FY172
• However, priorities shifting from ‘block and protect’ to rapid detection and response (
Internet Advertising
• Global online advertising worth $156bn in 2015, having grown 13.6% y/y (including headwinds associated with strong USD)1
• US online advertising expected to reach $65bn in 2016, equivalent to 27% of total ad industry spend2
• Size matters: US market increasingly dominated by Alphabet and Facebook (41% and 17% respectively in 2016E)3
• China (+39% y/y) was the fastest region for the third successive year, driven by mobile display / mobile video growth4

Internet penetration (as a % of total advertising industry) 5

Sample
Holdings
Source: Polar Capital, unless otherwise stated. 1. BoAML, IAB, Zenith, January 2016. 2. BoAML, IAB, January 2016. 3. KPCB, January 2016. 4. BoAML, January 2016. 5. BoAML, IAB, January 2016
It should not be assumed that recommendations made in future will be profitable or will equal performance of the securities in this document. A list of all recommendations made within the immediately preceding
12 months is available upon request. All opinions and estimates constitute the best judgment of Polar Capital as of the date hereof, but are subject to change without notice, and do not necessarily represent the
views of Polar Capital.

For non-US investor use only. Please refer to the Important Information at the end of this presentation.                                                                                                              42
Internet Advertising
• Global online advertising worth $156bn in 2015, having grown 13.6% y/y (including headwinds associated with strong USD)1
• US online advertising expected to reach $65bn in 2016, equivalent to 27% of total ad industry spend2
• Size matters: US market increasingly dominated by Alphabet and Facebook (41% and 17% respectively in 2016E)3
• China (+39% y/y) was the fastest region for the third successive year, driven by mobile display / mobile video growth4

Online advertising: % time spent in media vs. % ad. spending5

Sample
Holdings

Source: Polar Capital, unless otherwise stated. 1. BoAML, IAB, Zenith, January 2016. 2. BoAML, IAB, January 2016. 3. KPCB, January 2016. 4. BoAML, January 2016. 5. KPCB, January 2016. It should not be
assumed that recommendations made in future will be profitable or will equal performance of the securities in this document. A list of all recommendations made within the immediately preceding 12 months is
available upon request.

For non-US investor use only. Please refer to the Important Information at the end of this presentation.                                                                                                        43
eCommerce
• eCommerce growth continues unabated, accounting for 15.3% of US core retail sales at the end of 20151
• Global Retail eCommerce forecast to exceed $4tr by 2020E, from c. $1.5tr today2
• Mobile becoming an integral part of the shopping experience, enabling greater volumes and new use cases (eg. Uber)
• Sharing Economy goes mainstream: shared transportation / accommodation markets worth $350bn / $139bn by 20203

Global Retail eCommerce ($bn): 2014 -2020E4

                                                                                                                                                            4,058

                                                                                                                                   3,418

                                                                                                          2,860

                                                                                  2,352
                                                         1,915

                                 1,548
         1,336

         2014                    2015                    2016E                   2017E                    2018E                   2019E                    2020E

Sample
Holdings

Source: Polar Capital, unless otherwise stated. 1. US Census Bureau, 2016. 2. Statista, 2016. 3. UBS, 2016. 4. Statista, 2016. It should not be assumed that recommendations made in future will be profitable or will
equal performance of the securities in this document. A list of all recommendations made within the immediately preceding 12 months is available upon request. All opinions and estimates constitute the best judgment
of Polar Capital as of the date hereof, but are subject to change without notice, and do not necessarily represent the views of Polar Capital.

For non-US investor use only. Please refer to the Important Information at the end of this presentation.                                                                                                          44
eCommerce
• eCommerce growth continues unabated, accounting for 15.3% of US core retail sales at the end of 20151
• Global Retail eCommerce forecast to exceed $4tr by 2020E, from c. $1.5tr today2
• Mobile becoming an integral part of the shopping experience, enabling greater volumes and new use cases (eg. Uber)
• Sharing Economy goes mainstream: shared transportation / accommodation markets worth $350bn / $139bn by 20203
China eCommerce: penetration and value growth forecast4
25% 8000
7000
20%
6000
5000
15%
4000
10%
3000
2000
5%
1000
0% 0
2008 2009 2010 2011 2012 2013 2014 2015E 2016E 2017E 2018E
China eCommerce Sales (Bn RMB; RHS) US eCommerce Penetration China eCommerce Penetration
Sample
Holdings
Source: Polar Capital, unless otherwise stated. 1. US Census Bureau, 2016. 2. Statista, 2016. 3. UBS, 2016. 4. Woodside, July 2015. It should not be assumed that recommendations made in future will be profitable
or will equal performance of the securities in this document. A list of all recommendations made within the immediately preceding 12 months is available upon request. All opinions and estimates constitute the best
judgment of Polar Capital as of the date hereof, but are subject to change without notice, and do not necessarily represent the views of Polar Capital.
For non-US investor use only. Please refer to the Important Information at the end of this presentation. 45Videogames • Video game industry worth $90bn in 2015 (+7% y/y) with growth in 2016/17 driven by new console cycle, mobile and AR/VR1 • Improving market dynamics: industry consolidation + focus on blockbuster franchises = greater scale / profitability / barriers to entry • The shift to digital distribution (full game digital downloads / additional content) expands the TAM and/ structurally improves margins • Pokemon Go – first hit game for augmented reality (AR) scale of mobile gaming: c. 42m daily active users 15 days after launch2 All major publishers receiving >50% of revenue digitally3 US Game Spending Digital Revenue Share of Total Revenue Sample Holdings Source: 1. BMO, April 2016. 2. Apptopia, August 2016. 3. Evercore ISI, January 2016. It should not be assumed that recommendations made in future will be profitable or will equal performance of the securities in this document. A list of all recommendations made within the immediately preceding 12 months is available upon request. For non-US investor use only. Please refer to the Important Information at the end of this presentation. 46
Payments / Fintech
• The shift to mobile remains the central and dominant trend in payments while merchant adoption represents the biggest obstacle.
• Over time the smartphone is likely to replace the physical wallet, aided by the use of biometric authentication.
• As payments are taken out of the banking system, banks are being reduced to ‘dumb pipes’ as value moves to the networks.
• Distributed ledger technology: a longer-term opportunity, enabling payment systems to operate in a decentralised framework

 Global mobile payments: 2010 – 2017E

Sample
Holdings

Source: Statista, 2016. It should not be assumed that recommendations made in future will be profitable or will equal performance of the securities in this document. A list of all recommendations made within the
immediately preceding 12 months is available upon request. All opinions and estimates constitute the best judgment of Polar Capital as of the date hereof, but are subject to change without notice, and do not
necessarily represent the views of Polar Capital.

For non-US investor use only. Please refer to the Important Information at the end of this presentation.                                                                                                              47
Robotics
• The Fourth Industrial Revolution underway driven by Cyber Physical Systems, Internet of Things and Cloud Services
• Over 25% of manufacturing tasks that can be automated may be performed by robots over the next decade1.
• Human-robot collaboration will radically alter the way factories operate, making highly versatile production lines possible.
• We prefer high precision components / sensors over robotic manufacturers - driven by automotive / electronic manufacturing sectors

Global robotics: spending expected to reach $67bn by 20252

Sample
Holdings

Source: 1. Boston Consulting Group, September 2015. 2. BCG, August 2014. It should not be assumed that recommendations made in future will be profitable or will equal performance of the securities in this
document. A list of all recommendations made within the immediately preceding 12 months is available upon request.

For non-US investor use only. Please refer to the Important Information at the end of this presentation.                                                                                                       48
Robotics
• The Fourth Industrial Revolution underway driven by Cyber Physical Systems, Internet of Things and Cloud Services
• Over 25% of manufacturing tasks that can be automated may be performed by robots over the next decade1.
• Human-robot collaboration will radically alter the way factories operate, making highly versatile production lines possible.
• We prefer high precision components / sensors over robotic manufacturers - driven by automotive / electronic manufacturing sectors

Global robotics: spending expected to reach $67bn by 20252
                                                  80                                                                                                                            160
   Worldwide spending on robots (USD, billions)

                                                                  155
                                                  70                                                                                                   66.9                     150
                                                                                                                                                         9.0
                                                  60                                                                                                                            140

                                                                                                                                                                                             (USD, thousands)
                                                  50                                                                                                    17.0                    130
                                                                                                                42.9
                                                  40                                                             4.5                                                            120
                                                                                                                        117
                                                                                                                 10.8
                                                  30                                   26.9                                                             24.4                    110
                                                                                        2.5
                                                  20                                    5.9                                                                 103                 100
                                                                                                                 16.4
                                                                   15.1
                                                                    1.0
                                                                    3.2                 11.0
                                                  10                5.8                                                                                 16.5
                                                                                                                                                                                90
                                                                                                                 11.2
                                                                    5.1                 7.5
                                                  0                                                                                                                             80
                                                                   2010                2015E                   2020E                                   2025E

                                                       Military           Industrial    Commercial       Personal                     Industrial robot system costs

Sample
Holdings

Source: 1. Boston Consulting Group, September 2015. 2. BCG, August 2014. It should not be assumed that recommendations made in future will be profitable or will equal performance of the securities in this
document. A list of all recommendations made within the immediately preceding 12 months is available upon request. All opinions and estimates constitute the best judgment of Polar Capital as of the date hereof,
but are subject to change without notice, and do not necessarily represent the views of Polar Capital.

For non-US investor use only. Please refer to the Important Information at the end of this presentation.                                                                                                             49
Technology: Undemanding Valuations Absolute sector valuations (PE): 1992 – present Source: NDR, 19 August 2016. For non-US investor use only. Please refer to the Important Information at the end of this presentation. 50
Technology: Undemanding Valuations

Relative sector valuations (PE): 1992 – present

Source: NDR, 19 August 2016.

For non-US investor use only. Please refer to the Important Information at the end of this presentation.   51
Technology: Undemanding Valuations

Internet valuation:                                                                                         Software as a Service (SaaS) valuation:
EV / forward 12 month EV/EBITDA levels1                                                                     EV / forward 12 month revenue multiples2

Source: 1. Goldman Sachs, May 2016. 2. Pacific Crest, July 2016. Past performance is not indicative or a guarantee of future returns

For non-US investor use only. Please refer to the Important Information at the end of this presentation.                                               52
Technology: Undemanding Valuations

IT security valuation:                                                                                          Cloud vs legacy valuation:
EV / forward 12 month revenue multiples1                                                                        EV / trailing 12 month revenue multiples2

Source: 1. Citi, July 2016. 2. Merrill Lynch, June 2016. Past performance is not indicative or a guarantee of future returns.

For non-US investor use only. Please refer to the Important Information at the end of this presentation.                                                    53
PCT Positioning
Sector exposure (%)                                                                                                Market cap exposure (%)
Software                                                                                  26.6%
Internet Software & Services                                                              26.2%                       Large Cap (>$10bn)                       67.2%
Semiconductors & Semiconductor Equipment                                                  13.7%
                                                                                                                      Mid Cap (>$1bn - $10bn)                  27.1%
Technology Hardware, Storage & Peripherals                                                 9.5%
Internet & Catalog Retail                                                                  4.9%                       Small Cap (
PCT Positioning
Largest overweights Largest underweights Market cap exposure versus benchmark1
8x8 Apple
Activision Blizzard Canon
Alibaba Group Holding Cisco Systems Large-cap -17.6%
Amazon Cognizant Technology Solutions
CyberArk Software Corning
Dena Co EMC
Dolby Laboratories Inc Hewlett Packard Enterprise Co
Mid-cap 13.4%
Electronic Arts HP
HubSpot IBM
Medidata Solutions Infosys
Netsuite Intel
Power Integrations Intuit Small-cap 4.4%
Proofpoint Microsoft
Splunk Nokia
Taser International NVIDIA -20% -15% -10% -5% 0% 5% 10% 15%
TripAdvisor Oracle
UBISOFT Entertainment Qualcomm
Universal Display Corp Samsung Electronics
Visa SAP
Zendesk Yahoo
Source: 1. Polar Capital, 29 July 2016. It should not be assumed that recommendations made in future will be profitable or will equal performance of the securities in this document. A list of all recommendations made
within the immediately preceding 12 months is available upon request.
PCT also holds Twitter and AMD call options representing 35 bps of the NAV. Total delta adjusted Twitter exposure is equal to 0.35% and the total delta adjusted AMD exposure is equal to 0.91%. The delta adjusted
impact of these options is only reflected in the top 10 positions table all other exposure tables are based on MTM figures. Totals may not sum due to rounding.
For non-US investor use only. Please refer to the Important Information at the end of this presentation. 55PCT Positioning
Thematic breakdown1,2 Thematic breakdown relative to benchmark1,2
15.0
Legacy 10.0
9%
5.0
Internet
30%
0.0
Semiconductors
14%
-5.0
Smartphones -10.0
7%
Medical Technology
1% -15.0
Electric Vehicles Apple Cloud: applications -20.0
0% 6% 13%
Solar
1% -25.0
Emerging
Big data
IoT
Medical Technology
Other
Internet
3D Printing
Electric Vehicles
Semiconductors
Legacy
Cloud: applications
Payments
Cybersecurity
Emerging
Cloud: infrastructure
Solar
Automotive
Smartphones
Apple
Factory automation/robotics
0% Other
0%
3D Printing
1% Payments
2%
Cloud: infrastructure
Factory Big data 6%
IoT automation/robotics 4% Cybersecurity
Automotive
1% 1% 1% 4%
Source: Polar Capital, 23 August 2016. 1. Benchmark: Dow Jones World Technology Index (TR). 2. Index exposure based on Top 100 index constituents. Figures are shown as gross weightings.
It should not be assumed that recommendations made in future will be profitable or will equal performance of the securities in this document. A list of all recommendations made within the immediately preceding 12
months is available upon request.
For non-US investor use only. Please refer to the Important Information at the end of this presentation. 56PCT Positioning
PCT1
Index Index ex Sales growth 2017 – PCT vs. benchmark2
Top 100 Apple
70.0
PE (Median) CY 25.0 17.6 17.7
NY 20.4 15.8 16.0
Earnings growth (Median) CY 10.7 7.1 7.2
60.0
NY 17.9 12.3 12.0
EV/Sales (Mean) CY 5.1 4.3 4.4
NY 4.3 3.8 3.9 50.0
EV/Sales (Median) CY 4.4 3.9 4.0
NY 3.8 3.6 3.7
% of Portfolio
EV/Sales (Weighted) CY 5.7 4.8 5.2 40.0
NY 4.8 4.1 4.5
Sales Growth (Mean) CY 18.0 11.1 11.3
NY 15.6 9.4 9.4 30.0
Sales Growth (Median) CY 17.3 7.3 7.5
NY 13.3 7.5 7.4
Sales Growth (Weighted) CY 19.9 11.2 14.2 20.0
NY 16.3 10.6 11.0
Gross Margin (Mean) 60.0 56.8 57.0
Gross Margin (Median) 62.8 58.7 58.8 10.0
Gross Margin (Weighted) 59.0 56.8 59.3
Net Cash as % mkt cap Avg 17 4 4
0.0
Wgtd 11 11 9 50
Market Cap ($m) Mean 47929.0 59340.4 54033.7
Median 5211.4 16674.3 16572.5 PCT GROSS WEIGHT BENCH GROSS WEIGHT
Wgtd 182425.9 252218.1 203413.5
Source: 1. Polar Capital, 23 August 2016. Figures in blue exclude Apple (12.8% gross) from the Index Top 100. CY = Current Year, NY = 2017 calendar year estimates. 2. Polar Capital, 23 August 2016,
Benchmark: Dow Jones World Technology Index (TR). Past performance is not indicative or a guarantee of future results. All opinions and estimates constitute the best judgment of Polar Capital as of the date
hereof, but are subject to change without notice, and do not necessarily represent the views of Polar Capital. It should not be assumed that recommendations made in future will be profitable or will equal
performance of the securities in this document. A list of all recommendations made within the immediately preceding 12 months is available upon request.
For non-US investor use only. Please refer to the Important Information at the end of this presentation. 57Emerging Themes Source: Gartner, August 2016. For non-US investor use only. Please refer to the Important Information at the end of this presentation. 58
Voice As a Computing Interface • Humans can speak 150 vs. type 40 words per minute on average voice should become the most efficient form of computing input1 • Voice queries already account for 20% of Android mobile app searches in the US, while Siri handles >1bn requests per week2 • “As speech recognition accuracy goes from 95% to 99%, all of us...will go from barely using it to using it all the time” – Andrew NG3 • By 2020, at least 50% of all searches are going to be through images or speech according to Baidu4 Words recognised by machine: 1970 - 20165 Sample Holdings Source: 1. KPCB, 2016 2. KPCB, 2016 3. KPCB, 2016 4. Baidu / KPCB, 2016. 5. KPCB, 2016. It should not be assumed that recommendations made in future will be profitable or will equal performance of the securities in this document. A list of all recommendations made within the immediately preceding 12 months is available upon request. For non-US investor use only. Please refer to the Important Information at the end of this presentation. 59
Autonomous Vehicles • Automotive market ripe for reinvention: connectivity / infotainment, ADAS / autonomous driving, vehicle electrification • Global ADAS / autonomous vehicle penetration forecast to grow from 12% in 2015, to 48% in 2020 and 70% by 20251 • Fully autonomous driving by 2020? Technically yes - Alphabet’s self-driving cars have already completed 1.8m miles2 • Car ownership? Depreciating, underutilised asset used just c. 4% of the time shared private rides becoming mainstream3 Global vehicle penetration of ADAS and autonomous features: 2013 – 2024E4 Sample Holdings Source: 1. CLSA, September 2016. 2. FT, August 2016. 3.Source: KPCB, 2016. 4. Source: CLSA, January 2016 .It should not be assumed that recommendations made in future will be profitable or will equal performance of the securities in this document. A list of all recommendations made within the immediately preceding 12 months is available upon request. All opinions and estimates constitute the best judgment of Polar Capital as of the date hereof, but are subject to change without notice, and do not necessarily represent the views of Polar Capital. For non-US investor use only. Please refer to the Important Information at the end of this presentation. 60
Summary & Outlook

• PCT offers a differentiated, growth centric and increasingly “active” investment portfolio
   – Our goal is to deliver outperformance via superior underlying revenue / cashflow / earnings
   – Risk and volatility reduced through diversification and strength / depth of investment team.

• The public cloud at scale = a second more pernicious (highly deflationary) phase for incumbents
   – Amazon AWS trailing 12 month revenue $9.9bn1 – for every $ that shifts we think 3-4x is lost to traditional IT
   – New technologies are no longer complementary to legacy solutions – they are now direct substitutes

• The pace of innovation is accelerating and technology is reaching into other markets (TAM expanding)
   – Majority of incremental IT spend is being captured by “new” businesses e.g. Amazon, Google etc
   – Meanwhile incumbents are struggling: 1) New cycle deflation 2) China/EM slowdown 3) PC / smartphone maturity

• Valuations have compressed to compelling levels & small/mid cap headwinds appear to be abating
   – Valuation of “high growth” stocks remain below 5 year averages
   – April 2011 was peak of small/mid vs large cap – creating a significant 5+ year headwind for active vs index managers

• We believe 2016 should be a turning point for our growth centric investment style vs benchmarks/ETF’s
   – Results suggest a widening gap between “winners” and “losers” – yet the valuation gap recently narrowest in years
   – Expect to continue moving further from the benchmark – active share heading higher from 50%+ today

Source: Amazon, August 2016. It should not be assumed that recommendations made in future will be profitable or will equal performance of the securities in this document. A list of all recommendations made within
the immediately preceding 12 months is available upon request.

For non-US investor use only. Please refer to the Important Information at the end of this presentation.                                                                                                         61
Appendix

For non-US investor use only. Please refer to the Important Information at the end of this presentation.   62
Team Biographies
                                   Ben Rogoff, Director – Technology
                                   Experience: 21 years
                                   Ben joined Polar Capital in May 2003. He is lead manager of Polar Capital Technology Trust plc and is also joint manager of the
                                   Polar Capital Global Technology Fund. He has been a technology specialist for 21 years. Prior to joining Polar Capital he began his
                                   career in fund management at CMI, as a global technology analyst. He moved to Aberdeen Fund Managers in 1998 where he spent
                                   four years as a senior technology manager. Ben graduated from St Catherine’s College, Oxford in 1995.

                                   Nick Evans, Senior Fund Manager
                                   Experience: 18 years
                                   Nick joined Polar Capital in September 2007 and has 18 years’ experience as a technology specialist. He has been lead manager
                                   of the Polar Capital Global Technology Fund since January 2008. Prior to joining Polar he was head of technology at AXA
                                   Framlington and lead manager of the AXA Framlington global technology fund and the AXA world fund (AWF) – global technology
                                   from 2001 to 2007 (both rated five stars by S&P). He also spent three years as a Pan-European investment manager and
                                   technology analyst at Hill Samuel Asset Management. Nick has a degree in Economics from Hull University.

                                   Fatima Iu
                                   Experience: 10 years
                                   Fatima joined Polar Capital in April 2007 after working as an analyst with Citigroup Asset Management for 18 months. She focuses on European
                                   technology stocks and has responsibility for coverage of the global alternative energy and medical technology sub-sectors. Fatima graduated
                                   from Imperial College London in 2002 with a degree in Medicinal Chemistry. She is a CFA charterholder.

For non-US investor use only. Please refer to the Important Information at the end of this presentation.                                                                     63
Team Biographies Cont.
Xuesong Zhao
Experience: 9 years
Xuesong joined Polar Capital in May 2012, having spent most of the previous four years working as an investment analyst within the emerging
market & Asia team at Aviva Investors, where he was responsible for the technology, media and telecom sectors. Prior to that, he worked as a
quantitative analyst and risk manager for the emerging market debt team at Pictet Asset Management. He started his career as a financial
engineer at Algorithmics, now owned by IBM, in 2005. He holds an MSc in Finance from Imperial College of Science & Technology, a BA (Hons)
in Economics from Peking University and has passed all three levels of the CFA.
Brad Reynolds
Experience: 8 years
Brad joined Polar Capital in October 2011 as an Analyst and Trader working as part of the European Market Neutral team with a focus on media
and internet. In 2014, he joined the Technology team as an Investment Analyst. Prior to joining Polar Capital, Brad worked at Ratio Asset
Management as an analyst and trader, and from 2007 to 2011 he worked at F&C as a hedge fund analyst. Brad started his career in 2001 at
Gartmore Investment Management working within the hedge fund team. Brad graduated from the University of Hertfordshire with a degree in
Business Studies and has passed the Level I examination of the CFA Program.
John Gladwyn
Experience: 7 years
John joined Polar Capital in February 2015 as an Investment Analyst on the Global Technology team. Prior to joining Polar Capital, John spent 6
years at Blackrock working as an analyst on the Global Equity team with his first year as a graduate working with the UK Equity team. John holds
a degree in Classics from the University of Oxford, a Masters in Finance with Distinction from London Business School, and is a CFA
Charterholder.
Paul Johnson
Experience: 4 years
Paul joined Polar Capital in March 2012 as an Investment Analyst on the Polar Capital Technology team. Prior to joining Polar Capital, Paul
helped manage a private investment fund between 2010 and 2012. Paul holds a BA in History and Politics and a Masters in History from Keele
University. He has successfully passed all three levels of the CFA program.
For non-US investor use only. Please refer to the Important Information at the end of this presentation. 64New Cycles Challenge The Value Of Incumbency
Inflation adjusted UK holiday expenditure: 1951-1996
overseas
domestic
Source: seasidehistory.co.uk.
For non-US investor use only. Please refer to the Important Information at the end of this presentation. 65Important Information
Polar Capital
16 Palace Street
London SW1E 5JD
Important Information: This document is provided for the sole use of the intended recipient and is not a financial promotion. It shall not and does not constitute an offer or solicitation of an offer to make an
investment into any fund or Company managed by Polar Capital. It may not be reproduced in any form without the express permission of Polar Capital and is for the intended recipient only. Clients who have
access to this document should make themselves aware of all relevant risk factors relating to these products contained in the Fund or Company’s Prospectus or latest financial report. The law restricts distribution
of this document in certain jurisdictions; therefore, it is the responsibility of the reader to inform themselves about and observe any such restrictions. It is the responsibility of any person/s in possession of this
document to inform themselves of, and to observe, all applicable laws and regulations of any relevant jurisdiction. Polar Capital Technology Trust plc is an Investment Company with investment trust status and as
such its ordinary shares are excluded from the FCA’s (Financial Conduct Authority’s) restrictions which apply to non-mainstream investment products. The Company conducts its affairs and intends to continue to
do so for the foreseeable future so that the exclusion continues to apply. It is not designed to contain information material to an investor’s decision to invest in Polar Capital PLC – Global Technology Fund or
Polar Capital Technology Trust plc which is an Alternative Investment Fund under the Alternative Investment Fund Managers Directive 2011/61/EU (“AIFMD”) managed by Polar Capital LLP the appointed
Alternative Investment Manager. In relation to each member state of the EEA (each a “Member State”) which has implemented the AIFMD, this document may only be distributed and shares may only be offered
or placed in a Member State to the extent that (1) the fund is permitted to be marketed to professional investors in the relevant Member State in accordance with AIFMD; or (2) this document may otherwise be
lawfully distributed and the shares may otherwise be lawfully offered or placed in that Member State (including at the initiative of the investor). As at the date of this document, the Fund has not been approved,
notified or registered in accordance with the AIFMD for marketing to professional investors in any member state of the EEA. However, such approval may be sought or such notification or registration may be
made in the future. Therefore this document is only transmitted to an investor in an EEA Member State at such investor’s own initiative. SUCH INFORMATION, INCLUDING RELEVANT RISK
FACTORS, IS CONTAINED IN THE COMPANY OR FUND’S OFFER DOCUMENT WHICH MUST BE READ BY ANY PROSPECTIVE INVESTOR.
Statements/Opinions/Views: All opinions and estimates constitute the best judgment of Polar Capital as of the date hereof, but are subject to change without notice, and do not necessarily represent the views
of Polar Capital. This material does not constitute legal or accounting advice; readers should contact their legal and accounting professionals for such information. All sources are Polar Capital unless otherwise
stated.
Third-party Data: Some information contained herein has been obtained from third party sources and has not been independently verified by Polar Capital. Neither Polar Capital nor any other party involved in or
related to compiling, computing or creating the data makes any express or implied warranties or representations with respect to such data (or the results to be obtained by the use thereof), and all such parties
hereby expressly disclaim all warranties of originality, accuracy, completeness, merchantability or fitness for a particular purpose with respect to any data contained herein.
Holdings: Portfolio data is “as at” the date indicated and should not be relied upon as a complete or current listing of the holdings (or top holdings) of the Company or Fund. The holdings may represent only a
small percentage of the aggregate portfolio holdings, are subject to change without notice, and may not represent current or future portfolio composition. Information on particular holdings may be withheld if it is
in the Company or Fund’s best interest to do so. It should not be assumed that recommendations made in future will be profitable or will equal performance of the securities in this document. A list of all
recommendations made within the immediately preceding 12 months is available upon request. This document is not a recommendation to purchase or sell any particular security. It is designed to provide
updated information to professional investors to enable them to monitor the Company or Fund.
Benchmarks: The following benchmark index is used: Dow Jones World Technology Index (Total Return). This benchmark is generally considered to be representative of the Technology Equity universe. This
benchmark is a broad-based index which is used for comparative/illustrative purposes only and has been selected as it is well known and is easily recognizable by investors. Please refer to www.djindexes.com
for further information on this index. Comparisons to benchmarks have limitations as benchmarks volatility and other material characteristics that may differ from the Company or Fund. Security holdings, industry
weightings and asset allocation made for the Company or Fund may differ significantly from the benchmark. Accordingly, investment results and volatility of the Company or Fund may differ from those of the
benchmark. The indices noted in this document are unmanaged, are unavailable for direct investment, and are not subject to management fees, transaction costs or other types of expenses that the Company or
Fund may incur. The performance of the indices reflects reinvestment of dividends and, where applicable, capital gain distributions. Therefore, investors should carefully consider these limitations and differences
when evaluating the comparative benchmark data performance. Information regarding indices is included merely to show general trends in the periods indicated, it is not intended to imply that the fund was similar
to the indices in composition or risk.
For non-US investor use only. Please refer to the Important Information at the end of this presentation. 66Important Information Cont.
Polar Capital
16 Palace Street
London SW1E 5JD
Regulatory Status: Polar Capital LLP is a limited liability partnership number OC314700. It is authorised and regulated by the UK FCA and is registered as an investment adviser with the US Securities &
Exchange Commission (“SEC”). A list of members is open to inspection at the registered office, 16 Palace Street, London SW1E 5JD. FCA authorised and regulated Investment Managers are expected to write
to investors in funds they manage with details of any side letters they have entered into. The FCA considers a side letter to be an arrangement known to the investment manager which can reasonably be
expected to provide one investor with more materially favourable rights, than those afforded to other investors. These rights may, for example, include enhanced redemption rights, capacity commitments or the
provision of portfolio transparency information which are not generally available. The Fund and the Investment Manager are not aware of, or party to, any such arrangement whereby an investor has any
preferential redemption rights. However, in exceptional circumstances, such as where an investor seeds a new fund or expresses a wish to invest in the Fund over time, certain investors have been or may be
provided with portfolio transparency information and/or capacity commitments which are not generally available. Investors who have any questions concerning side letters or related arrangements should contact
the Polar Capital Desk at the Registrar on 0800 876 6889 (PCTT) or Administrator on +353 1 434 5007 (UCITS). The Fund is prepared to instruct the custodian of the Fund, upon request, to make available to
investors portfolio custody position balance reports monthly in arrears.
Information Subject to Change: The information contained herein is subject to change, without notice, at the discretion of Polar Capital and Polar Capital does not undertake to revise or update this information
in any way.
Forecasts: References to future returns are not promises or estimates of actual returns Polar Capital may achieve. Forecasts contained herein are for illustrative purposes only and does not constitute advice or
a recommendation. Forecasts are based upon subjective estimates and assumptions about circumstances and events that have not and may not take place.
Performance/Investment Process/Risk: Performance is shown net of fees and expenses and includes the reinvestment of dividends and capital gain distributions. Factors affecting the Company or Fund’s
performance may include changes in market conditions (including currency risk) and interest rates and in response to other economic, political, or financial developments. Past performance is not a guide to or
indicative of future results. Future returns are not guaranteed and a loss of principal may occur. Investments are not insured by the FDIC (or any other state or federal agency), or guaranteed by any bank, and
may lose value. No investment process or strategy is free of risk and there is no guarantee that the investment process or strategy described herein will be profitable.
Allocations: The strategy allocation percentages set forth in this document are estimates and actual percentages may vary from time-to-time. The types of investments presented herein will not always have the
same comparable risks and returns. Please see the private placement memorandum or prospectus for a description of the investment allocations as well as the risks associated therewith. Please note that the
Company or Fund may elect to invest assets in different investment sectors from those depicted herein, which may entail additional and/or different risks. Performance of the Company or Fund is dependent on
the Investment Manager’s ability to identify and access appropriate investments, and balance assets to maximize return to the Company or Fund while minimizing its risk. The actual investments in the Company
or Fund may or may not be the same or in the same proportion as those shown herein.
Country Specific disclaimers: The Company or Funds have not been and will not be registered under the U.S. Investment Company Act of 1940, as amended (the "Investment Company Act") and the holders
of its shares will not be entitled to the benefits of the Investment Company Act. In addition, the offer and sale of the Securities have not been, and will not be, registered under the U.S. Securities Act of 1933, as
amended (the "Securities Act"). No Securities may be offered or sold or otherwise transacted within the United States or to, or for the account or benefit of U.S. Persons (as defined in Regulation S of the
Securities Act). In connection with the transaction referred to in this document the shares of the Fund will be offered and sold only outside the United States to, and for the account or benefit of non U.S. Persons
in "offshore- transactions" within the meaning of, and in reliance on the exemption from registration provided by Regulation S under the Securities Act. No money, securities or other consideration is being
solicited and, if sent in response to the information contained herein, will not be accepted. Any failure to comply with the above restrictions may constitute a violation of such securities laws.
For non-US investor use only. Please refer to the Important Information at the end of this presentation. 67You can also read