Corporate Presentation - Q1 FY20 - Capital First
←
→
Page content transcription
If your browser does not render page correctly, please read the page content below
Corporate Presentation – Q1 FY20
Disclaimer
This presentation has been prepared by and is the sole responsibility of IDFC FIRST Bank (together with its subsidiaries, referred to as the
“Company”). By accessing this presentation, you are agreeing to be bound by the trailing restrictions.
This presentation does not constitute or form part of any offer or invitation or inducement to sell or issue, or any solicitation of any offer or
recommendation to purchase or subscribe for, any securities of the Company, nor shall it or any part of it or the fact of its distribution form the basis
of, or be relied on in connection with, any contractor commitment therefore. In particular, this presentation is not intended to be a prospectus or
offer document under the applicable laws of any jurisdiction, including India. No representation or warranty, express or implied, is made as to, and
no reliance should be placed on, the fairness, accuracy, completeness or correctness of the information or opinions contained in this presentation.
Such information and opinions are in all events not current after the date of this presentation. There is no obligation to update, modify or amend
this communication or to otherwise notify the recipient if information, opinion, projection, forecast or estimate set forth herein, changes or
subsequently becomes inaccurate.
Certain statements contained in this presentation that are not statements of historical fact constitute “forward-looking statements.” You can
generally identify forward-looking statements by terminology such as “aim”, “anticipate”, “believe”, “continue”, “could”, “estimate”, “expect”,
“intend”, “may”, “objective”, “goal”, “plan”, “potential”, “project”, “pursue”, “shall”, “should”, “will”, “would”, or other words or phrases of similar
import. These forward-looking statements involve known and unknown risks, uncertainties, assumptions and other factors that may cause the
Company’s actual results, performance or achievements to be materially different from any future results, performance or achievements expressed
or implied by such forward-looking statements or other projections. Important factors that could cause actual results, performance or achievements
to differ materially include, among others: (a) material changes in the regulations governing our businesses; (b) the Company's inability to comply
with the capital adequacy norms prescribed by the RBI; (c) decrease in the value of the Company's collateral or delays in enforcing the Company's
collateral upon default by borrowers on their obligations to the Company; (d) the Company's inability to control the level of NPAs in the Company's
portfolio effectively; (e) certain failures, including internal or external fraud, operational errors, systems malfunctions, or cyber security incidents; (f)
volatility in interest rates and other market conditions; and(g) any adverse changes to the Indian economy.
This presentation is for general information purposes only, without regard to any specific objectives, financial situations or informational needs of
any particular person. The Company may alter, modify, regroup figures wherever necessary or otherwise change in any manner the content of this
presentation, without obligation to notify any person of such change or changes.

                                                                                                                                      2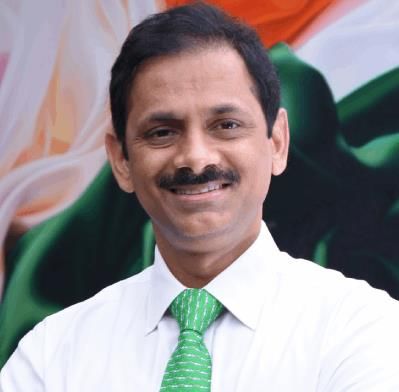
4    SECTION 1: THE FOUNDING OF IDFC FIRST BANK

           11   SECTION 2: FINANCIAL PERFORMANCE

           14   SECTION 3: ASSETS

Table
                SECTION 4: LIABILITIES
of         20

Contents
           25   SECTION 5: FINANCIAL STATEMENTS

           28   SECTION 6: DIRECTORS & SHAREHOLDERS

           33   SECTION 7: CAPITAL FIRST STRATEGY, LOAN GROWTH AND PROFITABILITY
                TRENDS FOR 8 YEARS (BEFORE MERGER WITH IDFC BANK)

           53   SECTION 8: STRATEGY GOING FORWARD FOR THE
                COMBINED ENTITY
SECTION 1:
The Founding of IDFC FIRST Bank
• Events Leading to Merger –
IDFC Bank - Origin & History
Capital First - Origin & History
Merger between IDFC Bank and Capital First
IDFC Bank Financials Trends leading to merger
Capital First Financials Trend leading to merger
Section 1: The Founding of IDFC FIRST Bank..

 IDFC FIRST Bank is founded by the merger of Erstwhile IDFC
 Bank and Erstwhile Capital First on December 18, 2018.

                                                  5
Section 1: The Founding of IDFC FIRST Bank..
IDFC BANK                                                                  CAPITAL FIRST LIMITED
IDFC Limited was set up in 1997 to finance infrastructure focusing         Around the same time (2010-2017), while these events were playing
primarily on project finance and mobilization of capital for private       out at IDFC Group, certain events were playing out in parallel at Capital
sector infrastructure development. Whether it is financial                 First. Mr Vaidyanathan who had built ICICI Bank’s Retail Banking
intermediation for infrastructure projects and services, whether           business from 2000-2009 and was the MD and CEO of ICICI Prudential
adding value through innovative products to the infrastructure value       Life Insurance Company in 2009-10, quit the group for an
chain or asset maintenance of existing infrastructure projects, the        entrepreneurial foray.
company focused on supporting companies to get the best return on          During 2010-11, he acquired a significant stake in a listed real-estate
investments. The Company’s ability to tap global as well as Indian         financing diversified NBFC and then prepared the ground for a
financial resources made it the acknowledged experts in infrastructure     Leveraged Management Buyout of the firm by exiting many businesses
finance.                                                                   like Forex subsidiary, broking subsidiary, real estate financing, and
Dr. Rajiv Lall joined the company in 2005 and successfully expanded        instead launching retail financial businesses for small entrepreneurs
the business to Asset Management, Institutional Broking and                and consumers. He built a technology-driven retail loan book of Rs. 770
Infrastructure Debt Fund. He applied for a commercial banking license      Cr by March 2011, and presented this as proof of concept to global
to the RBI in 2013. Owing to his efforts, in 2014, the Reserve Bank of     private equity players for a management Buyout.
India (RBI) granted an in-principle approval to IDFC Limited to set up a   In 2012, he concluded India’s largest Management Buyout by securing
new bank in the private sector. Thus Erstwhile IDFC Bank was created       equity backing of Rs. 810 Crores from Warburg Pincus, got fresh equity
by demerger of the infrastructure lending business of IDFC to IDFC         into the company and founded Capital First as a new entity with new
Bank in 2015.                                                              shareholders, new Board, new business lines, and fresh equity infusion.

                                                            Contd..                                                                       Contd..

                                                                                                                                 6
Section 1: The Founding of IDFC FIRST Bank..
IDFC BANK                                                                   CAPITAL FIRST LIMITED
The parent entity, IDFC Limited, retained businesses of AMC,                Between March 31, 2010 to March 31, 2018, the Company’s Retail
Institutional Broking and Infrastructure Debt Fund business through         Assets under Management increased from Rs. 94 crores to Rs. 25,243
IDFC Financial Holding Company Limited (NOFHC).                             Cr. The company financed seven million customers through new age
The shares of Erstwhile IDFC Bank Limited were listed in the exchanges      technology models. The credit rating increased from A+ to AAA. The
in November 2015. During the subsequent three years, the bank               Gross and Net NPA reduced from 5.28% and 3.78% respectively to 2%
developed a strong and robust framework including strong IT                 and 1% respectively and the asset quality remained consistently high.
capabilities and infrastructure for scaling up the banking operations.      Further, the company turned around from losses of Rs. 30 crores and
The Bank designed efficient treasury management system for its own          Rs. 32 crores in FY 09 and FY 10 respectively, to Rs. 327 crores by 2018,
proprietary trading, as well as for managing client operations. The         representing a 5 year CAGR increase of 56%. The loan assets grew at a 5
bank diversified from being a predominantly infrastructure financier to     year CAGR of 29%. The ROE steadily rose from losses in 2010 to near
wholesale banking operations. Since a large portion (90%) of the bank       15% by 2018. The market cap of the company increased ten-fold from
was wholesale (infrastructure and corporate loans) as a legacy from         Rs. 780 crores on in March 2012 at the time of the LBO to over Rs. 7800
IDFC Limited until 2017, the company swiftly put together a strategy to     crores in January 2018 at the time of announcement of the merger.
retailise its loan book. Retail required specialized skills for the         Funding could be a constraining factor for continued growth, so the
marketplace, seasoning, and scale for profitability, the Bank was           company was looking out for a banking license.
looking for a retail lending partner who already had scale, profitability
and specialized skills, to merge with.

As part of its strategy to diversify its loan book from infrastructure,     Capital First, in the meanwhile, was on the lookout for a
the bank was looking for a merger with a retail finance institution         commercial banking license in order to access large pool of funds
with adequate scale, profitability and specialized skills.                  for growth and to access low cost of funds.

                                                                                                                                 7
Section 1: The Founding of IDFC FIRST Bank..

In January 2018, IDFC FIRST Bank and Capital First announced that they had reached an understanding to
merge with each other and shareholders of Capital First were to be issued 139 shares of the merged entity for
every 10 shares of Capital First.

Thus, IDFC FIRST Bank was founded as a new entity by the merger of IDFC Bank and Capital First on December
18 2018.

                                                                                                 8
Section 1: Key Strengths

• Strong Systems and Processes              • Strong Retail Franchise in niche            • Strong Loan assets of more than Rs.
                                              segments with strong credit skills            104660 Cr
• Launched retail liability operations.
  Raised retail CASA of Rs. 2,800 crores,   • Track record of continuous growth           • 34.62% of loans in retail segment
  total CASA of Rs. 6,426 Cr and retail     • Expanded to more than 220 locations         • Margins increased from 1.7% on
  Term Deposits of Rs. 6,453 Cr as of Sep     across India supported by 102 branches        standalone to 3.3% post merger
  18.
                                            • Consistently increasing Profitability (5    • Diversified asset profile
• Built efficient Treasury Management         year CAGR 39%) and high ROE (15%)           • Strong platform to grow retail
  Systems, strong presence in Corporate
                                            • High Asset quality across cycles              deposits and CASA
  and Infrastructure financing
                                              including increasing interest rate (2010-   • A large retail customer base of more
• Launched contemporary payment               2014), Demonetization (2016) and GST          than 70 lacs live customers including
  systems, internet and mobile banking        (2017)                                        30 lacs rural customers
• Launched retail lending businesses        • Customer base of over seven million
  successfully but was at early stage         and 4 million live customers

                                                                                                             9
Section 1: Key Excerpts from MD and CEO’s letter to Shareholders in Annual Report 2019

On Our founding philosophy:                       On the Vision of the New Bank:
                                              “
                                                                                                                       ”
                                                  On Our Mission:
                                              “

                                                                                 ”
On Strategy for the new Bank:                     On the Future Outlook:
“                                              “
                                                                                       “

                                                                           ”
                                                   On Contribution to the Country:
                                               “ We aspire to create millions of employment opportunities, and finance the growth of
                                                   business and consumption. This will lead to greater domestic production, greater
                           ”                       consumption, and we want to contribute in further the virtuous cycle of growth for our
                                                              ”
                                                   great nation

                                                                                                                10
SECTION 2:
FINANCIAL PERFORMANCE
OF THE BANK FOR Q1-FY20
• Key Business & Financial ParametersSection 2: Snapshot of Key Parameters for the Quarter Q1 FY20
Rs. 1,12,558 Cr 40% Rs. 1,42,269 Cr 15.08%, 7.02%
Funded Assets Retail Assets/Total Borrowing & Deposits CASA Ratio
Funded Assets (as % of Total Deposit, as % of Total
Borrowing & Deposits)
Rs. 17,545 Cr 2.66%, 1.35% 279 14.01%
Net Worth-Standalone GNPA, NNPA No. of Bank Branches Capital Adequacy ratio
12Section 2: Snapshot for the Quarter Q1 FY20
• The Net Interest Income for the quarter ended on 30 June 2019 was Rs. 1,174* Cr as compared to Rs. 1,113 Cr for the quarter
ended on 31 March 2019, strong annualized growth of 22%.
• The Total Operating Income (net of Interest Cost) for the quarter ended on 30 June 2019 was Rs. 1,485 Cr as compared to Rs.
1,386 Cr for the quarter ended on 31 March 2019, strong annualized growth of 28%.
• The Net Interest Margin for the quarter ended on 30 June 2019 was at 3.01%* which was at 3.03% for the quarter ended on 31
March 2019.
• The Cost to Income ratio for the quarter ended on 30 June 2019 was at 78.60% in comparison to 82.79% for the quarter ended
on 31 March 2019.
• The Net Loss for the quarter ended on 30 June 2019 was Rs. (617) Cr, primarily because of additional provisioning taken during
Q1 FY20 towards two identified financial services loan accounts to the extent of 75% of the total exposure of Rs. 1,461 Cr.
These Financial Services companies have been recently downgraded by the credit rating agencies. With provision cover of 75%,
we believe we have adequately provided for these accounts and no incremental provisions are now expected on account of
these in the near future.
* After Reversal of Accrued Interest of Rs. 82 Cr on two identified accounts (One HFC and one financial company which have been downgraded recently) where our exposure is Rs 1,461 crores.
But for this reversal, the NII for the quarter would have been Rs 1,256 crores and thereby NIM% would have been 3.15% as compared to 3.03% for the quarter ended 31 March 2019 an
increase of 12 bps QoQ.
13SECTION 3:
ASSETS
• Asset Break up
• Increasing Retailization
• Improving NIM Trend
• Asset Quality
• Capital AdequacySection 3: Loan Assets Breakup
Pre - Merger Post - Merger
In Rs. Cr Mar-18 Jun-18 Sep-18 Dec-18 Mar-19 Jun-19
Loan Against Property 622 776 997 8,046 9,123 9,945
MSME Loans 1,342 1,597 2,069 5,891 7,122 7,925
Housing Loans 1,617 1,923 2,246 4,509 5,145 5,675
Consumer Loans 416 528 689 13,541 14,885 16,212
JLG 3,041 3,383 3,913 4,243 4,515 4,848
KCC - - 2 6 20 37
Total Retail Funded Assets (A) 10% { 7,038 8,208 9,916 36,236 40,812 44,642 } 40%
Corporates 27,039 28,861 30,447 34,098 32,190 32,352
- Emerging Large Corporates 6,829 7,174 7,960 7,886 7,845 7,873
- Large Corporates 5,617 5,473 6,073 5,852 2,951 2,415
- Financial Institutional Group 4,960 6,728 6,727 10,158 11,988 12,933
- Others 9,633 9,486 9,687 10,203 9,406 9,132
Infrastructure 26,832 26,553 23,637 22,710 21,459 20,322
Total Wholesale Funded Assets (B) 53,871 55,414 54,084 56,809 53,649 52,675
PSL Inorganic (C) 90% 8,980 8,466 8,256 8,575 12,924 12,268 60%
Stressed Equity and SRs (D) 3,162 3,102 3,081 3,040 3,016 2,973
Total Funded Assets (A)+(B)+(C)+(D) 73,051 75,190 75,337 1,04,660 1,10,400 1,12,558
15Section 3: Retail loans as a % of total loans has quickly improved to 40% as of 30 June 2019
from 13% pre-merger, and from 35% as of 31 Dec 2018, at merger. We plan to take it to
70% in five years.
Retail Funded Assets (includes Home Loan, Business Loans, Rural, MSME and Consumer Loans) 5 Years Plan
Wholesale Funded Assets (includes Corporate and Infrastructure Loans) Rs. 1,12,558 Cr
Total Funded Assets 30%
Rs. 1,10,400 Cr
Rs. 1,04,660 Cr 70%
40%
Rs. 75,337 Cr 60%
37%
Rs. 73,051 Cr 35% 63%
13%
65%
10%
87%
90%
Mar-18 Sep-18 Dec-18 Mar-19 Jun-19
• Such change of mix of Retail Loans as a % of Total Loans has been achieved earlier at Capital First.
• The Retail Loans as % of Total Loans increased from 10% in 2010 to 90% in just 8 years, and the Retail Loans grew from Rs. 94 Crores as of 31 March 2010 to Rs. 29,625 Crores as
of 30 Sep 2018.
• The merged entity proposes to follow the same strategy and build the retail loan book going forward. The Bank will continue to report this trend every quarter going forward.
• Basically the Capital First lending model which was growing successfully and seasoned for nearly a decade, will be the key driver for the loan asset growth in the Bank
16Section 3: The Net Interest Margin of the bank has increased from 1.56% pre merger to
3.01% post merger
The bank expects that this trend will continue in the next few years
Post - Merger
3.03% 3.01%*
2.89%
(Pre – Merger)
1.56%
Q2 FY19 Q3 FY19 Q4 FY19 Q1 FY20
* NIM % would have been 3.15% in Q1 FY20 but for the reversal of Accrued Interest of Rs. 82 Cr on two identified accounts (One HFC and one financial company) where our exposure is Rs.
1,461 Cr.
17Section 3: Asset Quality
In Rs. Cr Mar-19 Jun-19
GNPL 2,136 2,419
Provisions for GNPL 1,029 1,203
NNPL 1,107 1,216
GNPA (%) 2.43% 2.66%
NNPA (%) 1.27% 1.35%
• In addition to the above, the bank has identified certain additional exposures for watch list, and as a prudent practice, has taken provisions against these
as appropriate. These are:
a) Two identified accounts (One HFC and one Financial Company). Total exposure: Rs. 1461 crores. Provisions made: Rs. 1,096 crores. Provision
Coverage 75%.
b) One Infrastructure Account. Total Exposure : Rs. 1006 crores. Provision made : Rs. 154 crores. Provision Coverage 15%. This account is a performing
Tolling concession Road with strong cash flows but repaying behind schedule by about 60 days, hence flagged.
c) Other Infrastructure loans: Total Exposure: Rs. 810 crores. Provisions made: Rs. 570 Crores. Provision Coverage : 70%.
• Since the Retail Loan Assets are a significant key driver of the growth and business model going forward, we would like to share the NPA% details
pertaining to Retail Loan Book of the Bank. As of 30 June 2019, the Gross NPA % of the Retail Loan Book was at 2.32% (as compared to 2.18% as of 31
March 2019) and Net NPA % of the Retail Loan Book of the Bank was at 1.14% (as compared to 1.24% as of 31 March 2019)
• Most of the Retail Loan Book have come from the Capital First business model where the asset quality trends have been consistently good (GNPA ~2,
NNPA ~1%) over the 8 years of operation and marginal movements quarter on quarter even out over time.
18Section 3: Capital Adequacy
Mar-19 Jun-19
Tier 1 Capital Funds 17,373 16,340
Tier 2 Capital Funds 219 156
Total Capital Funds 17,592 16,496
Total RWA 1,13,744 1,17,733
Tier 1 CRAR (%) 15.27% 13.88%
Total CRAR (%) 15.47% 14.01%
RWA/Total Assets 68.04% 69.79%
1. We have capital headroom available through raising Tier 2 capital of about Rs. 7,500 Cr which, if taken into account for the calculation on the capital base as
of 30 June 2019, would increase Capital Adequacy to about 20%
2. We plan to raise Tier 2 capital of Rs. 1,500 Cr by March 2020.
3. The Bank also has investments in equities (e.g NSE) which amounts to about Rs. 300 Cr as per current valuation. This can be liquidated as required which
would improve the Capital Adequacy as it adds to Tier-1 Capital
19SECTION 4:
LIABILITIES
• Borrowings and Deposit Composition
• CASA Growth
• Trends of Deposit Ratios
• Expanding NetworkSection 4: Breakup of Liabilities
In Rs. Cr Jun-18* Mar-19 Jun-19 YOY %
Legacy Long Term Bonds 18,909 15,752 13,865
Infra Bonds 10,434 10,434 10,434
Refinance 627 4,047 13,379
Other Borrowings 4,700 23,256 23,966
Total Borrowings (A) 34,671 53,490 61,644 78%
CASA 6,083 9,114 9,987 64%
Term Deposits 26,888 32,611 36,181 35%
Certificate of Deposits 21,086 28,754 20,058 (5%)
Total Deposits (B) 54,057 70,479 66,226 23%
Borrowings + Deposits (A)+(B) 88,728 1,23,969 1,27,870 44%
Money Market Borrowings 12,921 16,493 14,399
CASA % of Deposits 11.25% 12.93% 15.08%
CASA % of Borrowings + Deposits 5.98% 6.49% 7.02%
*Total Borrowings are not comparable as borrowing figures of June 18 are pertaining to the Standalone IDFC Bank whereas June
19 figures pertains to borrowings of merged entity IDFC First Bank. However, CASA (↑ 64%) Term Deposits (↑ 35%) and Certificate
of Deposits (↓ 5%) are comparable since these are being built on a banking franchise, earlier as well as now.
21Section 4: Improving CASA Deposit Ratio.
CASA to Total Deposits (%)
The conventional computation of CASA% in the
30.00% industry is CASA/Total deposits (CASA+ Certificate of
Deposits+ Term Deposits). Under this conventional
computation method, the bank has sharply improved
its CASA percentage within six months from 10.37%
15.08%
as of 31st December 2018 to 15.08% as of 30th June
12.93% 2019. We have already announced our target to take
10.37% this to 30% in 5 years. We believe we can get there
before the target date.
31 Dec 18 31 Mar 19 30 Jun 19 Next 5 Years
22Section 4: Improving Core Retail Deposit Ratio.
Core Deposits (Retail CASA + Retail TD) to Total Deposits &
Borrowings (%) The bank has a large proportion of liabilities in the form
of other borrowings because of our unique history i.e.
IDFC Limited was an infrastructure financing Domestic
50.00% Financial Institution and Capital First was a retail and
MSME financing NBFC. Both entities had institutional
borrowings but no retail deposits. Hence we propose to
track the Core Retail deposits (Retail CASA+ Retail Term
Deposits) as a proportion of Total Deposits as well as
borrowings as a key measure. On this measure too, the
bank has sharply improved the liability profile. The Core
Retail Deposits as a % of Total Deposits and other
11.72% Borrowings has increased from 7.97% at the time of
7.97% 9.41%
merger to 11.72% as of 30th June 2019. We plan to take
this to 50% within 5 years.
31 Dec 18 31 Mar 19 30 Jun 19 Next 5 Years The Bank is well placed to achieve its target of
improving the deposit ratios as targeted in the next 5
years.
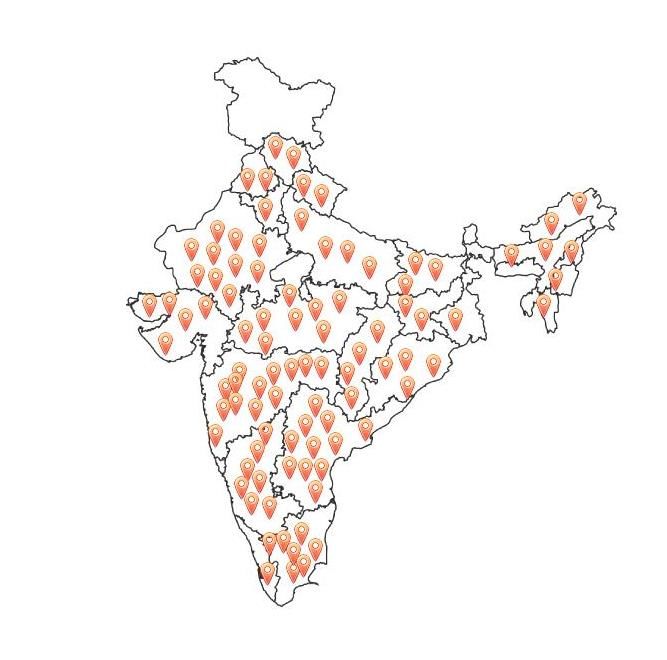
23Section 4: The combined entity has presence across the length and breadth of the
country, expanding its branch network to 279
Urban Bank Branches 162
Rural Bank Branches 117
ATMs 199
Asset Service Branches 102
(Erstwhile Capital First Branches)
Rural BC Branches (IFBL) 354
Other BC Branches 166
24SECTION 5:
FINANCIAL STATEMENTS
• Income Statement
• Balance SheetSection 5: Income Statement
In Rs. Cr (Pre-Merger)
Jun-18 Mar-19 Jun-19
Interest Income 2,321 3,629 3,793*
Interest Expense 1,831 2,516 2,619
Net Interest Income 490 1,113 1,174*
Fee & Other Income 103 291 301
Trading Gain 96 (18) 9
Core Operating Income 689 1,386 1,485
Operating Expense 446 1,148 1,167
Core Operating Profit 242 239 318
Provisions 34 655 1,281$
Profit Before Tax 208 (417) (963)
Tax 27 (199) (346)
Profit After Tax 182 (218) (617)
* After Reversal of Accrued Interest of Rs. 82 Cr on two identified accounts (One HFC and one financial company which have been downgraded recently).
$ In Q4 FY19, the Bank identified two wholesale accounts pertaining to two financial services companies and has provided for 15% provisioning on the exposure. Due to further deterioration of the
financial positions of these companies, in Q1-FY20, as a prudent measure, the Bank increased the provision cover on the two financial services accounts to 75% of principal outstanding of Rs. 1,461
crores (both accounts put together), amounting to a cumulative cover of Rs. 1,096 crores. We believe that such provisions are adequate, and we believe we are covered for any possible losses on
these accounts. The bank does not expect to take any additional provisions on these accounts in the near future.
26Section 5: Balance Sheet
(Pre-Merger)
In Rs. Cr Mar-19 Jun-19
Jun-18
Shareholders' Funds 15,438 18,159 17,545
Deposits 54,057 70,479 66,226
Borrowings 47,591 69,983 76,044
Other liabilities and provisions 5,934 8,563 8,891
Total Liabilities 1,23,021 1,67,185 1,68,705
Cash and Bank Balances 2,545 5,401 3,100
Net Loan Assets 72,240 1,06,872 1,08,582
- Net Retail Loan Assets 8,200 40,746 44,453
- Net Wholesale Loan Assets 64,040 66,126 64,130
Statutory Investments 19,572 26,598 25,578
Net Trading Investments 20,701 17,977 20,255
Fixed Assets 789 950 919
Other Assets 7,173 9,386 10,271
Total Assets 1,23,021 1,67,185 1,68,705
27SECTION 6:
DIRECTORS & SHAREHOLDERS
• Board of Directors
• Shareholding PatternSection 6: Board of Directors
Mr. V. Vaidyanathan is the first Managing Director and CEO of IDFC FIRST Bank, a bank founded by the merger of Capital First and IDFC Bank in
December 2018. He is a banker turned entrepreneur turned banker by merging the NBFC he founded with an existing commercial bank. He holds shares
and options totalling 3.60% of the equity of the company on a fully diluted basis.
Prior to this role, he founded Capital First Limited by first acquiring an equity stake in an existing NBFC, and then executing a Leveraged Management
Buyout (MBO) by securing an equity backing of Rs. 810 crores in 2012 from PE Warburg Pincus. The MBO included (a) buyout of majority and minority
shareholders through Open Offer to public; (b) Fresh capital raise of Rs. 100 crores into the company; (c) Reconstitution of the Board of Directors (d)
Change of business from wholesale to retail lending; (e) Creation of a new brand "Capital First".
As part of his entrepreneurial foray, he left ICICI Group in 2010 and acquired a stake in a small start-up NBFC. He then exited legacy businesses of Real
estate financing, Foreign Exchange, Broking, Investment management businesses and instead transformed the company into a large retail financing
institution with operations in more than 225 locations across India. Between March 2010 to September 2018, he grew the retail financing book from Rs.
94 crores ($14 million) to Rs. 29,625 crores ($4.06 billion), grew the Equity Capital from Rs. 690 crores ($106 million) to Rs. 2,928 crores ($401.1 million)
reduced Gross NPA from 5.36% to 1.94% & reduced Net NPA from 3.78% to 1.00%, and from losses of Rs. 32 crores to Profits of Rs. 328 crores (FY 18)
Under his leadership, Company's long term credit rating was upgraded four notches to AAA.
Earlier, he joined ICICI Limited in early 2000 when it was a Domestic Financial Institution (DFI) and the retail businesses he built helped the transition of ICICI from a DFI to a Universal Bank. He
built the Retail Banking Business for ICICI Limited since its inception, and grew ICICI Bank (post merger in 2002) to 1411 Bank branches in 800 cities, 25 million customers, a vast CASA and retail
deposit base, branch, internet and digital banking, built a retail loan book of over Rs. 1,35,000 crores ($20 billion) in Mortgages, Auto loans, Commercial Vehicles, Credit Cards, Personal Loans.
In addition, he also built the SME business and managed the Rural Banking Business for the bank. These businesses helped the conversion of the institution to a universal bank renowned for
retail banking.
He was appointed the Executive Director on the Board of ICICI Bank in 2006 at 38, and later became the Managing Director on the Board of ICICI Prudential Life Insurance Company in 2009. He
was also the Chairman of ICICI Home Finance Co. Ltd (2006), and served on the Board of CIBIL- India's first Credit Bureau (2005), and SMERA- SIDBI's Credit Rating Agency (2005). He started his
career with Citibank India in 1990 and worked there till 2000, where he learnt the ropes in Consumer Banking.
During his career, he and his organization have received a number of domestic and international awards including the prestigious CNBC Asia "Innovative company of the year" IBLA-2017,
"Most Inspirational Leveraged Management Buyout, India 2018" by CFI Awards, "Entrepreneur of the Year" Award at Asia Pacific Entrepreneurship Awards 2017, "Transformational Leader
2018" by CFI Awards UK, "Financial Services Company of the Year, 2018 - VC Circle", "Outstanding contribution to Financial Inclusion, India, 2017" from Capital Finance International, London,
"Most Promising Business Leaders of Asia" 2016 by Economic Times, 'Outstanding Entrepreneur Award' in Asia Pacific Entrepreneurship Awards 2016, Greatest Corporate Leaders of India-
2014, Business Today - India's Most Valuable Companies 2016 & 2015, Economic Times 500 India's Future Ready Companies 2016, Fortune India's Next 500 Companies 2016, Dun & Bradstreet
India's Top 500 Companies & Corporates 2016 & 2015. During his prior stint, awards included "Best Retail bank in Asia 2001", "Excellence in Retail Banking Award" 2002, "Best Retail Bank in
India 2003, 2004, and 2005" from the Asian Banker, "Most Innovative Bank" 2007, "Leaders under 40" from Business Today in 2009, and was nominated "Retail Banker of the Year" by EFMA
Europe for 2008. He is an alumnus of Birla Institute of Technology and Harvard Business School. He is a regular marathoner and has run 22 half-marathons and 8 full marathons.
29Section 6: Board of Directors
DR. RAJIV B. LALL - PART-TIME NON-EXECUTIVE CHAIRMAN
Dr. Rajiv Lall is the Non-Executive Chairman of IDFC Bank. He was the Founder MD & CEO of IDFC Bank from October 1, 2015 till December 18, 2018. Previously, he was the
Executive Chairman of IDFC Limited. A veteran economist for 30 years, Dr. Lall has been an active part of the finance and policy landscape, both in India and internationally. In
his diverse career, he has also held leadership roles in global investment banks and multilateral agencies.
MS. ANINDITA SINHARAY – NON-EXECUTIVE NON INDEPENDENT DIRECTOR (REPRESENTING THE GOVT. OF INDIA)
Ms. Anindita Sinharay is an Indian Statistical Service (2000) officer working as a Director in the Department of Financial Services, Ministry of Finance. She holds a post graduate
degree in Statistics from the University of Calcutta. She has vast working experience of more than one decade in National Accounts Statistics in Central Statistics Office (CSO)
and analysis of data of large scale sample surveys conducted by National Sample Survey Office (NSSO).
MR. SUNIL KAKAR - NON-EXECUTIVE NON INDEPENDENT DIRECTOR (REPRESENTING IDFC LIMITED)
Mr. Sunil Kakar is the Managing Director & CEO of IDFC Limited. He started his career at Bank of America where he worked in various roles, covering Business Planning &
Financial Control, Branch Administration and Operations, Project Management and Internal Controls. After Bank of America, Mr. Kakar was the CFO at Max New York Life
Insurance. He led numerous initiatives including Planning, Investments / Treasury, Finance and Accounting, Budgeting and MIS, Regulatory Reporting and Taxation.
MR. ANAND SINHA - INDEPENDENT DIRECTOR
Mr. Anand Sinha joined the Reserve Bank of India in July 1976 and rose to become Deputy Governor in January 2011. He was Adviser in RBI up to April 2014 after demitting
the office of Deputy Governor in RBI on 18th January 2014. As Deputy Governor, he was in-charge of regulation of commercial banks, Non-Banking Financial Companies,
Urban Cooperative Banks and Information Technology, among others.
MR. HEMANG RAJA - INDEPENDENT DIRECTOR
Mr. Hemang Raja, is an MBA from Abeline Christian University, Texas, with a major emphasis on finance. Mr. Raja has also been the head of Capital Market activities in the
Institutional and Retail Segments when he started and became the Managing Director and CEO of the then newly formed initiative by IL&FS, namely IL&FS Investsmart Ltd.
His last assignment from the year 2006 onwards was in the area of Private Equity and Fund Management business with Credit Suisse and Asia Growth Capital Advisers in India
as MD and Head - India.
30Section 6: Board of Directors
DR.(MRS.) BRINDA JAGIRDAR - INDEPENDENT DIRECTOR
Dr. (Mrs.) Brinda Jagirdar, is an independent consulting economist with specialization in areas relating to the Indian economy and financial intermediation. She is on the
Governing Council of Treasury Elite, a knowledge sharing platform for finance and treasury professionals. She retired as General Manager and Chief Economist, State Bank of
India, based at its Corporate Office in Mumbai. She has a brilliant academic record, with a Ph.D. in Economics from the Department of Economics, University of Mumbai, M.S.
in Economics from the University of California at Davis, USA, M.A. in Economics from Gokhale Institute of Politics and Economics, Pune and B.A. in Economics from Fergusson
College, Pune. She has attended an Executive Programme at the Kennedy School of Government, Harvard University, USA and a leadership programme at IIM Lucknow.
MR. SANJEEB CHAUDHURI - INDEPENDENT DIRECTOR
Mr. Sanjeeb Chaudhuri is a Board member and Advisor to global organizations across Europe, the US and Asia. He has most recently been Regional Business Head for India
and South Asia for Retail, Commercial and Private Banking and also Global Head of Brand and Chief Marketing Officer at Standard Chartered Bank. Prior to this, he was CEO
for Retail and Commercial Banking for Citigroup, Europe, Middle East and Africa. He has an MBA in Marketing and has completed an Advanced Management Program.
MR. PRAVIR VOHRA - INDEPENDENT DIRECTOR
Mr. Pravir Vohra is a postgraduate in Economics from St. Stephen's College, University of Delhi & a Certified Associate of the Indian Institute of Bankers. He began his career in
banking with State Bank of India where he worked for over 23 years. He held various senior level positions in business as well as technology within the bank, both in India &
abroad. The late 1990s saw Mr. Vohra as Vice President in charge of the Corporate Services group at Times Bank Ltd. In January 2000, he moved to the ICICI Bank group where
he headed a number of functions like the Retail Technology Group & Technology Management Group. From 2005 till 2012 he was the President and Group CTO at ICICI Bank.
MR. AASHISH KAMAT - INDEPENDENT DIRECTOR
Mr. Aashish Kamat has over 30 years of experience in the corporate world, with 24 years being in banking & financial services & 6 years in public accounting. Mr. Kamat was
the Country Head for UBS India, from 2012 until his retirement in January 2018. Prior to that he was the Regional COO/CFO for Asia Pacific at JP Morgan based out of Hong
Kong. Before moving to Hong Kong, Mr. Kamat was in New York, where is was the Global Controller for the Investment Bank (IB) at JP Morgan in New York; & at Bank of
America as the Global CFO for the IB, and, Consumer and Mortgage Products. Mr. Kamat started his career with Coopers & Lybrand, a public accounting firm, in 1988 before
he joined JP Morgan in 1994.
MR. VISHAL MAHADEVIA – NON-EXECUTIVE NON INDEPENDENT DIRECTOR 31
Mr. Vishal Mahadevia joined Warburg Pincus in 2006 & is a member of the firm’s executive management group. Previously, he was a Principal at Greenbriar Equity Group, a
fund focused on private equity investments in the transportation sector. Prior to that, Mr. Mahadevia worked at Three Cities Research, a New York-based PE fund, & as a
consultant with McKinsey & Company. He received a B.S. in economics with a concentration in finance & B.S. in electrical engineering from the University of PennsylvaniaSection 6: Shareholding Pattern as of 30th June 2019
Scrip Name : IDFC FIRST Bank (BSE: 5394437, NSE:IDFCFIRSTB) Key shareholders % Holding
Trusts and IDFC Financial Holding Company Limited 40.00
Other Body Clearing
Corporate, Members, Warburg Pincus through its affiliated entities 9.99
PRESIDENT 2.8% 0.3%
OF INDIA, President of India 5.47
5.5%
GIC Singapore 3.94
Aditya Birla Asset Management 2.43
Public (incl
Promoters,
NRIs), 22.3% Platinum Asset Management 2.01
40.0%
Vanguard 1.66
MF/Insuranc
Odessey 44 1.48
e/AIF/Bank/F
V Vaidyanathan* 1.18
I, 4.1%
Wellington 0.92
FII/FPI/Forei
gn Dimensional Fund Advisors 0.88
Corporate,
25.0% *On a fully diluted basis, including shares and options, Mr. Vaidyanathan holds 3.60% of the
th
Total # of shares as of 30 June 2019 : 4,78,24,77,126 equity of the Bank including shares held in his social welfare trust.
Book Value per Share as of 30th June 2019: Rs. 36.69
32SECTION 7:
Capital First Strategy, Loan Growth and
Profitability Trends for 8 years
(Before Merger with IDFC Bank)
• History of Capital First Limited
• Transformation into Retail Franchise
• Business Areas of Focus
• Past Financial PerformancesSince the business model of Capital First is an important part of the business to be built in the merged bank, we present to you the business model, business lines, business and profitability trajectory, and financial trends of Capital First Limited. The following slides are essentially an extract of the last official investor presentation of Capital First just prior to the merger (Period ending September 30 2018) and are meant to give the reader a picture of what the merged bank could look like in the years to come.
Section 7: Capital First Strategy, Loan Growth and Profitability Trends for 8 Years before
merger with IDFC Bank
History of Capital First Limited
     The Company was first listed on Stock Exchanges in January 2008. Between 2010 to 2012, Mr Vaidyanathan acquired a stake in the company and executed a
     Management Buyout (MBO) of the Company with equity backing of Rs. 810 Crore from Warburg Pincus, and created a new brand and entity called Capital First. As
     part of the MBO, the company raised fresh equity, reconstituted a new Board and got new shareholders, including open offer to public. A brief history of the
     company is as follows:

     2008-10       The Company was largely in the business of Wholesale Financing, PE, Asset Management, Foreign Exchange and Retail Equity Broking.
                   The total AUM of the Company was Rs. 935 crores of which Retail AUM was 10%, Rs. 94 crores.
     2010-11       Mr. V Vaidyanathan joined the Company and prepared the ground for executing a Management Buyout by taking significant corporate actions including divesting
                   Forex JV to JV partner, merging a subsidiary NBFC with itself, by winding down other non core businesses and launching retail businesses in the Company. The
                   Company launched technology driven financial businesses for the consumer and SME segments. The Retail loan book crossed Rs. 700 crores by March 2011. The
                   Company presented this as proof of concept to many global private equity players for Buyout.
     2011-12       The company continued to present the concept to prospective PE players throughout the year. The Company undertook additional corporate actions and further
                   wound down non-core business subsidiaries and launched more retail financing businesses. The concept, model and volume of retail financing businesses
                   gained traction and reached to Rs. 3,660 crores, 44% of the overall AUM.
     2012-13       Mr. Vaidyanathan secured equity backing of Rs. 810 billion from Warburg Pincus for an MBO and thus Capital First was founded. As part of the transaction an open
                   offer was launched, the Company raised Rs. 100 Cr of fresh equity capital, a new Board was reconstituted and a new brand and entity “Capital First” was created.
     2013-14       The Company further raised Rs. 178 Cr as fresh equity at Rs. 153/ share. It acquired HFC license from NHB and launched housing finance business under its wholly
                   owned subsidiary.
     2014-15       Company’s Assets under Management reached Rs. ~12,000 Cr and the number of customers financed since inception crossed 10 lacs. The Company raised Rs. 300
                   Crores through QIP at Rs. 390 per share from marquee foreign and domestic investors.
     2015-16       The Company received recognition as “Business Today – India’s most Valuable Companies 2015” and “Dun & Bradstreet – India’s top 500 Companies, 2015”. The
                   Company scrip was included in S&P BSE 500 Index.
     2016-17       Company’s Assets under Management reached ~ Rs. 20,000 Cr and the number of customers financed since inception crossed 4.0 million. The Company raised
                   fresh equity capital of Rs. 340 Cr from GIC, Singapore through preferential allotment @ Rs. 712 per share. The Company received recognition as “CNBC Asia –
                   Innovative Company of the Year, IBLA, 2017”, “Economic Times – 500 India’s Future Ready Companies 2016” and “Fortune India’s Next 500 Companies, 2016”.
     2017-18       The Company’s Asset Under Management touch ~Rs. 27,000 Cr and number of customers financed crossed 6.0 million. The Company received “Best BFSI Brand
                   Award 2018” at The Economic Times Best BFSI Brand Awards 2018 and “Financial Services Company of the Year 2018” at VC Circle Awards 2018. In January 2018,
                   the Company announced the merger with IDFC Bank subject to regulatory approvals.

                                                                                                                                                              35
Section 7: Capital First Strategy, Loan Growth and Profitability Trends for 8 Years before
merger with IDFC Bank
History of Capital First Limited
From 31-March-2010 to 31-Mar-2018, the company has transformed across all key parameters including: 8-Yr CAGR% %Growth – FY18
• The total Capital has grown from Rs. 691 Cr to Rs. 3,993 Cr Total Capital 25% 17%
• The Assets under Management increased from Rs. 935 Cr to Rs. 26,997 Cr
Total AUM 52% 36%
• The Retail Assets Under Management increased from Rs. 94 Cr to Rs. 25,243 Cr
• The long term credit rating has upgraded from A+ to AAA Retail AUM 101% 38%
• The number of lenders increased from 5 to 297
• The Gross NPA reduced from 5.28% to 1.62%
• The Net NPA reduced from 3.78% to 1.00%
• Cumulative customers financed reached over 7 million
• The Net Profit/(Loss) increased from loss of Rs. 32.2 Cr in FY 09 to Profit of Rs. 327.4 Cr (FY18)
The 5 year CAGR for key parameters are as follows:
o Total Asset Under Management has grown at a CAGR of 29% from Rs. 7,510 Cr (FY13) to Rs. 26,997 Cr (FY18)
o Total Income has grown at a CAGR of 47% from Rs. 357.5 Cr (FY13) to Rs. 2429.6 Cr (FY18)
o Profit After Tax has grown at a CAGR of 56% from Rs. 35.1 Cr (FY13) to Rs. 327.4 Cr (FY18)
o Earning Per Share has grown at a CAGR of 46% from Rs. 4.94 (FY13) to Rs. 33.04 (FY18)
36Section 7: Capital First Strategy, Loan Growth and Profitability Trends for 8 Years before
merger with IDFC Bank
Transformation into Retail Franchise
* As per Ind - AS
Since 2010, the company has consistently stayed with the founding theme of financing entrepreneurs, Rs. 32,622 Cr*
$ 4.47 bn
MSMEs and consumers through the platform of technology & has grown the retail franchise
A highly diversified portfolio across 600 industries and over 70 lakh customers Rs. 26,997 Cr
Retail Loan Assets becoming 91% of the Overall Loan Assets $ 4,15 bn 9%
This transformation & diversification has resulted in high asset quality, consistency of growth, and sustained increase in profits.
Rs. 19,824 Cr
$ 3.05 bn 6%
Retails loans
Rs. 16,041 Cr
91%
Real Estate & Corporate Loans $ 2.47 bn
7%
Rs. 11,975 Cr
94%
Total AUM
$ 1.84 bn
14%
93%
Rs. 9,679 Cr
$ 1.49 bn 16%
Rs. 7,510 Cr 86%
$ 1.16 bn
19%
84%
Rs. 6,186 Cr
$ 0.95 bn 26% 81%
Rs. 935 Cr
Rs. 2,751 Cr
74% As a result, the growth in the net profit of the Company has outpaced the growth of the loan book
$ 0.42 bn
$ 0.14 bn 44% 56% demonstrating increased efficiency in use of capital. The company plans to continue to build in this strategic
28% direction and aims to grow the loan book at a CAGR of 25% over the next three years.
10% 72%
FY10 FY11 FY12 FY13 FY14 FY15 FY16 FY17 FY18 Q2 FY19
37Section 7: Capital First Strategy, Loan Growth and Profitability Trends for 8 Years before
merger with IDFC Bank
Transformation into Retail Franchise
The company’s product launches had been highly successful in the marketplace and the company had emerged as a significant player
in Indian retail financial services within eight years of inception with the Retail Loan Book crossing Rs. 29,625 Crores (USD 4.06 bn)
Rs. 29,625 Cr*
($4,058Mn)
Rs. 25,243 Cr (91% of AUM)
($3,891Mn)
(94% of AUM)
Rs. 18,353 Cr
($2,824Mn)
(93% of AUM)
Rs. 13,756 Cr
($2,116 Mn)
Rs. 10,113 Cr (86% of AUM)
Rs. 7,883 Cr ($1,556 Mn)
($1,213 Mn) (84% of AUM)
Rs. 5,560 Cr
($855 Mn) (81% of AUM)
Rs. 3,460 Cr
($532 Mn) (74% of AUM)
Rs. 94 Cr Rs. 771 Cr (56% of AUM)
($15 Mn) ($119 Mn)
(10% of AUM) (28% of AUM)
31-Mar-10 31-Mar-11 31-Mar-12 31-Mar-13 31-Mar-14 31-Mar-15 31-Mar-16 31-Mar-17 31-Mar-18 30-Sept-18
*Under Ind - AS
38Section 7: Capital First Strategy, Loan Growth and Profitability Trends for 8 Years before
merger with IDFC Bank
Business Area of Focus
LINES OF BUSINESS: Capital First provided financing to select segments that are traditionally underserved by the
existing financing system
• By staying focused on a specific niche (small entrepreneurs and Indian consumers), the company avoided competing with traditional large players.
• Capital First provides financing to select segments that are traditionally underserved by the existing financing system.
• Traditionally these end uses are underserved by the financial system as ticket sizes are small, credit evaluation is difficult, collections is difficult, and business is often
unviable owing to huge operating and credit costs.
Loans for Business
Loans for Plant & Expansion
Short Term Business
Machinery funding
MSMEs Loans for Two Wheeler
Loans for office display
panels --------------- purchase
Consumers
Loans for Air- Loans for Office
Conditioners Furniture
Loans for Office
Automation – PCs,
Laptops, Printers
39Section 7: Capital First Strategy, Loan Growth and Profitability Trends for 8 Years before
merger with IDFC Bank
Business Area of Focus
SPECIALITY: MSME Financing – A key area of focus for Capital First
Capital First has emerged as a Specialized Player in financing MSMEs by offering different products for their various financing needs
Typical Loan Ticket Size From CFL Typical Customer Profile
To Small and Medium Entrepreneurs financing based on customised cash flow analysis and
Rs. 10 lacs - Rs. 2 crores
references from the SME’s customers, vendors, suppliers.
To Small Entrepreneurs/ partnership firms in need of immediate funds, for say, purchase of
Rs. 1 lakh - Rs. 10 lacs
additional inventory for an unexpected large order.
To Micro business owners and consumers for purchase of office PC, office furniture, Tablets, Two-
Rs. 15k - Rs. 1 lakh
Wheeler, etc.
40Section 7: Capital First Strategy, Loan Growth and Profitability Trends for 8 Years before
merger with IDFC Bank
Business Area of Focus – Risk Management
STRONG RISK MANAGEMENT PROCEDURES:
Capital First is structured with inherent checks and balances for effective risk management
Credit Policy Credit Portfolio
Business Loan Booking &
(For defining Underwriting Monitoring &
Origination Team Operations Team
Lending Norms) Team Collections
Sales, credit, operations and collections are independent of each other, with independent reporting lines
for checks and balances in the system
41Section 7: Capital First Strategy, Loan Growth and Profitability Trends for 8 Years before
merger with IDFC Bank
Business Area of Focus – Underwriting Process
Rigorous Credit Underwriting Process helped in maintaining high asset quality
2-3 ✘ In the Mortgages business at Capital First, about 38% of the total
38-40 ✘
applications were disbursed after passing through several levels of
scrutiny and checks, mainly centred around cash flow evaluation,
credit bureau and reference checks. Most rejections were because of
the lack of visibility or inadequate cash flows to service the loan.
2-4 ✘ 5-7 ✘
10-12✘
100
38
Application Logged in CIBIL / Credit Bureau Rejection Due to Rejection after Rejection due to Rejection for Other Net Disbursals
Rejection Insufficient Cashflow Personal Interview Legal & Technical Reasons
/ Documentation Reasons
42Section 7: Capital First Strategy, Loan Growth and Profitability Trends for 8 Years before
merger with IDFC Bank
Business Area of Focus – Asset Quality
STABLE ASSET QUALITY: The Company’s asset quality consistently remained high consistently over 8 years.
This is despite the fact that the company was providing finance in a less banked segment. Further the portfolio has been stress tested over three significant events since inception :
a) FY 2010-2014 where there was high inflation, elevated interest rates and sharp Rupee Depreciation,
b) Demonetization (FY16) where 86% of the country’s currency was invalidated and
c) GST Implementation (FY17) which affected our target segment directly.
Over 8 years, the GNPA was ~1.7% and NNPA was ~1.0% which came down from 5.28% and 3.78% respectively (31-March-10)
5.28%
3.78% Demonetization CFL-GNPA CFL-NNPA
GST Launched
Nov 8th 2016 July 1st 2017
1.74% 1.71% 1.59% 1.65% 1.72% 1.63% 1.59% 1.62%
1.52% 1.57%
1.21% 1.13% 1.04%
0.97% 1.00% 1.00% 1.00% 0.97% 1.00% 1.00%
31-Mar-10 31-Mar-16 30-Jun-16 30-Sep-16 31-Dec-16 31-Mar-17 30-Jun-17 30-Sep-17 31-Dec-17 31-Mar-18 30-Jun-18
Note: NPA recognition norm migrated to 90 dpd effective from 01 April, 2017.
43Section 7: Capital First Strategy, Loan Growth and Profitability Trends for 8 Years before
merger with IDFC Bank
Shareholding Pattern
Key Shareholders of Capital First Limited (as of 30 September 2018)
Warburg Pincus, through its affiliate entities
V. Vaidyanathan
GIC, Sovereign Wealth Fund, Singapore
25.72%
Government Pension Fund Global, Norway
35.52%
Birla Asset Management, India
HDFC Mutual Fund, India
Vanguard, USA
3.50%
Jupiter Asset Management, UK
TIAA, USA
10.51%
DSP Blackrock, India
MV SCIF, Mauritius
24.75%
Dimensions Group, USA
Kotak Mutual fund, India
Warburg Pincus Affiliated Companies FII & FPI
ICICI Prudential Mutual Fund, India
Financial Institution/Bank/MF/ Insurance Bodies Corporate
Individuals & Others JOM Silkkitie, Finland
Total # of shares as of 30 September, 2018: 9,90,52,644
Book Value per Share as per Ind AS : Rs. 296 (US$4.05)
44Section 7: Capital First Strategy, Loan Growth and Profitability Trends for 8 Years before
merger with IDFC Bank
Financial Performance: The Asset Under Management has consistently grown at a 8 year CAGR of 52%, FY18 – 37%
FY18: YoY Growth 32,622
Asset Under Management (Rs. Cr) 37%
26,997
19,824
16,041
11,975
9,679
7,510
6,186
2,751
935
FY10 FY11 FY12 FY13 FY14 FY15 FY16 FY17 FY18 H1-FY19
45Section 7: Capital First Strategy, Loan Growth and Profitability Trends for 8 Years before
merger with IDFC Bank
Financial Performance: the ROE of the Company increased over the years as a result of transformation
Yearly Return on Equity (%)
Note: RoE for Q4-FY18 (quarterly annualized) was ~ 15% and trending consistently upwards. 14.51%
13.31%
11.93%
10.14%
New Management took
8.33%
over in 2010
4.93%
3.63%
0.47%
-2.12%
-4.44% -3.92%
-6.08%
FY08 FY09 FY10 FY11 FY12 FY13 FY14 FY15 FY16 FY17 FY18 H1-FY19
Note: FY13 onwards, the Company amortized securitization income. Prior periods to that are normalized for such items for consistency to arrive at normalized profitability
46Section 7: Capital First Strategy, Loan Growth and Profitability Trends for 8 Years before
merger with IDFC Bank
Financial Performance: Yearly Trend of Profit After Tax
In FY 08 and 09, the Company had made losses. Even after the new leadership took over, for two years the company continued to post losses as
the building blocks for new age retail lending were prepared. Once the company turned around and became profitable in FY 12, there was no
looking back, Capital First posted a CAGR growth in profits of 56% for last 5 years, latest year profit up 37%.
Profit After Tax (Normalized) – Rs. Cr
New Leadership takes over in 2010. * For Half Year H1-FY19
New Retail Product Lines launched.
Retail Team, Systems, Processes designed. 327.4
Closed down subsidiaries, prepared
company for PE equity backing
Platform set for Business growth and
Profitability. 238.9
206.1*
Company turned profitable in 166.2
FY12 and since then
consistently increased profit 114.3
for the next 6 years with a
CAGR of 45% 53.2
35.1
3.8
-15.7
-28.8 -32.1
-46.2
FY08 FY09 FY10 FY11 FY12 FY13 FY14 FY15 FY16 FY17 FY18 H1-FY19
47Section 7: Capital First Strategy, Loan Growth and Profitability Trends for 8 Years before
merger with IDFC Bank
Financial Performance: Yearly Earning per Share (EPS) Trend
Earning per Share (EPS) has consistently grown at CAGR of 46% in the last 5 years, this created value for all
shareholders. Earning Per Share (Rs.)
33.04
24.52
18.22
12.56
6.44
4.94
0.59
(2.47)
(4.55) (5.05)
(7.13)
FY08 FY09 FY10 FY11 FY12 FY13 FY14 FY15 FY16 FY17 FY18
48Section 7: Capital First Strategy, Loan Growth and Profitability Trends for 8 Years before merger with IDFC Bank Financial Performance: Trend of Cost of Income Ratio (yearly) The Cost to Income ratio, which was high at ~130% in the early stages of the company, reduced to
Section 7: Capital First Strategy, Loan Growth and Profitability Trends for 8 Years before
    merger with IDFC Bank
    The Market Cap of the Company has grown 800% since inception and 1,000% since the Management Buyout in 2012

                                                                         Market Capitalization (Rs. Cr)                             8,282#
                                                                                                                         7,628

During this phase, the Company -
•      built the Retail Platform, technologies                                                                                                   6,096
       for chosen segments,
•      divested / closed down non-core
       businesses like broking, property
       services, Forex services etc,                                                                         3,937
•      Merged NBFC subsidiary with the                                                           3,634
       parent
•      brought down high NPA levels (GNPA
       5.28% and NNPA 3.78%)

                                                                                 1,478
       1,174                                                   1,152
                           902               782*

    31-Mar-10         31-Mar-11          31-Mar-12         31-Mar-13          31-Mar-14        31-Mar-15   31-Mar-16   31-Mar-17   12-Jan-18   31-Mar-18
    * Market Cap as on 31-March-2012, the year of Management Buyout
    # Market Cap on the day before the announcement of merger with IDFC Bank (Jan 13, 2018).
Section 7: Capital First Strategy, Loan Growth and Profitability Trends for 8 Years before
merger with IDFC Bank
Financial Performance: Trend of Dividend Payouts
The Company has been steadily increasing dividend pay-out every year starting from 10% in FY10 to 28% in FY18.
Dividend (as % of face value per share) 28%
26%
24%
22%
20%
18%
15% 15%
10%
FY10 FY11 FY12 FY13 FY14 FY15 FY16 FY17 FY18
51Section 7: Summary – Strategy for IDFC FIRST Bank
In summary, under our stated strategy for the combined entity, IDFC
FIRST Bank, the same successful model of Capital First lending
business is now being built on a Bank platform from IDFC Bank, thus
the business becomes more profitable, robust and sustaining because
of availability of low cost and more abundant funding.
52SECTION 8:
STRATEGY GOING FORWARD FOR THE
COMBINED ENTITY
• Key Strategies for the combine entity –
Asset Strategy
• Growth of Assets
• Diversification of Assets
• Gross Yield expansion
Liability Strategy
• CASA Growth
• Diversification of Liability
• Branch Expansion
Profitability
• Expand Net Interest Margin
• Reduce Cost to Income Ratio
• Improve RoA and RoESection 8: Disclaimer
Certain statements contained in this presentation that are not statements of historical fact constitute “forward-
looking statements.” You can generally identify forward-looking statements by terminology such as “aim”,
“anticipate”, “believe”, “continue”, “could”, “estimate”, “expect”, “intend”, “may”, “objective”, “goal”, “plan”,
“potential”, “project”, “pursue”, “shall”, “should”, “will”, “would”, or other words or phrases of similar import. These
forward-looking statements involve known and unknown risks, uncertainties, assumptions and other factors that
may cause the Company’s actual results, performance or achievements to be materially different from any future
results, performance or achievements expressed or implied by such forward-looking statements or other
projections. (for Full text of disclaimer please refer to page 2)
54Section 8: Asset Strategy
• Growth of Assets:
• The Bank plans to grow retail loan assets from Rs. 36,236 Cr (December 31, 2018) to over Rs. 100,000 Cr in the next 5
years
• The Bank plans to wind down loans to infrastructure to NIL within five years ( Rs. 22,710 as of 31 December 2018).
• The Bank plans to reduce the total Wholesale loan assets (including the Infrastructure Loans) from Rs. 56,809 Cr
(December 31, 2018) to Rs. 40,000 Cr by March 2020 in order to rebalance and diversify the overall Loan Book.
Thereafter, the Bank plans to maintain it at the similar levels for the next 5 years and would grow the business based on
opportunities available at the marketplace.
• Diversification of Assets: We recognize that loan book of the bank needs to be well diversified across sectors and a
large number of consumers. The Bank plans to increase the retail book composition from 34.62% to 70% within 5 years and
set the target to take it to 80% thereon.
• Gross Yield Expansion: As a result of the growth of the retail loan (at a relatively higher yield compared to the wholesale
loans), the gross yield of the Bank’s Loan Book was initially guided to increase from 9.2% (as per Q2-FY19, pre-merger) to
more than 12% in the next 5 years, however we now upgrade our guidance and project the yield to be at 13.5% in the next 5
years. The bank will expand Housing loan portfolio as one of its important product lines.
55You can also read


