The connection between forest degradation and urban energy demand in sub-Saharan Africa: a characterization based on high-resolution remote ...
←
→
Page content transcription
If your browser does not render page correctly, please read the page content below
LETTER • OPEN ACCESS

The connection between forest degradation and urban energy demand
in sub-Saharan Africa: a characterization based on high-resolution
remote sensing data
To cite this article: F Sedano et al 2021 Environ. Res. Lett. 16 064020

View the article online for updates and enhancements.

                                This content was downloaded from IP address 46.4.80.155 on 31/08/2021 at 16:31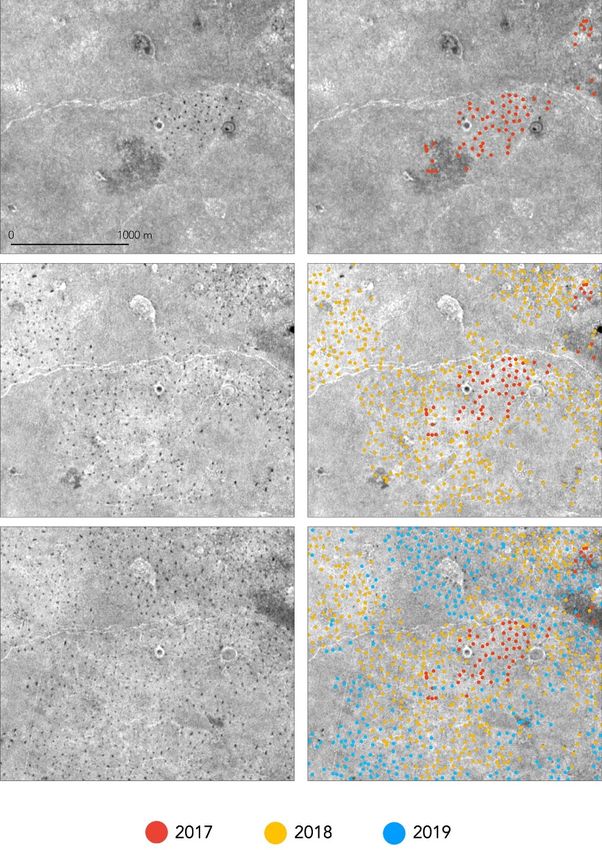
Environ. Res. Lett. 16 (2021) 064020 https://doi.org/10.1088/1748-9326/abfc05
LETTER
The connection between forest degradation and urban energy
OPEN ACCESS
demand in sub-Saharan Africa: a characterization based on
RECEIVED
18 January 2021 high-resolution remote sensing data
REVISED
23 March 2021 F Sedano1, S N Lisboa2, R Sahajpal1, L Duncanson1, N Ribeiro2, A Sitoe2, G Hurtt1 and C J Tucker3
ACCEPTED FOR PUBLICATION 1
27 April 2021 Department of Geographical Sciences, University of Maryland, College Park, Maryland, United States of America
2
Department of Forest Engineering, Faculty of Agronomy and Forest Engineering, UEM, Mozambique
PUBLISHED 3
21 May 2021
NASA—Goddard Space Flight Center, Greenbelt, Maryland, United States of America
E-mail: fsedano@umd.edu
Original content from
Keywords: forest degradation, charcoal production, urban energy demand, high-resolution remote sensing, sub-Saharan Africa
this work may be used
under the terms of the Supplementary material for this article is available online
Creative Commons
Attribution 4.0 licence.
Any further distribution
of this work must Abstract
maintain attribution to
the author(s) and the title Charcoal is a key energy source for urban households in sub-Saharan Africa and charcoal
of the work, journal
citation and DOI. production is the main cause of forest degradation across the region. We used multitemporal
high-resolution remote sensing optical imagery to quantify the extent and intensity of forest
degradation associated with charcoal production and its impact on forest carbon stocks for the
main supplying area of an African capital. This analysis documents the advance of forest
degradation and quantifies its aboveground biomass removals over a seven-year period, registering
that, between 2013 and 2016, the average annual area under charcoal production was 103 km2 and
the annual aboveground biomass removals reached 1081 000 (SD = 2461) Mg. Kiln densities in the
study area rose to 2 kilns-ha, with an average of 90.7 Mg ha−1 of extracted aboveground biomass.
Charcoal production was responsible for the degradation of 55.5% of the mopane woodlands in
the study area between 2013 and 2019. We estimated post-disturbance recovery times using an
ecosystem model calibrated for the study area. The simulations showed that recovery times could
require up to 150 years for current aboveground biomass extraction rates. The results of the remote
sensing analysis and the simulations of the ecosystem model corroborate the unsustainability of the
present patterns of charcoal production. The detailed characterization of the spatial and temporal
patterns of charcoal production was combined with household survey information to quantify the
impact of the urban energy demand of the Maputo urban area on forest carbon stocks. The
analysis shows that Maputo charcoal demand was responsible for the annual degradation of up to
175.3 km2 and that the contribution of the study area to this demand fluctuated between 75% and
33% over the study period. The extent, advance pace and distance from urban centers documented
in this study support the idea that forest degradation from charcoal production cannot merely be
considered a peri-urban process. The intensity of the aboveground biomass (AGB) removals and
its contribution to forest carbon stocks changes is significant at the national and regional levels.
1. Introduction the cities (Grimm et al 2008), and it could poten-
tially reshape rural landscapes (Güneralp et al 20187).
Africa is experiencing a rapid urbanization process The connection between urban demand for food
(Grant 2016). While only 30% of the African popu- and fiber and environmental degradation has been
lation lived in urban centers in 2000, forecasts indic- extensively documented (DeFries et al 2010, Satterth-
ate that this figure will reach 60% in 2050 (UN- waite et al 2010, Seto and Ramankutty 2016, Boudet
Habitat 2014). This urbanization process is expec- et al 2020). Yet, in sub-Saharan Africa (SSA) the link
ted to have major implications for the natural envir- between urban energy demand and forest carbon
onments within the growing sphere of influence of stock changes is particularly relevant (Arnold et al
© 2021 The Author(s). Published by IOP Publishing Ltd
Environ. Res. Lett. 16 (2021) 064020                                                                  F Sedano et al

2006, Clancy 2008). Traditional biomass accounts for      provide suitable carbon emission estimates associ-
almost half of the energy consumption in Africa,          ated with forest degradation processes (Herold et al
and charcoal is the main cooking energy source for        2011). Monitoring forest degradation from charcoal
African urban centers in 21 countries of SSA (ICF         production with Earth observation data also remains
2012, International Energy Agency 2019). Close to         a challenge (Herold et al 2012, Goetz et al 2015, Gao
80% of households use charcoal as part of their cook-     et al 2020), but recent studies have demonstrated
ing energy mix across SSA (Zulu and Richardson            the feasibility of approaches based on multitemporal
2013). While access to alternative energy sources may     medium resolution Earth Observation data (Sedano
increase with income, charcoal is expected to remain      et al 2020a, 2020b). Yet, charcoal production results
a dominant source of energy for African urban house-      in small-scale disturbances. Its impact on the spectral
holds in the coming decades and the overall charcoal      signal can be both subtle, because it implies a partial
consumption is expected to increase by 2040 (Gir-         removal of vegetation cover, and short-lived, because
ard 2002, Zulu 2010, International Energy Agency          regrowth soon restores a continuous vegetation cover
2014). Yet, despite its relevance, the lack of consist-   in the disturbed site. As a consequence, detection with
ent and reliable information about the charcoal sec-      medium resolution sensors is not always feasible. In
tor results in a poor understanding of the magnitude      the last few years, some studies have explored the use
of the problem and its potential negative impacts that    of high-resolution imagery to indirectly map charcoal
hinders the subsequent development of effective spe-      production (Bolognesi et al 2015, Dons et al 2015,
cific interventions (Broadhead et al 2001, Kissinger      Sedano et al 2016). Following this line of research,
et al 2012, Chidumayo and Gumbo 2013, Mwam-               this study takes advantage of multitemporal dataset
pamba et al 2013). Narratives about the impact of         of high and very high-resolution imagery to charac-
charcoal production on forest resources have evolved      terize the spatial and temporal dynamics of charcoal
over the last decades, from the crisis narratives in      production in a prominent charcoal production area
the 1970s (Eckholm 1975, Anderson and Fishwick            of southern Mozambique. The reliance on charcoal
1984) to more forbearing assessments (Mearns 1991,        of Maputo started during the civil war (1975–1992)
Hosier et al 1993, Ribot 1999, Arnold et al 2003,         when urban population rapidly expanded (Cities Alli-
Kissinger et al 2012). Yet, most of these narratives      ance 2017). As forested areas in the vicinity of the city
have often been rooted in partial information, over-      were depleted, charcoal production gradually moved
generalizations and a misrepresentation of the char-      further away: within 50–60 km in the 1980s, between
coal sector (Mwampamba et al 2013).                       60 and 100 km in the 1990s, and 150–200 km dur-
     Hosonuma et al (2012) identified charcoal pro-       ing the earlier 2000s (CHAPOSA 2002). Since 2010,
duction as the main cause of forest degradation in        the district of Mabalane, 350 km north of Maputo,
SSA. Most of this charcoal is produced from nat-          has been the main charcoal supplying area (Luz et al
ural forests and woodlands in a process that, while       2015). To our knowledge, this case study represents
initially highly selective, becomes more indiscrimin-     the most detailed assessment of forest degradation
ate in successive waves (Van Dam 2017, Chidumayo          from charcoal production to the date. We combine
2019, Silva et al 2019). Current efforts highlight the    this information with survey data on urban charcoal
need for data-driven assessments to understand and        consumption to establish a direct link between energy
quantify the contribution of charcoal production to       demand of a main urban center in the region and a
forest degradation and its impact on forest resources     supplying woodland area, in an attempt to quantify
(Mwampamba 2007, FAO 2011, Chidumayo                      the impact of the urban energy demand from SSA cit-
2019).                                                    ies on forest carbon stocks.
     Forest degradation can be defined as the reduc-
tion of the capacity of a forest to provide goods         2. Study area
and services, including biomass, carbon sequestra-
tion, water regulation, soil protection, and biod-        The study area corresponds to the administrat-
iversity conservation (FAO 2011). Forest degrada-         ive subdivision of Combomune, in the district of
tion is a main factor behind uncertainties in global      Mabalane, province of Gaza, southern Mozambique
emissions from forest loss (Bullock et al 2020). The      (figure 1). Combomune (Lat S 23.1; Long E 33.0) cov-
impact of fire-driven forest degradation to carbon        ers 5163 km2 and it is located 350 km North from
emissions is clearly recognized and, while substan-       Maputo, the country’s capital.
tial uncertainties remain, fire-driven forest degrada-        The area is mostly flat, with an altitudinal gradi-
tion is currently estimated for as part of global fire    ent from 50 to 170 m and loamy sand soils (Wool-
emissions (van der Werf et al 2017, Lasslop et al         len et al 2016). The average annual temperature is
2019). Monitor and quantify non-fire-driven forest        24 ◦ C and annual precipitation is 530 mm, with a
degradation has proved more challenging, as it com-       clearly defined dry season from May to September.
monly requires multiple AGB measurements over             Woodland ecosystems in the study area dominated
time. Most countries in SSA lack historical national      by formations of mopane (Colophospermum mopane
forest inventory (NFI) data and permanent plots to        (Benth.) J. Léonard), combretum (Combretum sp.)

                                             2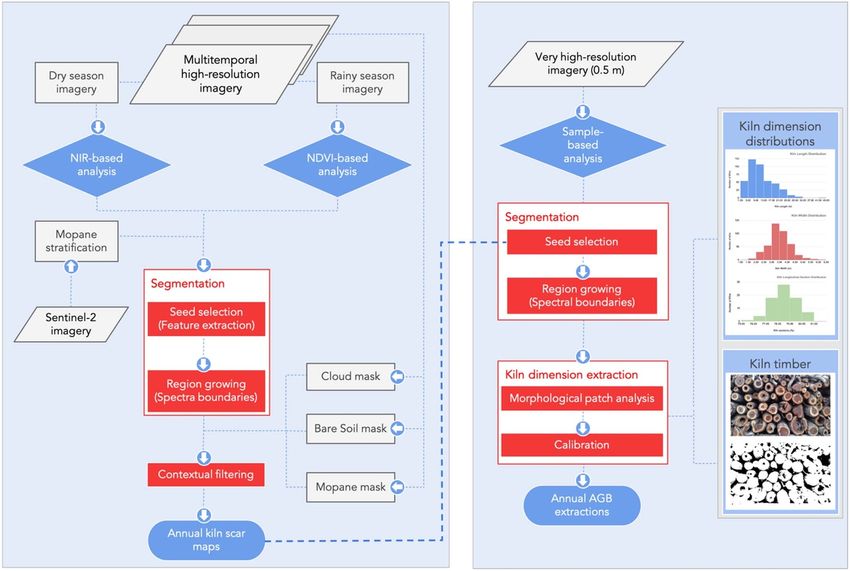
Environ. Res. Lett. 16 (2021) 064020                                                                                     F Sedano et al

   Figure 1. Red rectangle in upper left panel indicates the location of the study are in southern Mozambique. Large panel shows the
   Combomune study area and the distribution of mopane woodlands where charcoal production is concentrated.

and mecrusse (Androstachys johnsonii Prain), in                      from WorldView2, Rapid Eye and PlanetScope plat-
which these trees form quasi-monospecific stands.                    forms obtained from the Maxar and Planet archives
Because of its relative abundance, high wood density                 respectively. Images from the Maxar archive were
(1020–1140 kg m−3 ) (Carsan et al 2012) and relatively               obtained from the NASA National Geospatial Intel-
straight logs, mopane trees are the preferred species                ligence Agency (NGA) archive (Neigh et al 2013)
for the production of high-quality charcoal. Hence,                  and images from the Planet archive were obtained
most of the charcoal production takes in mopane                      through an Education and Research Program license
woodlands that cover around 735.3 km2 (14.2% of                      (Planet 2017). The images for each year provided a
the total area) of the study area. As mopane trees                   complete coverage for years 2013, 2016, 2017, 2018
become rare, some suboptimal charcoal tree species                   and 2019 (figure 2). Multispectral images for 2014
(e.g. Combretum sp.) are more frequently used by                     only covered 77% of the mopane woodlands and were
charcoal producers (Woollen et al 2016).                             complemented with four WorldView1 panchromatic
     Since the year 2008 the district of Mabalane has                very high-resolution images (0.5 m) covering an addi-
produced a large proportion of the charcoal con-                     tional 21% of the mopane woodlands. The images in
sumed in the city of Maputo (Luz et al 2015, Baumert                 this dataset were used to map kiln scars on an annual
et al 2016), with production gradually moving north-                 basis. Rainy season imagery was only used if dry sea-
wards as undisturbed mopane woodlands became                         son images were not available. When images from sev-
scarce in the southern sections of the district. In 2013             eral sensors were available, the highest spatial resol-
the largest share of the production was already con-                 ution images were always preferred. In addition, we
centrated in Combomune. Charcoal production in                       compiled a dataset of 14 cloud-free WorldView1 pan-
Combomune supplies the Maputo urban area, with                       chromatic very high-resolution images (0.5 m) from
a population of 2 million people (Instituto Nacional                 the 2014 dry season (December). The images in this
de Estatistica—INE 2017). Up to 87% of households                    dataset covered 50% of the study area and it was used
in Maputo urban area use charcoal, and between 44%                   to estimate kiln scar dimensions at a sample of loca-
and 69% of them use it as their primary cooking                      tions within the charcoal production areas.
energy source (Atanassov-Andrade et al 2012, ICF
2012).
                                                                     4. Methods
3. Data
                                                                     4.1. Forest degradation extent
We compiled a multisensor dataset of high-resolution                 We applied a region growing (RG) segmentation
imagery to provide annual coverage of the mopane                     approach to map the spatial distribution of char-
woodlands of the study area for each year between                    coal kiln scars in the study area with a multitemporal
2013 and 2019 (table 1). The dataset included 153                    dataset of high-resolution imagery at seven annual
multispectral images with cloud coverage below 5%                    epochs between 2013 and 2019 (figure 3). The RG

                                                      3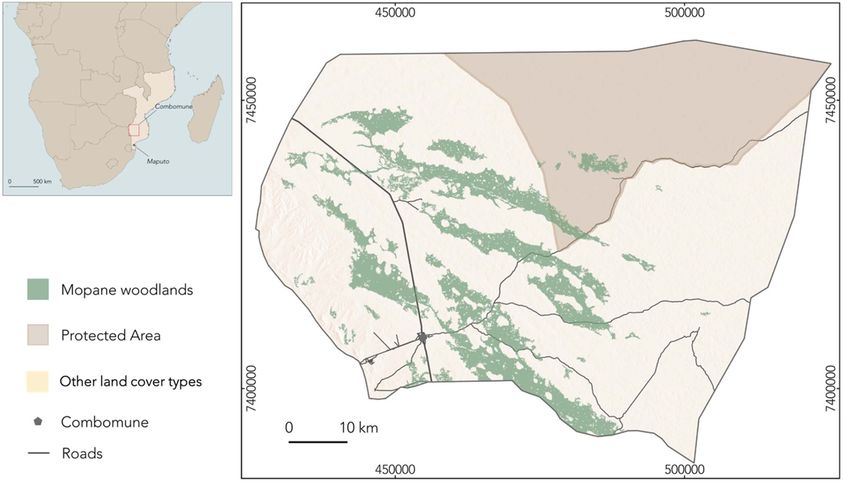
Environ. Res. Lett. 16 (2021) 064020                                                                                   F Sedano et al

                                            Table 1. Description of imagery used in the study.

                                                                                                                        Mopane
                                                                                                                       woodlands
                                                                            Spatial     Number      Acquisition         coverage
ID      Reference year Imagery years Archive                Sensors        res. (m)     of images   window                (%)

1             2013              2013         Maxar          WorldView2        2             20      13 June, 10 July      100
2             2014              2014         Maxar          WorldView2        2             11      3 December             77
2b            2014              2015         Maxar          WorldView1        0.5            4      18 February            21
3             2015              2015         Planet         Rapid Eye         5             13      15 September          100
4             2016              2016         Maxar          WorldView2        2             18      16 June               100
5             2017              2017         Planet         PlanetScope       3             39      21 November           100
6             2018              2018         Planet         PlanetScope       3             32      17 November           100
7             2019              2019         Planet         PlanetScope       3             21      7 October             100

                                                                      process, this approach combines elements from both
                                                                      knowledge-based and object-based image analysis
                                                                      methods (Cheng and Han 2016).
                                                                          The spectral contrast between kiln scars and sur-
                                                                      rounding areas is the highest for late dry season con-
                                                                      ditions (July–December), and gradually declines with
                                                                      the offset of the rains, as vegetation covers the ground.
                                                                      Therefore, when available, late dry season images
                                                                      were used for the analysis. RG was applied on a single
                                                                      band basis, with NIR band as a default option. As
                                                                      an alternative, NDVI images were used when only
                                                                      rainy season (January–June) images were available.
                                                                      The implementation of this region-based segmenta-
                                                                      tion process retrieved kiln scar maps in the study area
                                                                      for each year between 2013 and 2019 (figure 4). The
                                                                      reported number of kilns per year was proportionally
                                                                      adjusted to account for the different length of peri-
                                                                      ods between imagery epochs. A visual identification
                                                                      of the kiln scars in the high-resolution images was
                                                                      carried out to validate the accuracy of the kiln scars
                                                                      maps (Congalton and Green 2009). The validation
                                                                      took place in 20 blocks of 100 ha randomly selected
                                                                      for each year (total = 140 blocks) within the mopane
                                                                      woodlands of the study area. Commission and omis-
                                                                      sion errors and successful detection rate (%) were
                                                                      reported for each year and the whole study period.
                                                                          The average kiln density was estimated from
                                                                      mapped kiln scars at four randomly selected sites
     Figure 2. High-resolution imagery coverage. Annual               in the mopane woodlands of the study area. These
     coverage of high-resolution imagery for the study area.
     Imagery corresponds to DigitalGlobe archive (years
                                                                      sites covered an overall area of 112 km2 and included
     2013–2016) and Planet archive (2017–2019). Dark grey             18 929 kilns in the calculation. The progression of dis-
     2014 footprints correspond to very high-resolution               turbed mopane woodlands during the study period
     panchromatic WorldView1 images.
                                                                      was estimated at each imagery epoch based on the
                                                                      presence of kiln scars within 1 km2 square cells of a
                                                                      grid covering the study area. Grid-cells were labeled
                                                                      as disturbed if more than ten kilns were found within
clustered spatially contiguous regions based on dis-
                                                                      the cell. Only grid cells with more than 20% of its area
continuities of intensity levels between kiln scars and
                                                                      covered by mopane woodlands were considered in the
neighboring pixels. The RG approach also incorpor-
                                                                      analysis.
ated size and shape criteria established from field-
work observations to simplify the segmentation prob-
lem and improve its robustness (see supplementary                     4.2. Aboveground biomass removals
materials (available online at stacks.iop.org/ERL/16/                 A second RG routine was implemented to extract kiln
064020/mmedia)). In this sense, with the inclusion                    scar dimensions from very high-resolution (0.5 m)
of a priori knowledge about the charcoal production                   panchromatic WorldView1 images from the year

                                                        4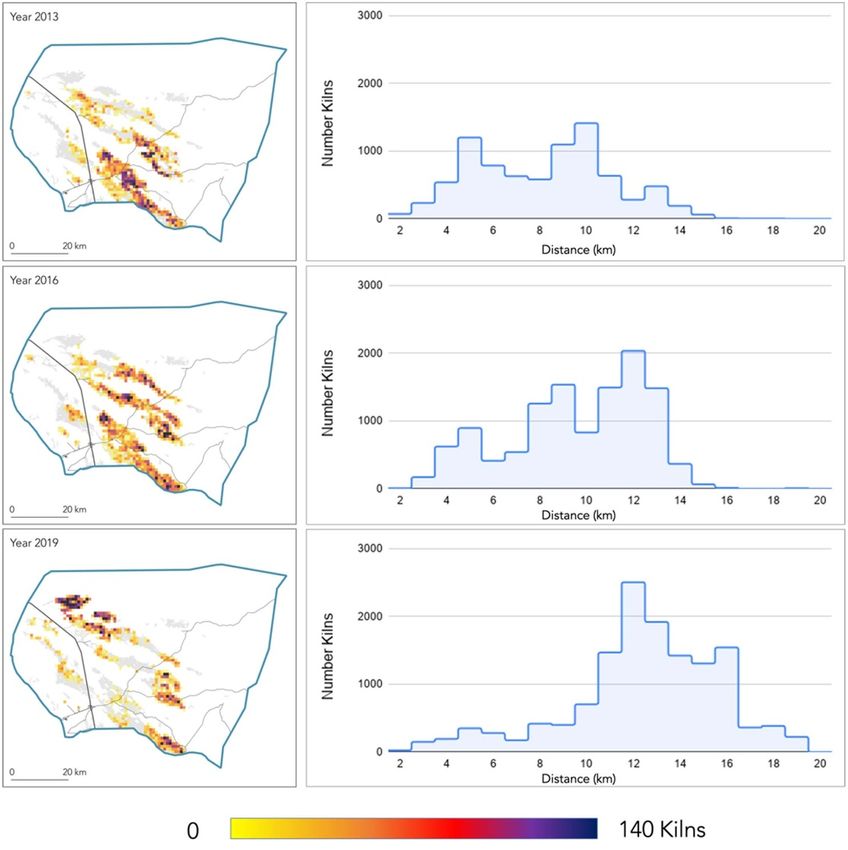
Environ. Res. Lett. 16 (2021) 064020                                                                                    F Sedano et al

       Figure 3. Flowchart of methodology for kiln scar mapping (left-side box) and kiln dimension extraction (right-side box).

2014. This analysis was carried out in six sample loc-              (INE) and household-level charcoal consumption
ations with charcoal production activities. The total               estimates. Household charcoal consumption was
area of these locations covered 154 km2 and contained               estimated as a weighted average of daily charcoal
10 823 kiln scars. This RG routine used the kiln scars              consumptions for households with different energy
detected during kiln scar mapping as seed pixels and                mixes obtained from Atanassov-Andrade et al (2012).
expand or contract them based on the spectral sim-                  Five-member households were assumed. Charcoal
ilarity between seed and neighboring pixels, size, and              conversion efficiency (25%) was obtained from pre-
shape criteria. The two main axes of each region were               vious studies in the region (CHAPOSA 2002).
calculated as an approximation to kiln scar dimen-
sions (length and width) (figure 5). Next, we applied
a histogram matching to calibrate image-based kiln                  5. Results
scar dimensions to kiln dimensions measured in the
field (see supplementary materials).                                We mapped 110 058 kiln scars in the study area
     Subsequently, annual AGB removals from char-                   between 2013 and 2019, with a peak between 2013
coal production were calculated as the sum of the                   and 2016 and a gradual decline in successive years
wood biomass extracted to build all the kilns mapped                (figures 6 and 7). The validation of the results showed
with the high-resolution images of the study area. The              the robustness of the mapping approach, with 99.3%
wood biomass used for each kiln was estimated as a                  of the kiln scars were correctly mapped and the
product of the kiln dimensions, kiln wood volume                    overall commission and omission errors were 0.7%
proportion, AGB debris, and mopane wood density,                    and 3.0%, respectively. The accuracy metrics were
drawing Monte Carlo simulations from the statistical                consistent across all sensors and years of analysis
distributions of these parameters (see supplement-                  (table 2).
ary materials). Successively AGB extractions per hec-                   AGB removals from mapped kilns for the seven-
tare were estimated as the product of the average kiln              year period accounted for 5129 900 Mg (SD = 9232)
density and kiln wood.                                              with 1081 000 (SD = 2461) Mg extracted annually
     We used the ecosystem demography (ED) model                    during the peak 2013–2016 period. The inclusion of
(Moorcroft et al 2001, Hurtt et al 2002) to simulate                adjacent kilns, not mapped in this study, could rep-
potential AGB and AGB regrowth after charcoal pro-                  resent a 3.1% increase in AGB removals.
duction disturbance in the ecological conditions of                     Charcoal production in the study area is a fast-
the study area (see supplementary materials).                       moving process. The grid-level analysis showed that
     The annual charcoal demand of the Maputo                       undisturbed mopane woodlands (e.g. woodlands
urban area was estimated from population figures                    without evidence of charcoal production) decreased

                                                      5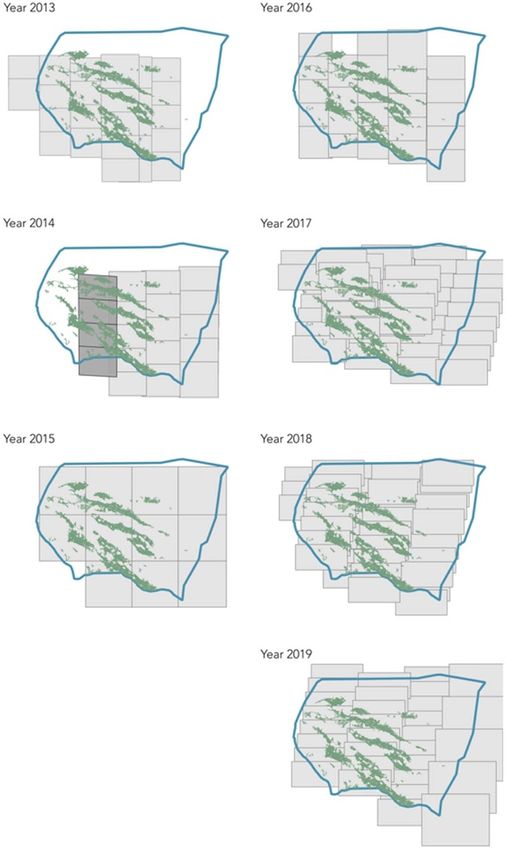
Environ. Res. Lett. 16 (2021) 064020 F Sedano et al
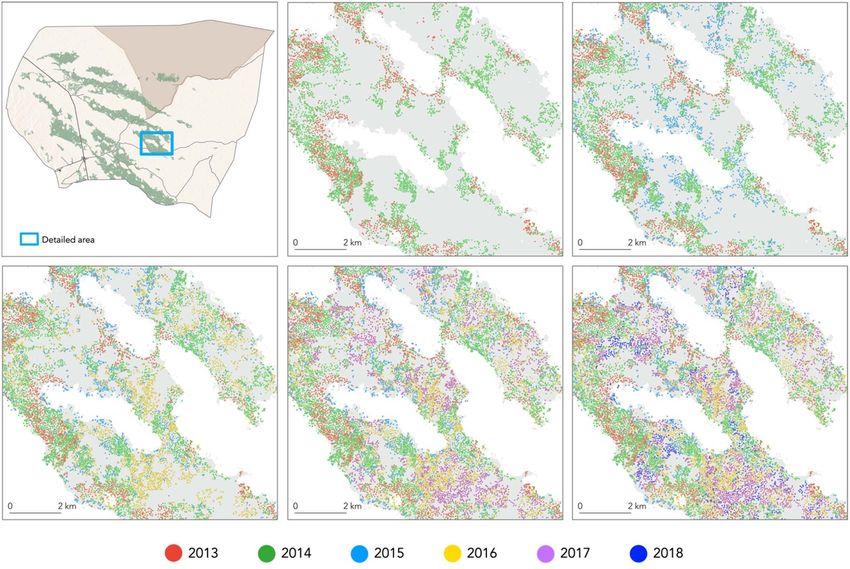
Figure 4. Subset of Planet images (3 m) for three consecutive years (2017–2019) in charcoal production area: NIR bands (left side
panels); and detected kiln scars (right side panels).
from 65% in 2013 to 9.5% in 2019. The spatio- 150 years to recover to pre-disturbance AGB levels
temporal progression of the kiln scar locations fol- (figure 10).
lows a centrifugal pattern of forest degradation, and The annual AGB required to meet the char-
over the years, kilns are found further away from coal demand of the Maputo urban area was estim-
primary and secondary roads, progressively moving ated at 1.61 million Mg on average. Assuming the
into more remote woodlands. The progression of kiln AGB extraction patterns identified in the analysis
locations also reveals a gradual intensification of char- of the high-resolution imagery and current popula-
coal production activities in fewer clusters of pro- tion growth projections, this amount of AGB would
duction that concentrate on an increasing number of require 35 456 kilns and cover an average area of
kilns (figure 8). 175.3 km2 of woodlands annually. Based on the kiln
Woodland stands commonly support charcoal scars detected during the study period, the contri-
production for a number of years with a gradual bution of the study area to the charcoal demand of
increase of AGB removals at site level is observed Maputo gradually decreased from up to 75% in 2013
(figure 9). While charcoal making starts slowly, with to 31% in 2019.
kiln densities of 0.6 after the first year, produc-
tion intensity quickly accelerates to surpass dens- 6. Discussion
ities of 1 kiln ha−1 in successive years. The final
season of production in a site, kiln density can We have applied an indirect approach to map forest
reach two kilns ha−1 , with kilns around 79.6 m degradation from charcoal production in tropical
apart and average AGB removals of 90.7 Mg ha−1 woodlands of southern Africa from a multitem-
(SD = 40.10). Ecosystem model forecasts indicate poral and multisensor dataset of high and very high-
that, in the absence of active forest management, resolution imagery. This approach detected kiln scars
these AGB extraction patterns would require up to and estimated kiln dimensions as a proxy to quantify
6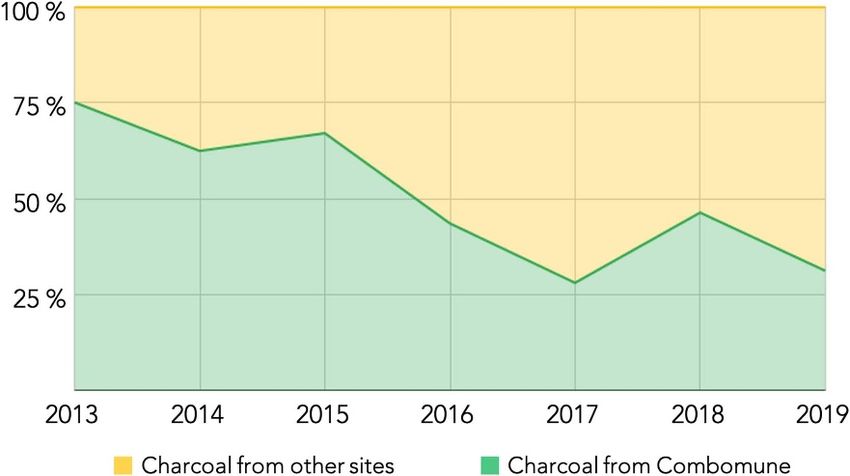
Environ. Res. Lett. 16 (2021) 064020                                                                                    F Sedano et al

   Figure 5. Example of kiln dimension extraction sequence. Top-left: subset of 0.5 m panchromatic WorldView1 image; top-right:
   kiln scars detected from high-resolution imagery used as initial seeds for kiln dimension extraction; bottom-left: kiln scars
   mapped in 0.5 m panchromatic WorldView1 image with region growing segmentation approach; bottom-right: detailed view of
   kiln scar with length and width dimensions extracted from main two axes.

          Figure 6. Progression of kiln scars in the mopane woodlands of the study area for a six-year sequence (2013–2018).

                                                      7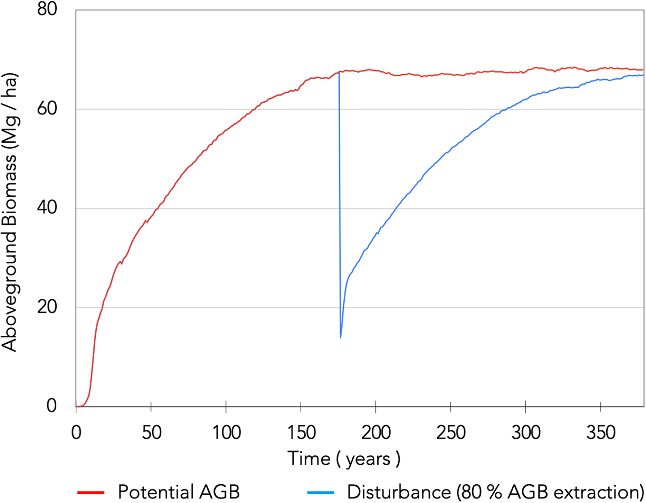
Environ. Res. Lett. 16 (2021) 064020                                                                      F Sedano et al

                                                                of such monitoring systems will enable the expli-
                                                                cit inclusion of forest degradation driven by char-
                                                                coal production in REDD+ Measurement, Reporting
                                                                and Verification (MRV) systems in an SSA context in
                                                                compliance with international guidelines and recom-
                                                                mendations.
                                                                     The number of kilns mapped in the multitem-
                                                                poral high-resolution imagery for seven years fluc-
                                                                tuated over time, with a peak during between 2013
                                                                and 2016 and a gradual decrease in successive years.
   Figure 7. Annual number of kiln scars for every year         This decrease reflects the gradual decline of undis-
   adjusted to account for the different length of periods      turbed woodlands in the study area following a
   between imagery epochs.
                                                                centrifugal process already documented in medium
                                                                resolution assessments for this study area (Sedano
Table 2. Accuracy metrics for kiln scar detection in            et al 2020a) and in other locations in eastern Africa
high-resolution imagery.                                        (Ahrends et al 2010). Forest degradation advance
               Omission           Commission    Overall         was accompanied by a progressive intensification of
Year           error (%)          error (%)  accuracy (%)       AGB extraction at site level, to reach kiln densities
                                                                of 2 kilns ha−1 and AGB removals of 90.7 Mg ha−1
2013             2.51                  1.85             98.15   on average (SD = 40.10) in some locations. The
2014             4.06                  0               100
                                                                large uncertainties in site extractions, characterized
2015             1.76                  1.52             98.48
2016             2.71                  1.22             98.78
                                                                by the Monte Carlo simulations, are due to the large
2017             4.32                  0.30             99.70   variation in kiln sizes across the study area. These
2018             2.74                  0.71             99.29   extraction figures are in agreement with field meas-
2019             1.77                  0               100      urements in the study area (Sedano et al 2020a),
                                                                and represent further evidence of the unsustainabil-
                                                                ity of the current charcoal production regime in the
forest degradation extent and its AGB removals                  supplying areas of Maputo, also supported by the
respectively. The results for the main production area          long AGB recovery times in ecosystem model simula-
in southern Mozambique offer a detailed character-              tions. Similar conclusions had been also reported by
ization of spatial and temporal dynamics, the mag-              Drigo et al (2008) using a supply-demand approach.
nitude and the intensity of this forest degradation             Although AGB recovery times will change from site to
process. They also significantly improve the preci-             site depending on the specific environmental condi-
sion of previous remote sensing assessments based               tions, similar unsustainable extraction patterns have
on medium resolution imagery (Sedano et al 2020b).              been reported elsewhere in the Miombo region and
Because of its larger area coverage and the length              point towards the regional prevalence of the problem
of the period of study, this work also represents               (Mwampamba 2007, Chidumayo 2019).
an advance from previous high-resolution efforts.                    Mabalane, approximately 350 km north of
The proposed mapping approach integrated a pri-                 Maputo, has been its main charcoal supplying dis-
ori knowledge of the charcoal production at vari-               trict since 2010 (Luz et al 2015) and, since 2013,
ous stages of the mapping process, including image              most of this activity has been concentrated in Com-
selection, delimitation of the geographical scope of            bomune (Sedano et al 2020b). While charcoal arriv-
the analysis, and design and calibration of the map-            ing in Maputo comes from several production areas
ping method. This knowledge contributed to reduce               in the country (Atanassov -Andrade et al 2012),
the complexity of the segmentation, minimizing                  the charcoal produced in Combomune is exclus-
potential omission and commission errors and thus               ively consumed in the city of Maputo. This unidirec-
improving the robustness of the kiln scar mapping.              tional transfer provides a platform to understand the
The high accuracy of the results stresses the import-           increasing impact of urban energy demand in forest
ance of a clear understanding of the main charac-               carbon stock changes. Charcoal production in Com-
teristics of the charcoal production process to sim-            bomune during the year of highest production (2013–
plify the mapping routine and reduce its uncertain-             2016) covered an annual average of 103 km2 and was
ties. This study represents a proof of concept of               responsible for the extraction of 1083 500 Mg of AGB
the capabilities of high-resolution Earth observation           (SD = 2429). These figures offer a lower envelope
data to monitor and quantify the impact of char-                estimate of the impact of Maputo charcoal demand
coal production-related forest degradation in SSA.              on forest resources. The combination of informa-
With increasing access to high-resolution imagery               tion from household surveys (Atanassov -Andrade
and decreasing computing power restrictions, mon-               et al 2012) and charcoal production patterns extrac-
itoring systems can now reach a level of maturity that          ted from high-resolution EO data indicate that this
allows operation implementation. The development                amount would not be enough to satisfy the annual

                                                        8
Environ. Res. Lett. 16 (2021) 064020 F Sedano et al
Figure 8. Grid-level (1 km) kiln density maps for a sequence of three years (2013, 2016, 2019) in the study area (left column); and
corresponding distribution of kiln frequencies with distance from the main village in the study area (right column).
Figure 9. Evolution of the average kiln density at site level.
charcoal demand of Maputo (figure 11). An urban
Figure 10. ED ecosystem model projection of aboveground
center as Maputo would require on average, the use biomass recovery after charcoal production disturbance for
of an additional 41% area of woodlands to cover its ecological conditions in the study area.
annual charcoal needs. This footprint, both in extent
and intensity, together with the fact that production
sites are located more than 350 km away, supports the is the main urban cooking energy source in seven
narrative that forest degradation from charcoal pro- urban areas with more than one million people in
duction cannot any longer be considered a localized the Miombo region and 19 other cities within the
process restricted to peri-urban areas. region are expected to reach this population in the
The quantification of the impact of Maputo char- next 20 years (United Nations). Across the contin-
coal consumption on forest resources offers a valu- ent, charcoal use is also the main energy source of
able reference point for other urban centers across large cities of West Africa and East Africa. While
the Miombo region and elsewhere in SSA. Charcoal the magnitude, intensity of forest degradation driven
9Environ. Res. Lett. 16 (2021) 064020 F Sedano et al
Figure 11. Evolution of the contribution of the charcoal produced in the study area to the overall Maputo urban area charcoal
consumption.
by charcoal production will be different for each urban center in this study allowed a first quantifica-
urban area depending on its intrinsic circumstances tion of the footprint of the urban energy demand on
(e.g. existing forest resources, policy interventions, forest carbon stocks. This quantification provides a
law enforcement, etc), it is reasonable to expect that, valuable initial reference point to estimate and assess
under current scenarios, each of these urban cen- the importance of this forest degradation process at
ters will develop their own charcoal supplying areas. regional level. As large urban centers continue grow-
Renewable energies and recently discovered natural ing and the number of large cities, charcoal supplying
gas deposits have the potential to lead Africa’s energy areas are expected to become larger, more numerous
transition from solid biomass and boost its over- and move further away from cities.
all energy consumption growth. Yet, this transition
will require a considerable effort. Current efforts to Data availability statement
ensure access to electricity, reliable electricity supply
and clean cooking barely outpace population growth The data generated and/or analysed during the cur-
(International Energy Agency, 2019). Thus, charcoal rent study are not publicly available for legal/ethical
is expected to remain a prominent energy source in reasons but are available from the corresponding
urban Africa over the next decades and the footprint author on reasonable request.
of charcoal production, already noticeable at regional
level, is likely to become more pronounced.
Acknowledgments
7. Conclusion We would like to thank the two anonymous reviewers
for their suggestions and comments. This study is part
We have characterized and quantified the impact of of the ‘Forest degradation caused by charcoal produc-
charcoal production on forest degradation for the tion: characterization, quantification and forecasting
main supplying area for major African capital. We to improve carbon monitoring systems in southern
mapped the extent and intensity of forest degrada- Africa’ project and it is supported by from NASA
tion from charcoal production using a multitemporal Carbon Monitoring System (16-CMS16-0041). Digit-
dataset of high and very high-resolution imagery alGlobe imagery were used under the NGA’s Nex-
from various platforms. Despite its relevance in SSA, tView License Agreement (© 2014 DigitalGlobe, Inc.
the contribution of charcoal production to changes in Licensed under NextView). PlanetScope imagery was
forest stocks is currently not explicitly quantified and used under a Planet Education and Research Program
reported. This work represents a proof of concept of license.
the potential for operational monitoring of the main
cause of forest degradation in the region. Our res- ORCID iDs
ults expose with high spatial detail a fast-moving and
intense forest degradation process and underscore its S N Lisboa https://orcid.org/0000-0002-3513-
long-term impact on forest carbon stocks. These res- 3036
ults challenge the narratives that downplay the role R Sahajpal https://orcid.org/0000-0002-6418-
of charcoal production on forest cover changes and 289X
describe it as a localized and peri-urban problem. A Sitoe https://orcid.org/0000-0001-7583-2387
The univocal link between the supplying area and the G Hurtt https://orcid.org/0000-0001-7278-202X
10Environ. Res. Lett. 16 (2021) 064020 F Sedano et al
References Mozambique. Final Report of the Wood energy component
of the Consolidation Phase of the Project “Integrated
Ahrends A, Burgess N D, Milledge S A H, Bulling M T, Fisher B, Assessment of Mozambican Forests AGRICONSULTING,
Smart J C R, Clarke G P, Mhoro B E and Lewis S L 2010 for the Direcção Nacional de Terras e Florestas, Ministério
Predictable waves of sequential forest degradation and de Agricultura, Moçambique
biodiversity loss spreading from an African city Proc. Natl Eckholm E P 1975 The Other Energy Crisis, Firewood
Acad. Sci. 107 14556–61 (Washington, DC: Worldwatch Institute)
Anderson D and Fishwick R 1984 Fuelwood consumption and FAO 2011 Assessing Forest Degradation Towards the Development
deforestation in African countries 1 of Globally Applicable Guidelines Working Paper 177 (Rome)
Arnold J E M, Köhlin G and Persson R 2006 Woodfuels, Gao Y, Skutsch M, Paneque-Gálvez J and Ghilardi A 2020 Remote
livelihoods, and policy interventions: changing perspectives sensing of forest degradation: a review Environ. Res. Lett.
World Dev. 34 596–611 15 103001
Arnold M, Köhlin G, Persson R and Shepherd G 2003 CIFOR Girard P 2002 Charcoal production and use in Africa: what
Occasional Paper No. 39 Fuelwood Revisited: What Has future? Unasylva 53 30–4
Changed in the Last Decade? Goetz S J, Hansen M, Houghton R A, Walker W, Laporte N and
Atanassov -Andrade B, Falcão E-M, Fernandes A and Busch J 2015 Measurement and monitoring needs,
Mahumane G 2012 Capacity Building in Energy Planning capabilities and potential for addressing reduced emissions
and Management EuropeAid/127640/SER/MZ Mozambique from deforestation and forest degradation under REDD+
Urban Biomass Energy Analysis 2012. related content Environ. Res. Lett. 10 123001
Maputo-Matola-Beira-Nampula Mozambique Ministry of Grant R 2016 Africa: geographies of change edited by Richard
Energ. Maput Grant, Oxford: Oxford University Press. 2015. 356 pp. ISBN
Baumert S, Luz A C, Fisher J, Vollmer F, Ryan C M, Patenaude G, 978-0-19-992056-3 (paperback) Growth Change 47 130–1
Zorrilla-Miras P, Artur L, Nhantumbo I and Macqueen D Grimm N B, Faeth S H, Golubiewski N E, Redman C L, Wu J,
2016 Charcoal supply chains from Mabalane to Maputo: Bai X and Briggs J M 2008 Global change and the ecology of
who benefits? Energy Sustain. Dev. 33 129–38 cities Science 319 756–60
Bolognesi M, Vrieling A, Rembold F and Gadain H 2015 Rapid Güneralp B, Lwasa S, Masundire H, Parnell S and Seto K C 2017
mapping and impact estimation of illegal charcoal Urbanization in Africa: challenges and opportunities for
production in southern Somalia based on WorldView-1 conservation Environ. Res. Lett. 13 15002
imagery Energy Sustain. Dev. 25 40–9 Herold M, Román-Cuesta R M, Heymell V, Hirata Y, Van Laake P,
Boudet F, MacDonald G K, Robinson B E and Samberg L H 2020 Asner G P, Souza C, Avitabile V and MacDicken K 2012 A
Rural-urban connectivity and agricultural land review of methods to measure and monitor historical carbon
management across the Global South Glob. Environ. Change. emissions from forest degradation Unasylva 62 2011/2
60 101982 Herold M, Román-Cuesta R M, Mollicone D, Hirata Y, Van
Broadhead J, Bahdon J and Whiteman A 2001 Woodfuel Laake P, Asner G P, Souza C, Skutsch M, Avitabile V and
consumption modelling and results. Annex 2 in past trends MacDicken K 2011 Options for monitoring and estimating
and future prospects for the utilization of wood for energy historical carbon emissions from forest degradation in the
Working Paper No: GFPOS/WP/05, Global Forest Products context of REDD+ Carbon Balance Manage. 6 1–7
Outlook Study, FAO, Rome Hosier R H, Mwandosya M J and Luhanga M L 1993 Future
Bullock E L, Woodcock C E and Olofsson P 2020 Monitoring energy development in Tanzania: the energy costs of
tropical forest degradation using spectral unmixing and urbanization Energy Policy 21 524–42
Landsat time series analysis Remote Sens. Environ. Hosonuma N, Herold M, De Sy V, De Fries R S, Brockhaus M,
238 110968 Verchot L, Angelsen A and Romijn E 2012 An assessment of
Carsan S, Orwa C, Harwood C, Kindt R, Stroebel A, Neufeldt H deforestation and forest degradation drivers in developing
and Jamnadass R 2012 African Wood Density Database countries Environ. Res. Lett. 7 044009
(Nairobi: World Agroforestry Centre) Hurtt G C, Pacala S W, Moorcroft P R, Caspersen J, Shevliakova E,
CHAPOSA 2002 Charcoal Potential in Southern Africa Houghton R A and Moore B I I I 2002 Projecting the
(CHAPOSA) ERBIC18CT980278 Stock. Environ. Inst. future of the US carbon sink Proc. Natl Acad. Sci.
Cheng G and Han J 2016 A survey on object detection in optical 99 1389–94
remote sensing images ISPRS J. Photogramm. Remote Sens. ICF 2012 The DHS Program STATcompiler. Funded by USAID
117 11–28 (available at: www.statcompiler.com) (Accessed 20 June
Chidumayo E N 2019 Is charcoal production in 2020)
Brachystegia-Julbernardia woodlands of Zambia Instituto Nacional de Estadística de Moçambique 2017 Projecções
sustainable? Biomass Bioenergy 125 1–7 da População. (In Portuguese) (available at: www.ine.gov.
Chidumayo E N and Gumbo D J 2013 The environmental impacts mz/estatisticas/estatisticas-demograficas-e-indicadores-
of charcoal production in tropical ecosystems of the world: a sociais/projeccoes-da-populacao) (Accessed 20 June 2020)
synthesis Energy Sustain. Dev. 17 86–94 International Energy Agency 2014 Africa Energy Outlook. A focus
Cities Alliance 2017 Urbanization in Mozambique assessing on the energy prospects in sub-Saharan Africa World Energy
actors, processes, and impacts of urban growth. Research Outlook Spec. Report, Int. Energy Agency Publ. pp 1–237
Monograph. Rue Royale 94, 1000 Brussels, Belgium International Energy Agency 2019 Africa Energy Outlook
Clancy J S 2008 Urban ecological footprints in Africa Afr. J. Ecol. 2019—Analysis Scenarios Africa Energy Outlook 2019 7
46 463–70 Kissinger G, Herold M and De Sy V 2012 Drivers of Deforestation
Congalton R G and Green K 2019 Assessing the Accuracy of and Forest Degradation: A Synthesis Report for REDD+
Remotely Sensed Data (Boca Raton, FL: CRC Press) Policymakers (Vancouver)
Defries R S, Rudel T, Uriarte M and Hansen M 2010 Deforestation Lasslop G, Coppola A I, Voulgarakis A, Yue C and Veraverbeke S
driven by urban population growth and agricultural trade in 2019 Influence of fire on the carbon cycle and climate Curr.
the twenty-first century Nat. Geosci. 3 178–81 Clim. Change Rep. 5 112–23
Dons K, Smith-Hall C, Meilby H and Fensholt R 2015 Luz A C, Baumert S, Fisher J, Grundy I, Matediane M,
Operationalizing measurement of forest degradation: Patenaude G, Ribeiro N, Ryan C, Vollmer F and Woollen E
identification and quantification of charcoal production in 2015 Charcoal production and trade in southern
tropical dry forests using very high resolution satellite Mozambique: historical trends and present scenarios World
imagery Int. J. Appl. Earth Obs. Geoinf. 39 18–27 For. Congr. XIV
Drigo R, Cuambe C, Lorenzini M, Marzoli A, Macuacua J, Mearns R 1991 Beyond the woodfuel crisis: people, land and trees
Banze C, Mugas P and Cunhete D 2008 WISDOM in Africa Development Perspectives for the 1990s
11Environ. Res. Lett. 16 (2021) 064020 F Sedano et al
ed Prendergast R, Singer H W (UK: Palgrave Macmillan) Sedano F, Silva J A, Machoco R, Meque C H, Sitoe A, Ribeiro N,
pp 189–96 Anderson K, Ombe Z A, Baule S H and Tucker C J 2016
Moorcroft P R, Hurtt G C and Pacala S W 2001 A method for The impact of charcoal production on forest degradation:
scaling vegetation dynamics: the ecosystem demography a case study in Tete, Mozambique Environ. Res. Lett.
model (ED) Ecol. Monogr. 71 557–86 11 094020
Mwampamba T H 2007 Has the woodfuel crisis returned? Urban Seto K C and Ramankutty N 2016 Hidden linkages betw-
charcoal consumption in Tanzania and its implications to een urbanization and food systems Science
present and future forest availability Energy Policy 352 943–5
35 4221–34 Silva J A et al 2019 Charcoal-related forest degradation dynamics
Mwampamba T H, Ghilardi A, Sander K and Chaix K J 2013 in dry African woodlands: evidence from Mozambique Appl.
Dispelling common misconceptions to improve attitudes Geogr. 107 72–81
and policy outlook on charcoal in developing countries UN-Habitat 2014 The State of African Cities 2014. Re-imagining
Energy Sustain. Dev. 17 75–85 Sustainable Urban Transitions (Nairobi: UN-Habitat)
Neigh C S R, Masek J G and Nickeson J 2013 High-resolution United Nations, Department of Economic and Social Affairs P D
satellite data open for government research EOS Trans. 2019 Volume I: Comprehensive Tables vol I (available at:
94 121–3 www.ncbi.nlm.nih.gov/pubmed/12283219)
Planet 2017 Planet Imagery: product Specifications Van Dam J 2017 The Charcoal Transition: Greening the Charcoal
(www.planet.com/products/planet-imagery/) (Accessed 05 Value Chain to Mitigate Climate Change and Improve Local
May 2021) Livelihoods Food and Agriculture Organization of the
Ribot J 1999 A history of fear: imagining deforestation in the West United Nations
African dryland forests Glob. Ecol. Biogeogr. 8 291–300 van der Werf G R et al 2017 Global fire emissions estimates during
Satterthwaite D, McGranahan G and Tacoli C 2010 Urbanization 1997–2016 Earth Syst. Sci. Data 9 697–720
and its implications for food and farming Phil. Trans. R. Soc. Woollen E, Ryan C M, Baumert S, Vollmer F, Grundy I, Fisher J,
B 365 2809–20 Fernando J, Luz A, Ribeiro N and Lisboa S N 2016 Charcoal
Sedano F, Lisboa S N, Duncanson L, Ribeiro N, Sitoe A, production in the mopane woodlands of Mozambique: what
Sahajpal R, Hurtt G and Tucker C J 2020a Monitoring forest are the trade-offs with other ecosystem services? Phil. Trans.
degradation from charcoal production with historical R. Soc. B 371 20150315
Landsat imagery. A case study in southern Mozambique Zulu L C 2010 The forbidden fuel: charcoal, urban woodfuel
Environ. Res. Lett. 15 015001 demand and supply dynamics, community forest
Sedano F, Lisboa S, Duncanson L, Ribeiro N, Sitoe A, Sahajpal R, management and woodfuel policy in Malawi Energy Policy
Hurtt G and Tucker C 2020b Monitoring intra and inter 38 3717–30
annual dynamics of forest degradation from charcoal Zulu L C and Richardson R B 2013 Charcoal, livelihoods, and
production in Southern Africa with Sentinel—2 imagery poverty reduction: evidence from sub-Saharan Africa Energy
Int. J. Appl. Earth Obs. Geoinf. 92 102184 Sustain. Dev. 17 127–37
12You can also read