2018 RESULTS 21 February 2019 - Anglo American
←
→
Page content transcription
If your browser does not render page correctly, please read the page content below
2018 RESULTS 21 February 2019

CAUTIONARY STATEMENT
Disclaimer: This presentation has been prepared by Anglo American plc (“Anglo American”) and comprises the written materials/slides for a presentation concerning Anglo American. By attending this presentation
and/or reviewing the slides you agree to be bound by the following conditions. The distribution of this document in certain jurisdictions may be restricted by law and persons into whose possession this document
comes should inform themselves about, and observe, any such restrictions.
This presentation is for information purposes only and does not constitute an offer to sell or the solicitation, inducement or an offer to buy shares in Anglo American or any other securities. Further, it does not
constitute a recommendation by Anglo American or any other party to sell or buy shares in Anglo American or any other securities and should not be treated as giving investment, legal, accounting, regulatory,
taxation or other advice.
No representation or warranty, either express or implied, is provided in relation to the accuracy, completeness or reliability of the information contain herein. None of Anglo American, its affiliates, advisors or
representatives shall have any liability whatsoever (in negligence or otherwise) for any loss howsoever arising from any use of this material or otherwise in connection with this material.
Forward-looking statements
This presentation includes forward-looking statements. All statements other than statements of historical facts included in this presentation, including, without limitation, those regarding Anglo American’s financial
position, business, acquisition and divestment strategy, dividend policy, plans and objectives of management for future operations (including development plans and objectives relating to Anglo American’s products,
production forecasts and reserve and resource positions), are forward-looking statements. By their nature, such forward-looking statements involve known and unknown risks, uncertainties and other factors which
may cause the actual results, performance or achievements of Anglo American, or industry results, to be materially different from any future results, performance or achievements expressed or implied by such
forward-looking statements.
Such forward-looking statements are based on numerous assumptions regarding Anglo American’s present and future business strategies and the environment in which Anglo American will operate in the future.
Important factors that could cause Anglo American’s actual results, performance or achievements to differ materially from those in the forward-looking statements include, among others, levels of actual production
during any period, levels of global demand and commodity market prices, mineral resource exploration and development capabilities, recovery rates and other operational capabilities, the availability of mining and
processing equipment, the ability to produce and transport products profitably, the availability of transport infrastructure, the impact of foreign currency exchange rates on market prices and operating costs, the
availability of sufficient credit, the effects of inflation, political uncertainty and economic conditions in relevant areas of the world, the actions of competitors, activities by governmental authorities such as permitting
and changes in taxation or safety, health, environmental or other types of regulation in the countries where Anglo American operates, conflicts over land and resource ownership rights and such other risk factors
identified in Anglo American’s most recent Annual Report. Forward-looking statements should, therefore, be construed in light of such risk factors and undue reliance should not be placed on forward-looking
statements. These forward-looking statements speak only as of the date of this presentation. Anglo American expressly disclaims any obligation or undertaking (except as required by applicable law, the City Code
on Takeovers and Mergers (the “Takeover Code”), the UK Listing Rules, the Disclosure and Transparency Rules of the Financial Conduct Authority, the Listings Requirements of the securities exchange of the JSE
Limited in South Africa, the SIX Swiss Exchange, the Botswana Stock Exchange and the Namibian Stock Exchange and any other applicable regulations) to release publicly any updates or revisions to any forward-
looking statement contained herein to reflect any change in Anglo American’s expectations with regard thereto or any change in events, conditions or circumstances on which any such statement is based.
Nothing in this presentation should be interpreted to mean that future earnings per share of Anglo American will necessarily match or exceed its historical published earnings per share.
Certain statistical and other information about Anglo American included in this presentation is sourced from publicly available third party sources. As such it has not been independently verified and presents the
views of those third parties, but may not necessarily correspond to the views held by Anglo American and Anglo American expressly disclaims any responsibility for, or liability in respect of, such information.
No Investment Advice
This presentation has been prepared without reference to your particular investment objectives, financial situation, taxation position and particular needs. It is important that you view this presentation in its entirety. If
you are in any doubt in relation to these matters, you should consult your stockbroker, bank manager, solicitor, accountant, taxation adviser or other independent financial adviser (where applicable, as authorised
under the Financial Services and Markets Act 2000 in the UK, or in South Africa, under the Financial Advisory and Intermediary Services Act 37 of 2002).
Alternative Performance Measures
Throughout this presentation a range of financial and non-financial measures are used to assess our performance, including a number of financial measures that are not defined or specified under IFRS (International
Financial Reporting Standards), which are termed ‘Alternative Performance Measures’ (APMs). Management uses these measures to monitor the Group’s financial performance alongside IFRS measures to improve
the comparability of information between reporting periods and business units. These APMs should be considered in addition to, and not as a substitute for, or as superior to, measures of financial performance,
financial position or cash flows reported in accordance with IFRS. APMs are not uniformly defined by all companies, including those in the Group’s industry. Accordingly, it may not be comparable with similarly titled
measures and disclosures by other companies.

                                                                                                                                                                                                                                   2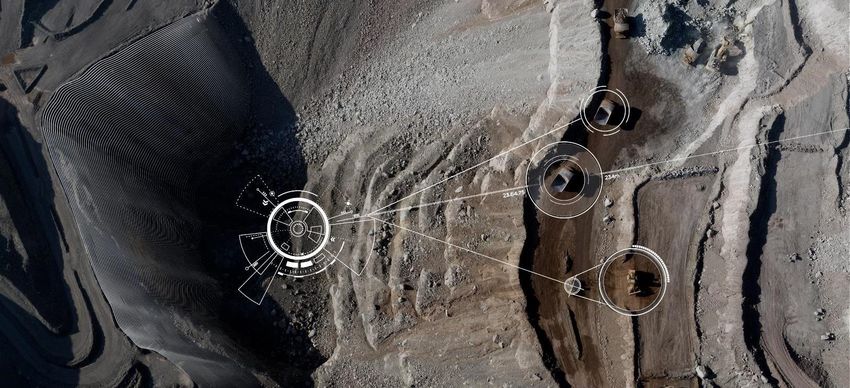
2018 RESULTS AGENDA

 Unlocking our Full Potential     Mark Cutifani

 Financials                     Stephen Pearce

 Project Update                   Mark Cutifani

 A Sustainable Future             Mark Cutifani

                                                  3
UNLOCKING OUR FULL POTENTIAL
Mark Cutifani

                    FutureSmart MiningTM innovation hub – El Soldado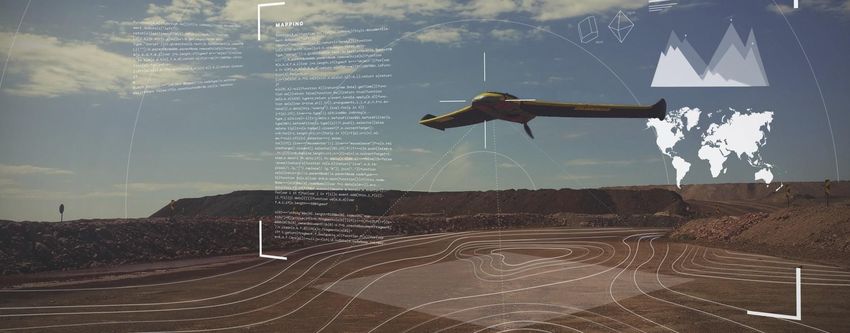
2018 – CONTINUED DELIVERY

Production volumes1   EBITDA2           Mining margin3

           6%              $9.2bn               42%

Dividend              Free cash flow4   ROCE5

    $1.3bn                 $3.2bn               19%

                                                         5
SAFETY, HEALTH & ENVIRONMENT

                    Safety                                          Health                                  Environment
    Group TRCFR6,7             Fatalities           Occupational health – new cases6,8           Major incidents6,9

  15
                                                      209                                          30

                               11                            175
                    4.66                                             159
         4.02                           9
                                                                            111                            15
                                                                                    96    101
  5.42                                        5
                6          6
                               3.55   3.17                                                                            6                  6
                                             2.66                                                                          4
                                                                                                                                  2

 2013    2014       2015       2016   2017   2018     2013   2014   2015    2016   2017   2018    2013    2014    2015    2016   2017   2018

Focus on high potential hazards                     Improved working environments have           Planning and operating discipline
supporting improvements.                            driven improvements.                         supporting change.

Elimination of Fatalities Taskforce.                Removal of people from high risk areas       Minas-Rio pipeline leaks impact 2018.
                                                    the key focus.

                                                                                                                                               6
OUR TAILINGS SAFETY MANAGEMENT
                   Dam safety management                                                            Tailings dams in our portfolio
Our mandatory Group Technical Standard exceeds ICMM and regulatory                         56 tailings storage facilities, comprising 79 dams.
requirements in all jurisdictions.
                                                                                           32 dams (41%) built by the upstream method of construction: 21 in
Sets requirements for classification, competencies, Engineer of Record, and                South Africa, 10 in Botswana, 1 in Australia.
Independent Reviews.
                                                                                           Southern African regions are well suited to upstream dams due to
Sets minimum requirements for design criteria, monitoring, inspection and                  low rates of rise, sunny and dry environment, with high evaporation
surveillance.                                                                              rates, as well as low seismic risk and suitable topography.
Best-in-class, peer-reviewed by international specialists.                                 No upstream constructed dams in Chile or Peru (due to seismic
                                                                                           risk), Brazil or Colombia (due to tropical weather with increased
                                                                                           rainfall), or Canada (due to freeze-thaw cycles).
                        Group Technical     Project / operational reviews
                                                                                Group
                          Specialists     best practice & risk mgmt support

                          Internal risk    Technical Assurance – Critical                  Minas-Rio (Brazil)
                                                                                Group
                           assurance            Controls Reviews
                                                                                           We have one tailings dam in Brazil, at Minas-Rio.
                         Independent
                                          Annual Technical Review Panel        External
                                                                                           This dam is designed as a ‘water-retaining’ construction, one of the
                             TRP                                                           most robust designs for tailings storage.
                                                                                           Built with compacted earthfill material, and selected granular
                         BU Technical     Routine site visits / governance /
                        Standard expert           audits / support
                                                                                  BU       materials for drainage and filter zones, making it best-in-class.
                                                                                           Raising of current dam under way under an ‘installation licence’ –
                          Engineer of                                                      expected to convert to ‘operating licence’ following construction
                           Record          Quarterly / Annual inspections      External
                                                                                           work completion.
                                                                                           Capacity to operate at current production levels through to the end
                           Operation      Routine inspections by field staff   Operation   of 2019 under existing tailings dam ‘operating licence’.

                                                                                                                                                                  7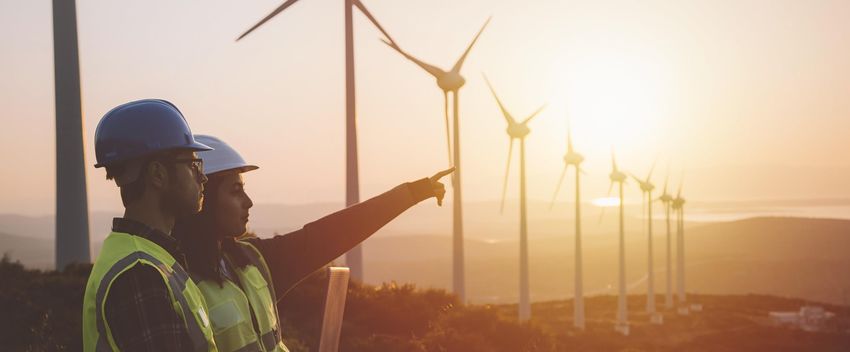
A FUNDAMENTALLY DIFFERENT BUSINESS

Copper equivalent production and productivity10,11                                                 2012 to 2018

                                                                                                    Number of assets

200

180
                                                                                +98%                    50%
                                                                                    productivity
160

140

120
                                                                                                   Production volumes10,11
100

80     108                                                                                              10%
60

40
      2012   2013         2014        2015         2016        2017          2018
                                                                                                   Unit costs11
                    Production index (Cu Eq)11
                    Productivity index (Cu Eq tonnes/full-time equivalent)
                    Cu Eq unit cost                                                                     26%
                                                                                                                             8
LEADING MARGIN CURVE IMPROVEMENT

  Average margin adjusted cost curve position12 (%)

                                                                                     49%

                                                                                              12 p.p.
                                                45%                      45%
                                                             43%

                                                                   39%
                  38%
                                                                                           37%
                                         36%                                   36%

           27%

             Peer 1                        Peer 2             Peer 3      Peer 4      Anglo

                                                      2013    2018

                                                                                                        9
LEADING COMPETITIVE POSITION

Improved operating leverage                     Improved financial leverage          Inherent growth prospects

Average margin adjusted cost curve position12   Net debt:EBITDA2                     Cu Eq growth14 2018-2023

                                                                                          ~20-25%
                                                                             0.9x

                                     45%

                                     Peer                                    Peer
                                     range                                   range
                                                                                                                      ~15%
        37%
                                     36%                                                                              Peer
                                                       0.3x                                                           range
                                                                             0.3x

                                                                                                                      ~5%

        Anglo             Peers13                      Anglo       Peers13                 Anglo            Peers13

                                                                                                                              10
STEP-CHANGE IN PERFORMANCE AND SUSTAINABILITY
P101
Exceeding industry best-in-
class process & equipment
performance
Operating
Model
Stability and
optimisation
FutureSmart
MiningTM
Game-changing technology;
data analytics; sustainability
Incremental improvement Step-change
11STEP-CHANGE BEYOND OPERATING MODEL
Copper processing PGM shovels and productivity
P101
Exceeding industry best-in-
class process & equipment
performance Venetia acceleration Longwall performance
Bulk Sorting Water & energy savings
FutureSmart
MiningTM
Game-changing technology; Data analytics
Coarse Particle Recovery
data analytics; sustainability
Step-change
12INHERENT GROWTH AND HIGHER MARGINS
Portfolio upgrade P101
Technical changes FutureSmart MiningTM
Operating Model Disciplined Investment
~135
110
100
2012 2018 2023
Cu Eq production14
30% 42% ~45-50%
Improvement in Mining Margin3
13FINANCIALS
Stephen Pearce
Palladium grain2018 – CONTINUED DELIVERY
EBITDA2 Underlying EPS15 Free cash flow4
$9.2bn $2.55/sh $3.2bn
Capital expenditure16 Net debt17 Dividend
$2.8bn $2.8bn 100c/sh
$2.5bn sustaining, $0.3bn growth down $1.7bn vs FY 2017 40% of underlying earnings
15CONTINUED DELIVERY OF IMPROVEMENTS
EBITDA2 variance: 2018 vs 2017 ($bn)
$0.8bn initiatives delivered
0.9 0.2 offset by:
(0.4) $(0.2)bn oil price & above CPI cost inflation
$(0.2)bn working capital build
PGMs
(0.6) (0.2)
0.4
Other 108
9.5
8.8 9.2
2017 Price18 Currency CPI Minas-Rio Cost & Other 2018
inflation19 volume20
16A RESILIENT BALANCE SHEET
Net debt17 ($bn) Net debt:EBITDA2 Gearing ratio21
37% y-o-y 40% y-o-y 31% y-o-y
4.5 0.5x 13%
9%
2.8 0.3x
2017 2018 2017 2018 2017 2018
~$0.5bn net debt increase in 2019 from
IFRS 16 Leases
17DELIVERING RETURNS TO SHAREHOLDERS
2018 dividend Payout per share Payout policy
$1.3bn 100c 40%
$2.6bn returned since H1: 49c, H2: 51c of underlying earnings
H1 2017
18BALANCED CAPITAL ALLOCATION
Capital allocation framework22 2018 ($bn)
Attributable free cash flow4 of $3.2bn
3.8 Add back discretionary spend
Reduced net debt17 by $1.7bn
Paid dividends of $1.3bn
(3.3)
Other adjustments
(H2 2018 dividend declared: $0.7bn)
Discretionary capital options $0.6bn discretionary spend (growth
capital, exploration/evaluation)
Future project Additional
(0.5)
Portfolio upgrade Portfolio upgrading
options shareholder returns
19LIFE EXTENSIONS WILL DELIVER VALUE;
HIGHER NEAR-TERM SUSTAINING CAPEX
Sustaining capex16 ($bn) expanded portfolio
e.g. Quellaveco
~3.2 ~3.2
2.8-3.1
2.5 0.5 0.5
0.2
2.7 2.7
2.3
2018 2019 2020-21 Long-term
Lifex SIB & Stripping23
Disciplined capital allocation framework drives project selection
Venetia Underground (Diamonds) ~$0.2bn pa 5 Mctpa from 202324 22 more years >15% IRR >50% margin
Aquila25 (Met Coal) ~$0.1bn pa 3 Mtpa from 2022 6 more years >30% IRR >40% margin
Khwezela26 (Thermal Coal) ~$0.1bn pa 3 Mtpa from 2019 9 more years >40% IRR >45% margin
20IMPROVED CAPITAL EFFICIENCY
30% ~20-25%
SIB & stripping capex/Cu Eq tonne Disciplined production growth
2012-2018 2018-2023
~135
110
100
30%
2012 2018 2023
Capital efficiency (SIB & stripping/Cu Eq tonne) Production (Cu Eq)14
21HIGH MARGIN, HIGH RETURN, FAST PAYBACK OPTIONS
2019 growth capex16 2020-21 growth capex16
$0.6bn to $0.9bn ~$1.5bn to $2bn pa
driven by Quellaveco and technology projects subject to board approvals
Disciplined capital allocation framework drives project selection27
Our share:
Quellaveco (Copper) $2.5bn to $2.7bn16 +180ktpa from 2022 ~4 year payback >15% IRR >50% margin
Marine Namibia (Diamonds) ~$0.2bn +0.5Mctpa from 2022 ~3 year payback >25% IRR >60% margin
Moranbah-Grosvenor (Met Coal) $0.2bn to $0.4bn +4-6Mtpa from 2021 ~3-4 year payback >30% IRR >50% margin
Collahuasi (Copper) $0.9bn to $1.1bn +80ktpa from 2024 ~4 year payback >20% IRR >50% margin
Technology & Innovation $0.1bn to $0.5bn pa multiple options - rapid payback, low capex
22$3-4BN COST & VOLUME IMPROVEMENT
Delivered 2013-201720: $2-3bn $3-4bn
$4.2bn ✓ Operating Model
& P101
Technology &
Innovation
Projects
$0.5bn
Met Coal P101
$0.4bn Other cost & volume
201820 201920 2020-2220
23A BALANCED AND DISCIPLINED APPROACH Attractive growth14 Strong margin3 Resilient balance sheet ~20-25% ~45-50%
PROJECT UPDATE
Mark Cutifani

                 Exploration drone - Kolomela
MINAS-RIO RESTARTED ON SCHEDULE
✓
• Pipeline scan complete and independently verified
✓
• 4km of pipeline replaced as a precaution; additional monitoring
equipment installed
✓
• PIG inspection frequency increased to 2 years, from 5
Magnetic PIG
✓
• Re-started in December 2018; FY EBITDA negative $312m 28
✓
• Step 3 operational licence for mine received December 2018
• FY 2019 production: 18Mt to 20Mt29; unit cost $28-31/t
• We expect to be ready for conversion of installation licence to
Açu port
operating licence, for tailings dam lift, in Q2 2019
26QUELLAVECO ON-TRACK
2018 achievements 2019 priorities
• Asana and Vizcachas river diversions complete • Earthworks & concrete placement for plant
• Main access road complete • 4,000-bed camp
• Contracts and procurement significantly progressed • Tunnel excavations for overland conveyor
• Earthwork contracts awarded and progressing on-site • Progress Vizcachas dam
2018 construction capex30 (100%) 2019 construction capex (100%)
$0.3bn $1.3bn to $1.5bn
Our share30,31: Nil (funded from syndication proceeds) Our share31: $0.4bn to $0.6bn
27PROSPECTIVE DISTRICTS IN DIVERSIFIED GEOGRAPHIES
Brazil Cu-Au Sakatti
Uniao, >37,000km2 granted & under application Chidliak
Arizona
Zambia Cu-Co
Zambezi W, >10,000km2 secured Ecuador Brazil
Corcapunta Zambezi West
Quellaveco Angola
Mt Isa South
Los Bronces Mogalakwena
Australia Cu
Mt Isa South, >10,000km2 granted & under application
Ecuador Cu-Au High-Priority Near Asset Discovery Projects
Prime position secured, >600km2
Mogalakwena/Northern Limb: PGE-Ni-Cu
Angola Cu-Ni-PGE Los Bronces District: Cu-Mo
30,000km2 under application
Quellaveco District: Cu-Mo
28A SUSTAINABLE FUTURE
Mark Cutifani
Copper, nickel, steel (iron ore and metallurgical coal)ASSET QUALITY PLAYS TO GLOBAL DEMAND THEMES
Diamonds Copper PGMs Bulks
~37 Mct ~1 Mt ~5 Moz ~75 Mt iron ore
Botswana Quellaveco Mogalakwena ~30 Mt met coal
Namibia Collahuasi Amandelbult Thermal coal, nickel &
Canada & South Africa Los Bronces Processing manganese
Consumer World Greener World Electrified World
30SUSTAINABILITY AT THE HEART OF OUR BUSINESS
Trusted
corporate
leader
30%
Improvement in energy efficiency by 203032
Thriving
communities OPERATIONAL
EFFICIENCY
FEWER
SURPRISES
ACCESS TO
RESOURCES
50%
Reduction in water abstraction by 203032
Healthy
environment
30%
Reduction in GHG emissions by 203032
FutureSmart MiningTM
31ATTRACTIVE LONG-TERM MARGINS AND RETURNS
2018 Long-term
Margin3 42% ~45-50%
ROCE5 19% +20%
Asset life33
production weighted average
~30 yrs ~30 yrs
32INVESTMENT PROPOSITION
“Leading capabilities actively improving a world-class asset base to drive sustainable, competitive returns”
Assets Capabilities Returns
Focus on quality Operating Model Capital discipline
Long life FutureSmart MiningTM Dividend payout ratio
Technology & Sustainability
Low-cost growth optionality Marketing Model Strong balance sheet
33
33FOOTNOTES
1. Copper equivalent is calculated using long-term consensus parameters. Excludes 16. Cash expenditure on property, plant and equipment including related
domestic / cost-plus production and impact of Minas-Rio suspension. Normalised derivatives, net of proceeds from disposal of property, plant and equipment
for Bokoni placed on care and maintenance. (2018: $0.2bn inflow due to sales of New Largo and Charterhouse St office)
2. All metrics in presentation shown on an underlying basis. and includes direct funding for capital expenditure from non-controlling
3. The margin represents the Group’s underlying EBITDA margin for the mining interests. Shown excluding capitalised operating cash flows. Attributable share
business. It excludes the impact of PGMs purchases of concentrate, third party of Quellaveco capex, net of syndication proceeds, see appendix, slide 52.
purchases made by De Beers, third-party trading activities performed by Marketing, 17. Net debt excludes the own credit risk fair value adjustment on derivatives.
the Eskom-tied South African domestic thermal coal business and reflects 18. Price variance calculated as increase/(decrease) in price multiplied by current
Debswana accounting treatment as a 50/50 joint venture. period sales volume.
4. Attributable free cash flow is defined as net cash inflows from operating activities 19. Inflation variance calculated using CPI on prior period cash operating costs that
net of total capital expenditure, net interest paid and dividends paid to minorities. have been impacted directly by inflation.
5. Attributable ROCE is defined as attributable underlying EBIT divided by average 20. EBITDA volume and cost variance. Volume variance calculated as
attributable capital employed. It excludes the portion of the return and capital increase/(decrease) in sales volumes multiplied by prior period EBITDA margin.
employed attributable to non-controlling interests in operations where the Group For assets in the first 12 months following commercial production all EBITDA is
has control but does not hold 100% of the equity. included in the volume variance, as there is no prior period comparative. Cost
6. Data relates to subsidiaries and joint operations over which Anglo American has variance includes inventory movements.
management control. In 2018 data for TRCFR and environmental metrics excludes 21. Net debt / (net assets + net debt).
results from De Beers’ joint venture operations in Namibia and Botswana. Prior 22. ‘Cash flow after sustaining capital’ comprises attributable free cash flow
years’ data includes 100% of De Beers’ joint venture operations in Namibia and excluding discretionary capex and exploration / evaluation expenditure.
Botswana. ‘Balance sheet flexibility to support dividends’ includes other items, including
7. Total Recordable Cases Frequency Rate per million hours. translation differences and employee share scheme purchases. ‘Discretionary
8. New cases of occupational disease. Previously, health incidents were reported. capital options’ comprises discretionary capex and exploration / evaluation
9. Reflects level 3-5 incidents. Environmental incidents are classified in terms of a expenditure and portfolio upgrading.
5-level severity rating. Incidents with medium, high and major impacts, as defined 23. Net of proceeds from disposal of property, plant and equipment.
by standard internal definitions, are reported as level 3-5 incidents. 24. Venetia UG the principal source of ore for the operation from 2023. Ramp-up
10. 2012-2018 estimate. Copper equivalent is calculated using long-term consensus commences from ~2020.
parameters. Excludes domestic / cost-plus production. Production shown on a 25. Lifex for Grasstree underground mine within Capcoal complex.
reported basis. Includes assets sold, closed or placed on care and maintenance. 26. Khwezela lifex into Navigation pit.
11. 2012-2018 estimate. Includes benefits of portfolio upgrading. 27. All metrics shown attributable Anglo American share.
12. Source: Wood Mackenzie; AAP; De Beers; CRU. Includes non-AA mined 28. Includes $40m projects and corporate costs.
commodities (e.g., zinc, bauxite). Excludes non-mining activities (e.g. petroleum, 29. Wet basis.
alumina/aluminium processing, marketing). Incorporates 2014 data for diamonds. 30. Post approval (H2 2018).
2018 excludes impact of Minas-Rio suspension. 31. Attributable share post share subscription proceeds. See appendix, slide 52.
13. Peer range based on data from external advisors. 32. Relative to 2016 ‘Business-As-Usual’ baseline.
14. Copper equivalent production is calculated using long-term consensus parameters. 33. Weighted based on copper equivalent production. Average life of 23 years on
Excludes domestic / cost-plus production. Production shown on a reported basis. an unweighted basis.
Includes assets sold, closed or placed on care and maintenance.
15. Underlying earnings is profit attributable to equity shareholders of the Company,
before special items and remeasurements (therefore presented after net finance 34
costs, income tax expense and non-controlling interests). Underlying EPS is
34
underlying earnings divided by shares in issue.APPENDIX
PRODUCTION OUTLOOK
                                             Units                        2017                         2018                       2019F                       2020F                        2021F
                                                                                                                                                                                    (new guidance)

Diamonds1                                       Mct                        33.5                           35                       31-33                       33-35                        35-37

Copper2                                           kt                        579                          668                 ~630-660                     ~620-680                     ~590-650

Platinum3                                      Moz                           2.4                         2.5                  ~2.0-2.14                    ~2.0-2.24                   ~2.0-2.24
                                                                                                                    (previously ~2.0 – 2.2)

Palladium3                                     Moz                           1.6                         1.6                    1.3-1.44                    1.3-1.44                     1.3-1.44

Iron ore (Kumba)5                                Mt                           45                          43                     43-445                       43-455                       43-455

Iron ore (Minas-Rio)6                            Mt                           17                            3                      18-20                       21-23                        22-24
                                                                                                                         (previously 16-19)

Metallurgical coal7                              Mt                           20                          22                       22-24                       23-25                        25-27

Thermal coal8                                    Mt                           29                          29                     26-288                        28-30                        28-30

Nickel                                            kt                          44                          42                       42-44                          ~45                          ~45

1.   On a 100% basis except for the Gahcho Kué joint venture, which is on an attributable 51% basis. Production is subject to trading conditions. Reduction in 2019 volumes due to declining open pit
     production at Venetia, and Victor and Voorspoed end-of-mine-lives.
2.   Copper business unit only. On a contained-metal basis.
3.   Produced ounces. Includes production from joint operations, associates and third-parties.
4.   Decline from 2018 due to Rustenburg POC, which will be processed based on a tolling arrangement from 1 January 2019 and therefore is excluded from production guidance.
5.   Dry basis. Subject to rail performance.
6.   Wet basis. Current guidance assumes receipt of final tailings licence in Q2 2019.
7.   Excludes thermal coal production.
8.   Export South Africa and Colombia production. Decrease in 2019 as South African operations transition into new areas, and due to lower Cerrejón production 2019-2021.
                                                                                                                                                                                                        36
                                                                                                                                                                                                        36
2018 UNIT COSTS GUIDANCE BEAT; IMPROVEMENT OFFSETS
INFLATION IN 2019
De Beers (US$/ct)1 Copper (C1 USc/lb) PGMs (US$/Pt oz)2 Kumba (FOB US$/t)
63 60 ~65 147 134 135-140 1,443 1,5612018 SIMPLIFIED EARNINGS BY BU
Kumba Iron Metallurgical Thermal
$m (unless stated) De Beers Copper PGMs Nickel Other1 Total
Ore Coal Coal
a 2,834koz3 PGMs 43.3Mt 22.0Mt4 28.4Mt5 43.1kt
Sales volume (mined) 31.7Mct2 672kt 1,305koz3 Pt
Benchmark price n/a $6,526/t6 n/a $69/t7 $198/t8 $93/t9 $13,117/t6
Product premium/discount per unit n/a n/a n/a $17/t10 $(12)/t11 $(7)/t12 $(154)/t
Freight/provisional pricing per unit n/a $(287)/t13 n/a $(14)/t n/a n/a n/a
Realised FOB Price b $151/ct14 $6,239/t $2,439/oz15 $72/t $186/t16 $86/t17 $12,963/t
FOB/C1 unit cost c $60/ct $2,954/t $1,561/oz $32/t $64/t $41/t17 $7,965/t
Royalties per unit d $4/ct $3/t $39/oz $2/t $20/t $5/t $83/t
Other costs per unit18 e $24/ct $520/t $192/oz $4/t $4/t $5/t $715/t
FOB Margin per unit f=b-c-d-e $63/ct $2,762/t $647/oz $34/t $98/t $35/t $4,200/t
Mining EBITDA g=axf 832 1,856 844 1,489 2,158 1,006 181 132 8,498
Processing and trading EBITDA19 h 413 - 218 - - 32 - - 663
Total EBITDA i=g+h 1,245 1,856 1,062 1,489 2,158 1,038 181 132 9,161
See next slide for footnotes.
38
382018 SIMPLIFIED EARNINGS BY BU - NOTES
PGMs basket price Coal blended price
Own mined volumes Coal weighted average market
Price Volume Revenue Price Volume
PGMs basket prices
Platinum $875/oz 1,305koz $1,142m HCC $207/t 19.2Mt
Palladium $1,043/oz 960koz $1,001m PCI $136/t 2.8Mt
Rhodium $2,228/oz 165koz $367m Weighted average metallurgical coal8 $198/t 22.0Mt
Nickel $13,151/t 17.4kt $228m
Other20 $444m
Total revenue $3,182m Thermal coal FOB South Africa $98/t 18.3Mt
Platinum volume 1,305koz Thermal coal FOB Colombia $85/t 10.1Mt
Basket price (per platinum oz)15 $2,439/oz Weighted average thermal coal9 $93/t 28.4Mt
1. Samancor, IOB, exploration and central corporate cost. 12. Total average 92% realisation of quoted price.
2. 13.3Mct proportionate share of sales volumes (19.2% Botswana, 50% Namibia). 13. Provisional pricing and timing differences on sales.
3. Own mined production including proportionate share of JV volumes. 14. The realised price for proportionate share (19.2% Debswana, 50% Namibia) of
4. Excludes thermal coal sales. production of 13.3Mct is $151/ct, excluding 7.6% trading margin achieved in 2018.
5. Thermal Coal - South Africa and Cerrejón. Export sales and domestic sales at export 15. Price for basket of goods per platinum oz.
parity pricing. 16. Adjusted to include Jellinbah.
6. LME price, c/lb converted to $/tonne (2,204.62 lbs/tonne). 17. Weighted average Thermal Coal – South Africa and Cerrejón.
7. Platts 62% Fe CFR China. 18. Includes market development & strategic projects, exploration & evaluation costs,
8. Weighted average of HCC/PCI prices, FOB Aus. restoration & rehabilitation costs and other corporate costs.
9. Weighted average FOB SA, FOB Col. 19. Processing and trading of product purchased from third parties and cost-plus coal
10. 64.5% Fe content, 68% of volume attracting lump premium. operations. 39
39
11. Volumes 86% HCC averaging 94% realisation of quoted low vol HCC price. 20. Iridium, Ruthenium, Gold, Copper, Chrome and other by-productsEARNINGS SENSITIVITIES
Impact of 10% change
Sensitivity Analysis – 20181
in price / FX
Commodity / Currency 31 December spot Average realised EBITDA ($m)
Copper (c/lb) 270 283 4302
Platinum ($/oz) 794 871 128
Palladium ($/oz) 1,263 1,029 102
Rhodium ($/oz) 2,445 2,204 35
Iron Ore ($/t) 73 72 301
Hard Coking Coal ($/t) 220 194 264
Thermal Coal (SA) ($/t) 97 87 153
Nickel (c/lb) 481 588 353
Oil price 71 53
South African rand 14.38 13.25 513
Australian dollar 1.42 1.34 138
Brazilian real 3.88 3.65 72
Chilean peso 694 642 69
1. Reflects change on actual results for 2018.
2. Includes copper from both the Copper and PGMs Business Units.
3. Includes nickel from both the Nickel and PGMs Business Units.
40
40DE BEERS – SOLID PRODUCTION PERFORMANCE
Sales Average Realised Underlying EBITDA
Production1 Unit cost3 Capex4
(Cons.)2 price index price EBITDA margin
2018 35.3Mct 31.7Mct 123 $171/ct5 $60/ct $1,245m 20% $417m
vs. 2017 #6% $2% #1% #6% $5% $13% $5pp #53%
Underlying EBITDA ($m)
11 (50) 1,469
1,435 73
(71)
(46)
(107) 1,245
2017 Price FX Inflation Cost Volume Other 2018
1. Shown on a 100% basis except for the Gahcho Kué joint venture, which is on an attributable 51% basis.
2. Sales of 33.7Mct on a 100% basis (4% decrease).
3. De Beers unit costs are based on consolidated production and operating costs, excluding depreciation and special items, divided by carats recovered.
4. 2018 includes the Peregrine Diamonds acquisition for $87m. 2017 is net of capitalised operating cash flows.
5. Consolidated realised price – total sales.
41
41COPPER – STRONG OPERATIONAL PERFORMANCE
Underlying EBITDA
Production Sales1 Realised price1 C1 unit cost2 Capex
EBITDA margin¹
2018 668kt 672kt 283c/lb 134c/lb $1,856m 48% $703m
vs. 2017 #15% #16% $2% $9% #23% #7pp #6%
Underlying EBITDA ($m)
(91) 1,856
223
219
1,508 58 (53) 1,505
(8)
2017 Price FX Inflation Cost Volume Other 2018
1. Excludes impact of third-party sales.
2. Includes by-product credits.
42
42PGMS – STRONG BASKET PRICE
Realised Underlying EBITDA
Production1 Pt sales2 Unit cost3 Capex Headcount
basket price2 EBITDA margin4
Pt: 2,485koz
2018 2,424koz $2,219/Pt oz $1,561/Pt oz $1,062m 29% $496m 24,800
Pd: 1,611koz
vs. 2017 #4% $3% #13% #8% #23% #3pp #40% $14%
Underlying EBITDA ($m)
(40)
(117) 1,126
1,062
417 (105) 45
(4)
866
2017 Price FX Inflation Cost Volume Other 2018
1. Production is on a metal in concentrate basis.
2. Excludes trading volumes of 94koz.
3. Own mined production and equity production of joint ventures.
4. Excludes the impact of purchase of concentrate and the sale of refined metal purchased from third-parties.
43
43KUMBA IRON ORE – EBITDA UP DESPITE RAIL CONSTRAINTS
Realised price Unit cost Underlying
Production Sales EBITDA margin Capex
(FOB)1 (FOB) EBITDA
2018 43.1Mt 43.3Mt $72/t $32/t $1,489m2 43% $309m
vs. 2017 $4% $4% #1% #3% #5% #2pp #35%
Underlying EBITDA ($m)
(54)
18 121
(39)
(75) 1,489
97 1,461
1,421
2017 Price FX Inflation Cost Volume Other 2018
1. Break-even price of $41/t for 2018 (2017: $40/t) (62% CFR dry basis).
2. Includes corporate and projects cost of $55m. 44
44MINAS-RIO OPERATIONS RESUMED FOLLOWING 9 MONTH
SUSPENSION
Realised price Unit cost Underlying EBITDA
Production Sales Capex
(FOB) (FOB) EBITDA margin
2018 3.4Mt (wet) 3.2Mt $70/wmt n/a $(312)m1 n/a $106m
vs. 2017 $80% $81% #8% n/a n/a n/a #361%
Underlying EBITDA ($m)
454
407 34 (3)
16
(584)
(182)
(312)
2017 Price FX Inflation Suspension Other 2018
of operations
1. Includes corporate and projects cost of $40m. 45
45METALLURGICAL COAL – STRONG PERFORMANCE
Metallurgical Metallurgical FOB realised Underlying EBITDA
Unit cost3 Capex
production1 sales1 price2 EBITDA margin
2018 21.8Mt 22.0Mt $190/t $64/t $2,158m4 51% $574m
vs. 2017 #11% #11% #3% #5% #12% $2pp #38%
Underlying EBITDA ($m)
41
(96)
2,158
110
(25) 2,088
15
94
85
1,934
2017 Price FX Inflation Cost Volume Jellinbah Other 2018
1. Excludes thermal coal.
2. Weighted average HCC and PCI. Excludes thermal coal.
3. FOB unit cost excluding royalties and study costs.
4. Includes corporate and projects costs of $52m. 46
46THERMAL COAL – DRIVEN BY HIGHER PRICES
Underlying EBITDA
Export prod. Sales FOB price3 Unit cost4
EBITDA margin SA Capex
SA1 / Col SA2 / Col SA / Col SA / Col
SA / Col SA / Col
2018 18.4Mt / 10.2Mt 18.3Mt / 10.1Mt $87/t / $83/t $44/t / $36/t $650m5 / $388m 34%6 / 46% $148m
vs. 2017 $1% / $4% $2% / $5% #14% / #11% 0% / #16% #18% / #1% #5pp/ $3pp $3%
Underlying EBITDA ($m)
30
(69)
1,049
1,038
(23) 12
154
934
2017 Price FX Inflation Cost & Volume Cerrejón / other 2018
SA = South Africa, Col = Colombia/Cerrejón mine
1. Export primary production, secondary production sold into export markets and production sold domestically at export parity pricing. Excludes Eskom-tied operations and Isibonelo production.
2. Export primary production, secondary production sold into export markets and production sold domestically at export parity pricing. Excludes Eskom-tied operations, Isibonelo and sales of third-
party purchases.
3. Weighted average export thermal coal price achieved. Excludes third party sales.
4. FOB unit cost excluding royalties. SA unit cost is for the trade operations.
5. Includes corporate and project costs of $45m. 47
47
6. Excludes impact of third-party sales and Eskom-tied operations.NICKEL – BENEFITTING FROM HIGHER PRICES
Realised C1 unit Underlying EBITDA
Production1 Sales1 Capex
price cost2 EBITDA margin
2018 42.3kt 43.1kt 588c/lb 361c/lb $181m 32% $38m
vs. 2017 $3% 0% #24% $1% #123% #14pp #36%
Underlying EBITDA ($m)
(14) 191
32 (9) 181
2 (3)
92
81
2017 Price FX Inflation Cost Volume Other 2018
1. Nickel BU only.
2. Codemin and Barro Alto.
48
48DE BEERS: WORLD LEADER IN DIAMONDS
Best-in-class business Consumer focused product LightboxTM
EBITDA mining margin1 Global demand
Rest of world
~53% India
USA
Gulf
China
Trading business delivering Diversified customer base2
stable margins
Other gifts Bridal
Clarity for consumers
~8% Female
Different product
Technology driven
self-purchases Love gifts
1. Margin excluding trading and other non-mining activities.
2. Source: The Diamond Insight Report on 2016 data published in 2017. Based on total jewellery spend in the top 4 markets of the USA, China, Japan and India.
49
49QUELLAVECO – A WORLD CLASS COPPER PROJECT
Attractive returns Focus on execution Successfully syndicated
Low cost with significant All key permits in place,
further potential execution benefitting from
early works
IRR Payback Mitsubishi subscription
> 15% 4 years $851m
Real, post-tax From first production (2022) Additional contingent net payment of $100m
ROCE Job creation Implied NPV
> 20% ~9,000 $2.74bn
Average over first 10 years In construction phase For 100% of the project
~2,500 jobs in normal operation
50
50QUELLAVECO – FINANCIAL MODELLING
Ownership Anglo American 60%, Mitsubishi 40%
Accounting treatment Fully consolidated with a 40% minority interest
Shareholder loans from minority shareholder to be consolidated in Anglo American Group
net debt
Project capex (nominal) $5.0-5.3 billion (100% basis - Anglo American share 60%, Mitsubishi share 40%)
Construction time / first productionQUELLAVECO – ACCOUNTING
Anglo American consolidates 100% of Quellaveco’s P&L and Balance Sheet.
Mitsubishi’s 40% share is shown as a non-controlling interest.
After the initial $0.8bn equity injection by Mitsubishi, the project will be funded 60:40 through shareholder debt.
Group net debt by the end of the project will include ~$1.7bn debt from Mitsubishi (40% of shareholder debt); which is funded from their 40% of Quellaveco.
Illustrative project spend post approval (mid-point of capex range)
$bn 2018 2019 2020-2022 Total
100% project capex 0.3 1.4 3.4 5.1
Less: subscription (0.3) (0.5) - (0.8)
Net capex - 0.9 3.4 4.3
Consolidated net debt
(cash funded by Anglo and
Our 60% share - 0.5 2.1 2.6 reported within growth capex).
Mitsubishi 40% share - 0.4 1.3 1.7 Consolidated net debt
(cash funded by Mitsubishi but
Reported in ‘Other net debt movements’ in 2018 - reported within our other net
representing cash received but not spent at 2018 year end. debt movements).
Reverses with $0.5bn outflow in 2019 ‘Other net debt
movements’ representing pre-funded capex.
52
52ASSET FOCUSED PGMS STRATEGY
World leader in PGMs Platinum demand2 - European diesel only ~20%
European light duty
$2,759/oz Other autocatalysts
1. Mogalakwena Other
autocatalysts
~20% ~22%
Base metals
49% Palladium
2018 cash margin1 Platinum
Basket price Industrial & other Jewellery
~35% ~23%
2. Amandelbult ICE/hybrid demand is set to grow3
Targeting 25% further cost reductions
~120m units
~110m units
95m units 10-20%
5-10%
1%
3. Processing 99% 90-95% 80-90%
Delivering a stable ~10% margin
2018 2025F 2030F
Battery EV ICE/hybrid
1. 2018 EBITDA margin of 46%.
2. Source: Johnson Matthey.
3. 2018: LMC automotive. 2025 and 2030 reflect Anglo American view.
53
53PGMS OWN MINED PRODUCTION SPLIT
By volume (PGMs) By revenue
3% 3% 3%
6% 2% 2%
11%
8%
36%
46%
14%
35%
31%
Platinum Palladium Other Rhodium Gold Ruthenium Iridium
54
54STRUCTURAL TRENDS FAVOURING HIGH QUALITY BULKS
2018 average Fe content (%) – peer comparison1 Focus on premium products
66.7
Kumba production
64.1 64.5
60.8 60.7 64.5%Fe
of which 68% is lump
57.7
Peer 1 Peer 2 Peer 3 Peer 4 Kumba Minas-Rio
Minas-Rio production
US$/t
Widening iron ore quality spreads
66.7%Fe
30 Pellet feed products
20
Metallurgical coal production
86%
10
0
Jul 16 Jan 17 Jul 17 Jan 18 Jul 18 Jan 19 is HCC
(10)
(20) P65/P62 Premium P58/P62 Discount
1. Source: Company reports, Woodmac. 55
55OUR ASSET IMPROVEMENT JOURNEY
Group 2018 2013 Group
37th percentile 49th percentile
Diamonds (De Beers)
Copper
PGMs
Iron Ore
Met Coal
Thermal Coal
Manganese Nickel
Nickel & Manganese
Margin adjusted cost Q1 Q2 Q3 Q4
curve position
56
56
Source: Wood Mackenzie, CRU, De Beers internal analysis, Anglo American Platinum internal analysisASSET QUALITY: DIFFERENTIATED PORTFOLIO
Revenue by product1 Capital employed by geography1
Nickel and Manganese Other
6% 5%
PGMs Australia
Thermal coal 19% 10%
12% Brazil
24%
Diamonds
Met coal (De Beers)
14% 20%
Chile, Peru
& Colombia
Iron ore 19% South Africa
12% Copper 26%
Namibia &
17% Botswana
16%
Asset focused strategy Quality asset diversification Balanced geographic exposure
1. Attributable basis. Revenue by product based on business unit.
57
57ATTRIBUTABLE FREE CASH FLOW; ONE-OFF BENEFITS IN
2017
Attributable Free Cash Flow ($bn)
4.9
2018 inventory build
Other 2017 working capital
(0.9) optimisation
Sustaining capex +$0.5bn
(0.7) Growth capex +$0.2bn
(0.3) 3.2
0.1
2017 Working capital Capex Tax timing Other 2018
58
58IFRS 16: NEW ACCOUNTING STANDARD FOR LEASES
• Leases mainly corporate offices and jewellery stores; also freight and some mining equipment
• Previously accounted for ‘off-balance sheet’ with lease costs taken to P&L
New accounting from 2019
• Lease commitments brought onto the balance sheet, increasing net debt by:
~$0.5bn
• Leases cash costs moved from P&L to balance sheet, replaced by depreciation and discount unwind in P&L
• Net increase in EBITDA: • Net impact on Underlying Earnings:
~$0.2bn pa ~$0.0bn pa
59
59DEBT MATURITY PROFILE
Debt repayments ($bn) at 31 December 2018
1.9
1.4 1.4
1.1 1.1
0.7 0.7
0.5 0.5
2019 2020 2021 2022 2023 2024 2025 2026 2027 2028
Euro Bonds US$ Bonds Other Bonds Subsidiary Financing
% of portfolio 45% 51% 2% 3%
Capital markets 97% Bank 3%
US bonds Euro bonds Other bonds (e.g. ZAR) Subsidiary financing
60
60OPERATING MODEL, TECHNOLOGY AND INNOVATION
ANGLO AMERICAN OPERATING MODEL: A DIFFERENTIATED
APPROACH
    Apply a manufacturing approach to                         Work that is planned, scheduled and
   mining, through organised and efficient                  properly resourced is safer and delivers
      planning and execution of work                            consistently and at a lower cost

                                                                   Further improvements
                                                                implemented with little initial
                                       Stabilisation of              process stability
                                    processes at a higher
                                        performance

                                                                         Stabilisation of processes at
                                                                           still higher performance

                       Low stability and high
                      variation in performance

                                                                                   75th percentile

                                                                                                         62
                                                                                                         62
INNOVATION IS NEEDED TO ENSURE SUSTAINABILITY
Then Now Future state
1900 2018
What is required to produce
40kg of copper
24t waste 6m3 water
1t waste 3m3 water
1t ore 10 KWhr 8t ore 160 KWhr 40kg
4% Cu 0.02 Km2 0.5% Cu 100 Km2
63
63P101: FOCUSED ON THE KEY VALUE DRIVERS
Mine Plant
Drill Blast Load & haul Crush Mill Float & filter
Percentage of 2018F direct cost
base, Los Bronces
= c.5% cost base
>45Mtpa +10% >94% >89%
Shovel Throughput Operating time Recoveries
performance increase
64
64A NUMBER OF GAME CHANGING TECHNOLOGIES
>50%
Reduction in water
intensity
Coarse Particle Recovery Dry Disposal
>50%
Reduction in energy
intensity
Advanced Shock-break Precision Classify
Fragmentation
65
65COARSE PARTICLE RECOVERY: IMPROVED RECOVERIES
Drill Blast Load & haul Crush Mill Float & filter
• Flotation process changed to allow for larger diameter material
Technology
• Ore is liberated and recovered with lower waste volumes
• Significant increase in throughput
Benefits
• Solidified disposal material
• All Copper assets
Applicability
• Platinum Group Metals
66
66COARSE PARTICLE RECOVERY: IN COPPER
Drill Blast Load & haul Crush Mill Float & filter
>10% >20%
Increase in Operating Decrease in water and
Free Cash Flow energy intensity
67
67BULK SORTING: LESS WASTE TO CONCENTRATOR
Drill Blast Load & haul Crush Mill Float & filter
• Uses sensors to determine ore content prior to processing
Technology
• Gangue is removed using natural heterogeneity of ore bodies
• Provides immediate grade assays
• Unlocks production capacity by rejecting waste early
Benefits • Allows for lower cut off grades (LOM extension)
• Reduces mining cost and complexity
• All Copper assets
Applicability
• Platinum Group Metals and Iron Ore
68
68BULK SORTING: IN COPPER
Drill Blast Load & haul Crush Mill Float & filter
>10%
Decrease in water and
energy intensity
69
69FUTURESMART MININGTM: SUSTAINABILITY Environment, Social and Governance
INNOVATION WITH PURPOSE: KEY MESSAGES
Mining is getting harder: Grades declining; societal expectations increasing
Context Increasing scale is not a sustainable solution
A focus on greater precision and efficiency is needed
Improved the business since 2012, through the operating model: 50% fewer
Operating assets; ~10% higher production; retained assets ~30% more productive
Model &
P101 P101 is about achieving and re-setting best-in-class performance, rather than only
continued incremental improvement
Step-change technologies: safer; more water efficient; more energy efficient
FutureSmart
Mining: Digitalisation: Adding value to the entire value-chain – mining equipment,
Technology processing plants, producing the right products for the right market; data-driven
decision-making; new business models
Trusted Corporate Leader
FutureSmart
Mining: Thriving Communities
Sustainability
Healthy Environment
71
71OUR FUTURESMART MININGTM PROGRAMME: STEP-CHANGE
INNOVATION IN TECHNOLOGY AND SUSTAINABILITY
Our Sustainability approach is integral to FutureSmart Mining™: to innovate and deliver step change results
across the entire mining value chain.
It is centred around three Global Sustainability Pillars and nine Global Stretch Goals:
Accountability
Trusted Corporate Leader Ethical value chains
Policy advocacy
Education
Thriving Communities Health and well-being
Livelihoods
Biodiversity
Healthy Environment Climate change
Water
72
72OUR 2018 SUSTAINABILITY PERFORMANCE
2013 2014 2015 2016 2017 2018 Target
Work-related
15 Zero harm
fatal injuries1 11 9
6 6 5
15% year-on-
TRCFR1 5.49 4.66
4.02 3.55 3.17 year reduction
2.66
New cases of
Year-on-year
occupational 209 175 159
111 101 reduction
disease1 96
Energy 8% saving by
consumption 106 108 106 106 97 85 2020 and 30%
(MGJ)1 by 2030
22% saving by
GHG emissions
17.1 17.3 18.3 17.9 18.0 16.0 2020 and 30%
(Mt CO2e)1
by 2030
73
73
1. Data relates to subsidiaries and joint operations over which Anglo American has management control. In 2018 data excludes results from De Beers’ joint
venture operations in Namibia and Botswana. Prior years’ data includes 100% of De Beers’ joint venture operations in Namibia and Botswana.OUR 2018 SUSTAINABILITY PERFORMANCE
2013 2014 2015 2016 2017 2018 Target
14% saving by
Total water
276 276 339 296 306 2020 and 50%
withdrawals1 227
by 2030
Environmental Year-on-year
30
incidents1 15 reduction
6 4 2 6
Jobs sustained
111 116 121 125
(‘000) 77 97
% of localised
procurement 23 23 21
12 15 15
expenditure
% of female
23 24 25 25 26 28
managers
74
74
1. Data relates to subsidiaries and joint operations over which Anglo American has management control. In 2018 data excludes results from De Beers’ joint
venture operations in Namibia and Botswana. Prior years’ data includes 100% of De Beers’ joint venture operations in Namibia and Botswana.COAL
Coal demand Our Production & Capex Profile
Thermal coal makes up ~37% of the global electricity mix We have reduced our thermal coal production by 50% since
2012:
IEA and other forecasts see a significant role for thermal coal in Production (Mt) Thermal Coal – South Africa capex ($m)
the global energy mix at least to 2030 82 80 79 74 74
266
62 214
44 152 148
Access to reliable and affordable electricity plays a critical role 93 104 90
in the alleviation of poverty and promotion of growth in
developing countries
2012 2013 2014 2015 2016 2017 2018 2012 2013 2014 2015 2016 2017 2018
Doing the right thing
Selling our coal assets would not alleviate the issue that coal
is required and would be taken out of the ground, potentially
Responsible stewardship
by someone without our values, environmental standards
and care for communities
We engage in policy discussions to develop local carbon
Informing policy pricing mechanisms, including in South Africa
Through FutureSmart MiningTM, we aim to cut our
Investing in innovation operational GHG emissions by 30% by 2030 and have a plan
for a carbon neutral mine
75
75TAILINGS DAMS SUMMARY
Upstream design Downstream design
Built progressively ‘upstream’ of the starter dam by Raised progressively with the crest of the dam moving
incorporating tailings materials into the outer dam wall ‘downstream’ of the starter dam, with an internal drain or filter.
construction, each raise being supported on previously We may use geosynthetic liners on the upstream slope of the
placed tailings. Its stability is dependent on the in situ shear dam to prevent erosion of the upstream slope from fluctuating
strength of the tailings. pond levels and waves. Also used for limiting infiltration
through the dam.
Their use is best suited to arid climates where less water is
stored, low rates of rise and non-seismic regions. Downstream tailings dams require more material to build than
upstream constructed dams, but are considered more stable
and have low vulnerability to static liquefaction. Their stability
does not rely on strength of placed tailings.
76
76TAILINGS DAMS IN OUR PORTFOLIO
Tailings dams in our portfolio South America
We have a total of 56 tailings storage facilities, with 79 tailings We do not have any dams built by the upstream method of
dams providing tailings containment. construction in South America.
A total of 32 dams (41%) are built by the upstream method of Due to seismic risk in Chile and Peru and the wet tropical
construction. conditions in Brazil and Colombia, we use other, more robust,
designs.
Except for one dam in Australia, all other upstream dams are in:
• South Africa (21)
• Botswana (10)
Minas-Rio
Our dams in southern Africa are well suited due to low rates of The Minas-Rio dam is designed to retain water, one of the most
rise, sunny and dry environment, with high evaporation rates, robust designs for tailings storage. It is built with compacted
flat topography and non-seismic geology. earthfill material, and selected granular materials for drainage
and filter zones, making it best-in-class.
The tailings dam has been built and is in use. We obtained an
‘installation licence’ to construct the first dam raise for the next
stage of the mine and we are currently completing these works.
As required in all dam raises, the structure will be inspected by
the Brazilian authorities when complete, as a prerequisite to
grant of the ‘operating licence’ to the increased capacity.
We are able to continue mining and processing for the
remainder of 2019, at current mining rates, with our existing
tailings licence.
77
77TAILINGS DAMS MANAGEMENT PROCESS
Our Group Technical Standard exceeds regulatory requirements
• All our tailings dams are built following established design criteria to ensure structural integrity.
Design • We adhere to the highest standards of change management to ensure structural integrity is preserved,
and change without exception.
• All structures must have a Consequence Classification of Structure (CCS) rating based on the
management potential hazard evaluation of a dam failure.
• Design, monitoring and surveillance requirements are stipulated based on this rating.
• Every facility with a Major or High CCS rating must have a Competent Person in charge.
• There must also be an Engineer of Record (EOR) for each facility, preferably the external firm that
designed the dam. The EOR works closely with the operation and provides continuous support from
Maintenance design and construction through to maintenance, monitoring and inspection.
and • We have a dedicated team of Group level engineering specialists to provide oversight, strategic direction
and technical support. They also review tailings facilities at non-managed operations on a rotational
monitoring basis approximately every three years.
• Various forms of remote and other monitoring technologies measure dam performance, from ground
movement to seepage and structural deformation, as examples.
• The EOR conducts formal quarterly, semi-annual and/or annual dam safety reviews across all our
Inspections managed operations, as required by our Group Technical Standard. Whilst they are external to Anglo
American, they cannot be considered independent.
and • Therefore, we have a separate Technical Review Panel (TRP) appointed at the Business Unit level,
audits that is independent and reviews the critical facilities on an annual basis as a minimum, in some cases
more frequently (i.e. every six months) as determined by the independent TRP and the conditions at
the site.
78
78INVESTOR RELATIONS Paul Galloway paul.galloway@angloamerican.com Tel: +44 (0)20 7968 8718 Robert Greenberg robert.greenberg@angloamerican.com Tel: +44 (0)20 7968 2124 Emma Waterworth emma.waterworth@angloamerican.com Tel: +44 (0)20 7968 8574
You can also read