CREDIT SUISSE 2018 GLOBAL STEEL AND MINING CONFERENCE - 2018 interim results 10-11 September 2018 - Anglo American
←
→
Page content transcription
If your browser does not render page correctly, please read the page content below
CREDIT SUISSE 2018 GLOBAL
STEEL AND MINING CONFERENCE
2018 interim results
10-11 September 2018
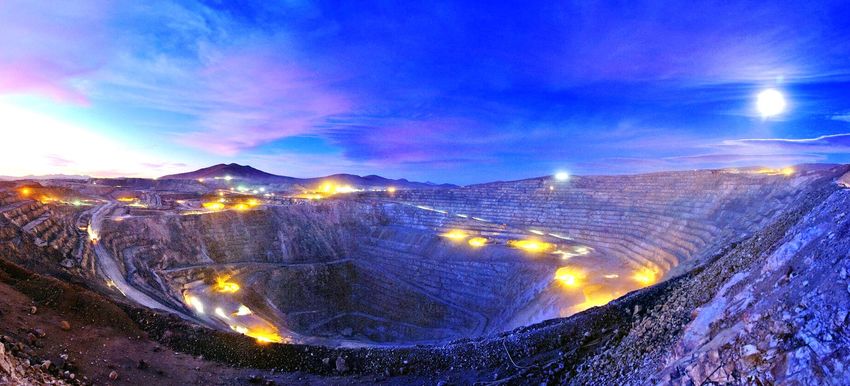
Copper – Quellaveco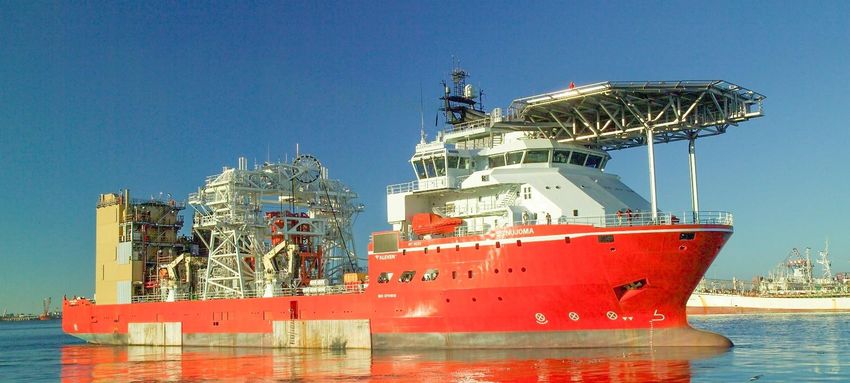
CAUTIONARY STATEMENT
Disclaimer: This presentation has been prepared by Anglo American plc (“Anglo American”) and comprises the written materials/slides for a presentation concerning Anglo American. By attending this presentation
and/or reviewing the slides you agree to be bound by the following conditions. The distribution of this document in certain jurisdictions may be restricted by law and persons into whose possession this document
comes should inform themselves about, and observe, any such restrictions.
This presentation is for information purposes only and does not constitute an offer to sell or the solicitation, inducement or an offer to buy shares in Anglo American or any other securities. Further, it does not
constitute a recommendation by Anglo American or any other party to sell or buy shares in Anglo American or any other securities and should not be treated as giving investment, legal, accounting, regulatory,
taxation or other advice.
No representation or warranty, either express or implied, is provided in relation to the accuracy, completeness or reliability of the information contain herein. None of Anglo American, its affiliates, advisors or
representatives shall have any liability whatsoever (in negligence or otherwise) for any loss howsoever arising from any use of this material or otherwise in connection with this material.
Forward-looking statements
This presentation includes forward-looking statements. All statements other than statements of historical facts included in this presentation, including, without limitation, those regarding Anglo American’s financial
position, business, acquisition and divestment strategy, dividend policy, plans and objectives of management for future operations (including development plans and objectives relating to Anglo American’s products,
production forecasts and reserve and resource positions), are forward-looking statements. By their nature, such forward-looking statements involve known and unknown risks, uncertainties and other factors which
may cause the actual results, performance or achievements of Anglo American, or industry results, to be materially different from any future results, performance or achievements expressed or implied by such
forward-looking statements.
Such forward-looking statements are based on numerous assumptions regarding Anglo American’s present and future business strategies and the environment in which Anglo American will operate in the future.
Important factors that could cause Anglo American’s actual results, performance or achievements to differ materially from those in the forward-looking statements include, among others, levels of actual production
during any period, levels of global demand and commodity market prices, mineral resource exploration and development capabilities, recovery rates and other operational capabilities, the availability of mining and
processing equipment, the ability to produce and transport products profitably, the availability of transport infrastructure, the impact of foreign currency exchange rates on market prices and operating costs, the
availability of sufficient credit, the effects of inflation, political uncertainty and economic conditions in relevant areas of the world, the actions of competitors, activities by governmental authorities such as permitting
and changes in taxation or safety, health, environmental or other types of regulation in the countries where Anglo American operates, conflicts over land and resource ownership rights and such other risk factors
identified in Anglo American’s most recent Annual Report. Forward-looking statements should, therefore, be construed in light of such risk factors and undue reliance should not be placed on forward-looking
statements. These forward-looking statements speak only as of the date of this presentation. Anglo American expressly disclaims any obligation or undertaking (except as required by applicable law, the City Code
on Takeovers and Mergers (the “Takeover Code”), the UK Listing Rules, the Disclosure and Transparency Rules of the Financial Conduct Authority, the Listings Requirements of the securities exchange of the JSE
Limited in South Africa, the SIX Swiss Exchange, the Botswana Stock Exchange and the Namibian Stock Exchange and any other applicable regulations) to release publicly any updates or revisions to any forward-
looking statement contained herein to reflect any change in Anglo American’s expectations with regard thereto or any change in events, conditions or circumstances on which any such statement is based.
Nothing in this presentation should be interpreted to mean that future earnings per share of Anglo American will necessarily match or exceed its historical published earnings per share.
Certain statistical and other information about Anglo American included in this presentation is sourced from publicly available third party sources. As such it has not been independently verified and presents the
views of those third parties, but may not necessarily correspond to the views held by Anglo American and Anglo American expressly disclaims any responsibility for, or liability in respect of, such information.
No Investment Advice
This presentation has been prepared without reference to your particular investment objectives, financial situation, taxation position and particular needs. It is important that you view this presentation in its entirety. If
you are in any doubt in relation to these matters, you should consult your stockbroker, bank manager, solicitor, accountant, taxation adviser or other independent financial adviser (where applicable, as authorised
under the Financial Services and Markets Act 2000 in the UK, or in South Africa, under the Financial Advisory and Intermediary Services Act 37 of 2002).
Alternative Performance Measures
Throughout this presentation a range of financial and non-financial measures are used to assess our performance, including a number of the financial measures that are not defined or specified under IFRS, which
are termed ‘Alternative Performance Measures’ (APMs). Management uses these measures to monitor the Group’s financial performance alongside IFRS measures to improve the comparability of information
between reporting periods and business units. These APMs should be considered in addition to, and not as a substitute for, or as superior to, measures of financial performance, financial position or cash flows
reported in accordance with IFRS. APMs are not uniformly defined by all companies, including those in the Group’s industry. Accordingly, it may not be comparable with similarly titled measures and disclosures by
other companies.

                                                                                                                                                                                                                                   2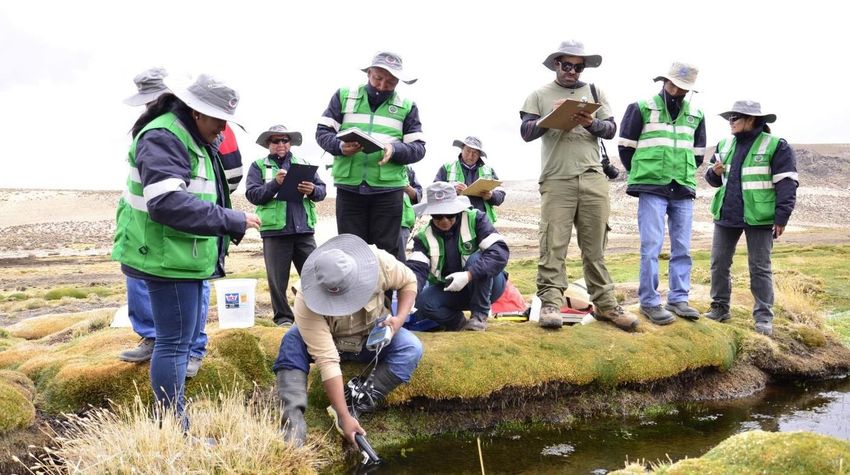
WHAT YOU SHOULD TAKE AWAY…

                 Fewer assets
 A transformed
                 Increased production
    business
                 Strong FCF yield (12%) and returns (19%)

                 On track to achieve stretch targets set for cost / volume improvements
  Continuing
   delivery      Conservative balance sheet being maintained
                 Attractive yield (5%)

                 Quellaveco – a world class copper project
  Disciplined
    growth       Brown and greenfield options across the portfolio
                 3% CAGR growth potential to 2022 – no need to buy growth

                 Asset-led strategy
   Portfolio     High quality diversified business
   strength
                 Positioned for a changing world

                                                                                          3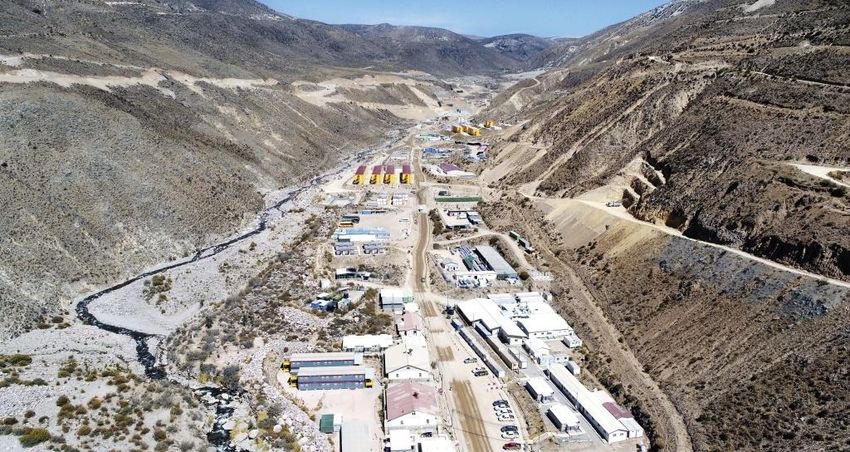
POTENTIAL TURNED INTO DELIVERY

       Assets                       Capabilities                     Returns

      Quality                    Operating Model                Strong balance sheet

   Diversification                Innovation and                  Capital discipline
                                   sustainability

      Growth                         Marketing                  Sustainable dividend

    “World class assets & leading capabilities to deliver a world class business”

                                                                                       4
ASSET QUALITY: DIFFERENTIATED PORTFOLIO

                  Revenue by product29                        Capital employed by geography29

           Nickel and Manganese                                         Other
           7%                                                           4%
                                  PGMs                      Australia
 Thermal coal                     18%                       8%
 14%                                                                                                Brazil
                                                                                                    25%
                                         Diamonds
Met coal                                 (De Beers)
17%                                      22%
                                                      Chile, Peru
                                                      & Colombia
    Iron ore                                          19%                                         South Africa
    9%                            Copper                                                          26%
                                                               Namibia &
                                  14%                          Botswana
                                                               18%

Asset focused strategy              Quality asset diversification               Balanced geographic exposure

                                                                                                                 5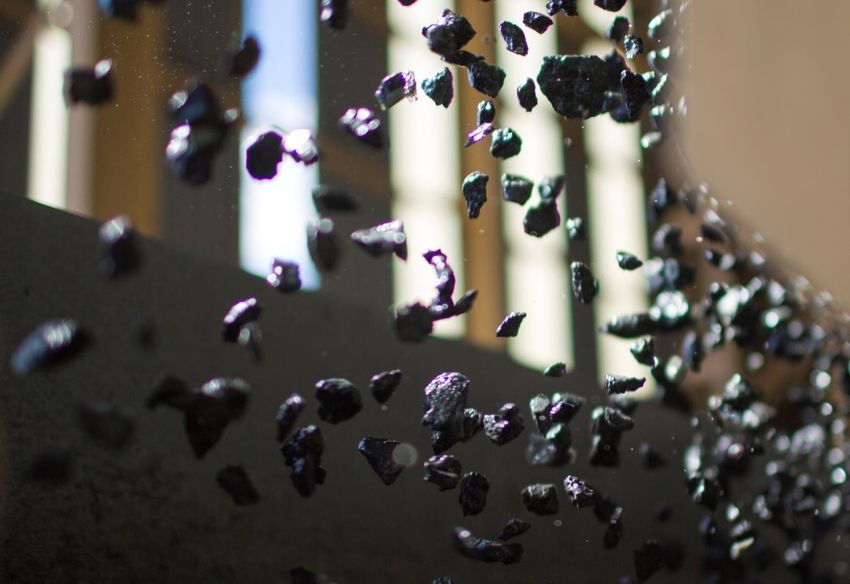
PORTFOLIO OVERVIEW – SIMPLIFIED

               De Beers                      Copper                              PGMs

Botswana          Debswana                                                      Mogalakwena
                                            Los Bronces
South Africa      DBCM       Chile
                                            Collahuasi                          Amandelbult
Namibia           Namdeb                                         South
                                            Other operations     Africa
                                                                                Processing
Canada            Canada
                             Peru           Quellaveco                          Other operations
Trading           GSS

               Iron ore                       Coal                         Nickel & Manganese

                             Australia          Metallurgical                      Barro Alto
South Africa   Kumba                                             Brazil
                                                                                   (Nickel)
                             South Africa       Thermal export
                                                                 Australia /       Samancor
Brazil         Minas-Rio
                             Colombia           Cerrejón         South Africa      (Manganese)

                                                                                                   6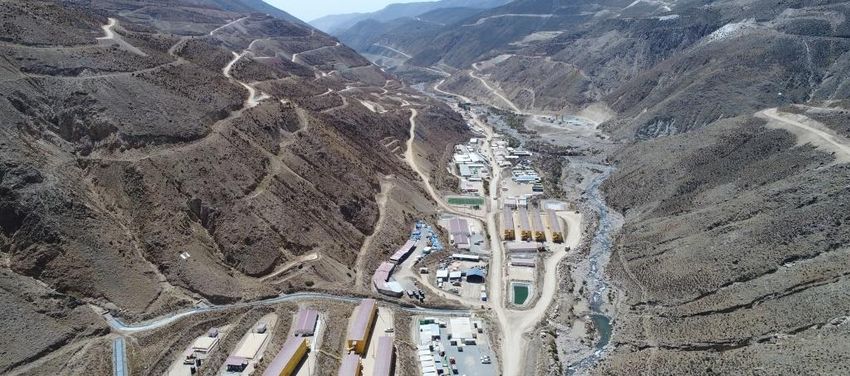
BUSINESS PERFORMANCE
Mark Cutifani

Platinum – Mogalakwena
H1 2018 – CONTINUED DELIVERY

Operating performance         Earnings and cash flow         Margins and returns

Production volumes1           EBITDA3                         EBITDA margin5

          6%                      $4.6bn                              41%

Cost & volume improvements2   Attributable free cash flow4    ROCE6

    $0.4bn                        $1.6bn                              19%

                                                                                   8
SAFETY, HEALTH & ENVIRONMENT

                  Safety                                                 Health                                Environment
      Group TRCFR7        Fatalities                   Occupational health – new cases8              Major incidents9

     15
                                                           203                                         30

                   4.98                                           173
                           11
                                                                         155
           4.14                        9
                                                                                108                            15
             6      6                                                                  96
    5.49
                          3.78    3.46      2
                                                                                                                         6
                                                2.62                                          26                                4             4
                                                                                                                                       2

    2013   2014   2015    2016    2017      H1             2013   2014   2015   2016   2017    H1     2013    2014      2015   2016   2017    H1
                                           2018                                               2018                                           2018

•    Elimination of Fatalities taskforce.              •     Improved working environments.          • Improvements in planning and
                                                                                                       operating discipline.
•    Focus on high potential hazards.                  •     Removal of persons from high risk
                                                             areas.                                  • Minas-Rio clean up complete and
                                                                                                       pipeline inspection underway.

                                                                                                                                                    9
PRODUCTIVITY IMPROVEMENT CONTINUES

Copper equivalent production and productivity10,11                                         2012 to H1 2018

                                                                                           Productivity10
200

180

160
                                                                                     182
                                                                                                82%
140

120
                                                                                           Production Volumes11
100

80

60
       108
                                                                                                8%
40
      2012   2013        2014         2015          2016         2017        H1 2018
                                                                            annualised
                                                                                            Number of assets10
                Copper equivalent Production   Index11

                                                                                                47%
                Copper equivalent Productivity Index (tonnes/full-time equivalent)

                                                                                                                  10
A COMPELLING ASSET EXAMPLE – MOGALAKWENA (PGMS)
Mining Concentrating Value enhancing
Shovel loading rate (tonnes / hr) Tonnes milled (million) PGM ounces (‘000 ounces)
+34% +35% +60%
34% 35% 60%
2,322 14.0 1,100 1,150
126
1,727 10.4
6.9 6.9 721
5.8 6.3 509
5.0 89
H1 2018 vs 2012 2018e vs 2012 2018e vs 2012
327
5.9 6.3 6.7 7.1 464
5.4
305
2012 2014 2016 2017 H1 2018 2012 2014 2016 2017 H1 2018 2012 2014 2016 2017 2018e
Truck utilisation (average hrs / truck) 4E Concentrator recovery % All-in sustaining cost12
+19% +8% (75)%
994
6,529 80.0
74.0
19% 8% 75%
5,489
H1 2018 vs 2012 H1 2018 vs 2012 H1 2018 vs 2012253
2012 2014 2016 2017 H1 2018 2012 2014 2016 2017 H1 2018 2012 2014 2016 2017 H1 2018
(annualised)
11AN IMPROVED COMPETITIVE POSITION
Group: Group:
46th percentile 52nd percentile
2018 2013
2018 2013 Copper
2018 2013 Met Coal
2018 2014 Diamonds (De Beers)
2018 2013 PGMs
2018
Nickel
2013
2013 2018 Thermal Coal
2013 2018 Iron Ore
Cost curve position Q1 Q2 Q3 Q4
12PERFORMANCE & UPGRADED PORTFOLIO DRIVE MARGINS
+11pp Mining EBITDA margin5 (%)
Uplift to mining margin5 since 2012 from Operating Model,
portfolio upgrade and Marketing 5-10pp
~50%
+11pp
41%
Further… 30%
5-10pp
Uplift to be achieved through:
• Operational Efficiency (1-5 years)
• Innovation and Technology (3-5 years)
• Project Delivery (3-5 years) 2012 H1 2022 target
2018
13FINANCIALS Stephen Pearce Copper – Collahuasi
H1 2018 – CONTINUED DELIVERY

EBITDA3                        Underlying EPS14           Free cash flow4

$4.6bn                          $1.23/sh                    $1.6bn
up 11% vs H1 2017               up 4cps vs H1 2017          up 23% after one-offs

Capital expenditure13          Net debt                   Dividend

$1.2bn                           $4.0bn                   49c/sh
$2.6-2.8bn expected for FY18     down $0.5bn vs FY 2017   40% of underlying earnings

                                                                                       15
CONTINUED DELIVERY OF IMPROVEMENTS
EBITDA variance: H1 2018 vs. H1 2017 ($bn)
0.8
PGMs
(0.2)
(0.2)
Copper
(0.3) 0.4
Thermal 108
Coal
Other 4.6 4.6
4.1
H1 2017 Price15 Currency Inflation16 Minas-Rio Cost & H1 2018
volume2
16$4.6BN COST & VOLUME IMPROVEMENT DELIVERED
…the next $3-4bn
Operational Efficiency Technology and Innovation Project Delivery
~$1.5bn ~$1.0bn ~$1.5bn
1-5 years 3-5 years 3-5 years
Benchmark and beyond Concentrated Mine Quellaveco (Copper)
Amandelbult turnaround (PGMs) Digitally Intelligent Mine Moranbah-Grosvenor (Met Coal)
Minas-Rio (Iron Ore) Modern Mine Marine Namibia (Diamonds)
17CONTINUED GROWTH IN EARNINGS AND RETURNS
Underlying EPS ($bn) Return on capital employed6 (%)
3% 6%
1.19 1.23 19%
18%
H1 2017 H1 2018 H1 2017 H1 2018
18STRONG FREE CASH FLOW GENERATION CONTINUES
Attributable Free Cash Flow4 ($bn)
2.7
H1 2017 items not repeated in
H1 2018 incl. lower capex, tax +23%
and dividends to minorities 1.6
1.3
H1 2017 H1 2018
19A RESILIENT BALANCE SHEET
Net debt17 ($bn) Net debt / EBITDA Gearing ratio18
36% y-o-y 42% y-o-y 37% y-o-y
6.2 0.8x 19%
4.5
13%
4.0 0.5x 12%
0.4x
H1 2017 FY 2017 H1 2018 H1 2017 FY 2017 H1 2018 H1 2017 FY 2017 H1 2018
(annualised) (annualised)
20DELIVERING RETURNS TO SHAREHOLDERS
H1 2018 dividend Payout per share Committed to
payout policy
$630m 49c 40%
$1.9bn returned since +2% vs H1 2017 of underlying earnings
H1 2017
21DELEVERAGING AND DIVIDEND SUSTAINABILITY
Capital allocation framework19 H1 2018
• Attributable free cash flow of $1.6bn
1.8 • Add back discretionary spend
Cash flow
Discretionary after
capital sustaining
options capital
• Reduced net debt by $0.5bn
• Paid final dividend of $0.7bn
(1.7) • Other adjustments
• (H1 2018 dividend declared: $0.6bn)
Balance sheet
flexibility to support
dividends
• Discretionary capital including
(0.2) exploration/evaluation
• Portfolio upgrading
Discretionary capital options
Additional
Future project
Portfolio upgrade shareholder
options
returns
22DISCIPLINED CAPITAL ALLOCATION Mark Cutifani De Beers – SS Nujoma
PORTFOLIO – ASSET QUALITY FOCUS

               Longer term positioning                Quality asset focus

               Exceptional resource endowment         High quality growth opportunities
   Copper
               Long life, low cost assets             Los Bronces, Collahuasi & Quellaveco

                                                                                               Discretionary Capital
  Diamonds     Industry leader with diversification   Capacity to respond to demand

                                                                                                 is asset focused
  (De Beers)   Focus on market growth & development   Botswana, Marine Namibia

               Repositioned portfolio                 Mogalakwena opportunities
   PGMs
               Low cost industry leader               Amandelbult optimisation

               High quality assets                    Minas-Rio ramp-up & Kumba enhancements
    Bulks
               Focus on cash margins & returns        Moranbah-Grosvenor de-bottlenecking

                                                                                                                       24
CONTINUED PORTFOLIO UPGRADE IN H1 2018
PGMs Diamonds
Copper Thermal Coal
repositioning (De Beers)
Quellaveco Union sold Eskom-tied mines Lightbox
approval & sold
syndication BRPM sale Offer for Peregrine
New Largo project
Mototolo sale
acquisition
25QUELLAVECO: A WORLD CLASS COPPER PROJECT Copper - Quellaveco
QUELLAVECO – A WORLD CLASS COPPER PROJECT

Attractive returns…            …for a world class copper project
IRR
                                 Low cost                 Q1 on cost curve

>15%                                                          Long life
Real, post-tax
                                Significant
                                                            Large scale
                                 potential
ROCE

                                                         Endowment upside
>20%
                                  Capital
Average over first 10 years                            Successful syndication
                                 discipline

                                                             Permitted
Payback
                                Execution
4 years                           ready
                                                      Unique social credentials

From first production (2022)                          Established mining region
                                                                                  27
EXECUTION READY Strong local support, key permits in place Target construction schedule of
SUCCESSFULLY SYNDICATED WITH MITSUBISHI CORP

         Consideration22                                Implied NPV             Anglo American ownership

         $600m                                   $2.74bn                                  60%
     $500m upfront, $100m contingent                  for 100% of the project   from 82%, reducing capex and risk

Syndication confirms the world-class quality of the asset

 •    Raises Mitsubishi stake from 18.1% to 40% - extending a long-standing partnership

 •    Aligns with disciplined approach to capital allocation

 •    External validation of quality of the project

                                                                                                                    29
ATTRACTIVE RETURNS PROFILE
Robust financial returns on project capex of $5.0-5.3bn
IRR23 ROCE Payback period
>15% >20% 4 years
Real, post-tax Average over first 10 years From first production in 2022
EBITDA margin Construction capex 2018 construction capex24
>50% $2.5-2.7bn ~$0.4bn
Average over first 10 years Anglo American share post-syndication to be fully funded from
syndication proceeds
30COMPETITIVE COST CURVE POSITION
Quellaveco improves our cost position
C1 cash cost
2018 Copper C1 cash cost curve25
$1.05/lb Q1 Q2 Q3 Q4
Average over first 10 years
Quellaveco will improve AA Copper’s
Quellaveco
position on cost curve
Structural cost advantages
• Low strip ratio
• Efficient & short hauling
• Competitive labour & power
Production
300ktpa
Copper equivalent average over first 10 years
31THE START OF THE RESOURCE JOURNEY
Favourable mineralisation characteristics
4,000m above sea level
Mineralisation open at depth, and to north & south
Cuajone Quellaveco Toquepala
Neighbouring mines operating >40 yrs & 2-3x deeper26
2,000m above sea level
Quellaveco at start of its resource journey Resource expansion at LB & Collahuasi
Mt
Porphyry deposits tend to occur in clusters
Contained copper:
48
Mineral Resources27
Quellaveco licence area: significant potential &
several prospective anomalies 17 Contained copper:
8 19 30 Ore Reserves27
11 17
8
2004 2017
Los Bronces Collahuasi Quellaveco
32BUILDING ON FIRM FOUNDATIONS Mark Cutifani De Beers – Gahcho Kué
PORTFOLIO: LONG LIFE WITH OPTIONALITY

A unique endowment                          Longer term asset optionality

2017 average asset life28

                                                          Los Bronces UG, Collahuasi
                                              Copper

30 years                                                  & Sakatti

                                             Diamonds     Jwaneng, Orapa
                                             (De Beers)   & Marine Namibia

Average life28 (years)

                                                          Mogalakwena, Amandelbult
                                               PGMs
                                                          & Mototolo

           30                    30

                                                          Aquila, Moranbah South
                                              Met Coal
                                                          & Peace River Coal

          Today             5 year target

                                                                                       34
RESOURCE DISCOVERY: PATHWAY TO VALUE
Geographies Innovation
New search spaces - FutureSmart Mining™ can
Frontier & undercover unlock value
District-scale positions
(1,000 to >10,000km2 ) Rapid implementation of
concepts and tools
Agility Value Focus
Discovery Operating Strong cash generation
Model potential
First-mover advantage Capital efficient projects
35PROSPECTIVE DISTRICTS IN DIVERSIFIED GEOGRAPHIES
Australia Cu Sakatti
Mt Isa South, >7,000km2 under application Peregrine
Brazil Cu-Au Uniao
Uniao, >19,000km2 under application, Ecuador
Zambezi West
Corcapunta
Quellaveco
Los Bronces Mogalakwena
Ecuador Cu-Au Mt Isa South
Securing prime position, >800km2
High-Priority Near Asset Discovery Projects
Peru Cu-Au
Corcapunta, near-term drilling target Los Bronces District: Cu-Mo
Zambia Cu-Co Mogalakwena/Northern Limb: PGM-Ni-Cu
Zambezi West, >10,000km2 secured
Quellaveco District: Cu-Mo
36PORTFOLIO POSITIONED FOR A CHANGING WORLD
An Electrified A Greener A Richer
World World World
~1Mt copper
✓ ✓ ✓
~37Mct diamonds (De Beers)
✓
~5Moz PGMs
✓ ✓
~70Mt high grade iron ore
✓
~21Mt premium coking coal
✓
~30Mt export thermal coal
✓ ✓
~75kt nickel and ~3.5Mt manganese
✓ ✓
37COMMODITY OUTLOOK
Medium-to-long term commodity outlook
• Demand to remain robust in medium to long term. China remains main driver for demand. Green
Copper economy presents upside.
• Risk of tightening in supply from early 2020s.
• Growing disposable income leads demand. Long term, demand is correlated with global GDP.
Diamonds
• Supply set to roll over due to mine exhaustion.
• ICE/hybrid market set to grow to 2025/30, despite BEV penetration expected at ~10-20% by then.
PGMs • Jewellery demand expected to recover and grow from consumer spend in China and India.
• Supply expected to be at most, stable.
• Iron ore: Expected growth in India / developing Asia offsets China slowdown. More supply discipline by majors.
Bulks • Metallurgical coal: Demand growth expected to shift from China to India. Chinese production being managed.
• Thermal coal: Demand expected to be stagnant.
• Nickel: Robust growth in stainless steel demand and electric vehicle battery potential.
Other
• Manganese: 10kg used per tonne of all steels. Electric vehicle presents marginal upside.
38POTENTIAL TURNED INTO DELIVERY
Assets Capabilities Returns
Quality Operating Model Strong balance sheet
Diversification Innovation and Capital discipline
sustainability
Growth Marketing Sustainable dividend
“World class assets & leading capabilities to deliver a world class business”
39FOOTNOTES
1. Copper equivalent production is normalised for Bokoni being placed on care and 13. Cash expenditure on property, plant and equipment including related
maintenance, and the suspension of operations at Minas-Rio. De Beers production derivatives, net of proceeds from disposal of property, plant and equipment and
on 100% basis except the Gahcho Kué joint venture which is on an attributable 51% includes direct funding for capital expenditure from non-controlling interests.
basis; Copper production from the Copper business unit; Copper production shown Shown excluding capitalised operating cash flows.
on a contained metal basis; PGMs production reflects own mine production and 14. Underlying earnings is profit/(loss) attributable to equity shareholders of the
purchases of metal in concentrate; Iron ore total based on the sum of Minas-Rio Company, before special items and remeasurements, and is therefore
(wet basis) and Kumba (dry basis); Export thermal coal includes export primary presented after net finance costs, income tax expense and non-controlling
production from South Africa and Colombia, and excludes secondary South African interests.
production that may be sold into either the export or domestic markets; Nickel 15. Price variance calculated as increase/(decrease) in price multiplied by current
production from the Nickel business unit. period sales volume. For diamonds, the variance reflects a positive change in
2. EBITDA variance. Volume variance calculated as increase/(decrease) in sales mix to higher value goods, with the price index up 2%.
volumes multiplied by prior period EBITDA margin. For assets in the first 12 months 16. Inflation variance calculated using CPI on prior period cash operating costs that
following commercial production all EBITDA is included in the volume variance, as have been impacted directly by inflation.
there is no prior period comparative. Cash costs include inventory movements. 17. Net debt excludes the own credit risk fair value adjustment on derivatives.
3. All metrics in presentation shown on an underlying basis. 18. Net debt / (net assets + net debt).
4. Attributable free cash flow is defined as net cash inflows from operating activities 19. ‘Cash flow after sustaining capital’ comprises attributable free cash flow of
net of total capital expenditure, net interest paid and dividends paid to minorities. $1.8bn, excluding discretionary capex and exploration / evaluation expenditure
5. The margin represents the Group’s underlying EBITDA margin for the mining of $0.2bn. ‘Balance sheet flexibility to support dividends’ comprises reduction in
business. It excludes the impact of PGMs purchases of concentrate, third party net debt of $0.5bn, dividends of $0.7bn and $0.4bn of other items, including
purchases made by De Beers, third party marketing activities, the South African translation differences, employee share scheme purchases and accrued
domestic thermal coal business and reflects Debswana accounting treatment as a interest. ‘Discretionary capital options’ comprises discretionary capex and
50/50 joint venture. exploration / evaluation expenditure of $0.2bn.
6. Attributable ROCE is defined as attributable underlying EBIT divided by average 20. Commitment of 1bn Peruvian Sol over next 30 years resulting from Dialogue
attributable capital employed. It excludes the portion of the return and capital Table commitments.
employed attributable to non-controlling interests in operations where Anglo 21. Unskilled workforce.
American has control but does not hold 100% of the equity. 22. The total subscription by Mitsubishi for new shares in AAQSA will be $833
7. Total Recordable Cases Frequency Rate per million hours. million (in order for Mitsubishi to attain a 40% share of the total number of
8. New cases of occupational disease. Previously, health incidents were reported. AAQSA shares following the issue of new shares), of which $500 million will be
9. Reflects level 3-5 incidents. Environmental incidents are classified in terms of a 5- consideration to pre-fund a portion of Anglo American’s capital contributions to
level severity rating. Incidents with medium, high and major impacts, as defined by AAQSA for the development of the Quellaveco project. The total subscription
standard internal definitions, are reported as level 3-5 incidents. consideration will be subject to customary balance sheet adjustments using a
10. 2012-H1 2018. Includes benefits of portfolio upgrading. valuation date of 1 July 2018.
11. 2012-H1 2018. Copper equivalent is calculated using long-term consensus 23. Real, post-tax.
parameters. Excludes domestic / cost-plus production. Production shown on a 24. 100% of capex from 1 August 2018, post-Board approval.
reported basis. Includes assets closed or placed on care and maintenance. 25. Wood Mackenzie.
Includes sale of Union announced in February 2017 and Eskom-tied thermal coal 26. Relative to Quellaveco reserve pit.
operations announced in April 2017. 27. Refer to the Ore Reserves and Mineral Resources Report 2017 for a
12. All-in sustaining costs defined as cash operating costs, overhead costs, other breakdown of the classification categories.
income and expenses, all sustaining capital expenditure, capitalised waste stripping 28. Weighted average asset life based on copper equivalent production.
40
and allocated marketing and market development costs net of revenue from all 29. Attributable basis. Revenue by product based on business unit.
metals other than platinum.APPENDIX
De Beers - ForevermarkPRODUCTION OUTLOOK
Units 2016 2017 2018F 2019F 2020F
Diamonds1 Mct 27.3 33.5 34-36 ~32 ~32
Copper2 Kt 577 579 630-6603 600-660 600-660
Platinum4 Moz 2.4 2.4 2.4-2.45 ~2.05 ~2.05
(Previously 2.3-2.4)
Palladium4 Moz 1.5 1.6 1.5-1.6 1.3-1.45 1.3-1.45
Iron ore (Kumba)6 Mt 41 45 43-44 44-45 44-45
(Previously 44-45)
Iron ore (Minas-Rio)7 Mt 16 17 ~3 20-24 24-26.5
(Previously 13-15)
Metallurgical coal8 Mt 19 20 20-22 21-23 21-23
Thermal coal9 Mt 30 29 28-30 29-31 29-31
(Previously 29-31)
Nickel Kt 45 44 42-4410 42-4410 ~45
1. On a 100% basis except for the Gahcho Kué joint venture, which is on an attributable 51% basis. Production is subject to trading conditions. Reduction in 2019 volumes due to declining open pit
production at Venetia and Victor end-of-mine-life.
2. Copper business unit only. On a contained-metal basis.
3. Increase in 2018 reflects expected temporary grade increase.
4. Produced ounces. Includes production from joint operations, associates and third-parties.
5. Decline from 2018 due to Rustenburg POC, which will be processed based on a tolling arrangement from 1 January 2019 and therefore is excluded from production guidance.
6. Dry basis. Decrease from prior guidance reflects rail constraints.
7. Wet basis. Current guidance assumes production resuming in Q4 2018, after remediation of pipeline leaks.
8. Excludes the sale of Foxleigh which completed in August 2016. Excludes thermal coal production.
9. Export South Africa and Colombia production.
10. Reduction from prior guidance due to additional plant maintenance requirements. 42UNIT COST PERFORMANCE BY BUSINESS UNIT
De Beers (US$/ct)1 Copper (C1 USc/lb) PGMs (US$/Pt oz)2 Kumba (FOB US$/t)3
6% -3% +10% +15%
63 67EARNINGS SENSITIVITIES – H1 2018
Impact of 10% change
Sensitivity Analysis – H1 20181
in price / FX
Commodity / Currency 30 June spot Average realised EBITDA ($m)
Copper(c/lb) 301 297 2092
Platinum ($/oz) 851 932 62
Palladium ($/oz) 953 1,005 51
Rhodium ($/oz) 2,250 1,938 12
Iron Ore ($/t) 64 69 152
Hard Coking Coal ($/t) 199 198 129
Thermal Coal (SA) ($/t) 104 88 75
Nickel(c/lb) 676 632 193
Oil price 79 71 27
South African rand 13.73 12.30 264
Australian dollar 1.35 1.30 91
Brazilian real 3.86 3.43 41
Chilean peso 650 612 36
1. Reflects change on actual results for H1 2018.
2. Includes copper from both the Copper business and PGMs Business Unit.
3. Includes nickel from both the Nickel business and PGMs Business Unit. 44DE BEERS – STRONG PRODUCTION PERFORMANCE
Average Realised Underlying EBITDA Sales
Production1 Unit cost2 Capex3
price index price EBITDA margin (Cons.)
H1 2018 17.5Mct 123 $162/ct $67/ct $712m 22% $156m 17.8Mct4
vs. H1 2017 #8% #2% #4% #6% $9% $3pp #111% $3%
Underlying EBITDA ($m)
786 16 (6) 776
(20) (5)
(30)
(29) 712
H1 2017 Price (incl FX Inflation Cost Volume Other H1 2018
sales mix)
1. Shown on a 100% basis except for the Gahcho Kué joint venture, which is on an attributable 51% basis.
2. De Beers unit costs are based on consolidated production and operating costs, excluding depreciation and special items, divided by carats recovered.
3. Stated net of capitalised operating cash flows.
4. Sales of 18.8Mct on a 100% basis (6% decrease).
45COPPER – STRONG OPERATIONAL PERFORMANCE WITH
SUPPORT FROM PRICE
Underlying EBITDA
Production Realised price C1 unit cost Capex Sales
EBITDA margin¹
H1 2018 313kt 297c/lb 142c/lb $966m 52% $368m 306kt
vs. H1 2017 #10% #13% $4% #65% #12pp #64% #18%
Underlying EBITDA ($m)
(17)
94
(22) 865 24
(19)
320
966
586
H1 2017 Price FX Inflation Cost Volume Other H1 2018
1. Excludes impact of third-party sales.
46PGMS – 85% IMPROVEMENT TO EBITDA
Realised Underlying EBITDA
Production1 Unit cost2,3 Capex Pt sales5 Headcount
Basket price2 EBITDA margin4
H1 2018 1,233 koz $2,318/oz $1,591/oz $511m 30% $216m 1,117 koz 23,100
vs. H1 2017 #4% #26% #5% #85% #11pp #71% - $19%
Underlying EBITDA ($m)
511
(110) 11
44
269 (41) 394 62
276
H1 2017 Price FX Inflation Cost Volume Other H1 2018
1. Total platinum production is on a metal in concentrate basis.
2. Metrics stated per platinum ounce.
3. Unit cost is on a produced metal in concentrate basis.
4. Excludes the impact of purchase of concentrate and the sale of refined metal purchased from third-parties.
5. Excludes trading volumes of 66koz
47KUMBA IRON ORE – PRODUCTION INCREASED BY 3%
Realised price Unit cost Gross cash Underlying EBITDA
Production Capex
(FOB)1 (FOB) margin ($/t) EBITDA margin
H1 2018 22.4Mt $69/t $35/t $34/t $574m 36% $138m
vs. H1 2017 #3% $3% #9% $13% $18% $7pp #70%
Underlying EBITDA ($m)
700
(60)
(48) 556 574
(36) 24 (2) (4)
H1 2017 Price FX Inflation Cost Volume Other H1 2018
1. Break-even price of $46/t in H1 2018 (H1 2017: $40/t) (62% CFR dry basis).
48MINAS-RIO OPERATIONS SUSPENDED FOLLOWING PIPELINE
LEAKS
Realised price Unit cost Gross cash Underlying EBITDA
Production Capex1 Sales
(FOB) (FOB) margin ($/t) EBITDA margin
H1 2018 3.2 Mt (wet) $70/wmt nm nm $(74)m nm $15m 3.2Mt
vs. H1
$64% #6% nm nm nm nm nm $63%
2017
Underlying EBITDA ($m)
291 26
3 (2)
253 37
(372)
(19)
(74)
H1 2017 Price FX Inflation Cost Volume Other H1 2018
1. Stated net of capitalised operating cash inflows. 49METALLURGICAL COAL – STRONG OPERATIONAL
PERFORMANCE
Metallurgical Underlying
FOB realised price2 Unit cost3 EBITDA margin Capex
production1 EBITDA
H1 2018 10.8Mt $194/t $66/t $1,157m 55% $219m
vs. H1 2017 #17% #1% #3% #23% #2pp #42%
Underlying EBITDA ($m)
22 (15)
84
1,157
110
12 (13) 956
943 14
H1 2017 Price FX Inflation Cost Volume Jellinbah Other H1 2018
1. Excludes thermal coal.
2. Realised Australian metallurgical export. Includes HCC and PCI, excludes thermal coal.
3. FOB unit cost excluding royalties and study costs.
50THERMAL COAL – SA AND COLOMBIA – HIGHER PRICES
DRIVE EBITDA
Underlying
Export prod. FOB price1 Unit cost2 EBITDA margin3
EBITDA SA Capex
SA / Col SA / Col SA / Col SA / Col
SA / Col
H1 2018 8.8Mt / 5.2Mt $88/t / $79/t $48/t / $35/t $341m / $190m 36% / 46% $87m
vs. H1 2017 $9% / 0% #22% / #11% #17% / #13% #21% / #4% #3pp/ $1pp #30%
Underlying EBITDA ($m)
(5)
(29)
549
119 (55)
37
531
464
H1 2017 Price FX Inflation Cost & Volume Cerrejón / other H1 2018
1. Realised South Africa and Colombia thermal export.
2. FOB unit cost excluding royalties. SA unit cost is for the trade operations.
3. SA excludes impact of third-party sales and Eskom-tied operations.
51NICKEL – STRONGER PRICES BOOST EBITDA
Realised C1 unit Underlying EBITDA
Production1 Capex Sales1
price cost2 EBITDA margin
H1 2018 19.4kt 632c/lb 378c/lb $88m 31% $15m 20.1kt
vs. H1 2017 $8% #43% #4% #487% #24pp #114% $3%
Underlying EBITDA ($m)
(5) 101
8
(1) (1)
(11)
83
15
88
H1 2017 Price FX Inflation Cost Volume Other H1 2018
1. Nickel BU only.
2. Codemin and Barro Alto.
52DE BEERS: THE WORLD’S LEADING DIAMOND BUSINESS
Best-in-class business Consumer focused product Lightbox
EBITDA mining margin1 Global demand
Rest of world
~55% India
USA
Gulf
China
Trading business delivering Diversified customer base2
stable margins
Other gifts Bridal
Clarity for consumers
~8% Female
Love gifts
Different market
Technology driven
self-purchases
1. Margin excluding trading and other non-mining activities 53
2. Source: The Diamond Insight Report on 2016 data published in 2017. Based on total jewellery spend
in the top 4 markets of the USA, China, Japan and India.ASSET FOCUSED PGM STRATEGY
The world’s leading PGM business European diesel only ~20% of platinum demand1
$2,887/oz European light duty autocats
1. Mogalakwena Other
~20%
Base metals Industrial & other
~30%
52% Palladium
Platinum Other autocats
H1 2018 margin ~20%
Basket price
Jewellery
~30%
2. Amandelbult The ICE/hybrid market is set to grow2
Targeting 25% further cost reductions
~115m units
~105m units
94m units 10-20%
5-10%
1%
3. Processing 99% 90-95% 80-90%
Delivering a stable ~10% margin 2017 2025F 2030F
ICE/hybrid Battery EV
1. Source: Johnson Matthey.
2. 2017: LMC automotive. 2025 and 2030 reflect Anglo American view. 54ANGLO AMERICAN POSITIONED WELL FOR STRUCTURAL
CHANGES IN THE STEEL INDUSTRY
H1 2018 average Fe content (%) – peer comparison Focus on premium products
66.7
Kumba production
64.1 64.5
60.8 60.7 64.5%Fe
of which two thirds is lump
57.7
Peer 1 Peer 2 Peer 3 Peer 4 Kumba Minas-Rio
Minas-Rio production
Widening iron ore quality spreads 66.7%Fe
US$/t
Pellet feed products
P65/P62 Premium P58/P62 Discount
30
20 Metallurgical coal production
10
0 90%
-10 is HCC
-20
Jul- 16 Jan- 17 Jul- 17 Jan- 18 Jul- 18
55MINAS-RIO UPDATE
525km pipeline
✓
• Clean up work complete
✓
• Pipeline scan underway
✓
• Constructive engagement with authorities ongoing
• 4km pipeline section to be replaced as a precaution
• Re-start expected late 2018
• FY 2018 expected EBITDA: negative $300m - $400m
56DEBT MATURITY PROFILE AT 30 JUNE 2018
Debt repayments ($bn) at 30 June 2018
1.9
1.4 1.4
1.2 1.1
0.8
0.7 0.7
0.5
0.5
H2 2018 2019 2020 2021 2022 2023 2024 2025 2026 2027 2028
Euro Bonds US$ Bonds Other Bonds Subsidiary Financing
% of portfolio 55% 33% 8% 4%
Capital markets 96% Bank 4%
US bonds
Euro bonds
Other bonds (e.g. AUD, ZAR)
Subsidiary financing
57QUELLAVECO Copper - Quellaveco
SOUTH PERU – AN ESTABLISHED MINING REGION

        Located in mining-friendly South Peru, 34 kms from the city of Moquegua

                                                                      Fastest growing copper
                                                                      producing region in Peru

                                                                      Hosts many of the world’s
                                                                      foremost mining companies

                                                                      Established infrastructure

                                                                      Skilled workforce

                                                                      Investor friendly framework

                                                                      Investment grade rating

                                                                                                    59
OVERVIEW
Plant Conventional concentrator plant: two production lines, each with one
Titire Weir SAG and one ball mill.
(water source, Initial throughput of 127.5ktpd, with potential to increase in early years.
>4,500m elevation) Plans for low capital intensity expansion to 150ktpd, post ramp-up.
Vizcachas Dam Water Water for construction and operations to be sourced from local rivers.
All water permits secured for construction phase.
Infrastructure Advanced progress of detailed engineering works, including
transportation tunnel, water dam, power infrastructure, process plant
and port.
Access roads, river diversion and camp infrastructure in advanced
~95km pipeline
stages of construction.
Concentrate will be transported by truck to existing port near Ilo
(165km from site).
Ship-loading and storage facilities to be built at existing port.
Power to be supplied from national grid via new substations under long
term power purchase contracts.
Mine
(3,500m elevation)
Tailings Dam
60
Ilo (location of port, 165km from site)HIGH QUALITY CONCENTRATE
Quality of concentrate offers marketing advantages Arsenic content benchmarking
6,000
• High grade copper concentrate with low impurities 5,500
Import limit
5,000
• Clean concentrate with exceptionally low arsenic levels into China
4,500
Arsenic content (parts per million)
• Low levels for other impurities 4,000
3,500
• Attractive feedstock for Chinese smelters 3,000
2,500
• Blending opportunities with lower quality concentrates 2,000
1,500
1,000
500
0
Quellaveco Industry Peru average
average
61FINANCIAL MODELLING
Ownership Anglo American 60%, Mitsubishi 40%, once syndication complete
Accounting treatment Fully consolidated with a 40% minority interest.
Shareholder loans from minority shareholder to be consolidated in Anglo American Group
net debt.
Project capex (nominal) $5.0-5.3 billion (100% basis - Anglo American share 60%, Mitsubishi share 40%).
Construction time / first productionOUTLOOK FOR COPPER DEMAND REMAINS ROBUST
44
Industrial
33
36
Transport
✓
– Electric Vehicles and associated
charging infrastructure
30
31
Consumer &
✓
– Build out of renewable energy
generating capacity and distributed
power, e.g, in China
Other1
✓
– Increased power generation capacity
and construction in emerging markets,
e.g., India, SE Asia
Electrical
✓
– Potential for further demand in medical
/ new applications, e.g., anti-bacterial
surfaces
Construction
2017 2020 2025 2030 2040
1. Includes consumer appliances, cookware, coinage
Source: Wood Mackenzie
63SUPPLY OUTLOOK FOR COPPER APPEARS CONSTRAINED
Copper primary supply1
✓
– Resource degradation and long
development time for possible new
supply
Primary demand2
✓
– Most probable projects unlikely to be
sufficient longer term
Possible
Supply
✓
– Few additional scale
projects/endowments to add significant
volumes above replacing depletion
Probable – Potential for increased copper scrap
Supply supply
Base Case
Supply
2017 2020 2025 2030 2040
1. Excluding Direct use and re-smelted scrap;
2. Net demand remaining after demand met by direct use and re-smelted scrap
64
Source: Wood MackenziePURPOSE AND SUSTAINABILITY FRAMEWORK
PURPOSE

 Anglo American’s Purpose is to:

       Re-imagine mining                                to improve people’s lives

      What mining could be and how we envisage         A Purpose is about more than just the work
      mining in the future. How we think differently   we do and the profits we make, it’s about the
      and innovatively about mining and our entire     impact we have on everything we touch.
      value chain.

                                                                                                       66
TRUSTED CORPORATE LEADER
Accountability
Vision: To transform the
relationship between mines,
communities and wider society.
Policy Advocacy
Vision: To take a lead on issues that affect
our business in a way that is collaborative
and aimed at society’s wider goals.
Ethical Value Chains
Vision: To be a part of a value chain that
supports and reinforces positive human
rights and sustainability outcomes.
67THRIVING COMMUNITIES
Livelihoods
Vision: Shared, sustainable
prosperity in our host communities.
Education
Vision: For all children in host
communities to have access to
excellent education and training.
Health and well-being
Vision: For the SDG targets for
health to be achieved in all our
host communities.
68HEALTHY ENVIRONMENT
Climate change
Vision: To operate carbon-neutral
mines.
Biodiversity
Vision. To deliver net positive impact (NPI)
across Anglo American through
implementing the mitigation hierarchy and
investment in biodiversity stewardship.
Water
Vision. To operate waterless mines in
water scarce regions.
69CHOOSING TO DO THE RIGHT THING
We are committed to six values which guide how we conduct ourselves
We are creating an organisation where all people are treated in such a way that they bring the best of
who they are to work. Our values and the way in which we, as individuals, are expected to behave are
the foundation of our Code of Conduct.
The Code is split into four areas:
• Safety, health and environment
• Care and respect
• Business integrity
• Physical assets and information
Our values underpin our Code of Conduct:
70CLIMATE CHANGE AND ENERGY
Greenhouse Gas (GHG) emission and savings Energy consumption and savings
Million tonnes CO2e % saved Million GJ % saved
7
20 100
15 6
18 80
60 5
10 16
14 40 4
5
12 20 3
0 10 0 2
2013 2014 2015 2016 2017 2013 2014 2015 2016 2017
GHG emissions (LHS) % saved against BAU (RHS)(1) Energy consumption (LHS) % saved against BAU (RHS)(1)
Targets Targets
2020: 22% reduction relative to BAU projection 2020: 8% reduction relative to BAU projection
2030: 30% reduction in net GHG emissions2 2030: 30% improvement in energy efficiency2
1. Against business-as-usual (BAU) projections.
2. Against a 2016 baseline.
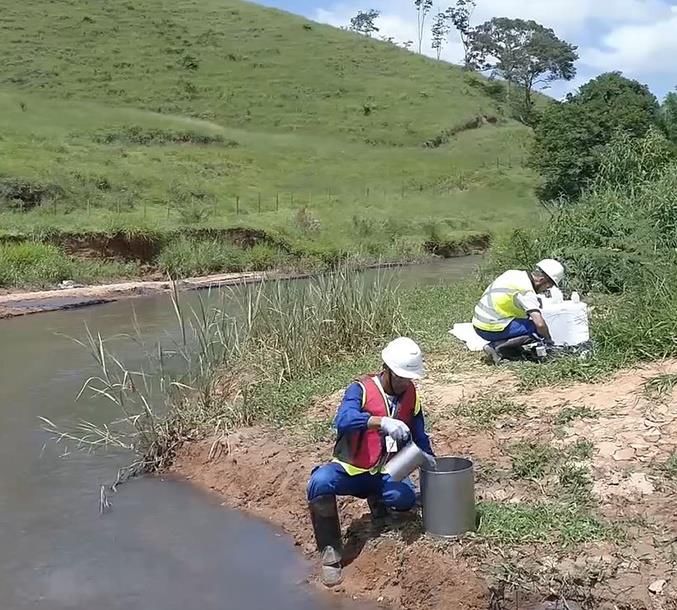
71WATER AND ENVIRONMENT
Water usage Environmental incidents
Number of major incidents2
50% of operations in water stressed areas, and 75% located in
high water-risk regions. 30
25
Vision to operate waterless mines in water scarce regions. This to 20
primarily done through: 15
10
• Rapid dewatering of fines
5
• Dry tailings via coarse particle floatation 0
• Evaporation control 2013 2014 2015 2016 2017 H1 2018
• Improvements in planning and operating discipline
Targets Targets
2020: 20% reduction in freshwater abstraction1 Move beyond compliance and towards best practice.
and 75% recycled / reused water
2030: 50% reduction in freshwater abstraction1
1. Against business-as-usual (BAU) projections.
2. Reflects level 3-5 incidents. Environmental incidents are classified in terms of a 5-level severity rating. Incidents with medium, high and major impacts, as defined by standard internal
definitions, are reported as level 3-5 incidents.
72THERMAL COAL
• Thermal coal will remain a material part of the global energy mix until at least 2040. Fossil fuels will be increasingly contested by
society and, as a result, the role of thermal coal will decline, however not right now.
• Thermal coal makes up 37% of the global electricity mix1. It provides an affordable, readily available and reliable form of power
generation that many countries, particularly in the developing world, continue to depend on to alleviate poverty and promote growth.
• Today, there is a role for responsible and efficient coal mining.
• We have reduced our thermal coal production by 50% since 2012, primarily through selling our Eskom-tied domestic coal mines in
South Africa. In H1 2018, 12% of the Group’s revenue was derived from the sale of thermal coal. This is impacted by prices being
above long term consensus levels.
• Simply selling all our thermal coal assets would not alleviate the issue that coal is required and would still be taken out of the ground,
potentially by someone who is not so committed to communities, our values or our standards.
• We will invest in our thermal coal operations to maintain their favourable cost position and these mines will come to the end of their
mine life by 2040 (the existing thermal coal portfolio has an average life4 of ~13 years). Anglo American will support a responsible
transition away from thermal coal – both for broader society and to support our employees and local communities.
• Carbon Capture and Storage (CCS) – 40% of emissions from thermal coal power generation could be reduced if, globally, coal power
plants were upgraded to maximum efficiency levels. We’ve been playing a constructive role by investing in CCS technology and policy
development.
Production2 (Mt) Capex ($m)3 ROCE (%)3
82 80 79 266 65%
74 74
217 54%
152 41%
38 104 30%
93 90 87 23% 19%
19
2012 2013 2014 2015 2016 2017 H1 2012 2013 2014 2015 2016 2017 H1 2013 2014 2015 2016 2017 H1 2018
2018 2018
1. Source: International Energy Agency.
2. 2017 adjusted to remove Eskom-tied mines which were announced for sale in 2017. 73
3. Capex and ROCE relates only to fully consolidated entities.
4. Weighted average asset life based on copper equivalent production.INNOVATION AND TECHNOLOGY
CONCENTRATE THE MINE™
     Precisely targeting the metal and mineral with less waste, water and energy

CHALLENGE
Precision mining with minimal
energy, water and capital intensity

APPROACH
Concentrate the mine™ concept:
1. Coarse particle recovery
2. Bulk Sorting                                                                    COARSE PARTICLE
3. Grade Engineering ™                                                             RECOVERY
4. Precision Classification

VALUE
Across most commodities:
1. >30% reduction in
    OPEX/CAPEX
2. >30% reduction in energy
    intensity
3. >30% reduction in water
    intensity

                                                                                                     75
THE WATERLESS MINE
Dry processing without the need for tailings dams
CHALLENGE
Around 75% of our current portfolio
is located in high-water-risk regions
APPROACH
Coarse particle recovery
• Pilot complete at Los Bronces,
next unit at El Soldado
• Applicability in PGMs
Dry tailings disposal focus is on a
dual polymer system POLYMER SYSTEM
• Pilot plant at Debswana planned
• Accelerated testing at other sites
VALUE
>$1.5 bn: Reducing water intensity
& removing expansion constraints
76THE INTELLIGENT MINE
A smart, connected, learning mine
CHALLENGE
Predict and shape operational outcomes
APPROACH
• Predictive maintenance using digital
twins
• Increased use of AI in exploration and
geosciences
• Pervasive fibre-optic sensors – real time
insights into the process and facilitation
of APC
VALUE
• Increased equipment utilisation
• Improved ore characterisation and
processing benefits
• >$75-150M /yr from advance process
control delivering a 0.5-1% recovery
improvement
77MODERN MINE
Continuous, hard rock mining for safer, more economic mines
Underground testing at our platinum mines 1 2
1. The Rapid Mine Development System
(RMDS) Safely excavates low-profile tunnels
with rapid access to ore
2. Continuous Haulage System (CHS) A remote
controlled system to transfer bulk material from
the RMDS to the fixed conveyors
3. MN220 Reef Miner
Remote controlled disc cutting machine designed 3 4
for mining narrow reefs of hard rock
4. Slot Borer
Platinum reef drilling system for drilling narrow
vein hard rock ore body of just 1-1.5m
VALUE
Continuous, hard rock mining for
safer, more economic underground
mines
78MODERN MINE
Continuous, hard rock mining for safer, more economic mines
CHALLENGE
Predict and shape operational outcomes
APPROACH
• Modernise – Electro-hydraulic drills, gel
explosives, no scraper-winches
• Mechanise – Remote operated ultra-low-
profile equipment
• Continuous cutting – Hard rock cutting
machines
• Swarm robotics – Small self-organising
intelligent machines
VALUE
• Safer and more efficient working
environment
• Transition pathway in existing operations
79INVESTOR RELATIONS Paul Galloway paul.galloway@angloamerican.com Tel: +44 (0)20 7968 8718 Robert Greenberg robert.greenberg@angloamerican.com Tel: +44 (0)20 7968 2124
You can also read