The Impact of Collective Forestland Tenure Reform on the Forest Economic Efficiency of Farmers in Zhejiang Province - MDPI
←
→
Page content transcription
If your browser does not render page correctly, please read the page content below
sustainability

Article
The Impact of Collective Forestland Tenure Reform
on the Forest Economic Efficiency of Farmers in
Zhejiang Province
Lin Liu 1 and Honggang Sun 2, *
 1    Economic and Management School, China Jiliang University, Hangzhou 310018, China; jhliulin@126.com
 2    Research Institute of Subtropical Forestry, Chinese Academy of Forestry, Hangzhou 311400, China
 *    Correspondence: honggangsun@caf.ac.cn

 Received: 18 March 2019; Accepted: 11 April 2019; Published: 16 April 2019

 Abstract: The impact of collective forestland tenure reform on farmers’ economic efficiency in the
 collective forest areas was assessed. Both technical efficiency and scale efficiency of farmer households
 were calculated using the output-oriented bootstrapped data envelopment analysis (DEA) approach
 along with a household efficiency model that incorporates the survey data from 243 farmer households.
 The DEA results show that a substantial economic inefficiency for farmers exists, which renders
 a high prospect of improving economic efficiency. The findings from the empirical regression of
 the data also show that the collective forestland tenure reform is quite beneficial for the farmer
 households, particularly for those with distinguished commercial forest types. The tenure reform has
 a very influential impact on the efficiency of the farmers managing timber forests and bamboo forests,
 and so do the policies of reform for forestland circulation, forest-cutting quotas, forestland loan,
 and technical training. However, the cooperation arrangement currently is still not strong enough to
 influence economic efficiency. Based on the regression findings, together with the survey, a number
 of policy suggestions are put forward to the policy makers for improving economic efficiencies for
 international communities in the process of forestland tenure devolution.

 Keywords: collective forestland; data envelopment analysis; efficiency; household management

1. Introduction
     The property rights of forestlands are a modern global discussed topic in forest policy today,
especially for developing countries, such as China, Vietnam, Bolivia, Brazil, Peru, etc. [1–3]. These
countries have implemented forestland tenure reform through decentralization and devolution,
redistributing the forestland away from state forest management and ownership to local farmer
households [4]. Some studies have found empirical evidence that tenure reform facilitated investment
in planting trees, such as in Ghana [5] and Ethiopia [6]. While, other studies have found that tenure
reforms have not led to their intended consequence of sustainable resource management, such as in
Indonesia, Russia, and elsewhere, as noted by Karen A. Sullivan et al. [7]. In this paper, the performance
of forests production under new management in China was observed. The understanding of which
policies of tenure reform could enhance economic efficiency is of crucial importance to guide decisions
about decentralized governance. Though in different locations the devolution is implemented in
different forms, China’s experience of 40 years will provide implications for international communities
in the process of forestland tenure devolution.
     Collective ownership was a kind of property right form of forestlands. This type of ownership
was established in the 1950s and later became the main form of ownership in the southern forest
areas of China. According to this property right form, the forestland is owned by village/township

Sustainability 2019, 11, 2272; doi:10.3390/su11082272                         www.mdpi.com/journal/sustainability
Sustainability 2019, 11, 2272 2 of 15
collective economic organizations [8]. After about 30 years of practice, the shortcomings of this
property right arrangement became obvious. Therefore, the government of China started to improve
the management of forests through a series of reforms. The first collective forestland tenure reform
was introduced in China in the early 1980s and intended to enhance the performance of the forestry
economy [9]. This reform allocated the forestland to individual households in the collective forest
areas. The reform established a forest management responsibility system by clarifying and confirming
the ownership of forests and barren hills [6]. Although this early reform provided the rural households
some freedom in managing their collective forestlands, it has led to excessive timber harvesting and
extensive forest destructions after the timber trade was liberated in southern China in 1985 [10,11].
Therefore, in 1987, the government placed a forest-cutting quota system to tighten the regulations
of the management of forestlands. Following the country-wide market oriented economic reform
of China in 1990s, the market control mechanism was brought in to the forestland reform, which
enabled farmer households and private economic entities to acquire long-term usage rights for fairly
large areas of forestlands at very low prices [12–14]. However, the marketization of forestlands at that
time did not realize more investment in forestry and did not bring higher economic efficiency to the
farmers, due to the heavy tax and difficulties in obtaining harvest permits [10,13,15]. Consequently,
the following reform, which started in 2003 and is usually called the new round of reform, aimed to
increase farmers’ forest management incentives by increasing forestland tenure security, reducing tax,
relaxing restrictions on timber harvest, strengthening public support to the farmers in the southern
collective forest areas, and promoting the development of stump age and land usage rights trade
markets [16]. What are the likely impacts of the new round of reforms on farmers’ production activities?
Will the policies of the new round of reform affect the decision-making of farmers’ inputs and outputs
on their forestlands so as to affect their economic efficiencies? The answers to these questions are
important, as they will have significant implications not only on the welfare of the farmers but also on
sustainable forestry development.
Hence, numerous studies on collective forestland tenure reform have been carried out. A large
amount of work is focused on the background, current situation, and existing problems of institutional
arrangement and policy recommendations [17–20]. Only a relatively small amount of work is focused
on the effects of collective forestland tenure reform on forest management activities. Xie et al. [10,21]
investigated farmers’ participation and investment using labor and money input in forest management
as indicators, and they found that rural households’ positive attitudes toward the reforms and
higher income from forest product sales encouraged participation in forest management. However,
parcelization of forestland might limit farmers’ incentives to invest in forest management. Liu et al. [22]
found that the collective forestland tenure reform not only has positive effects on households’ labor
input and production expenditures but also has significant effects on rural households’ rent-in and
rent-out forestland. Though the reform has positive effects, proven by some research [23], Yi et al. [24]
suggest that stronger contracted forestland tenure affected rural households’ investment for forestry
and that farmers tend to invest more on forest plots under the condition that the tenure security is
perceived to be high [25]. Up to now, nearly no attention has been paid to the effect of the reform on
the economic efficiency of farmer households. The analysis of economic efficiency intends to produce
a certain level of output at a lower cost or an optimal level of output from given resources. Therefore,
the measurements of economic efficiency can provide scope for further improvement in performance,
thereby setting up the basis for assessing policy making, as noted by Javad and Brian Hardaker [26].
The objective of this paper is to provide a method for measuring the economic efficiency of farm
households in the collective forest areas and to explain the meaning of efficiency in terms of the
collective forestland tenure reforms to illustrate the reform’s performance.
Most studies, to measure economic efficiency, use the stochastic frontier analysis developed by
Aigner et al. [27] and Meeusen and van den Broeck [28] and are typically based on the assumptions that
farmers strive to maximize their profits with given competitive input and output markets [26]. However,
this assumption is unsatisfactory in measuring the efficiency of farmer households due to the incompleteSustainability 2019, 11, 2272 3 of 15
information about the farmers in forest area. Also, the farmers’ productions always have multi-inputs
and multi-outputs under technical, physical, and socio-economic constraints. In addition, the stochastic
frontier models arbitrarily impose a particular distribution for the farm-specific performance related
error term. There is no economic reasoning or theoretical justification for this assumption [29].
Therefore, non-parametric data envelopment analysis (DEA) is a useful method for measuring the
economic efficiency of farmers, as demonstrated by several studies reported in the literature [20].
In addition, there is a greater part of the study on the efficiency, which ignored the role of policy
arrangement and on the economic effects that were commonly conducted at regional and national
levels without insights into the effects on farmer households, the latter being particularly vulnerable to
policy arrangement [30].
This paper provides several contributions to the research on forest management. First, this study
summarized forest economic efficiency according to commercial forest types, based on survey data of
farmer households, instead using aggerated data of a region as usual. Second, this study provided
empirical evidence on which policies of collective forestland tenure reform affect the efficiency of
farmers significantly through regressing the performance of forest production on variables represented
forest policies. Third, the policy implications of these results and comments will have potentially
broader insight for international communities in the process of forestland tenure devolution.
The remainder of this paper is divided into five sections. The second section documents the process
of the collective forestland tenure reform in Zhejiang province and then describes the relationship
between economic efficiency and the reform. The third section explains the empirical frameworks, then
calculates the forest economic efficiency with a bootstrapped DEA approach and uses the frameworks
to conduct the bootstrapped DEA and truncated regression. The fourth section reviews the sampling
procedure and data. The fifth section displays and describes the empirical results. A final section
summarizes the policy implications of these results and comments on their potentially broader insight
for global forest policy.
2. Process of Collective Forestland Tenure Reform of Zhejiang Province
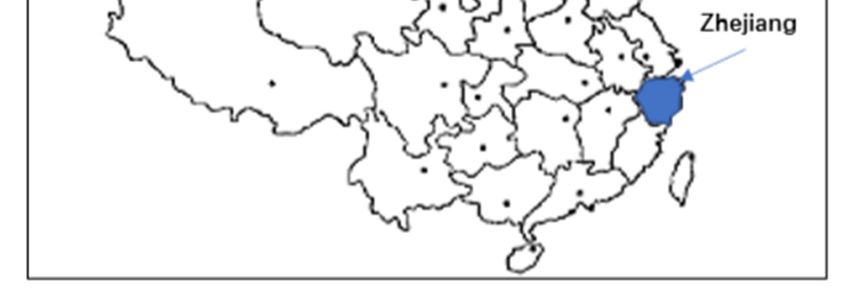
Zhejiang province is a mountainous province, with abundant forest, located in the south-east
of China, as shown in Figure 1. Its designated forestland covers about 6,618,500 hectares, 70% of
its total land area. The forest coverage is around 61% and the total forest reserved volume reaches
3.67 billion m3 . The GDP per capita was 14,907 US dollars in 2018. The total output value of forestry
was 18.16 billion US dollars in 2014, at the forefront of China. The net income of rural residence per
capita was 497.95 US dollars, and the contribution rate of forestry to farmers’ incomes was 22.5% in
2014. Zhejiang province has a long history of forestry development, and forestry production plays an
important role in the local rural development and farmers’ livelihoods. As the pilot areas of the new
round of forest tenure reform, Zhejiang province is an appropriate case to examine the effects of the
new round of forest tenure reform.
From the first round collective forestland tenure reform, which started in early 1980s, to the recent
round, which started in 2003, the collective forestland tenure reform of Zhejiang province follows
the promulgations of (1) “Decision on a number of issues concerning forest protection and forestry
development”; (2) “Instructions on strengthening the resource management of the southern collective
forest section and forbidding deforestation”; and (3) “Decision on the development of forestry”, by the
Central Committee of the Communist Party of China and the State Council. As a result, in 1983, about
5,504,000 ha forestlands, which belonged to the collective villages before they were delegated to the
member households. This accounted for 67% of the total forestland. In 1989, a double–deck operation
system was established; this system is based on individual household management and combines both
centralized and decentralized managements. Although the forest farmers in Zhejiang province did
gain some more control and access to the forest resources, they showed little enthusiasm toward tree
planting and forest management due to a lack of investment and incentive. As a result, the productivity
of the collective forest was only 38% of that of the national forest in 1994–98 and 44% of that in 1999–03.Sustainability 2019, 11, 2272 4 of 15
To improve the farmers’ enthusiasm on forest production, the government of Zhejiang province issued
Sustainability 2018, 10, x FOR PEER REVIEW 4 of 15
a “Notice concerning the extension of contract on forestland” in 2006, which clarifies the property
rights and specifies the new contracts. In 2008, the forestland rights of 5,503,867 ha were renewed,
contract on forestland” in 2006, which clarifies the property rights and specifies the new contracts. In
and 4,539,000 copies of forestland contracts were signed. The government of Zhejiang province further
2008, the forestland rights of 5,503,867 ha were renewed, and 4,539,000 copies of forestland contracts
strengthened public support on forest farmers via credit, insurance, and information. Until the end of
were signed. The government of Zhejiang province further strengthened public support on forest
2011, the accumulative total forest rights mortgage loans had reached 10.19 billion US dollars for the
farmers via credit, insurance, and information. Until the end of 2011, the accumulative total forest
123,300 farmers in the collective forest areas. The total forest fire insurance had covered 3,042,287 ha
rights mortgage loans had reached 10.19 billion US dollars for the 123,300 farmers in the collective
and all tree risk insurance had covered 172,367 ha. 56 counties had constructed information systems
forest areas. The total forest fire insurance had covered 3,042,287 ha and all tree risk insurance had
for forest rights.
covered 172,367 ha. 56 counties had constructed information systems for forest rights.
Figure 1. Location of research area.
Figure 1. Location of research area.
Forestland tenure influences economic behavior by influencing the benefits and costs that tenure
Forestland tenure influences economic behavior by influencing the benefits and costs that tenure
holders face [31]. On the one hand, forestland household management should have more efficiency
holders face [31]. On the one hand, forestland household management should have more efficiency
than the forestland collective management does, because collective management involves infeasible
than the forestland collective management does, because collective management involves infeasible
supervision and measurement and can result in opportunistic behaviors, such as loafing on the job and
supervision and measurement and can result in opportunistic behaviors, such as loafing on the job
free-riding, all of which decrease economic efficiency. The collective forestland tenure reform guarantees
and free-riding, all of which decrease economic efficiency. The collective forestland tenure reform
the rights of the famer households to manage their forestlands by clarifying and certificating the
guarantees the rights of the famer households to manage their forestlands by clarifying and
ownership of forests, and also minimizes the instability of farmer households’ prospective earnings and
certificating the ownership of forests, and also minimizes the instability of farmer households’
increases their enthusiasm on forest operations. Based on these positive aspects, the collective forestland
prospective earnings and increases their enthusiasm on forest operations. Based on these positive
tenure reform should have a positive impact on farmer household efficiency. However, forestland
aspects, the collective forestland tenure reform should have a positive impact on farmer household
household management has difficulty in obtaining market information and also has restrictions on
efficiency. However, forestland household management has difficulty in obtaining market
capital, technology, and scale of operation. These problems can make the farmer households unable to
information and also has restrictions on capital, technology, and scale of operation. These problems
resist market risks. Additionally, the land parcelization derived from pursuing the impartial allocation
can make the farmer households unable to resist market risks. Additionally, the land parcelization
of the collective forestland may reduce the incentive for the land owners and the possibility for them to
derived from pursuing the impartial allocation of the collective forestland may reduce the incentive
conduct intensive management of their forests [32,33]. From these negative aspects, the forestland
for the land owners and the possibility for them to conduct intensive management of their forests
household management may not increase the farmers’ efficiency. Therefore, it is difficult to make
[32,33]. From these negative aspects, the forestland household management may not increase the
policies that definitely enhance the performance of the forestry economy.
farmers’ efficiency. Therefore, it is difficult to make policies that definitely enhance the performance
of the forestry
3. Issues economy.
in Modeling
The in
3. Issues empirical
Modelingframework utilized in this work involves a bootstrapped DEA approach that
calculates farmer households’ economic efficiencies and a bootstrapped truncated regression model for
The empirical
explanatory framework
variables utilizedmodel,
of the efficiency in thiswhich
workincludes
involvesthe
a collective
bootstrapped DEA approach
forestland that
tenure reform
calculates farmer households’
and other indicators. economic efficiencies and a bootstrapped truncated regression model
for explanatory variables of the efficiency model, which includes the collective forestland tenure
reform and other indicators.
3.1. Farmer Household Efficiency: a Bootstrapped DEA Approach
After Debreu and Farrell provided the basic definitions for technical and allocative efficiency in
production, an extensive literature on the measurement of efficiency in production has developed.Sustainability 2019, 11, 2272 5 of 15
3.1. Farmer Household Efficiency: A Bootstrapped DEA Approach
After Debreu and Farrell provided the basic definitions for technical and allocative efficiency in
production, an extensive literature on the measurement of efficiency in production has developed.
One large section of the literature focuses on a linear-programming based measure of efficiency along
the lines of Charnes and Färe who rely on convexity assumptions known as Data Envelopment Analysis
(DEA). To describe this more clearly, let us consider an example of i farmer households which produce
y units of rth outputs using x units of kth inputs. The DEA efficiency can be measured by solving
a linear programming methodology to construct a non-parametric frontier over the data, and this
frontier can then be used as basis to calculate the efficiency of different farmer households on their
forest production.
The economic efficiency of a farmer household can be separated into two components: technical
efficiency (TE) and allocative efficiency (AE). TE refers to the ability of a farmer household to maximize
the outputs from a given set of inputs, while the AE refers to the ability of a farmer household to
optimally allocate the use of inputs given certain technical level. AE cannot be computed because of
lacking of the price information on each input. In addition, as the production factors of forestland and
labor are invariable in the short term, farmer households normally pay more attention to TE. The TE
score estimated from the output-oriented DEA frontiers can be obtained by solving K linear programs
for each farmer household, following either a constant return to scale (CRS) or variable returns to scale
(VRS) assumption. Thus, TE scores can be calculated by solving the following linear equations:
Maximize φi
Subject to
243
ϕi yri − λi yri ≤ 0 r = 1 · · · 4outputs
P
j=1
243
λi xki
P
xki − ≥ 0 k = 1 · · · 5inputs
j=1 (1)
243
λi = 1
P
j=1
λ j ≥ 0 j = 1 · · · · · · 243 f armers
where φi is the proportional increase in possible outputs and λi , is the weight variable used to derive all
possible linear combinations of sample observations. The output-based TE for the ith farmer household
can be computed by TEi = 1/φi . This study also pays close attention to the optimal scale of household
management. The scale efficiency (SE) indicates the amount of efficiency increase that can be gained by
exploiting the scale economies [34], which can be calculated by rationing technical efficiencies under
CRS and VRS assumptions.
The DEA estimators offer numerous advantages, the most obvious one being that one need not
specify a functional relationship between the production inputs and outputs. However, the DEA
ignores statistical issues such as inference, hypothesis testing, etc. Fortunately, the statistical properties
of the DEA estimators have been established by Simar and Wilson [35,36], whose wonderful process
has been applied by a number of researchers in many fields [37]. Another important advantage of
using the DEA for farmer households’ data is that by virtue of the collective forestland tenure reform
being exogenous at the farmer household level, the DEA approach sidesteps endogeneity issues that
may be manifest at the regional and national levels of analysis. This study closely follows Simar
and Wilson’s methodology for estimating efficiency measures in each bootstrap replication. For the
readers who are interested in the details, this study refers to the work by Simar and Wilson [35,36] for
a theoretical model of bootstrapped DEA methodology, and the work by Assaf [38] for applying a
bootstrapped DEA approach.Sustainability 2019, 11, 2272 6 of 15
3.2. Effects of the Collective Forestland Tenure Reform: A Bootstrapped Truncated Regression Approach
The aim of this work is to account for the impact of collective forestland tenure reform on the
economic efficiency (EEi ) of the farmer households. Thus, this study assume that the economic efficiency
scores (TEi or SEi ) can be regressed with the vector of variables Xi that affect a farmer’s efficiency,
the vector of estimated parameters βi , and some statistical noise εi , presented in the following equation
EEi = βi Xi + εi . (2)
For estimation of Equation (2), this study strictly follows the procedure proposed by Simar and
Wilson [39] using the bootstrapped truncated regression. The truncated regression is used to model
dependent variables for which some of the observations are not included in the analysis because of the
value of the dependent variable. In this work, there is a sample of farmers whose economic efficiencies
are at or below the efficiency score of 1. A major concern in this work is the farmers whose efficiencies
are below a score of 1, so the upper part of the economic efficiency distribution would be truncated.
In other words, the truncation only allows part of the distribution of the outcome variables to be used.
A more informative and coherent presentation of the bootstrapped truncated regression can be found
in the work by Barros and Peypoch [40].
Results in the following Table 3 show the best model describing the effects of the collective
forestland tenure reform on the examined farmer households’ technical and scale efficiencies. This
study follows two criteria to identify the best model. One is a meaningful set of explanatory variables
among the available variables, including the policies of the collective forest tenure reform and farmer
household characteristics, such as age, location, and education. The estimated economic efficiencies are
also related to the specific commercial forest types, which are denoted by dummy variables. The other
is a model with the best econometric properties among the alternative models.
All computations were done using statistical software R supplemented by the package FEAR 1.15
(Frontier Efficiency Analysis with R).
4. Sampling, Data, and Definition of Variables
4.1. Survey Instruments and Data
A stratified random sampling survey conducted in Zhejiang Province in July and August 2014
provided the data for this study. The first step in conducting the survey involves creating sampling
frames at a county-level. With the knowledge of the production environment in Zhejiang province
for each forest area, there are nine major forest prefectures that are fairly typical of the study sites
from 58 counties. The nine prefectures are Lin An, Chun An, Kai Hua, An Ji, Long Quan, Sui Chang,
Jing Ning, Qing Yuan, and Song Yang County, where forestry incomes account for more than 50%
of total household incomes. After the sample prefectures were chosen, all 159 towns from the nine
prefectures were divided into three group: high-production region, medium-production region,
and low-production region. On this basis, six towns were randomly selected from each of the
above three groups. In total, there were 18 sample towns. After the sample towns were selected,
a relatively similar stratified random process was used to select the villages. As the production
activities varied among the commercial forest types, timber forests, bamboo forests and economic
forests were distinguished. Then, we created three sampling frames for the village-level timber
production, village-level bamboo production, and village-level economic forest production. Thus,
a cluster of three villages was purposively selected in each sample town based on the recommendations
from one or two well-informed experts who work in local forest sections and are familiar with local
forest production. However, there are a few exceptions. For some towns, there were no or nearly
no villages that plant economic forests, such as Long Gong town of Qing Yuan county, and nearly
no villages that plant bamboo, such as the Wang Cunkou town of Sui Chang county, and nearly no
villages that plant timber forests, such as Di Pu town of An Ji county. In these cases, one more villageSustainability 2019, 11, 2272 7 of 15
from those towns were selected to fill the deficiency. Ultimately, 54 villages in total were chosen as the
village samples. Finally, the households were selected from these sample villages. Five households
were randomly selected from each village and 270 farmers were interviewed to collect resource and
production data.
Because forest management and investment are long-term tasks, the data collected here covers
a 5 year average instead of a particular year. The long production cycle of a timber forest implies
that a 5 year dataset will be incomplete, so information related to the entire production process was
collected—that is, from planting to cutting. Then, the economic efficiency for different commercial
forest types can be calculated. In addition, note that 22 farm households had no labor or fertilizer inputs
and outputs during the year of survey, while five farmers had contracted large areas of forestland for
production. These extreme data affect the results, especially for the DEA study, which is very sensitive
to frontiers and extremes; therefore, 27 farm households are excluded from this analysis.
In order to minimize the data errors that may come from farmers’ untruthfulness, the survey gained
great help from local officers who were very familiar with the production and earnings of the farmers
and conducted the survey together with us. The survey involved the collection of information related
to each household’s forest production activities. These included inputs and outputs of the forestland,
such as the number of persons who work in the family, the time they worked on the forestland,
the area of cultivated forestland, and the yield of the different commercial forest types. In addition,
extensive information on other aspects of their livelihoods were collected, such as household income
and family composition.
4.2. Variables Definition
For the DEA calculation, the farm households are assumed to produce certain outputs (yr ):
(1) timber, (2) bamboo, and (3) economic forest products. For the timber produced by forests,
the outputs are measured in volume (m3 ), sidestepping the influence of price change. The outputs of
the bamboo forest are bamboo wood and shoots, which are measured by weight (ton). Because the
economic forest products include various fruits, tea plants, and Chinese chestnuts, the outputs are
measured in monetary value (thousand US dollar). Household use inputs (xk ) included (1) family and
(2) hired labor, measured by the total number of days the family members and temporary workers
spent working on the forestland, respectively; (3) the cost of forest-tending supplies, such as the
purchase of saplings and pesticides (thousand US dollar); (4) the costs of fertilizers, used in the input
of bamboo and economic forests; none of the sample farmers used fertilizers in their timber forest;
(5) area of cultivated forestland (ha); (6) forest-harvest costs for timber (per thousand US dollar) and
(7) stand age of timber forests (year). Stand age as one of the inputs added in the DEA to calculate the
efficiency of the timber forest, one reason being its long production cycle and the other being to satisfy
comparability of the sampling for differently aged stands when on the stump in the sample. Table 1
illustrates the descriptive statistics of the variables in the samples used in DEA.
Table 1. Descriptive statistics of the variables in the samples used in data envelopment analysis (DEA).
Timber Forest Bamboo Forest Economic Forest
Variables of Inputs and Outputs
Mean Std. dev. Mean Std. dev. Mean Std. dev.
Output:
Timber production (m3 ) 59.107 23.219 - - - -
Bamboo wood production (ton) - - 5.578 3.283 - -
Bamboo roots production (ton) - - 1.472 0.953 - -
Economic forest production (thousand US dollar) - - - - 3.782 2.009
Input:
Number of days family member work at forestland (days) 71.638 29.325 27.296 2.6 59.001 13.442
Hired labor (days) 36.188 11.063 2.481 0.195 25.297 10.018
Forest tending cost, saplings and pesticides (thousand US dollar) 8.852 1.501 0.129 0.015 0.210 0.078
Fertilizers used (ton) - - 0.491 0.023 0.618 0.181
Cultivated forestland (ha) 2.376 4.972 1.229 5.944 0.838 3.938
Forest cutting costs for timber forest (thousand US dollar) 0.859 0.431 - - - -
Age of stand for timber forest (year) 23.833 6.007 - - - -Sustainability 2019, 11, 2272 8 of 15
This study measures some materials and outputs in quantities rather than in monetary values
because farm-gate prices were unavailable. Values as quantities imply that the prices of the materials
and the outputs are the same at all farm household locations. In fact, the increased distance of a farm
household to the nearest main market was positively correlated to higher production costs. Therefore,
the absence of price data may create bias in the efficiencies of farmers located in isolated and remote
areas who are usually small farm holders, as noted by Maria and Rigoberto [41]. In the present work,
this study includes distance to the nearest main markets (km) as a variable in the efficiency effects
model to partially account for the potential bias created by this problem.
The reform of collective forestland tenure is a multidimensional concept for which there are no
absolute measures. The previous studies on the reform of collective forestland tenure used allowable
harvest quota, tenure type [25] and difficulty in obtaining loan [10] as measures. This study uses several
variables, including the numbers of obtained quotas, the sum of the loan, whether or not to join the
cooperatives, forestland circulation area, and amount of technical training (see Table 2) following the
policy arrangement laid out by the new round of reforms in Zhejiang Province. Note that, at present,
the cooperative forest management system has been mainly applied to bamboo production and sales,
as well as to some economic forest products, such as tea. The forest-cutting quota, set by the State
Forestry Administration for every province every 5 years, is from the national inventory. The quotas
are allocated in a downstream pattern from counties to towns, and then to villages. Some of the studies
also tried to explain the observed technical efficiency in terms of a number of farmers’ characteristics,
such as education and experience, accessibility to credit, and cultivation size [42,43].
Table 2. Definitions and descriptive statistics of the variables in the samples used in regression analysis.
Definition Mean Std. dev.
Collective forestland tenure reform:
Quota the numbers of obtained quotas 0.969 1.103
Loan the sum of loan 1.030 1.489
Cooperation whether or not to join the cooperatives 0.182 0.464
forestland circulation forestland circulation area 0.939 1.058
Technical training amount of technical training 0.622 0.916
Commercial forest types:
Dummy for timber forest (DT) 1 if has timber harvest, 0 otherwise 0.417 0.495
Dummy for bamboo forest (DB) 1 if has bamboo harvest, 0 otherwise 0.346 0.477
Dummy for economic forest (DE) 1 if has economic forest harvest, 0 otherwise 0.237 0.427
Household:
Age Age of head of household (years) 53.400 9.370
Education Household head education (years) 7.110 2.590
Gender 1 if female household head, 0 otherwise 0.142 0.350
Distance to market Distance to nearest main market (km) 7.797 6.838
Quality of forestland 1 if forestland quality is bad, 2 is common and 3 is good 2.267 0.750
Forestry income ratio Proportion of income from forestry to total income 0.291 0.289
5. Results
5.1. Farmer Household Efficiency
Table 3 shows the summary statistics of efficiency scores for the 243 farmer households and the
breakdowns by timber forests, bamboo forests, and economic forests. Both constant returns to scale
(CRS) and variable returns to scale (VRS) models were used to estimate scale efficiency (SE) scores.
The bias corrected value, the lower bound (LB), and the upper bound (UB) of the CRS and VRS are
depicted, and the average scores of these statistics are illustrated.Sustainability 2019, 11, 2272 9 of 15
Table 3. Bootstrapped efficiency results. VRS, variable returns to scale; CRS, constant return to scale.
LB, lower bound; UB, upper bound.
VRS CRS Scale
Efficiency
Bias Bias
Scores LB UB Scores LB UB Scores
Corrected Corrected
Timber forest 0.902 0.814 0.695 0.898 0.644 0.485 0.383 0.629 0.686
Std. dev. 0.139 0.111 0.082 0.138 0.350 0.251 0.194 0.342 0.334
Bamboo forest 0.653 0.508 0.423 0.636 0.518 0.374 0.315 0.495 0.789
Std. dev. 0.279 0.201 0.163 0.271 0.293 0.195 0.164 0.279 0.217
Economic forest 0.826 0.722 0.622 0.813 0.699 0.605 0.525 0.691 0.859
Std. dev. 0.164 0.125 0.098 0.161 0.178 0.134 0.111 0.175 0.173
Total average 0.774 0.657 0.762 0.558 0.607 0.473 0.590 0.395 0.781
Std. dev. 0.240 0.206 0.237 0.173 0.293 0.219 0.285 0.182 0.253
From the results in Table 3, it is obvious that the SE scores are, by total average, greater than the
corresponding TE scores. The average TE score under VRS is 0.774 and the average score under CRS
is 0.607. The average SE score is 0.781. It is evident that there is significant room for improvement,
especially for the bamboo forest production, which exhibits the lowest technical efficiency, and for
the timber forest production, which exhibits the lowest scale efficiency. This study also obtained
bias-corrected VRS and CRS scores following the bootstrap procedure and confidence interval for each
sample household. All the bias-corrected scores are less than the original scores, which comprises the
negative estimated bias. The results also show that all the original scores of VRS and CRS lie outside
the estimated confidence interval, while the bootstrapped estimates lie inside. At the same time, the SE
score distribution exhibits a higher variance (see also Figure 2). The smaller variance of the TE scores
compared to the corresponding distribution of the SE scores may be an indication of the inadequate
Sustainability 2018, 10, x FOR PEER REVIEW 10 of 15
determination of optimal size for the farmer households.
0.45
0.4
VRS
0.35 Bias-corrected VRS
0.3 CRS
Bias-corrected CRS
Frequency
0.25
SCALE
0.2
0.15
0.1
0.05
0
1 0.9-1 0.8-0.9 0.7-0.8 0.6-0.7 0.5-0.6 0.4-0.5 0.3-0.4 0.2-0.3 0.1-0.2 0-0.1
Efficiency scores
Figure 2. Distribution of efficiency scores. CRS, constant return to scale; VRS, variable returns to scale.
Figure 2. Distribution of efficiency scores. CRS, constant return to scale; VRS, variable returns to scale.
To get a rough idea of how efficiencies differ across different commercial forest types, the mean
bias-corrected
It is also VRS
clearand
thatCRS
thereareiscompared. It is found
a wide dispersion in that under
Figure the VRS
2. Under theassumption, the households
VRS assumption, over 16%
managing timber forests are the most efficient, the households managing bamboo
sample households, and under the CRS assumption, over 38% sample households are less than forests are the least
50%
efficient, and the households managing economic forests are in between; under the CRS
of the fully efficient households, and for 2.3% sample households, even less than 10%. Figure 2 also assumption,
the households
plots managingVRS
the bias-corrected economic
and CRS forests areshowing
scores, the mostthat
efficient, thethe
none of households managingappear
sample households bambooto
forests are the least efficient,
be close to the frontier. and the households managing timber forests are in between.
5.2. Effects of the Collective Forestland Tenure Reform
The estimation results of the truncated regression model presented in Equation (2) are shown in
Table 4. Table 4 also includes the value of each estimated coefficient and the Z-statistic. In the stage
of efficiency measure, TE and SE for three different commercial forest types are calculated separately.Sustainability 2019, 11, 2272 10 of 15
Figure 2 gives the frequency distribution of the TE and SE scores and their bias-corrected values
under VRS and CRS. It must be noted that under the VRS assumption, more than 40% of the examined
farmer households are fully technically efficient, whereas the corresponding ratio of the SE drops down
to 26%. The farmer households, which are technically efficient under both VRS and CRS assumptions,
are also scale efficient; there are also 3.1% farmer households whose operations are scale efficient but
technically inefficient. Although both TE and SE reflect the outcome of decisions affecting households’
productive performance, TE refers to the outcome of an endogenous decision-making process, while
SE refers to the outcome of an exogenous decision-making process. Apparently, the information
asymmetries of the inner and outer decision-making process arise in the case of the distribution of TE
and SE scores.
It is also clear that there is a wide dispersion in Figure 2. Under the VRS assumption, over 16%
sample households, and under the CRS assumption, over 38% sample households are less than 50% of
the fully efficient households, and for 2.3% sample households, even less than 10%. Figure 2 also plots
the bias-corrected VRS and CRS scores, showing that none of the sample households appear to be close
to the frontier.
5.2. Effects of the Collective Forestland Tenure Reform
The estimation results of the truncated regression model presented in Equation (2) are shown in
Table 4. Table 4 also includes the value of each estimated coefficient and the Z-statistic. In the stage of
efficiency measure, TE and SE for three different commercial forest types are calculated separately.
In the regression analysis, two dummy variables rather than three are set in the model and composed
interaction terms with reform variables to avoid perfect collinearity.
Table 4. Truncated regression results.
Technical Efficiency Scale Efficiency
Explanatory Variables
β Z β Z β Z β Z
Constant 0.506 3.355 *** 0.619 5.179 *** 0.547 2.752 *** 0.587 3.293 ***
Quota 0.064 0.875 0.022 1.087 0.012 0.716 0.057 1.899 *
Loan 0.046 3.727 *** 0.084 2.788 ** 0.035 1.6484 * 0.091 2.002 *
cooperation 0.027 0.683 0.057 0.831 0.018 0.344 0.017 0.194
circulation −0.021 −1.090 −0.010 −0.447 0.031 1.216 −0.037 −1.088
Technical training 0.013 1.189 0.014 1.960 * 0.005 0.195 −0.007 −0.323
DT 0.041 0.579 −0.237 −2.225 **
DB −0.187 −3.493 ** −0.190 −2.378 **
Quota × DT −0.006 −0.232 0.101 2.313 **
Loan × DT 0.083 2.476 ** 0.152 2.999 ***
Loan × DB 0.062 1.843 * 0.029 0.601
Circulation × DT 0.019 0.498 0.093 1.682 *
Circulation × DB −0.037 −1.003 0.111 1.861 *
Cooperation × DB 0.005 0.071 0.015 0.136
Cooperation × DE 0.027 0.306 0.078 0.579
Techtraining × DT 0.012 0.260 0.005 0.064
Techtraining × DB 0.060 1.808 * 0.033 0.645
Age 0.003 1.211 0.003 1.596 0.003 0.948 0.002 0.776
Education 0.006 0.999 0.001 0.154 0.005 0.626 0.011 1.406
Gender 0.014 0.273 0.033 0.772 0.007 0.107 −0.005 −0.078
Distance to market −0.007 −2.584 *** −0.004 −1.916 * −0.002 −0.609 −0.002 −0.620
Quality of forestland 0.005 1.079 0.005 1.617 * 0.0261 0.699 0.064 1.861 *
Forestry income ratio 0.051 0.829 0.063 1.642 * 0.032 0.394 0.051 1.652 *
Log likelihood 35.281 47.296 34.197 48.829
Notes: significant at * p < 0.10, ** p < 0.05, *** p < 0.001 % levels.
When the reform variables are entered as single effect on all farmers, that is, they do not have
interactions with other variables. The results show clearly that except for the variable loan, the variables
of forestland tenure reform are statistically insignificant. Note that when the commercial forest type
dummies are included, the coefficients of variables and their statistical properties change significantly.Sustainability 2019, 11, 2272 11 of 15
Although the variables for the reform are still statistically insignificant, most of their interactions
with dummy variables are significant. And other indicators such as quality of forestland and forestry
income ratio are significant too, while some household characters, such as age of household head,
household head education, and gender of household head, are not. The interactive effects show three
statistically significant effects of the reform on TE: loans for timber forests, loans for bamboo forests,
and technical training for bamboo production. The interactive effects show four statistically significant
effects of the reform on SE: quotas for timber forests, loans for timber forests, circulation for timber
forests and circulation for bamboo forests. Thus, overall the effect of tenure reform is to increase the
efficiency of farmer households in the collective forest area of Zhejiang province, as fewer resources
have to be utilized to achieve a given level of output mix.
It is also found that the positive effect (constant + coefficient of the dummy for timber or dummy
for bamboo) of the tenure reform affects the efficiency of the farmer households managing timber forests
and bamboo forests, rather than that of the households managing economic forests (we experimented
many times to select two out of the three dummies to run the regression model and found that the
dummies for economic forests were never significant). This result suggests that not many changes
occurred in economic forest management during the reform process.
The forest-cutting quota shows a positive impact on the SE of the farmers, demonstrating that
a less strict forest-cutting quota can lead to a higher scale efficiency on timber forests. The result
suggests that the forest-cutting quota regulation, implemented to prevent deforestation, is disincentive
to economic efficiency.
The variable loan has a positive and significant impact. For timber forests, the estimated coefficient
is 0.167 (0.084 + 0.083) for the TE model and 0.243 (0.091 + 0.152) for the SE model. For bamboo forests,
the estimated coefficient is 0.146 (0.084 + 0.062) for the TE model but insignificant for the SE model.
The farmer households who finance through loans have strong operating aspirations. They are more
likely to achieve higher outputs through operation carefully. Thus, a strong link exists between farmers’
economic efficiencies and their loans.
The circulation of forestland has a positive and significant impact on the SE for both the timber
forest and the bamboo forest. As mentioned above, allocating the collective forestland to the member
households brought about the problem of fragmentation, and thus a small scale of forestland production.
From this study, it was found that the circulation of forestland increased returns to scale.
The variable of cooperation is statistically insignificant in both the TE model and the SE model.
Thus, a weak link is shown between farmers’ economic efficiencies and cooperation. Technical training,
which endogenously determines productive performance, has a positive impact on the farmers’
technical efficiency. On the contrary, such policy arrangements, which are exogenous to the farmers
themselves, are not in a position to improve any deficiencies of SE.
In terms of the economic efficiency truncated regression, three out of six explanatory variables
describing household characteristics are statistically significant at a 10% significance level. The control
variables, quality of forestland, and forestry income ratio are positive and significant in both the TE
and SE models, suggesting that the farmers with a higher quality of land and higher ratio of forestry
income have a higher level of economic efficiency than the farmers not possessing those attributes.
The coefficient of distance to the nearest markets (−0.004) is negative and significant in the TE model,
partially accounting for the potential biases of the problem of unavailability of farm-gate prices for all
individual activities.
6. Discussion
The regression results in this study show that there are not many changes that occur in economic
forest management during the reform process. One possible explanation is that the products of
economic forests, such as fruits, tea, Chinese chestnuts, pecans and torreyas, need to be harvested when
the fruits are ripened, and the sell-by-date of these kinds of products is too short to be kept until rises in
price. For example, the sell-by-date of waxberry is only three days, and the farmers are anxious to sellSustainability 2019, 11, 2272 12 of 15
the products before the fruits become rotten, regardless of the current price. Even for the farmers who
plant tea trees, the quality period is shorter than one year. On the other hand, the farmers who manage
the timber forests and bamboo forests can deal with their products when they see the price fit. Thus,
the farmer households managing economic forests are more resistant to the market risk. The weak
link between these efforts and returns might discourage the farmers to continue to manage their
forestland. Although the government of Zhejiang province encourages farmers to manage forestland
with joint-household contracts to avoid market risks, this venture is still being tested. In addition,
it must to be noted that some of the economic forest operations are organized by the local or upper
levels of government. Farmers plant certain plants following government instructions for subsidies,
such as tea-oil tree and Chinese torreyas, regardless of economic performance. From these results, this
study can conclude that, at present, the tenure reform is still not in a position to allow improvement in
efficiency for the farmer households managing economic forests.
The forest-cutting quota is a two-told problem in China and has been roundly criticized [16,34].
This study does not consider the regulation of a forest-cutting quota to be good because forests have
ultimately not been destroyed in many countries privatizing forest. The forest-cutting quota has
a positive impact on the SE of the farmers, as shown by the regression results, consistent with the
observation of the survey. Some farmers complain that no forest-cutting quota exists for them when
their forest is mature, and also that the forest production cannot reach its maximum level without
moderate cutting. Is a forest-cutting quota a suitable policy for the farmers who own forest rights?
From the view of property rights, a complete property right should include the right of disposition,
which can make the farmers feel secure in terms of the tenure rights. This, as a result, can provide
more confidence to the farmers for forest production.
There exists a strong link between a farmer’s economic efficiency and loans. The main financing
channel at present is the forestry property mortgage, which is supplied by the government. According
to the survey, the number of farmer households obtaining loans is only 26% of the sample, and most
of them have huge areas of forestland or large capitals. This fact may crowd the small-scale farmers
out of the market. Therefore, the governments should distinguish different types of farmers and
adopt corresponding patterns of loans. In addition, current loans are short-term. As for small-scale
farmers, the loan period is only one year. The majority of famers want to obtain medium and long-term
loans. According to the demand of farmers, other financial instruments should be proposed, such as
joint-funded mortgage loans, small-value discount mortgages, guaranteed institutional mortgages and
cooperative economic organizations, large-scale businesses, or corporate forestry mortgages.
The results show that the circulation of forestland realizes increased returns to scale. Therefore,
Forestland circulation should be encouraged through the forestland tenure reform. Because parcelization
might result in too little forestland to be allocated to the individuals, which could leave potential economies
of scale unexploited [44]. At the same time, given the existing small broken forestland in Zhejiang
province, the prospect of scale production is limited. In this regard, the policy makers need to
understand that an increase in SE is relatively cost effective, and, therefore, the government policies
should be directed toward this.
The variable of cooperation is statistically insignificant in both the TE model and the SE model.
The mode of cooperation is organized mostly by local private enterprises, and the property rights in
many cases are not yet well established or clearly defined. The survey data show that some cooperation
is formed without foundation, through which private enterprises gain financial support from the
local government. The policy makers should place effort and resources on technical training, since
technology shortages reduce marginal products of the forestland. In addition, an overexploitation
of the labor input is found. To this point, a shortage of labor for forest production exists in Zhejiang
province. According to the survey, most of the young farmers in the forest areas move out of the
farm. The expenditure for hiring labor is the biggest production cost. This implies that a labor-saving
technology is needed and that the government should place emphasis on cultivating and developing
the forestry labor market to avoid labor shortages and operating cost increases.Sustainability 2019, 11, 2272 13 of 15
7. Conclusions and Implications
A cross section data set, for the year 2014, was used to estimate the technical and scale efficiencies
for farmers in the collective forest area of Zhejiang province. Subsequently, the maximum likelihood
estimates from a bootstrapped truncated regression examine the influence of a set of policy variables
on the two distinct faces of the economic efficiency of farmer households. The DEA results verify
that there is substantial economic inefficiency for farmers and there is a high prospect for improving
economic efficiency. The regression results demonstrate that the collective forestland tenure reform
is quite beneficial to the efficiency of the farmers in the collective forest area of Zhejiang province.
Therefore, it is possible for the households to improve their economic efficiency by using the best
technology and overcoming production constraints through policies such as tenure reform. One of the
most important lessons that follow from the discussion in this work is that commercial forest types
need to be taken into consideration more carefully. The findings obtained from the empirical regression
also show that tenure reform has a very influential effect on the efficiency of the farmers managing
timber forest and bamboo forests.
The discussion on the fitted regressions shows that not all variables appear significant in all regressions.
However, the regression findings have a number of policy implications for improving efficiency:
(1) The findings suggest that it is important to consider different commercial forest types and
operational characteristics in the collective forest areas for setting-up policies aimed at increasing
farmer household productivity, especially for the farmers managing timber and bamboo forests. Based
on some positive coefficients of reform variables in both the TE and SE regressions, the government
should extend forestland reform by decreasing the market risks and increasing farmer income to
stimulate the farmers in the collective forest areas to operate forestry.
(2) Forestland circulation should be encouraged through forestland tenure reform.
(3) A labor-saving technology is needed, and the government should place emphasis on cultivating
and developing a forestry labor market to avoid a labor shortage and operating cost increase.
(4) The forest-cutting quota depends on tenure security, so the government should ensure the
policy of forestland reform sustained.
(5) The governments should attempt to formulate a loan period on the basis of forestry production
of timber forests, bamboo forests and economic forests to meet diversified capital needs. The limitation
of this study is that the production cycle from tree planting to wood cutting is almost 10–20 years,
and the influences from nature and social-economic changes also have an impact on the farmers’
economic efficiencies. Thus, further research should use a panel data set covering a long time period,
which will permits one to track how economic efficiency evolves over the years.
Author Contributions: H.S. Conceptualization, L.L. and H.S.; Data curation, L.L.; Funding acquisition, H.S.;
Methodology, L.L.; Writing, original draft, L.L.; Writing, review & editing, H.S.
Funding: This research was funded by the National Key Technologies R&D Program of China during the Thirteen
Five-Year Period, grant number 2016 YFD 0600302-2 and the natural Science Foundation of Zhejiang Province,
grant number LQ14G030022.
Acknowledgments: We thank Yunhai Xie of Zhejiang Forestry Department, Ping Lin and Yingchun Li of institute of
subtropical forestry research of Chinese Academy of Forestry, Dunyi Dong of An Ji Forestry Bureau, Nianjin Wang
of Chun An Forestry Bureau, Shuangfeng Fu of Song Yang Forestry Bureau. Weiyang Qiao of Kai Hua forest farm.
Hongmin Zhou and Xinliang Ji of Long Quan Forestry Bureau. Xiuhua Wang of Qing Yuan Forestry Bureau and
Yang Liu and Zheng of Nanjing Forestry University for their help on our survey.
Conflicts of Interest: The authors declare no conflict of interest.
References
1. Larson, A.; Brockhaus, M.; Sunderlin, W.D.; Duchelle, A.; Babon, A.; Dokken, T.; Pham, T.; Resosudarmo, I.A.P.;
Selaya, G.; Awono, A.; et al. Land Tenure and REDD+: The Good, the Bad and the Ugly. Glob. Environ. Chang.
2013, 23, 678–689. [CrossRef]Sustainability 2019, 11, 2272 14 of 15
2. Robinson, B.E.; Holland, M.B.; Naughton-Treves, L. Does Secure Land Tenure Save Forests? A Meta-analysis
of the Relationship between Land Tenure and Tropical Deforestation. Glob. Environ. Chang. 2014, 29, 281–293.
[CrossRef]
3. Gebara, M.F. Tenure reforms in indigenous lands: Decentralized forest management or illegalism? Curr. Opin.
Environ. Sustain. 2018, 32, 60–67. [CrossRef]
4. Besley, T. Property Rights and Investment Incentives: Theory and Evidence from Ghana. J. Political Econ.
1995, 103, 903–937. [CrossRef]
5. Holden, S.T.; Deininger, K.; Ghebru, H. Impacts of Low-Cost Land Certification on Investment and
Productivity. Am. J. Agric. Econ. 2009, 91, 359–373. [CrossRef]
6. Sullivan, K.A.; Uchida, E.; Sproul, T.W.; Xu, J. Prospect Theory and Tenure Reform: Impacts on Forest
Management. Land Econ. 2018, 94, 405–424. [CrossRef]
7. Forest and Agriculture Organization (FAO). Tenure of Indigenous Peoples’ Territories and REDD+ as a Forestry
Management Incentive: The Case of Mesoamerican Countries; FAO: Geneva, Switzerland, 2012. Available online:
http://www.fao.org/3/a-i2875e.pdf (accessed on 11 October 2012).
8. Hyde, W.F.; Yin, R. 40 Years of China’s forest reforms: Summary and outlook. For. Policy Econ. 2019, 98,
90–95. [CrossRef]
9. Hyde, W.F. The experience of China’s forest reforms: What they mean for China and what they suggest for
the world. For. Policy Econ. 2019, 98, 1–7. [CrossRef]
10. Xie, Y.; Gong, P.C.; Han, X.; Wen, Y.L. The Effect of Collective Forestland Tenure Reform in China: Does Land
Parcelization Reduce Forest Management Intensity? J. Econ. 2014, 20, 126–140. [CrossRef]
11. Démurger, S.; Hou, Y.; Yang, W. Forest Management Policies and Resource Balance in China: An Assessment
of the Current Situation. J. Environ. Dev. 2009, 18, 17–41. [CrossRef]
12. Zhang, D.; Owiredu, E. Land Tenure, Market and the Establishment of Forest Plantation in Ghana. Policy Econ.
2007, 9, 602–610. [CrossRef]
13. Yin, R.; Yao, S.; Huo, X. China’s Forest Tenure Reform and Institutional Change in the New Century: What
has been Implemented and What Remains to be Pursued. Land Use Policy 2013, 30, 825–833. [CrossRef]
14. Weyerhaeuser, H.; Kahrl, F.; Su, Y. Ensuring a Future for Collective Forestry in China’s Southwest: Adding
Human and Social Capital to Policy Reforms. Policy Econ. 2006, 8, 375–385. [CrossRef]
15. Lu, W.; Landell-Mills, N.; Liu, J.; Xu, J.; Liu, C. Getting the Private Sector to Work for the Public Good-instruments
for Sustainable Private Sector Forestry in China; International Institute for Environment and Development:
London, UK, 2002; pp. 34–46.
16. Wang, G.; Innes, J.L.; Lei, J.; Dai, S.; Wu, S.W. China’s Forestry Reforms. Science 2007, 318, 1556–1557.
[CrossRef]
17. Zhang, H.; Xu, J. Collective forest tenure reform: Assessment of motivation, characteristics and performance.
Sci. Silvae Sin. 2009, 45, 119–126. (In Chinese)
18. Myers, R.H. How did the modern Chinese economy develop? J. Asian Stud. 1991, 50, 604–628. [CrossRef]
19. Lin, J.Y. The household responsibility system in China’s agricultural reform: A theoretical and empirical
study. Econ. Dev. Cult. Chang. 1988, 36, 353–372. [CrossRef]
20. Ray, S.C.; Ghose, A. Production Efficiency in Indian Agriculture: An Assessment of the Post Green Revolution
Years. Omega 2014, 44, 58–69. [CrossRef]
21. Xie, Y.; Wen, Y.; Zhang, Y.; Li, X. Impact of Property Rights Reform on Household Forest Management
Investment: An Empirical Study of Southern China. For. Policy Econ. 2013, 34, 73–78. [CrossRef]
22. Liu, C.; Hao, L.; Sen, W. Has China’s New Round of Collective Forest Reforms Caused an Increase in the Use
of Productive Forest Inputs? Land Use Policy 2017, 64, 492–510. [CrossRef]
23. Wang, X.; Xie, Y.; Wang, L.; Wen, Y. Factors Affecting Farmers’ Forest Management Behaviors in the Reform
of Collective Forest Property Right System: Cases in Shaowu City and Youxi County of Fujian Province.
Sci. Silvae Sin. 2013, 6, 135–142. (In Chinese)
24. Yi, Y.; KÖhlin, G.; Xu, J. Property Rights, Tenure Security and Forest Investment Incentive: Evidence from
China’s Collective Forest Tenure Reform. Environ. Dev. Econ. 2013, 19, 48–73. [CrossRef]
25. Qin, P.; Xu, J.T. Forest Land Rights, Tenure Types, and Farmers’ Investment Incentives in China: An Empirical
Study of Fujian province. China Agric. Econ. Rev. 2013, 5, 154–170. [CrossRef]
26. Javad, T.; Brian, H.J. A study of Economic Efficiency of Iranian Farmers in Ramjerd District: An Application
of Stochastic Programming. Agric. Econ. 1996, 14, 73–83.You can also read