Assessing Fiscal Costs and the Distribution of Pensions in Transitions to FDC and NDC Systems: A Retrospective Analysis for Chile - UAI
←
→
Page content transcription
If your browser does not render page correctly, please read the page content below

Assessing Fiscal Costs and the Distribution of Pensions in Transitions
        to FDC and NDC Systems: A Retrospective Analysis for Chile

                           Eduardo Fajnzylber and David A.Robalino1

                                               December 2010

Countries assessing structural pension reforms to address problems of financial sustainability and
improve economic incentives face the choice between moving to a financial defined contribution (FDC)
system, or to a notional defined contribution (NDC) system (or one of its variants). Unfortunately,
comparisons regarding the performance of the two systems in terms of the pensions provided and
transition costs are normally based on prospective actuarial estimations. In this paper, we follow a
retrospective approach by simulating what would have happened in Chile if instead of the original FDC
system introduced in 1981, the country would have implemented an NDC scheme. We find that
transition costs under an FDC system can be considerably higher than under an NDC. In the case of Chile,
other things being equal, introducing an NDC system would have generated fiscal savings during the first
45 years after the reform equivalent to 50% of initial GDP. The cost of the minimum pension guarantee
would have been higher under an NDC system that pays the growth rate of the covered wage bill. This is
because during the first twenty years after the reform the rate of return on financial assets was higher
than the growth rate of wages. Our analysis suggests, however, that this does not have to be always the
case. Depending on the assumptions regarding the stochastic process driving the dynamics of the rate
of return paid by the FDC system, expected replacement rates under the NDC are not necessarily lower.

JEL: J65, J68.

Keywords: Pensions, Fiscal Impacts, Notional Defined Contributions

1
 Eduardo Fajnzylber is Assistant Professor, School of Government, Universidad Adolfo Ibáñez, Chile. The article
was prepared while Mr. Fajnzylber was Head of the Research Department at the Chilean Pension Supervising
Authority. David Robalino is Lead Economist in the Human Development Department of the World Bank and Co-
Director of the Employment and Development Program at IZA.
Citation: Fajnzylber, E. and D. Robalino. 2010. “Assessing Fiscal Costs and the Distribution of Pensions in
Transitions to FDC and NDC Systems: A Retrospective Analysis for Chile.” Washington DC: World Bank.

                                                      1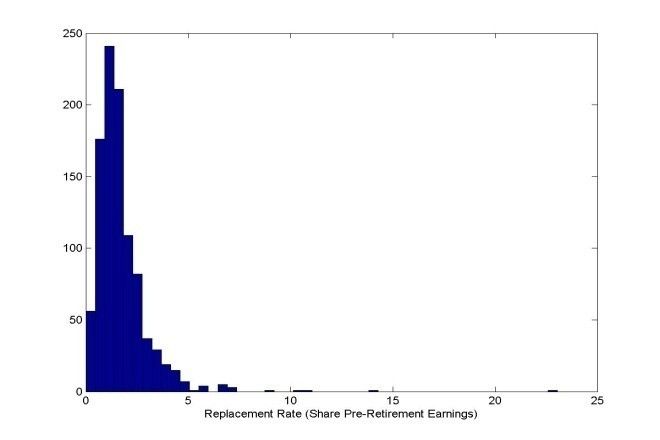
Introduction

        During the last decade, Notional Defined Contribution (NDC) systems have been introduced as a
promising alternative to address the problems related to financial insolvency, non-transparent
redistribution and weak incentives that pervade traditional defined benefit (DB) pay-as-you-go (PAYG)
pension systems. NDCs remain financed on a PAYG basis but the benefit formula is modified to establish
a transparent and actuarially fair link between contributions and benefits. If well designed, the system
can be solvent at all times and will not accumulate unfunded liabilities that are common in DB schemes.
Thus, the main difference between NDC and Financial Defined Contribution (FDC) systems is that, in the
latter, the contributions from active workers are invested in financial instruments while in the former,
contributions are used to pay for current pensions. As a result, in an FDC system contributions earn the
rate of return on investments in financial assets, while in the “pure” NDC system the rate of return is
equal to the growth rate of the PAYG asset – the present value of future contributions net of the value
of pension rights accruing from those contributions (see Robalino and Bodor 2006)2. Because the growth
rate of the PAYG asset is not readily observable, several proxies are used in practice.

        One of the benefits of an NDC scheme is that it can facilitate the financing of the implicit
pension debt of the “old” system and thus reduce the need for increasing taxes or reducing
expenditures over the short-term. This is because the system remains PAYG and therefore new
contributions can be used to finance current pensions (see Holzmann and Palmer 2006). In a transition
to a FDC scheme, new contributions go to the financial market while the system needs to keep paying
pensions to retirees from the previous system and acknowledging past contributions of workers who
switched to the new one. These two effects could generate a significant short term fiscal pressure,
known as a transition cost.3 In addition In essence, the government can continue to borrow
contributions to finance the liabilities of the old system through the PAYG assets. What remains to be
financed under an NDC reform are the inherited commitments above the old contribution rate and the
reform-induced uncovered commitments due to the move to a lower contribution rate (Holzmann and
Jousten, Chapter 18, this volume). On the down side, in a dynamically efficient economy, the growth
rate of the PAYG asset (or proxies) is expected to be below the rate of return on financial assets. The

2
  For a discussion of “contribution asset” versus “pay-as-you-go asset” versus “hidden asset” – the differences and
under what condition they coincide, see Baoda-Penas and Vidal-Maelia, chapter 23 in this volume, and Vidal-
Maelia and Baoda-Penas (2010).
3
  This transition cost appears to the extent that contributions are redirected from the PAYG to the FDC scheme. If
the FDC scheme is introduced on top of the previous one (without changing the contribution rate to the DB scheme),
there is no transition cost associated.

                                                         2
empirical evidence on the issue is mixed (see Holzmann and Hinz, 2005) but it could be that an NDC
system, on average, pays a lower pension relative to the FDC system for the same contribution rate
(presumably with less risk). This could involve higher fiscal costs as the expected value of minimum
pension guarantees for the government increases. Understanding these tradeoffs between lower short-
term and long-term transition costs is thus fundamental to guide policy choices regarding the
implementation of one system over another or, more likely, the level of diversification of savings among
the two.
To our knowledge, however, the fiscal tradeoffs involved in the implementation of FDCs and
NDC systems have not undergone a rigorous assessment. The studies that exist (see for instance, World
Bank 2004; World Bank 2006; World Bank forthcoming) are normally based on prospective actuarial
estimations, which usually involve making non-trivial assumptions about the evolution of the most
relevant parameters: GDP and wage growth, interest rates, coverage and contribution densities. At the
same time, not enough attention has been given to the question of whether the rate of return of FDCs is
consistently above the rate of return of NDCs and the tradeoffs in terms of pension risk.4
This paper sheds lights on these two questions. To address the limitation of prospective studies,
we follow a retrospective approach by simulating what would have happened in Chile between 1981
and 2026, if instead of the FDC reform introduced in 1981, an NDC scheme would have been
implemented. We use actual contribution histories from individuals who switched to the reformed
system to compare the relative performance of the FDC and NDC schemes in terms of fiscal costs and
the distribution of pensions and replacement rates, at the aggregate and individual level. Clearly, this
approach is subject to the criticism that general equilibrium effects of an alternative reform are not
taken into account. If an NDC had been introduced in 1981 individuals incentives and therefore labor
supply and savings decisions may have been different. The accumulation of capital into individual
accounts certainly had important macro-economic effects as well (see Holzmann, 1997, Klaus Schmidt-
Hebbel, 2000). As a result, the dynamics of all prices (including interest rates and wages) may have been
different. That stated, our paper is not attempting to estimate the welfare impact of an alternative
reform. Our more modest goal is to inform policymakers about (i) the order of magnitude of the
4
Dimson et al (2002) report that, for the period 1900-2000, the average real return on equity for 16 developed
countries was 5.1%, whereas Maddison (2003) suggest that the equivalent growth rate of real GDP per capita was
2%. Risk considerations are taken into account in Dutta et al (2000), Matsen and Thøgersen (2004), De Menil et al
(2006), which tend to suggest that the optimal combination of funded and unfunded systems is not on either of the
two extremes. Knell (2008) incorporates the effect of preferences for relative consumption (with respect to a
reference group), giving further support for including an unfunded component in the optimal pension mix.
3potential fiscal savings from lower transition costs under NDCs; (ii) the difference in the level of pensions
and replacement rates under both reforms and the potential extra costs related to the provision of
minimum pension guarantees; and (iii) the level of plan members’ exposure to risks under the two
systems. 5
The paper is organized in five sections. The next section briefly describes the main features of the 1981
Chilean reform and explains the assumptions made regarding the implementation of the hypothetical
NDC system. It is followed by a description of the data and methods used to compare fiscal costs and the
distribution of pensions both at the aggregate and individual level (Section 3). The main results from the
analysis are discussed in Section 4 and Section 5 concludes.
I. The Original FDC Reform and the Hypothetical NDC Reform
In 1980, the Chilean government introduced a major reform to the pension systems, replacing
the traditional PAYG arrangements by a unique national scheme, based on individual accounts, market
capitalization and private management.6 The main motivation was to address problems of
fragmentation and fiscal sustainability (see Annex 1).
Under the new system, all civilian dependent workers were required to contribute 10 percent of their
covered income to the Pension Fund Administrator (PFA) of their choice, which charged an additional
administration fee and an insurance premium for the Disability and Survivorship Insurance (DSI). 7 PFAs
are private firms created for the sole purpose of administering the benefits set by law, which include
collecting contributions, managing individual accounts, investing the funds accumulated, taking out a
DSI insurance policy, providing customer service and paying old-age, disability or survivorship benefits
under a programmed withdrawal schedule or transferring the accumulated resources to a life insurance
5
In this article, we are concentrating on the risk originated in the variability of the rates of returns and how this
affect the pension risk, which is captured by the variance of the distribution of replacement rates under both systems
(and a series of alternative combinations of both). There are other sources of risk, which are not modeled here, some
of which affect both schemes in a similar way (like economic risks, which affect the likelihood of making
contributions) and some of which have differential impacts on both systems: under an FDC scheme, the government
can influence, through regulation, the type of instruments eligible for the fund managers or could even choose to
reverse the FDC reform; under an NDC scheme, the government could directly influence the notional rate of return
and/or refuse to comply with promised benefits under conditions of fiscal stress.
6 The systems corresponding to the Armed Forces (Army, Navy, Air Force and Police) were not included in this
reform and are still in place.
7As of May 2011, the administrative fee is equivalent to approximately 1.49 percent of covered wages, and the DSI
premium corresponds to an additional 1.49 percent, amounting to a total contribution rate equivalent to 12.98
percent of covered wages.
4company if the beneficiary chooses to buy an annuity. Most of these requirements are strictly regulated
by law and secondary regulations generated by the Superintendence of Pensions (SP, formerly known as
the Superintendence of Pension Fund Administrators), the institution created in 1980 to regulate and
supervise the PFAs. In particular, investment options are closely regulated by a complex structure of
eligible instruments, quantitative limits and a (relative) minimum return requirement.8
The key aspects of the FDC system are summarized below. For our hypothetical NDC system we keep as
many of the original features as possible. The main differences are in terms of the calculation of the rate
of return on contributions, the design of the payout phase and the role of the minimum pension
guarantee.
1.1 Switching Options for Individuals Who Contributed to the Previous System
Under the 1980 reform, individuals who made contributions to one of the old PAYG systems
were allowed to choose between staying in their regime or switching to the new one. Individuals who
switched to the new system were not allowed to go back to their previous regime. Individuals who
entered the labor market for the first time after the reform were automatically enrolled in the new
system. For the hypothetical NDC reform, we will maintain these rules.
1.2 Contribution Rate
The contribution rate in the new system was significantly reduced, from rates around 23 percent
in the case of the PAYG regimes,9 to approximately 14 percent (10 percent plus the administration fee
charged by the AFPs, which averaged 4 percent for the average worker in the first 10 years). This
difference could explain the massive switching that occurred in the initial years of the Chilean reform. To
8PFAs are currently allowed to invest the funds in fixed and variable income instruments, both in Chile and abroad.
th
Starting in 2002, they have been required to offer at least four different funds (with an optional 5 possibility),
differentiated by the proportion of the assets that are allowed to be invested in variable income instruments
(Multifunds). Some of the investment regulations were modified by the 2008 reform (see Rofman et al. 2008); only
the main quantitative limits were left in the law, while the more detailed investment regime was left for secondary
regulation.
9 In 1980, global contribution rates were 33.2 percent, 41.04 percent and 32.5 percent for the Social Security
Service, EMPART and CANAEMPU, respectively (SAFP 2003). These rates included, however, benefits for old-age,
sickness and industrial accidents, among others. Official contribution rates for pensions were lower (22.95 percent,
24.91 percent and 15.75 percent in the three previous cases) but not representative of the real financing needs, as
resources were pooled to finance all types of benefits.
5maintain consistency with the observed switching behaviour, we will assume a 10 percent contribution
rate into the notional account for the base scenario of the hypothetical reform. Later in our analysis we
will take into account differences in administrative costs between the two systems under alternative
scenarios. The total contribution rate flowing to the NDC could be lower but our focus is only on the
effective amount that is deposited in the individual accounts in the two systems.
1.3 Acknowledgment of Past Contributions
Past contributions from individuals who switched to the new system were generally
acknowledged under the figure of a recognition bond, a promise made by the State to deposit a certain
amount in the individual account, once he or she reached legal retirement age. The recognition bond
was issued by request of the individual and earned a fixed 4 percent real interest rate from the moment
the person joined the new system until legal retirement age.
For the hypothetical NDC reform a similar procedure would apply: A Notional Recognition Bond would
be issued upon request of the affiliate, using the same formulas as current recognition bonds. The
recognized balance would be automatically credited in the individual account at retirement age and
would earn the same notional interest rate as current contributions from that moment on.10
1.4 Rate of Return on Contributions
Current contributions to the AFP system (not including the administrative fee) are saved in the
individual’s account and automatically invested in a diversified portfolio of financial instruments.
Balances are recalculated on a daily basis, adding contributions or withdrawals from the fund and the
daily return of the pension fund chosen by the participant.
Under the hypothetical NDC reform, the procedure would be the same, except that the daily interest
rate earned by the notional funds would be based, not on financial returns, but on a notional return
calculated from the growth rate of wages or the growth rate of the wage bill of formal dependent
workers.
10
An alternative procedure could have been to credit the recognized balance from the moment of calculation. In
this case, the bond would earn the notional rate from the beginning, instead of the exogenous 4 percent rate.
61.5 Retirement Options
In general, individuals cannot retire until they reach the legal retirement age (60 years for
women and 65 for men). When they decide to retire (which does not imply that they have to stop
working), the accumulated balance in their account (including the recognition bond and potentially, the
voluntary savings of the individual) can be returned to the participant in the form of a programmed
withdrawal paid by an AFP or be used to purchase an annuity from a life insurance company.11 In the
first case, the pension is recalculated every year based on current balance and age- and sex-specific life
expectancy. In the case of death of the participant, the remaining balance can be transferred to legal
beneficiaries or to the heirs of the deceased. The schedule of payment generally decreases over time
and if the person lives long enough, the balance might be exhausted. In the second case, the entire
balance is transferred to the insurance company, in exchange of a fixed real annuity until death of the
pensioner and a survivorship annuity for legal beneficiaries. No heritage is paid in the absence of
beneficiaries and survivorship benefits are a fixed fraction of the original pension, independent of the
timing of the death. Individuals with low balances are not allowed to buy annuities and can only receive
programmed withdrawals.
Under the hypothetical NDC reform, notional balances would always be transformed into a fixed annuity
paid by the State, the amount of which would depend on the balance, age- but not sex-specific life
expectancy of the participant and potential beneficiaries and a fixed interest rate corresponding to the
average notional rate of the year prior to retirement. Similar to private annuities, survivorship benefits
would be paid upon death but no heritage would be paid in absence of beneficiaries.
1.6 Poverty Prevention Programs
Until 2008, the government offered two publicly funded programs for individuals with low
pensions or no pension at all: the minimum pension guarantee (MPG) and the assistance pensions
(PASIS).12 Individuals who have contributed for at least 20 years (including the time recognized for
11
In the simulation part, we will assume that everybody chooses to annuitize, using the required gender-
differentiated mortality tables.
12
This scheme was modified by the 2008 reform, which replaced the MPG and PASIS programs by a New Solidarity
Pillar. The latter provides a basic solidarity pension for uncovered individuals in the 60 percent poorest part of the
population and a solidarity complement for individuals in the same group with low pension rights (see Rofman et
al. (2008) for more details on this program). In this article, we did not consider the new benefits introduced by this
7participation in the old system) are entitled to an MPG, which is a fixed pension paid by the State when
the individual balance is exhausted or when the annuity is below the minimum pension level. PASIS are
paid to poor individuals over 65 who do not receive pensions or other forms of income.
The hypothetical NDC would include an MPG for individuals with calculated pensions below the
minimum pension. A PASIS would not be required for affiliates of the system, as they would receive a
lifetime annuity. We will estimate and project the fiscal costs of these provisions, associated to the
population affiliated to the pension system. In other words, we will not attempt to estimate the cost of
PASIS for the non-affiliated population, assuming that this cost would be the same under both the FDC
and NDC regime.
reform as the MPG represents the most common form of protection introduced by countries that followed a
Chilean style reform.
8II. Data and Methods
Account balances can be constructed both for the new system and the hypothetical NDC
scheme, using data from a representative sample of AFP affiliates for whom the entire (administrative)
contribution history has been collected by the Superintendence of Pensions (SP).
The Affiliates Pension Histories (HPA, by its Spanish acronym) include basic demographic information
(gender and date of birth) as well as monthly detail of all the contributions that were made, the fees
that were charged, the pensions that were paid and the financial rates of returns earned from the
investments made by the Pension Fund Administrators (the AFPs, private firms charged with the
responsibility of managing the individual accounts and investing the funds saved). It also includes
information on the recognition bonds issued by the government, representing the accrued rights earned
by workers who contributed to the PAYG system before switching to the new one.13
The methodology has two parts: the estimation of pensions and fiscal burden under the current FDC
system and the equivalent analysis under the hypothetical NDC regime. In both cases, the analysis
would cover the 1981-2026 period.
In the first part, actual contribution histories (between 1981 and 2006) are completed for the 2007-2026
period using an imputation method similar to Berstein et al. (2006). For a given history of rates of
return, pensions are calculated for the different cohorts of workers, assuming that all individuals retire
at the minimum retirement age (60 for women, 65 for men) and use the balance in their accounts
(including recognition bonds) to buy a fixed annuity from that point on (using actual mortality tables and
a given interest rate).14 The transition cost generated by this reform has been estimated for the 1981-
2010 period in a number of publications and this estimation is extended for the 2010-2026 period from
the recognitions bonds information from the HPA individuals and aggregate data from active affiliates
and pensioners from the closed PAYG system (operational deficit).15
13
More detail about this data set also can be found in Berstein et al. (2006).
14 We implicitly assume that individuals do not become disabled or die before retirement age. Survival and
disability pensions, even if potentially important in terms of their cost, require a more complex treatment that is
beyond the scope of this article, which looks to compare two systems rather than attaining a precise projection of
the Chilean pension system. Furthermore, at least mortality should not play an important role as approximately
97% of men and 98% of women aged 20 will reach age 65 (based on demographic mortality tables by gender, age
group and marital status, INE 2006).
15
We use fiscal expenditures estimations presented in ECLAC (2006), based on a publication by Arenas de Mesa et
al. (2005).
9In the second part, pensions and fiscal cost are estimated under the hypothetical NDC reform. The
calculation of pensions follows a similar procedure to the first step, with the exception that
contributions are credited to a notional account, where they earn a notional rate of return. Upon
retirement, the notional balance is converted into a fixed annuity. The key element in this estimation is
the calculation procedure for the notional interest rate. In this application we limit ourselves to the
growth rate of the wage bill.16
2.1 The Affiliates Pension Histories Data Set and Projected Contribution Histories
The Affiliates Pension Histories (HPA) includes the complete contribution history (in the AFP
system) for a sample of approximately 24 thousand individuals, representative of the stock of affiliates
of the system in July 2002, from the moment they join the system until December 2006. In addition, the
data set also includes information on the recognition bonds held by the sampled individuals. For our
purposes, we concentrate on the 4869 individuals in the sample who would attain legal retirement age
before 2026 (women who were born before 1966 and men who were born before 1961).17 The following
figure shows the projected number of individuals who would retire each year (those who reach the legal
retirement age).18
As our interest is in comparing pensions received by these individuals when they reach the legal
retirement age, we needed to project contributions from 2007 until they retire. Following a similar
procedure to Berstein et al. (2006), we use a simple fixed effect procedure to predict the probability of
making contributions at any point in time and the expected covered wage (conditional on making
16
This is a commonly used proxy that may not, however, be fully sustainable in the long run. Poland, for instance,
adopted this type of rule for the notional rate of return. In section 3, we perform sensitivity analysis for a range of
alternative notional rates of return.
17
Under the AFP system, individuals can start withdrawing funds at any time after the legal retirement age or, if
they have accumulated sufficient funds to finance a reasonable pension and a reasonable replacement rate, they
can retire earlier. In practice, a large fraction of individuals retire at the legal retirement age. In this article, we will
assume that all individuals retire at the legal retirement age. This simplifying assumption should not affect the
main results in this article, as i) early retirement would affect in a similar way both the FDC and the NDC scheme
(as pensions are actuarially calculated) and the relation between them should be maintained, and ii) the fiscal cost
should not be affected as recognition bonds are paid at legal retirement age, only individuals with pensions well
above the minimum pension are allowed to retire early and the actuarial calculation of pensions guarantees that
early retirement does not increase the fiscal burden.
18
The figure was constructed using the 24 thousand individuals included in the sample, using expansion factors
that were constructed by the Chilean Pension Supervising Authority. It assumes that all individuals reach the legal
retirement age and retire at that point. In practice, some of these individuals may have died prior to legal
retirement age and some of them may have retired before or after legal retirement age.
10contributions). Specifically, we separately estimate the following equations using standard fixed effect
procedures with a linear probability model.19
Contributesit 1 Ageit 2 Ageit2 1 Femalei Ageit 2 Femalei Ageit2 i it
, (1)
2
LogEarningsit 1 Ageit 2 Ageit 1 Femalei Ageit 2 Femalei Ageit2 i it
In these specifications, the dependent variables are Contributesit, which is a dummy variable equal to
one if individual i makes a contribution in month t, and LogEarningsit, which is the log of earnings of
individual i in month t. The independent variables are Ageit (in months), the interaction between Femalei
(a dummy variable equal to 1 if person i is a woman) and Ageit, the same interaction with Ageit squared
and an individual level fixed effect.
Figure 1: Projected Number of Individuals Retiring Each Year from the AFP System
250,000
200,000
Men
Women
150,000
100,000
50,000
-
82
84
86
88
90
92
94
96
98
00
02
04
06
08
10
12
14
16
18
20
22
24
19
19
19
19
19
19
19
19
19
20
20
20
20
20
20
20
20
20
20
20
20
20
Source: Authors’ calculations based on the HPA data set.
The results of the estimation are summarized in Annex 2. We use the estimators (including the
individual fixed effects) to predict contribution probabilities and expected earnings by age and gender.
Expected contributions are then obtained by multiplying, in each month, the predicted probability with
the predicted covered wage (see
Figure 2).
19
The choice of a linear model allows us to estimate the fixed effect for each individual and use it to predict their
future contributions. This is particularly important as in this case, given the administrative nature of the data, we
do not have measures of education or ability.
11Figure 2: Predicted Expected Contribution by Age and Gender
$ 600
$ 500
$ 400
Average earnings (2008 US$)
Women
$ 300
Men
$ 200
$ 100
$-
20
22
24
26
28
30
32
34
36
38
40
42
44
46
48
50
52
54
56
58
60
62
64
Age
Note: The expected contribution is calculated by multiplying the
probability of contributing at a given age (for a given gender) times
the conditional income if contributing. The figure presents the
average expected contribution for the individuals in the sample.
Predictions for each individual also include the individual fixed
effect components.
Source: Authors’ calculations.
2.2 Monthly Rates of Return
Under both the FDC and NDC systems, balances are constructed as the sum of contributions
made during the lifetime, increased by the returns earned over time.20 We have:
Legal retirement age l .r .a .
Balancei recognition Bondi 10% Wageit 1 rs , (2)
age t 15 s t
where rs is the real rate of return.
The difference between the two systems is that under the FDC scheme, rs corresponds to the financial
return of the instruments in which the pension funds are invested; whereas in the NDC scheme, the
notional return is set by the authority, according to a predetermined rule – usually a proxy for the PAYG
asset.
In this paper, the rate of return that we use for the FDC scheme is the historic rate of return earned by
the AFP system between 1981 and 2007.21 For the years after 2007, we assume a fixed rate of return, set
20
This formula represents a slight simplification of the actual calculation, as in some periods AFPs were allowed to
charge additional fees that were charged directly from the balance in the account. These charges were historically
low, not all PFAs actually applied them and they were eliminated during the 2008 reform.
12at a level of 4 percent per year.22 In the case of the NDC system, we use demographic data on the
growth rate of the real wage bill (the number of covered dependent workers multiplied by their average
wage).23 After 2007, we also assume a constant growth rate of the wage bill equivalent to 4 percent per
year. The annualized value of these two rates is graphed in Figure 3.
Figure 3: Annualized Real Rates of Return under the FDC and NDC Systems
50%
Real Annual return of the AFP system (FDC)
40%
Real Annual growth rate of the wage bill (NDC)
30%
20%
10%
0%
-10%
-20%
-30%
1981
1983
1985
1987
1989
1991
1993
1995
1997
1999
2001
2003
2005
2007
2009
2011
2013
2015
2017
2019
2021
2023
2025
Source: Based on historic returns of the AFP system and labor data
from the INE.
2.3 Pension Calculation
To calculate pensions under both schemes, we make use of actuarial formulas currently used
under the AFP scheme. For simplicity, we assume that all individuals are single and they use their
current balances to buy a fixed annuity. In this case, pensions can be obtained using the following
formula:
21In every period the rate of return is constructed as the monthly weighted average return of the system, where
the weights are given by the funds administered by each AFP and each type of Fund (after 2002, each AFP started
offering five different funds).
22The historic annual rate of return for the system, between 1981 and 2007, was 10.1 percent. During the same
period, the real wage bill experienced an average 4.9 percent growth rate per year. Both employment and wage
data were obtained from the National Statistical Agency (Instituto Nacional de Estadísticas (INE)).
23 By assuming the same rate of return for the FDC and NDC schemes in non-observed periods, we avoid the results
being drawn by explicit differences in return assumptions. In section 3, as a sensitivity analysis, we make
alternative assumptions on the notional rate of return.
13Balancet Balancet , (3)
Annual Pensiont 110 t
Unitary Necessary Capitalt Pr Alive at age s | Alive at age t
s
s 0 1 R
where the probabilities are obtained from gender-specific dynamic mortality tables and R represents the
discount rate used by insurance companies to estimate the rate of return earned by the funds during
the payment period for the annuity.
In the case of the FDC system, R is obtained from market data as the average implicit rate of return on
all annuities sold during the previous six months. In periods where no market data is available for the
implicit rate on annuities (before 1989 and after 2007), a fixed 3.5 percent is assumed. For simplicity, we
use the same rates to calculate pensions from the NDC scheme.24 These rates are presented in Figure 4.
Figure 4: Discount Rates for Annuity Calculations (6-Month Average)
7%
6%
5%
4%
3%
2%
1%
0%
1981
1983
1985
1987
1989
1991
1993
1995
1997
1999
2001
2003
2005
2007
2009
2011
2013
2015
2017
2019
2021
2023
2025
Source: Based on historic implicit rates on annuities.
Since pensions are calculated for all individuals in the sample, it is possible to construct different
statistics of the distribution of pensions over time (e.g., the average, the median, different quintiles of
the distribution, and average pensions per quintile).
2.4 Fiscal Cost Calculations
24
One potential difference between the FDC and the counterfactual NDC scheme is the cost associated with annuity
intermediation. These commissions reached a maximum at the end of 1999, representing 6% of balances (Reyes and
Steward, 2008). Since then, additional regulations have reduced drastically, with an effective maximum of 2.5%.
Under an NDC scheme, annuities are implicitly provided by the State, arguably at a lower intermediation cost.
These differences are implicitly captured in the sensitivity analysis where alternative rates for the NDC scheme are
used, to capture differences in administration costs.
14The fiscal burden associated with the civil pension system can be decomposed into four
components:25 (1) the operational deficit from the PAYG system managed by the Instituto de
Normalización Previsional (INP), the agency in charge of administering the previous PAYG regimes: the
difference between pensions paid to individuals who stayed in the old system and contributions from
active workers affiliated with that system; (2) the cost of recognition bonds to individuals who switched
to the new system; (3) the cost of minimum pension guarantees (MPG) to retirees with pensions below
a guaranteed level who have at least 20 years of contributions; and (4) the cost of financing assistance
pensions (PASIS) to a fraction of retirees (those in the poorest quintile of the earnings distribution) who
did not participate in the formal schemes or exhausted their funds and do not have the 20 years of
contributions required for the MPG.
Projections for the first three components are presented in the next section. The first two come directly
from the individual pension projections under both systems. Minimum pension guarantees, on the other
hand, are calculated for each individual when the contributory pension is below the minimum and the
individual has contributed for at least 20 years. As discussed before, the State finances the difference
between the pension and the guaranteed minimum.26 The costs of the minimum pension is thus
projected at the individual level for every year after retirement, taking into account age*gender-specific
survival probabilities. We did not project expenditures in the fourth component (assistance pensions),
however, assuming that all retirees receive an annuity until death. Also, performing an accurate
estimation of non-affiliated individuals is beyond the scope of this article.
It is important to note that the present value of the accumulated deficits in the old system and the value
of the recognition bonds is exactly the same under both schemes. The differences we care about are in
terms of the present value of the minimum pension guarantee and, more importantly, cash-flows.
Under the NDC, government transfers to pay pensions in the old-system are lower since excess
contributions are used to pay these pensions. Repayments of recognition bonds could also be initially
lower because, contrary to the FDC system, in the case of the NDC the government would not need to
transfer the total value of the bond to an AFP when the individual retire -- only what is needed to cover
25
The fiscal burden stemming from the Armed Forces pension schemes (which were not reformed in 1980) will not
be included in this study, as it should be the same regardless of the reformed system. It is important to mention
that these projections do not necessarily apply to the system currently in place, as this was reformed during 2008,
replacing the MPG and assistance pension programs with a New Solidarity Pillar. This was not included in this
article. Under no circumstance should these estimates be considered official projections.
26
The guaranteed levels are currently set at USD 209 for individuals between 65 and 70 years old, USD 228 for
individuals between 70 and 75, and USD 244 for qualifying workers over 75.
15any deficit that may appear between pensions in payment and contributions.27 In our analysis, however,
for transparency, we will assume that cash-flows related to the repayment of recognition bonds in the
NDC are the same as in the FDC.
2.5 Estimating the Distribution of Benefits at the Individual Level and the Per Capita Cost of
Guarantees
So far we have discussed the assessment of the fiscal costs and the distribution of pensions
under the FDC and NDC systems from a prospective approach. These calculations, however, reflect one
particular realization of the stochastic process driving the evolution of the interest rate and wages. We
are interested in characterizing the distribution of pensions (at the individual level) under the FDC and
NDC system. In other words, for individuals entering the pension system today, what would be the
expected value of their pensions at retirement if the system was FDC or if the system was NDC.
Clearly, several factors determine the dynamics of interest rates and wages, from changing
conditions in financial and labor markets to technological progress and foreign direct investment. Trying
to capture these, however, would be a futile exercise. Instead, we focus on approximating the statistical
process that best replicates current dynamics. We do this by using a very general time-series model
where the value of the interest rate (or wages) at time t is a function of past values and past and current
random shocks (an autoregressive moving average -- ARMA – process). In addition, we allow the
variance of the random shocks to move over time as a function of past shocks and past variances
(generalized autoregressive conditional heteroskedasticity in the error term – GARCH). These models
are commonly used in the study of the dynamics of asset prices. The ARMA component implies that
there can be sequences of growing prices alternating with sequences of falling prices. The GARCH part
implies that periods of high volatility in prices can be followed by periods of low volatility. The random
shocks that generate these changes in regime can be the result of policies or changes in “animal spirits.”
For the purpose of our analysis we do not need to know. We simply seek the model structure (i.e., the
set of model parameters) that best replicates the data.
In its general form, the model can be described by the following equation:
, (4)
27
A deficit has to appear eventually, unless the rate of return in the NDC is set “low enough.” But in the case plan members
would be implicitly taxed to cover the liabilities of the old system.
16where and , the variance, evolves over time according to:
(5)
Combined with model (1), which gives the probabilities of contributing and the conditional covered
earnings for a given age and gender, model (4-5) can be used to simulate forward career histories for
individuals at different levels of income. Using Monte Carlo simulations it is then possible to derive both
the distribution of pensions (replacement rates) at retirement and the distribution of expected fiscal
costs related to the financing of the minimum pension guarantee.
III. Results
3.1 Pension Comparisons
We first take a look at the complete distribution of pensions under both schemes. Figure 5
presents the scatter plot between pensions under the FDC and NDC regimes (including the 45 percent
degree line). Clearly, the systematically higher historic returns under the FDC scheme imply higher
pensions for all individuals (24 percent higher on average). We then look at the level of coverage
obtained by the system under the two alternative reforms, measured by the fraction of individuals that
are able to self-finance a pension at least equivalent to the guaranteed minimum pension, the fraction
of individuals that are not able to finance this amount but who are covered by the MPG and the
proportion of retirees who neither finance a minimum pension nor are covered by the MPG program
(see
Figure 6).28
Figure 5: Distribution of Monthly Pension under FDC ad NDC Reforms
Given Past Rates of Return
28
In calculations, we used the minimum pension amount that was in effect in 2007, equivalent to approximately
25% of the average covered wage of participants in the system, as of December 2007.
174500
4000
3500
Monthly pension under NDC reform (US$)
3000
2500
2000
1500
1000
500
0
0 500 1000 1500 2000 2500 3000 3500 4000 4500
Monthly pension under FDC reform (US$)
Source: Authors’ calculations.
18Figure 6: Coverage of the Minimum Pension Guarantee over Time under FDC and NDC Reforms
Under FDC Reform Under NDC Reform
100% 100%
80% 80%
Percentage in each category
Percentage in each category
60% 60%
40% 40%
20% 20%
0% 0%
1981-1985 1986-1990 1991-1995 1996-2000 2001-2005 2006-2010 2011-2015 2016-2020 2021-2025 1981-1985 1986-1990 1991-1995 1996-2000 2001-2005 2006-2010 2011-2015 2016-2020 2021-2025
Below MP, without State Guarantee Below MP, with State Guarantee Above minimum pension Below MP, without State Guarantee Below MP, with State Guarantee Above minimum pension
Source: Authors’ calculations.
Overall, 51 percent of retirees will not be able to finance a minimum pension and would not be eligible
for the MPG program under the FDC scheme.29 Under the NDC reform, the proportion would be only
slightly higher (52 percent). The main difference arises between the other groups of individuals: Under
the FDC reform, 39 percent of all retirees would be able to self-finance a minimum pension with the
remaining 10 percent requiring the State MPG program to reach that level. Under the NDC reform,
however, accumulated balances would be smaller and a larger fraction (14 percent) would require a top-
up from the State.
To interpret these results, it is important to keep in mind that no behavioral changes were assumed, so
that MPG eligibility (given by the number of contributions) would be the same in both cases. In other
words, differences only originate in the different rates of returns of both systems and the resulting
balances. In this case, notional returns for the past have been generally smaller than financial returns,
therefore accumulated balances should also be smaller. Yet, this seems to mostly affect individuals that
fulfilled the 20-year requirement, causing some of them to fall below the MP threshold.
To have a closer look at the effect on different parts of the income distribution, we calculated average
pensions by quintile of the pension distribution, for both types of reform (see Figure 7). The main
29
This result is similar to Berstein et al. (2006). This was one of the main elements of diagnostic presented to the
Reform Committee created by President Bachelet in March 2006. Ultimately, the outcome was the introduction, in
July 2008, of a New Solidarity Pillar that will cover all individuals above 65 years old in the bottom three quartiles.
See Rofman et al. (2008) for a description of this reform and the diagnostic that led to it.
19conclusion is that the stronger impact of the reform occurred in the higher range of the pension
distribution, especially for the cohorts retiring in the intermediate periods (between 2006 and 2015).
This phenomenon could be explained by the timing of the highest financial returns (which were strongly
concentrated in the first 15 years, with a number of periods with rates over 20 percent) and the fact that
we assumed, both for the FDC and NDC schemes, a constant 4% rate for contributions after 2007. In
addition, low income workers have contribution densities that are shorter and more concentrated later
in life, therefore are less “affected” by differences in the rates of return on contributions between the
FDC and NDC systems.
Figure 7: Average Self-Financed Pensions by Quintiles under the FDC and NDC Reforms
Under FDC Reform Under NDC Reform
$ 1,200 $ 1,200
5th quintile 5th quintile
4th quintile 4th quintile
$ 1,000 3rd quintile $ 1,000 3rd quintile
2nd quintile 2nd quintile
Average monthly pension (US$ of 2008)
Average monthly pension (US$ of 2008)
1st quintile 1st quintile
$ 800 $ 800
$ 600 $ 600
$ 400 $ 400
$ 200 $ 200
$- $-
1981-1985 1986-1990 1991-1995 1996-2000 2001-2005 2006-2010 2011-2015 2016-2020 2021-2025 1981-1985 1986-1990 1991-1995 1996-2000 2001-2005 2006-2010 2011-2015 2016-2020 2021-2025
Source: Authors’ calculations.
3.2 Fiscal Cost Comparisons
As discussed above, in our setting, differences in the fiscal impact of the two types of reform
come from two elements: (i) differences in the cost of the MPG program originated in the higher past
returns generated by the FDC regime; and (ii) differences in the value of government transfers to cover
the deficit of the old-system, given that the initial fiscal surplus generated by the NDC regime can be
used to cover this deficit (at least in part).
Regarding the first component, our prospective simulations show that the lower returns earned by
contributions in the NDC scheme translate into higher MPG costs. Over the long-term, minimum
pensions would cost 44 percent more under the NDC than the FDC reform (see ¡Error! No se encuentra
el origen de la referencia.). The magnitude of the MPG cost under both reforms, however, is relatively
20small compared to the other components of fiscal cost. As explained in the previous section, only a few
individuals would be eligible for the State guarantee and the cost associated to these individuals is
relatively low, as the State is only responsible for the difference between the self-financed pension and
the guaranteed level. This difference tends to be small for individuals who fulfill the 20 years of
contributions requirement. The magnitude of this effect could be different in other contexts, depending
on the guaranteed level and eligibility requirements.
The second component of the fiscal difference between the two regimes comes from the fact that the
NDC remains a PAYG scheme. The FDC reform makes most of the implicit pension debt (accrued to date
liability) explicit in the form of operational deficit and recognition bonds. Under an NDC reform only part
of implicit pension debt needs to be repaid – the liability of the old-system not covered financial and
PAYG asset. But the NDC reform moves also to a new and lower contribution rate (10 percent instead of
23 percent), and the repayment of this share of the implicit pension debt needs also to be financed (see
Holzmann and Jousen, Chapter 18, this volume). The new NDC scheme creates transitional surpluses
that help finance the payment of operational deficit and recognition bonds but this surplus is not
sufficient over the long-term – unless the NDC paid a rate of return on contributions below the
sustainable level (an implicit tax). Eventually, the rest of NDC legacy costs needs to be budget financed
as under an FDC reform. In our simulations we see that Figure 9 shows the annual contributions paid
into the NDC scheme and the annual pensions paid to NDC participants, excluding the portion that is
financed by the recognition bonds paid to the individuals who switched to the new system. During the
first 45 years, the flow of contributions exceeds the flow of new obligations acquired by the NDC
scheme – the Government borrows this surplus to finance part of the operational deficit of the INP. In
the long run (and assuming that the selected wage growth is a good proxy for the sustainable notional
interest rate), the surplus would disappear and no deficit should emerge (that is not covered by the
repayments that the government needs to make to finance the unfunded liabilities of the old-scheme).
It is important to notice that if the government only repaid recognition bonds when the NDC system
generate a deficit, the surplus of the NDC system would be smaller (could be zero in some cases) but so
would be the fiscal costs to the government.
21Figure 8: Annual Fiscal Cost of Minimum Pension Guarantee under FDC and NDC Reforms (%
GDP)
0.09%
0.08% Annual cost MPG under FDC reform
0.07%
Annual cost MPG under NDC reform
0.06%
% GDP
0.05%
0.04%
0.03%
0.02%
0.01%
0.00%
1981-1985 1986-1990 1991-1995 1996-2000 2001-2005 2006-2010 2011-2015 2016-2020 2021-2025
Source: Authors’ calculations.
Figure 9: Fiscal Surplus of the NDC Regime (% GDP)
2.5%
2.0%
1.5%
1.0%
0.5%
% GDP
0.0%
-0.5%
Pensions paid from the NDC scheme - excluding portion financed by
-1.0% Recognition Bonds
Contributions paid into the NDC scheme
-1.5%
-2.0%
1981
1982
1983
1984
1985
1986
1987
1988
1989
1990
1991
1992
1993
1994
1995
1996
1997
1998
1999
2000
2001
2002
2003
2004
2005
2006
2007
2008
2009
2010
2011
2012
2013
2014
2015
2016
2017
2018
2019
2020
2021
2022
2023
2024
2025
22Source: Authors’ calculations.
To construct the evolution of total government expenditures on pensions, we also need the transition
costs generated from the commitments made with individuals who had made contributions to the
previous DB scheme. These commitments take the form of recognition bonds to be paid to individuals
who switched to the new system (either the FDC or the NDC) and the operational deficit of the INP,
originated in the difference between the contributions paid by workers who chose to stay in the
previous scheme and pensions paid from this program.
Based on a publication by Arenas de Mesa et al. (2005), ECLAC (2006) presents projections until 2010 for
the different components of the Chilean fiscal expenditures. As we are particularly interested in the
level and timing of government transfers under both types of reform, we extended the projections on
the transition costs for the entire period. To this end, we used current aggregate data on contributors
and pensioners from the INP.30 Using recognition bonds data from the HPA sample, we also estimated
the cost paid each year on this item during the projection horizon. The results from these projections
are presented in Figure 10.
We see that, as a large number of participants switched early in the reform, the operational deficit of
the old system increased rapidly at first, reflecting the drop in revenues from contributions. Then, as the
number of pensions paid declines, the deficit of the old system falls over time. The cost associated with
recognition bonds, on the other hand, picks up slowly. This is because these obligations are paid when
individuals reach legal retirement age and only begin to decline as the number of active contributors
that participated in the previous scheme diminishes.
30
We used INP’s annual summary of pensioners (average pension) and contributors (average earnings) by age and
gender. We assumed that current contributors keep participating in the system until they reach the legal
retirement age, at which point they retire and start receiving 70 percent of their last income (with a floor set at
today’s minimum pension) until they die. Using current mortality tables, pension expenditure is projected for
current and future pensioners. The 70% replacement rate is the maximum replacement rate under the main
programs, so these estimates should be considered as an upper bound on future operational deficits.
23Figure 10: Projected Fiscal Cost from INP Operational Deficit and Recognition Bonds (% GDP)
5.0%
4.5% Recognition Bonds
4.0% INP Operational deficit
3.5%
Fraction of GDP (%)
3.0%
2.5%
2.0%
1.5%
1.0%
0.5%
0.0%
81
83
85
87
89
91
93
95
97
99
01
03
05
07
09
11
13
15
17
19
21
23
25
19
19
19
19
19
19
19
19
19
19
20
20
20
20
20
20
20
20
20
20
20
20
20
Source: ECLAC (2006) for the 1981-2006 period and authors’
calculations based on INP statistics on current contributors and
pensioners (www.inp.cl) and HPA data on recognition bonds for the
2007-2026 period.
Finally, we are able to compute the total fiscal expenditure under both reforms. The net present value
(for the first 45 years) of the fiscal cost under the FDC reform represents 133.7% of initial GDP,
compared to the 78.1% under the NDC reform.31 As expected, there is a significant difference in the
level and timing of the fiscal impacts of the FDC and NDC reforms. The NDC scheme implies lower fiscal
pressures from the pension system during the entire 45-year window (the average difference is 1.24
percent of GDP between 1981 and 2025) but the difference is reduced over time (see Figure 11).
Table 1 presents the net present value (for the first 45 years) of the different components of fiscal
expenditure under a number of different scenarios. Notice that in all scenarios, the transition cost
components (INP operational deficit and recognition bonds) are kept constant. The first row
corresponds to the FDC reform which implies the lower fiscal cost associated with the minimum pension
guarantee (MPG) but also the highest fiscal cost in net present value. The reason is that the transition
cost is paid entirely by the State during the first few years, whereas under the NDC scenarios, the
surplus generated by the NDC scheme helps finance the initial transition cost.
The second scenario corresponds to the base NDC case described in the earlier sections, under which
the notional interest rate corresponds to the growth rate of the wage base, usually lower than the
31
The NPV calculations were done by simply adding up the annual deficit to GDP ratios. This is equivalent to the
sum of discounted expenditures, using the GDP growth rates as discount rates, divided by the initial GDP. The
magnitude using the same discount rate assumption is broadly in line with estimates based on Schmidt-Hebbel
(1995) that arrive as 126 percent of GDP (see Holzmann, 1999).
24financial interest rate borne by the FDC scheme. For this reason pensions are lower, implying a higher
fraction of the population that qualifies for the MPG and thus a higher fiscal cost. The fact that workers
keep contributing to the common pool, from which pensions are paid generates an important fiscal
surplus during the whole period, equivalent to 56.2% of 1980 GDP.32 Overall, the NDC implies a 42%
lower fiscal cost than the FDC reform.
Scenarios 1, 2 and 3 were constructed using a fixed annual notional rate, set at 1.5%, 3.0% and 4.5%,
respectively. With the lower notional rate, NDC pensions are lower, which translates to a higher MPG
cost but also a much higher NDC surplus. The fixed 4.5% interest rate provides very similar result to the
NDC base scenario.
Scenario 4 is the same as the base NDC scenario but where we assume that, as operational costs are
usually lower under a centralized PAYG scheme than under the FDC competitive system, the
contribution rate could be set at 10.5% of covered wages, instead of the 10% that was actually used.
This higher contribution rate translates to higher pensions, lower MPG cost and higher NDC surplus.
Finally, pensions under scenario 5 were calculated using unisex mortality tables, instead of the gender
differentiated tables that are currently in use under the FDC program.33 This scenario was suggested by
the experience of countries that have introduced NDC schemes, which tend to incorporate the use of
unisex tables in pension calculations. As women tend to live longer than men, the use of unisex tables
should increase women’ pensions and reduce men’s. The results suggest that this tends to increase the
MPG fiscal cost (relative to the base scenario) but also increase the fiscal surplus by a higher fraction.
The explanation behind these results is related to the fact that there are slightly more men than women
in the sample (52.6% against 47.4%) and the unisex tables were constructed assuming a 50-50 split.
In summary, the NDC reform implies a significantly lower fiscal over a long period of time, which is only
partially compensated by the increased cost of the MPG program. As explained earlier, this small MPG
effect is due to the limited coverage of the program. Under a more generous scheme, like the New
32
It is interesting to note that under the FDC scheme, the equivalent of the NDC surplus corresponds to the rapid
accumulation of assets owned by participants in the system, that are invested in financial instruments by the pension
fund managers. As of December 2009, these funds were equivalent to 64% of 2009 GDP.
33
More precisely, pensions were calculated using the current tables for the correct sex of each individual in the
sample and using the opposite sex. Both pensions were then averaged using the inverses of the alternative pensions:
unisex pension = 1 / (0.5 / pension_man + 0.5 / pension_woman). This is equivalent to construct mortality tables
averaging mortalities using a 50-50 proportion between men and women.
25You can also read