Indiana Autism Support Services Gap Analysis - IN.gov
←
→
Page content transcription
If your browser does not render page correctly, please read the page content below
Indiana Autism Support Services Gap
                                                 Analysis
 Indiana Autism Support Services Gap Analysis
 Executive Summary: June 30, 2016

 Dear Colleagues,

 By request of the State, HANDS in Autism® has continued with the gap analysis process that
 commenced in 2014 and is continuing at the current time to further determine the state of the state in
 autism services in Indiana. The gap analysis process continues in progress to ensure that adequate
 representation of all willing and interested stakeholders are given opportunity to participate in this
 evaluation. This will lead to assurance that there is a sufficient baseline upon which to base the
 success of future efforts statewide. The purpose of the current report is to report as of June 30, 2016,
 the status of the analyses and the directions forward in the coming months and year. This report will
 briefly reiterate the basic significance, process and approach taken to achieve these results. Further
 information related to these may be accessed from in the previous 2014-2015 report located at
 http://www.in.gov/fssa/ddrs/3355.htm . In addition, we have updated overarching themes as well as
 noted strengths and gaps that have been collectively noted across the period of 2014-2016. Given the
 scope of the analyses, this time period and into the fall of 2016 will serve as the baseline status upon
 which future comparisons of perspectives, actions and progress will be drawn. Further analyses and
 conclusions will consider both state and national trends in ASD as well.

 In the current reporting year, concentrated efforts have been taken to increase the accessibility of the
 needs assessment survey as well as other means for involvement and input. In this document, we have
 updated the results of the gap analyses to this time point, with analyses continuing in coming months
 as further activities targeted to increase consumer input is sought. Given the scope of effort and
 desired outcome of effecting systems change, it is essential that adequate attempts to engage and
 incorporate all interested stakeholders take place. Both recruitment efforts and analyses must be
 thorough and comprehensive to ensure that the recommendations for services, training, and resources
 are based upon a true state representation of stakeholders. In this way, the collaborative efforts of the
 Indiana Interagency Autism Coordinating Council (IIACC), its workgroups, the Local Community
 Cadres (LCCs) and others to isolate priorities and take action steps related to the Comprehensive State
 Plan (CSP) will be relevant, functional and meaningful to each and every consumer across the state.

 Data driven decision making is being utilized at each step to progressively and systematically move
 forward with identified state priorities based upon the gap analyses results, teaming within the IIACC
 and related work and study groups, as well as using the Comprehensive State Plan as a base
 framework for all activities. Also required in this process has been the development of foundational
 systems and processes to encourage meaningful and progressive communication and collaboration.

 In addition to furthering the reach of the gap analysis, the current year has been a time of developing
 and trialing a number of systems and processes with feedback encouraged and utilized from users to
 establish multiple usable formats to engage and involve stakeholders in ways that they find engaging

Conducted by HANDS in Autism® Interdisciplinary Training & Resource Center, Indiana University School of Medicine with support from The Family
and Social Services Administration (FSSA), 2014-2016. For questions please contact Naomi Swiezy, Ph.D., HSPP, Director, HANDS in Autism®, at
nswiezy@iupui.edu.                                                                                                                      Page 1
Indiana Autism Support Services Gap
Analysis
and feasible so as to keep the ongoing work on identified priorities in motion. These systems and
processes with a focus on engagement, transparency and action-orientation will be further discussed in
this 2015-2016 report.
Indiana has experienced a surge of attention across State and community efforts to bridge and effectively
coordinate and collaborate on various initiatives. There has been very purposeful attention to integrating
systems statewide which reflects growing awareness of the real potential for failed outcomes and
increasing needs resulting from tolerance and persistence on silos of practice. Such siloed efforts are not
be conducive to systems change and implementation. The IIACC has been intentionally inclusive of
membership from policy makers, practitioners, and the larger communities. Many of these individuals
are similarly integrated with other integrated workgroups and efforts and are able to foster information
sharing both to and from the IIACC regarding efforts pertinent in addressing the needs, goals, objectives,
and missions aligned with autism and related services.
The gap analysis process, work with the IIACC, workgroups and LCCs has continued with commitment
from a number of busy leaders and consumers across the state. A growing number and scope of
organizations, workgroups and systems groups are represented and invested in the systematic and
deliberate process towards systems implementation progress and positive outcomes that has been
demonstrated by group efforts thus far. At this juncture, the process is shifting towards a more action-
oriented path in initially addressing some of the long-standing “low hanging fruits” that involve similar
talking points and concerns across multiple goals within the Comprehensive Plan. Such action steps are
feasible areas to begin while the baseline gap analyses are ultimately completed in the coming year. The
HANDS team, as the Chairs of the IIACC and facilitators of the gap analysis and efforts in addressing the
Comprehensive Plan, are committed to inclusiveness, transparency and systematic and productive efforts
towards improving autism services and access. Progress can only occur with collectiveness of effort
represented by the IIACC and other partnerships; HANDS will continue to foster increasing avenues for
sharing input and becoming involved in any desired aspect of the process.
Thank you for the opportunity to continue to team with the State as well as the many incredibly
passionate and committed partners in this ongoing project. We look forward to the continued and
ongoing evaluation and progress related to Indiana autism services this coming year.
Respectfully,
Naomi B. Swiezy, Ph.D., HSPP
Tiffany J. Neal, Ph.D.
HANDS in Autism®Interdisciplinary Training and Resource Center
(317) 274-2675 Fax: (317) 274-3885
www.handsinautism.iupui.edu
Conducted by HANDS in Autism® Interdisciplinary Training & Resource Center, Indiana University School of Medicine with support from The Family
and Social Services Administration (FSSA), 2014-2016. For questions please contact Naomi Swiezy, Ph.D., HSPP, Director, HANDS in Autism®, at
nswiezy@iupui.edu. Page 2Indiana Autism Support Services Gap
Analysis
GAP ANALYSIS: INDIANA AUTISM SUPPORT SERVICES
INTRODUCTION
Autism Spectrum Disorder (ASD) is a lifetime condition characterized by atypical development of social skills,
communication, and repetitive or stereotyped behaviors that may also be accompanied by mild to severe
outbursts like tantrums, aggression, and/or self-injurious behavior (American Psychiatric Association [APA],
2000, 2013). ASD is currently the fastest growing developmental disability in the United States with a
prevalence of 1 in 68. This represents a greater than 600% increase in ASD diagnosis over the past 20 years,
with a 72% increase over the past 5 years alone (Centers for Disease Control and Prevention [CDC], 2015).
Despite the significant prevalence of the disorder, there is still much that is not well understood within the
communities and systems that support these individuals and their families. Adequate supports across the
lifespan are necessary for individuals to reach their potential and to access quality of life. Active involvement
and communication with diverse factions and the community-at-large provides added awareness, engagement
and advocacy of effective practices across a greater number of settings and individuals playing a role in
servicing, supporting and providing opportunities for ASD. Given the ever dynamic and changing landscape of
ASD and related services and the potential for community impact on funding, information and resources
pertaining to the state of autism, it is essential for there to be a process to stay connected, current and
progressive in this field. The National IIACC, established in 2000, serves as a model for states to develop such
a forum and network of community stakeholders with special interest in Autism services to ensure ongoing
dialogue, discussion and progress forward.
As outlined in the 2014-2015 Report, Indiana has had a distinctly positive trajectory in pursuit of supporting
individuals and families with ASD. Community networks and collaboration has been a staple in the community
for the past couple of decades with recognized need for following national trends as well as with collaboration
and joint effort at varied levels of coordination and leadership. Currently, the Family and Social Services
Administration (FSSA) is the oversight body for the Indiana IACC which has served as the primary body
assisting in the ongoing analyses of the larger sets of data collected from across systems and statewide and
helping to inform the priorities and trajectories of effort per the Comprehensive State Plan and based upon the
ongoing analyses of the state of the state. Since 2014, HANDS in Autism® has served as the Chair of the
IIACC and helps to facilitate the work of the IIACC, the workgroups and the Local Community Cadres,
collecting data, developing forums for input and generally maintaining the efforts towards a firm foundation for
systematic analysis, review and implementation pertaining to the Comprehensive State Plan and the state of the
state in autism.
This process began with a high level gap analysis and overview of state autism services in 2014 with further
analyses targeting those with lesser representation to present day. In particular, at the time of the 2014-2015
report, it was identified that, despite a response rate of over 800 informants across the state, that a number of
groups and interest groups were not adequately represented. As such, a primary goal in the current year has
been to specifically work to engage these underrepresented factions: individuals with ASD, justice
personnel/first responders, behavioral and community mental health providers, early childhood, insurance
representatives, and state agency representation. Further underrepresented groups included those in rural areas
as well as of varying cultural descent. Through more directed dissemination of the needs assessment,
generation of novel contact lists aimed towards the specific target groups, as well as development of innovative
and practical means for input, groups have been increasingly engaged whether attending IIACC meetings,
Conducted by HANDS in Autism® Interdisciplinary Training & Resource Center, Indiana University School of Medicine with support from The Family and Social
Services Administration (FSSA), 2014-2016. For questions please contact Naomi Swiezy, Ph.D., HSPP, Director, HANDS in Autism®, at nswiezy@iupui.edu. Page 3Indiana Autism Support Services Gap
Analysis
providing other regular input, or completing the survey. In general, and as reflected in the 2015-2016 data in
comparison to the 2014-2016 gap analysis data, more awareness and participation of these groups has resulted
in increased participation in the needs assessment survey.
General accessibility and input from a larger breadth and depth of the communities across the state has been a
premier effort in the following ways: (1) making the needs assessment survey more accessible (e.g., translating
to Spanish, refining questions for more meaningful input), (2) providing further communication outlets for ease
of participation and sharing (e.g., providing shared input where and when available—meetings, conferences--
rather than needing to be present for phone or live meetings), (3) sponsoring workgroup feedback through
online mechanisms (e.g., google docs, survey gizmo questions). As such, though the previous and more
traditional focus groups and interviews described in detail previously (see 2014-2015 report) have continued,
there are now more options for communication and partnership that provide stakeholders with more flexible
options regarding the level, timeframe and format of participation for added convenience and opportunity.
The ultimate outcomes of all of this work continue to surround the creation of a foundation for a more enhanced
ability to fully assess and inform future state policies and work towards improving the comprehensive care and
quality of life to individuals with ASD within their local communities by actively engaging the communities in
systems change and implementation efforts. After the multilevel and multimodal analysis last year and
continuing at a greater depth and breadth ongoing into the upcoming year, a number of overall conclusions have
provided the basis for initial targeted work that will become further refined ongoing as data and insights
continue to be collected across the state. Newly created documents have been developed for learning and
reference (State of the State summaries from across the nation and a table to align state and national goals and
activities) as well as to ensure that stakeholder ideas are being considered in relation to both state and national
activities and priorities. Collectively and through iterative processes, we have established a viable and
comprehensive process and platform for engaging stakeholders across systems and the state in multiple formats
to best conducting gap analyses and utilize the resulting information to inform the state of state in autism
services now and in the future.
Conducted by HANDS in Autism® Interdisciplinary Training & Resource Center, Indiana University School of Medicine with support from The Family and Social
Services Administration (FSSA), 2014-2016. For questions please contact Naomi Swiezy, Ph.D., HSPP, Director, HANDS in Autism®, at nswiezy@iupui.edu. Page 4Indiana Autism Support Services Gap
Analysis
RESULTS OF GAP ANALYSES:
WHO WERE THE INFORMANTS?
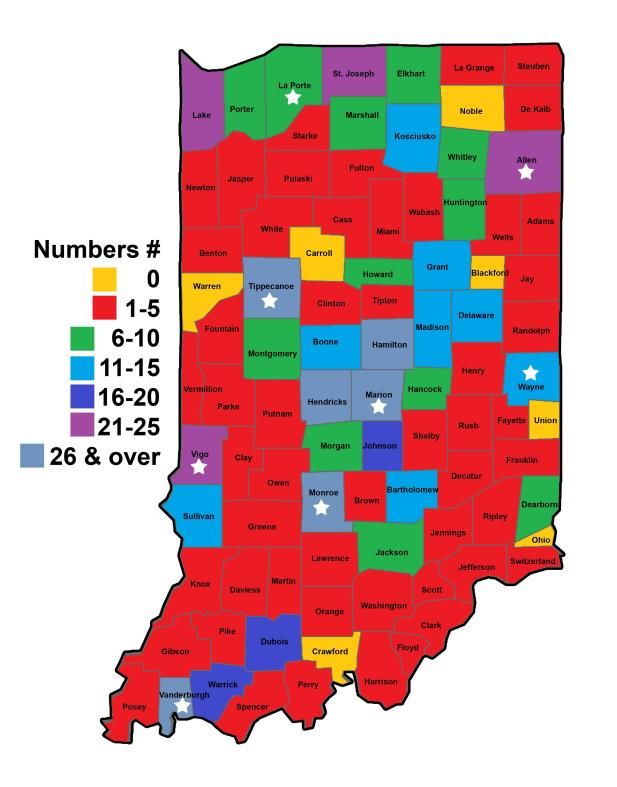
Updated in 2014-2015, 826 total responses were collected to reflect levels of state participation across all
formats of the gap analysis: focus groups, study groups, individual interviews and the needs assessment survey.
Relative participation is reflected in the graphic below. Though 300+ further responses were collected, this
particular graphic was last updated in 2015 with further updates to follow. Though most counties were
represented, the highest concentration of responses were in the donut areas surrounding the LCCs.
Regional Responses
NEEDS ASSESSMENT 2014-2016 (N=1136)
As previously noted, the current year’s focus was less
on raw numbers and more on an increased push for East LCC Areas
representation of groups previously underrepresented. 2%
Northeast
From the data to the right, though most informants are 23%
located in Central Indiana, there was decent Central
representation and pockets of more intense response 31%
from all of the LCC areas, similar to the map above.
Even the most recently formed LCCs centralized in
Richmond (East) and LaPorte (Northwest) were Northwest
18% Southwest
notable in response rate. North
8%
Central Southeast
10% 8%
Conducted by HANDS in Autism® Interdisciplinary Training & Resource Center, Indiana University School of Medicine with support from The Family and Social
Services Administration (FSSA), 2014-2016. For questions please contact Naomi Swiezy, Ph.D., HSPP, Director, HANDS in Autism®, at nswiezy@iupui.edu. Page 5Indiana Autism Support Services Gap
Analysis
However, as also represented in the county representation below, it is notable that the highest concentration of
responses on the 2015-2016 Needs Assessment came
County of Representation from just a few counties, with many of them being in
the northern or central regions.
2014-2016
N = 1103
Marion
17%
Hamilton
8%
Other Jackson
49% 4%
Hendricks
4%
Tippecanoe
Race/Ethnicity Representation
Allen 3% 2014-2016 Caucasian/Europ
3% N = 1077 ean American
St. Monroe
Lake Vanderburgh African American
Joseph 3%
3% 3% 3% 2%
Latino/Hispanic
1%
2% Asian/Pacific
3% Islander
1% Native American
Of further note, out of 1136 respondents and 1077 Other
responding to this question, 91% of those surveyed
classify themselves as Caucasian or European American, 91% N/A
an increase from the respondents last year. However,
results from this adding data this year to the total do 2 or more races
demonstrate some increased range of cultural diversity
despite the actual increase of the singular Caucasion/European American finding. Increasing attention to the
need for cultural diversity in the people recruited for the survey has been targeted currently with specific
resources going towards building a database of groups involving or serving individuals of different cultures.
These groups are in the process of being contacted to increase awareness and exposure to the survey, the IIACC
and the Comprehensive State Plan. In addition, efforts will be allocated to learn the best avenues for improving
access and dissemination to these populations. Similarly, a Spanish version of the needs assessment has been
developed during the current report year to increase access for this population. Dissemination efforts have
begun with a few responses to date and more to come for reporting at the next cycle.
Conducted by HANDS in Autism® Interdisciplinary Training & Resource Center, Indiana University School of Medicine with support from The Family and Social
Services Administration (FSSA), 2014-2016. For questions please contact Naomi Swiezy, Ph.D., HSPP, Director, HANDS in Autism®, at nswiezy@iupui.edu. Page 6Indiana Autism Support Services Gap
Analysis
Of 1113 respondents Highest Level of Education No high school
completing the survey
across the time period 2014-2016 Some high school
of 2014-2016, most N = 1113 High school graduate/GED
had at least a college
3% 3% 2% Vocational/Technical school
degree (approximately 1%
87%) with 60% of Some college
those individuals 7%
College degree
having some level of
graduate study and Some graduate studies
close to that number 27%
48% Graduate degree
with a culminating
graduate degree. As Doctoral Degree
such, a more diverse 9% Other
set of respondents is
necessary for a clarity N/A
on any impact on the
responses and/or comments as a result of the needs assessment survey.
Participant Role 2014-2015 Participant Role 2015-
N = 908
2016
Community N = 212
Provider
10% Other Community
8% Provider
School 19% Other
Justice System School
personnel 12%
Personnel personnel
32%
1% 23%
Family Justice System
member Personnel Medical
Family professional
37% Medical 2%
member 12%
professional
Individual Individual with ASD 30%
11%
with ASD 2%
1%
Conducted by HANDS in Autism® Interdisciplinary Training & Resource Center, Indiana University School of Medicine with
support from The Family and Social Services Administration (FSSA), 2014-2016. For questions please contact Naomi Swiezy,
Ph.D., HSPP, Director, HANDS in Autism®, at nswiezy@iupui.edu. Page 7Indiana Autism Support Services Gap
Analysis
In reviewing responses across the last
Participant Role 2014- couple of years and in total across
both years, the largest set of
Other
2016 respondents were consistently school
9% N = 1120
personnel and families while justice
system personnel and individuals with
Community School
Provider personnel ASD represented the smallest
Justice 12% 30% informant group. Given the focus and
System concentration in this year for
Personnel determining the best strategies for
1% increasing the respondents from
Individual Family Medical
with ASD member
particular stakeholder groups, the data
professional
2% 35% 11%
reflect these increased efforts with
some increase in responses from
justice personnel and individuals with ASD as well as more substantial increases with the
community providers which would include some of the needed response groups. This
trend will be expected to increase as the large number of contacts gathered and utilized to
pursue these stakeholders are utilized to recruit more in these groups, again in pursuit of a
more diverse population of respondents.
Where do you typically obtain informative
resources/materials about ASD? (2014-2015)
N = 873
73
64 62
Percent Responses
56 55
50 48 48 46
43 39 42
29 29 29
General Disability…
Other medical…
Autism Support Services
Autism Support Services
Internet
Autism Support Services
Professional Literature
Autism Support Services
Parents
Other Providers
Other Providers
Local Districts
State Conferences
Previous academic training
Previous academic training
School Family Medical Community Justice
personnel member professional Provider system
personnel
Conducted by HANDS in Autism® Interdisciplinary Training & Resource Center, Indiana University School of Medicine with
support from The Family and Social Services Administration (FSSA), 2014-2016. For questions please contact Naomi Swiezy,
Ph.D., HSPP, Director, HANDS in Autism®, at nswiezy@iupui.edu. Page 8Indiana Autism Support Services Gap
Analysis
Where do you typically obtain informative
resources/materials about ASD? (2015-2016)
39 38 43 43
37 37 35 34 31
Percent Responses
30 27 29 29
23 21
Previous academic…
General Disability…
Other medical…
Other medical…
Autism Support Services
Internet
Autism Support Services
Autism Support Services
Autism Support Services
Professional Literature
Internet
Parents
State Conferences
Other Providers
Other Providers
School Family Medical Community Justice
personnel member professional Provider system
personnel
Another area in which some
Where do you typically obtain informative trends appear to be changing
resources/materials about ASD? (2014-2016) in the recent year (if not yet
N = 1077 overall), is when asked to
49 convey where most likely to
Percent Responses
40 37 34 40 37 38 get information about ASD.
34 31 31
25 26 26 29 Across the last couple of
23
years and overall, the trends
across all groups, except
justice system personnel,
General Disability Support…
remain consistent with access
Autism Support Services
Autism Support Services
Internet
Autism Support Services
Autism Support Services
Professional Literature
Parents
Local Districts
Other Providers
Other Providers
State Conferences
Previous academic training
Other medical professionals
Previous academic training
to autism support services
(e.g., HANDS in Autism®,
ASI, IRCA) as one of their
top 3 choices. It remains the
top clear choice for school
personnel, more readily
reaching out to their
community resources.
School Family Medical Community Justice Potentially, this involvement
personnel member professional Provider system with the community autism
personnel resources could reflect
increased knowledge, access
Conducted by HANDS in Autism® Interdisciplinary Training & Resource Center, Indiana University School of Medicine with
support from The Family and Social Services Administration (FSSA), 2014-2016. For questions please contact Naomi Swiezy,
Ph.D., HSPP, Director, HANDS in Autism®, at nswiezy@iupui.edu. Page 9Indiana Autism Support Services Gap
Analysis
or satisfaction with such services in recent years. Family members of individuals with
ASD are still most likely to go to the internet for information and training about ASD and
community providers, with large caseloads are tending in this direction as well. Highlights
of potentially beginning changes include school personnel’s shift towards more literature,
perhaps given more training and messaging about the need for evidence-based strategies
and data-driven decision making. Medical professionals, however, are noted, at least in this
past year, to be less interested in gaining information through the literature and more from
other medical professionals or providers. Further, justice personnel are reporting seeking
out information from parents much more so than other resources. Overall, the trends from
the past year (2015-2016) reflect some progression away from getting resources and
information internally or relying upon past knowledge or training and more to professional
resources, families and the internet.
Average Rank for Training (2014-2016)
N = 1083
5
Average Rank
4
3
2
1
0
Despite the fact that trainings are often provided as online options, manualized treatments
or single day workshops, stakeholders across Indiana have a stated and continued
preference for more personalized (e.g., email and phone communications relevant to their
own scenarios) and in depth trainings (e.g., multiday workshops) than more traditionally
provided. Anecdotally, this information goes along with the routine requests for
information more practical and relevant to the stakeholder’s setting and situation.
Conducted by HANDS in Autism® Interdisciplinary Training & Resource Center, Indiana University School of Medicine with
support from The Family and Social Services Administration (FSSA), 2014-2016. For questions please contact Naomi Swiezy,
Ph.D., HSPP, Director, HANDS in Autism®, at nswiezy@iupui.edu. Page 10Indiana Autism Support Services Gap
Analysis
Areas of Least Knowledge by Subgroup
(2014-2016)
N = 953
5.5
4.5
Average Rank
3.5
2.5
1.5
0.5
pharmacological…
pharmacological…
transitions from school…
diversion alternatives…
-0.5
Developing a post-
Developing a post-
Developing a post-
Developing a post-
Developing a post-
Knowing what insurance
Knowing what insurance
Teaching with adapted
Providing peer training
Knowing what insurance
Knowing what insurance
Utilizing appropriate
Understanding
Understanding
coverage /financial…
coverage /financial…
coverage /financial…
coverage /financial…
Supporting effective
education plan
education plan
education plan
education plan
education plan
curriculum
in ASD
School personnel Family member Medical Community Justice system
professional Provider personnel
Though behavior, skills training, and data practices emerged as common themes in the
earlier version of the needs assessment survey, in the current year’s project, overriding
issues and areas of noted need for information include transition/post education planning
and insurance coverage. These areas align with areas of national prominence and are key
goal areas targeted for action in the Indiana Comprehensive State Plan. For more
information, the Comprehensive Plan can be retrieved at the State website:
http://www.in.gov/fssa/ddrs/3355.htm.
Conducted by HANDS in Autism® Interdisciplinary Training & Resource Center, Indiana University School of Medicine with
support from The Family and Social Services Administration (FSSA), 2014-2016. For questions please contact Naomi Swiezy,
Ph.D., HSPP, Director, HANDS in Autism®, at nswiezy@iupui.edu. Page 11Indiana Autism Support Services Gap
Analysis
Challenges Faced with ASD Individuals 2014-
2016
School personnel N = 642; Community provider N = 404
50
43.5 45
45
40
Percent Reported
35 29.7
30 26.2 25.7
25 School Personnel
20 15.8 Community Provider
15
10 5 4.5
5 2.3 2.3
0
Behavioral Funtional Academic Other N/A
Setting with Most Challenges 2014-2016
School personnel N = 334; Community provider N = 228
School personnel Community provider
64
Percent Responses
40
35 32 31
26
24
17 21 21 25 19 19
16 15 12 14 13
1311 11 15 8 9 7 11
65 3 5 4 4 4 5
When school personnel and community providers were asked about the challenges
they face when working with individuals with ASD they were most likely to face
behavioral challenges, but a significant number of those surveyed in both groups
also listed functional challenges (e.g., self-help, socialization, communication,
leisure/play skills). Additionally, both stakeholder groups listed unstructured
activities (e.g., play/leisure time, recess) most frequently as the setting in which they
face the most challenges.
Conducted by HANDS in Autism® Interdisciplinary Training & Resource Center, Indiana University School of Medicine with
support from The Family and Social Services Administration (FSSA), 2014-2016. For questions please contact Naomi Swiezy,
Ph.D., HSPP, Director, HANDS in Autism®, at nswiezy@iupui.edu. Page 12Indiana Autism Support Services Gap
Analysis
Barriers to Collaboration (2014-2016)
N = 1046
70
60
Percent Responses
50
40
30
20
10
0
Various stakeholder groups were in agreement with regards to the primary barriers
to collaboration. The top three noted included time, funding resources, and training
that entails learning practical information.
Conducted by HANDS in Autism® Interdisciplinary Training & Resource Center, Indiana University School of Medicine with
support from The Family and Social Services Administration (FSSA), 2014-2016. For questions please contact Naomi Swiezy,
Ph.D., HSPP, Director, HANDS in Autism®, at nswiezy@iupui.edu. Page 13Indiana Autism Support Services Gap
Analysis
SUBGROUP RESULTS:
FAMILY MEMBERS: N = 399
Out of 399 families responding state-wide, 83.5% of respondents identify as
Caucasian/European American and 80% of them have a college or graduate degree. 83%
described their role in the family as a biological parent, 8% as adoptive parent and others
included foster parents, legal guardians, grandparents as well as sibling, stepparent, and
aunt as their role.
Race/Ethnicity
1.5
of Respondent
0.6
1.8 0.9
1.2 African American
4.5
Asian/Pacific Islander
Caucasian/European
American
Latino/Hispanic
Native American
83.5
Other
Role in Family
Highest Level of
Some high Biological parent
Education school
5%
2% 2%
High School Adoptive parent
3%
2% graduate/GED
3% Vocational/Tech
6% nical School 8% Foster parent
6% Some college
Grandparent
College degree
26%
Some graduate 83% Legal Guardian
45%
studies
9% Graduate degree Other family
member
Other
Conducted by HANDS in Autism® Interdisciplinary Training & Resource Center, Indiana University School of Medicine with
support from The Family and Social Services Administration (FSSA), 2014-2016. For questions please contact Naomi Swiezy,
Ph.D., HSPP, Director, HANDS in Autism®, at nswiezy@iupui.edu. Page 14Indiana Autism Support Services Gap
Analysis
The annual household income was spread relatively evenly across potential responses as
follows:
Annual Household Income
9%
Under $20,000
28% $20,000-$39,000
16%
$40,000-$59,999
$60,000-$79,999
12% 20% $80,000-$99,999
$100,000 or above
15%
Just under half (44%) of the respondents listed the child as having been diagnosed with the
newer DSM-5 classification, Autism Spectrum Disorder (ASD) with approximately 48% of
respondents with some combination of the previous categories of ASD (i.e., Autistic
Disorder, Asperger’s Disorder, PDD-NOS) and 7% responding with an Other category.
Autism Spectrum Disorder
Primary Diagnosis (ASD)
Asperger's Disorder
1%
7% Autistic Disorder/Autism
18%
44% Pervasive Development
Disorder, Not Otherwise
Specified (PDD-NOS)
11% Childhood Disintegrative
Disorder
19%
Rhett's Disorder
Conducted by HANDS in Autism® Interdisciplinary Training & Resource Center, Indiana University School of Medicine with
support from The Family and Social Services Administration (FSSA), 2014-2016. For questions please contact Naomi Swiezy,
Ph.D., HSPP, Director, HANDS in Autism®, at nswiezy@iupui.edu. Page 15Indiana Autism Support Services Gap
Analysis
When asked if the individual had any other diagnoses, the top three responses were
Attention Deficit/Hyperactive Disorder (ADHD), anxiety disorder, and communication
disorder.
Top 3 Other Diagnoses
Diagnosis Frequency Percent
Attention Deficit/Hyperactivity Disorder 134 35%
Anxiety Disorder 164 42%
Communication Disorder 112 29%
74.1% of respondents said the individual had an educational classification of ASD in
addition to a medical diagnosis, and 16.9% of those individuals received the educational
classification prior to the medical diagnosis. In addition, for 17.6% of the individuals with
ASD, the educational classification was different than the medical diagnosis at one point.
The diagnosing medical professional was most often a psychologist (31%), 16% by a
psychiatrist and at least 38% by another category of medical doctor.
Developmental
Pediatrician
Professional that Provided
Medical Diagnosis Neurologist
1%
Primary Care Physician
(Family
14% Physician/Pediatrician)
21%
Psychiatrist
9% Psychologist
31%
8%
Other, please specify
16%
N/A
Conducted by HANDS in Autism® Interdisciplinary Training & Resource Center, Indiana University School of Medicine with
support from The Family and Social Services Administration (FSSA), 2014-2016. For questions please contact Naomi Swiezy,
Ph.D., HSPP, Director, HANDS in Autism®, at nswiezy@iupui.edu. Page 16Indiana Autism Support Services Gap
Analysis
Miles Traveled for
Diagnosis
0-20
Most individuals (55%) were able to
drive less than 40 miles for a
21-40
diagnosis, but 14% of respondents had
14% to drive more than 100 miles to get a
41-60
7%
diagnosis.
38%
61-80
11%
81-100
13%
17%
More than 100
miles
Almost all of the respondents said they were given other resources at the time of diagnosis,
but 13.7% were given no follow up resources. The most common follow-up resource was a
second appointment with the diagnosing professional. To pay for these services, 61.3% of
respondents claimed their private insurance was covering payment, though 41.8% of
individuals claimed they had to pay out-of-pocket for services.
Almost all of the individuals with ASD were living with parents in a family home (93%)
and less than 10% of ASD individuals were living in another facility. Fortunately, 70% of
respondents were very satisfied with the living arrangement of the individual with ASD.
Twenty-two percent (22%) of respondents claimed that the individual with ASD was
unemployed. 36% of respondents said that the individual with ASD had either full or part-
time employment.
When asked about long term plans for the individual with ASD, 35% claimed there was no
long term plan, and 18% were in the process of developing a plan. It would be important to
be assessing the age of the individuals with ASD that were the basis of this data to further
understand the context of these responses (e.g., too young for employment, still in school).
Conducted by HANDS in Autism® Interdisciplinary Training & Resource Center, Indiana University School of Medicine with
support from The Family and Social Services Administration (FSSA), 2014-2016. For questions please contact Naomi Swiezy,
Ph.D., HSPP, Director, HANDS in Autism®, at nswiezy@iupui.edu. Page 17Indiana Autism Support Services Gap
Analysis
With parent(s) in
Current Living Situation
family home
Satisfaction with Current
Residential
Arrangement
2%1% 2%
facility 2%
2%
5% 2%
With other
relative(s) in Very Satisfied
family home
Group home Satisfied
21%
Dissatisfied
Lives on own Very Dissatisfied
93% 70%
with support
Missing
Lives on own
without support
Long-term Plans for ASD Individual's Current
Individual Employment Status
40 Yes, full-time
Percent Responses
35
30
25
20 14% Yes, part-time
20%
15
10
5 No, but currently
0 22%
looking for a job
42% No, I am retired
2%
No
When asked about the therapies the child was receiving, it appeared that if the child needed
therapy, there was a greater percentage of individuals who were able to receive it than not;
however, approximately 20% of responses for each category of therapy were noted as not
being received but in need of such therapies and/or services. This was particularly the case
for job readiness/transition planning with over half of the respondents (52.2%) indicating
the need for the service but only 16% of all respondents indicating that it was in place.
Conducted by HANDS in Autism® Interdisciplinary Training & Resource Center, Indiana University School of Medicine with
support from The Family and Social Services Administration (FSSA), 2014-2016. For questions please contact Naomi Swiezy,
Ph.D., HSPP, Director, HANDS in Autism®, at nswiezy@iupui.edu. Page 18Indiana Autism Support Services Gap
Analysis
Is Individual with ASD receiving interventions for the following?
Yes, and Yes, but No, and No, but
Therapy needs it doesn't need it needs it doesn't need it
Functional Skills 69.1% 0.2% 24.6% 6.5%
Daily Living 39.1% 2.1% 22.7% 36.8%
Problem Behaviors 39.9% 1.0% 22.1% 38.3%
Depression 18.1% 0.7% 11.9% 69.4%
Anxiety 35.1% 0.5% 25.9% 38.9%
Obsessive-
Compulsive Disorder 20.4% 2.3% 21.6% 56.0%
Job Readiness 16.1% 0.2% 36.1% 48.2%
With regards to therapy locations, most therapies occur out of school or are not occurring
(perhaps dependent on the age of the child). The one exception is with functional skills
that are most regularly (approximately 21%) taking place about equally in, out or in both
school and out of school forums.
If receives therapy, where therapy takes place
80
70
Percent Responses
60 At School
50
40 Out of School
30
Both
20
10 N/A
0
Conducted by HANDS in Autism® Interdisciplinary Training & Resource Center, Indiana University School of Medicine with
support from The Family and Social Services Administration (FSSA), 2014-2016. For questions please contact Naomi Swiezy,
Ph.D., HSPP, Director, HANDS in Autism®, at nswiezy@iupui.edu. Page 19Indiana Autism Support Services Gap
Analysis
Top 3 Perceived Limitations to Accessing Care
Limitation Average Percent
None 38.5
Cost of services/insurance does not cover
available services 23.5
Shortage of service providers in the area 23.4
38.5% of families responding do not feel that there are limits to accessing care. However,
for those who do, the limitations most often cited were cost/lack of insurance coverage, or
a shortage of service providers in the area.
Similarly and as noted below, the limitations most notable for accessing family supports
and specialty care include the cost/lack of insurance coverage and shortage of service
providers in the area. However, an added limit to access were scheduling issues.
Top 3 Limits to Accessing Family Support Services
Limitation Frequency Percent
Cost of services/insurance does not cover available services 130 34.1
Scheduling issues 95 27.1
Shortage of service providers in the area 26 44.8
Top 3 Limits to accessing specialty health and education services
Limitation Frequency Percent
Shortage of service providers in the area 161 45.1
Cost of services/insurance does not cover
available services 165 43.7
Scheduling issues 90 24.7
Family members most commonly consulted the internet for both information resources
and materials as well as for training; they also listed autism support services as the second
most common source for information and training. Not surprisingly, their top three
preferences for training were community-based coaching and mentoring, the internet, and
partial day conferences or workshops.
Conducted by HANDS in Autism® Interdisciplinary Training & Resource Center, Indiana University School of Medicine with
support from The Family and Social Services Administration (FSSA), 2014-2016. For questions please contact Naomi Swiezy,
Ph.D., HSPP, Director, HANDS in Autism®, at nswiezy@iupui.edu. Page 20Indiana Autism Support Services Gap
Analysis
Top 3 Sources for Information
Source Frequency Percent
Internet 246 64.8
Autism support services 211 51.6
General disability support networks 160 41.7
Top 3 Sources for Training
Source Frequency Percent
Internet 113 27.1
Other providers 100 26.5
Autism support services 99 23.6
Top 3 Training Preferences
Type Average rank
Web 3.15
Community-based coaching and mentoring 3.15
Partial day conference/workshop 3.21
When asked who they most often collaborate with, families were most likely to collaborate
with other families or medical professionals, and least likely to collaborate with justice
system personnel. The top 3 barriers they listed for collaboration are time, funding
resources, and training that provides practical information.
Top 3 Barriers to Collaboration
Barrier Frequency Percent
Time 180 49.3
Funding Resources 167 46.6
Training w/ practical info 21 43.1
Conducted by HANDS in Autism® Interdisciplinary Training & Resource Center, Indiana University School of Medicine with
support from The Family and Social Services Administration (FSSA), 2014-2016. For questions please contact Naomi Swiezy,
Ph.D., HSPP, Director, HANDS in Autism®, at nswiezy@iupui.edu. Page 21Indiana Autism Support Services Gap
Analysis
Family members felt they had the most knowledge in understanding characteristics and
learning styles of individuals with ASD, explaining the disorder to family and friends, and
understanding early signs of the disorder. They felt they were least knowledgeable on
utilizing appropriate diversion alternatives, supporting effective transitions from school to
vocation, and developing a post-education plan. When asked which areas they would like
more information, the top three responses were understanding laws and policy related to
ASD, knowing what insurance/financial support options are available and what services
they cover, as well as effectively advocating for the individual with ASD.
Top 3 Areas for More Info
Area Frequency Percent
Understanding laws and policy related to ASD 197 55.5
Knowing what insurance/financial support options
are available and what services they cover 171 49.3
Effectively advocating for individual with ASD 169 46.9
INDIVIDUALS WITH ASD: N = 18
Of the individuals with ASD who participated in the survey (n=18), 11% had graduated
high school, 44% had not graduated, and 45% had not graduated but would like to be a
graduate.
Highest Level of Education
High school
Two year school
11% Four year school
Graduate school
44%
Vocational/technical
school
45% No, but I would like
to be
No
Of those responding, 61% had never been married, 22% were married and 17% were
divorced. Almost half (45%) had children or were interested in doing so.
Conducted by HANDS in Autism® Interdisciplinary Training & Resource Center, Indiana University School of Medicine with
support from The Family and Social Services Administration (FSSA), 2014-2016. For questions please contact Naomi Swiezy,
Ph.D., HSPP, Director, HANDS in Autism®, at nswiezy@iupui.edu. Page 22Indiana Autism Support Services Gap
Analysis
What is your current marital status?
Status Frequency Percent
Married 4 22
Separated/Divorced 3 17
Never been married 11 61
Do you have any children?
Children Frequency Percent
Yes 5 28
No, but planning on having them 3 17
No, undecided 4 22
No, and I don't want children 6 33
When asked about employment, 55% of respondents were currently unemployed (44%
unemployed or looking, 11% retired). Only 28% were employed full time.
Employment Status
Yes, full-time
Yes, part-time
28%
39% No, but currently
looking for a job
No, I am retired
17%
11% 5% No
In searching for employment, most common resources included the internet, word of
mouth, and newspaper.
Top 3 Ways to Look for Work
Area Frequency Percent
Internet 14 78
Word of Mouth 8 44
Newspaper 6 33
Conducted by HANDS in Autism® Interdisciplinary Training & Resource Center, Indiana University School of Medicine with
support from The Family and Social Services Administration (FSSA), 2014-2016. For questions please contact Naomi Swiezy,
Ph.D., HSPP, Director, HANDS in Autism®, at nswiezy@iupui.edu. Page 23Indiana Autism Support Services Gap
Analysis
Individuals felt discriminated against in a variety of ways (i.e., skills underutilized, without
appropriate compensation/promotions/raises or support, and only 1 respondent claimed to
feel no discrimination. Only 22% of those responding indicated that all at their place of
employment know of their disability. All others had only shared with a subset or do not
feel comfortable sharing.
Do you feel discriminated against in the workplace?
Discrimination Frequency Percent
My skills are underused 4 28.6
I don't receive appropriate compensation 2 14.3
I don't receive promotions/raises 1 7.1
I don't receive appropriate accommodations or
support 3 21.4
None 1 7.1
Other 3 21.4
Coworkers aware of autism?
Awareness Frequency Percent
Yes, everyone knows 2 22.2
Yes, but only my supervisors know 2 22.2
Yes, but only my peers/coworkers know 2 22.2
No, I don't feel comfortable sharing 3 33.3
Individuals with ASD responding to this survey between 2014-2016 engage in a number of
activities but the top three include household chores/duties, hobbies or special interests and
volunteering. Only 50% transport independently (i.e., drive or public transport) to
work/school while approximately 33% depend on others.
Top 3 Activities
Activities Frequency Percent
Household chores/duties 17 94.4
Hobbies or special interest 15 83.3
Volunteer 11 61.1
Travel to work, school, etc.
Method Frequency Percent
Drive myself or use public transportation on my own 9 50
Depend on family member or friend for support 5 27.7
Use transportation provided by school or work 1 5.5
Conducted by HANDS in Autism® Interdisciplinary Training & Resource Center, Indiana University School of Medicine with
support from The Family and Social Services Administration (FSSA), 2014-2016. For questions please contact Naomi Swiezy,
Ph.D., HSPP, Director, HANDS in Autism®, at nswiezy@iupui.edu. Page 24Indiana Autism Support Services Gap
Analysis
Autism Spectrum Disorder was listed as the most common primary diagnosis, and 75% of
respondents said they were also diagnosed with depression.
Primary Diagnosis
Autism Spectrum
Disorder
6%
6% Asperger's Disorder
49%
Pervasive
39%
Development
Disorder, not
otherwise specified
(PDD/NOS)
Other
Other Diagnosis
78
Percent Responses
50 50
39
33
17 22 17
11 11
Conducted by HANDS in Autism® Interdisciplinary Training & Resource Center, Indiana University School of Medicine with
support from The Family and Social Services Administration (FSSA), 2014-2016. For questions please contact Naomi Swiezy,
Ph.D., HSPP, Director, HANDS in Autism®, at nswiezy@iupui.edu. Page 25Indiana Autism Support Services Gap
Analysis
The top three limits to accessing services were noted to be shortage of service providers and
the cost of those services though scheduling was also noted. Services were most commonly
paid for out-of-pocket and through state-funded processes.
Limitations to Accessing Services
Limitation Frequency Percent
Cost of services/My insurance does not cover
available services 7 39
Shortage of service providers 7 39
Other 5 28
No service providers in the area 4 22
How are services paid for
Payment method Frequency Percent
Out-of-pocket 5 28
State-funded processes 5 28
Private health insurance 3 17
Medicaid 3 17
I don't know 2 11
Other 1 6
N/A 1 6
Individuals were receiving a variety of treatments as reflected in the chart below:
Specialty health and education needs
I am
I am I am not
receiving, I am not
Category I am receiving receiving, but receiving,
but do not receiving
need more but need
need
Mental health counseling 29.2 0 0 20.9 50
Speech/language therapy 12.5 0 4.2 8.4 75
Occupational therapy 4.2 0 0 29.2 66.7
Physical therapy 0 4.2 0 41.7 50
Social skills training 16.7 4.2 0 37.5 41.7
One-to-one support 16.7 0 0 29.2 54.2
Behavior intervention 16.7 0 0 8.4 75
Case management 29.2 0 0 16.7 54.2
Medication management 29.2 12.5 0 4.2 54.2
Conducted by HANDS in Autism® Interdisciplinary Training & Resource Center, Indiana University School of Medicine with
support from The Family and Social Services Administration (FSSA), 2014-2016. For questions please contact Naomi Swiezy,
Ph.D., HSPP, Director, HANDS in Autism®, at nswiezy@iupui.edu. Page 26Indiana Autism Support Services Gap
Analysis
Summer camp 0 4.2 0 8.4 87.5
Summer school 12.5 0 0 0 70.9
Relationship counseling 0 0 0 29.2 70.9
Drug and alcohol counseling 0 0 0 4.2 95.9
Case management 12.5 0 12.5 16.7 58.4
Vocational training 0 0 12.5 25 75
Transition planning 0 0 12.5 12.5 75
Supported employment 0 0 0 16.7 83.4
Career counseling 4.2 0 0 33.3 62.5
SCHOOL PERSONNEL: N = 379
Of the 379 school personnel surveyed, most respondents (94%) described themselves as
Caucasian or European American. 71% of respondents listed a graduate degree as their
highest level of education.
Race/Ethnicity
1%
0%
2% 1% African American
1% 1%
The largest portion of respondents work in
Asian/Pacific central/eastern Indiana (38%), 33% in the
Islander
Caucasian/Europ southern region and 28% in the northern
ean American region, demonstrating adequate diversity and
Latino/Hispanic representation of these informants.
94% N/A
Native American
Conducted by HANDS in Autism® Interdisciplinary Training & Resource Center, Indiana University School of Medicine with
support from The Family and Social Services Administration (FSSA), 2014-2016. For questions please contact Naomi Swiezy,
Ph.D., HSPP, Director, HANDS in Autism®, at nswiezy@iupui.edu. Page 27Indiana Autism Support Services Gap
Analysis
45.6% of respondents describe their role as a special education teacher primarily in
elementary school, but 28.8% of respondents work across all school-age education levels
with all levels with reasonably similar representation. Fewer respondents were noted to
work in other school personnel positions or in post-secondary work.
Primary Role School Level
45.6 38 36.2
Percent Responses
Percent Responses
27.5 28.8
23.6
13.912.5 16.6
13.2 13.5
8.8 8.3 5.4
5.4 5.1 4.9 2.4
0.15
District-level…
Building-level…
University…
Special education…
General…
Related service…
Paraprofessional
Other
Consultant
Support staff
School nurse
School psychologist
90% of those
responding work in
public schools Indiana Region
Northwest
indicating the need for 7%
insight from those in
charter, private schools Northeast
8%
and/or other teaching Southeast
settings (e.g., ABA 13%
centers). Most (69%) North
of informants having Southwest Central
over 60% of their 20% 13%
caseload as students
with ASD. East
4%
Central
35%
Conducted by HANDS in Autism® Interdisciplinary Training & Resource Center, Indiana University School of Medicine with
support from The Family and Social Services Administration (FSSA), 2014-2016. For questions please contact Naomi Swiezy,
Ph.D., HSPP, Director, HANDS in Autism®, at nswiezy@iupui.edu. Page 28Indiana Autism Support Services Gap
Analysis
School Setting Percent of Students with
Public school Charter school Other ASD
4% 6% 2% 5%
0-20%
9% 21-40%
17% 41-60%
67% 61-80%
90%
81-100%
The top educational setting served by respondents is the general education classrooms.
67.4% of respondents answered that they work with ASD students daily. They experienced
a variety of challenges in a number of settings, but primarily in unstructured activities,
group activities, and independent work. A large number of respondents claimed that they
face behavioral challenges, functional and academic challenges.
Educational Setting How Often Interact
60 53.15 with ASD Students
50
37.25 70 63.3
40 32.4
60
30
18.4 50
20
5.65 40
10 4.1 24.75
30
0 20
5.6 7.3
10 0.2
0
Conducted by HANDS in Autism® Interdisciplinary Training & Resource Center, Indiana University School of Medicine with
support from The Family and Social Services Administration (FSSA), 2014-2016. For questions please contact Naomi Swiezy,
Ph.D., HSPP, Director, HANDS in Autism®, at nswiezy@iupui.edu. Page 29Indiana Autism Support Services Gap
Analysis
While school personnel utilized a variety of different sources for information and materials
on ASD, the top three responses were autism support services, professional literature, and
local districts’ autism teams and/or consultants. As such school personnel are working as
collaborative partners with collaborations inside and out of the school.
Top 3 Sources for Info
Source Frequency Percent
Autism Support Services 196 40%
Professional Literature 154 31%
Local District(s)' Autism Teams 139 28%
Training sources were most commonly noted as state conferences, support services and
local districts’ autism teams and/or consultants. Preferences for training format were
indicated to be partial day workshops, followed by full day workshops and onsite coaching
and mentoring. Barriers to training were listed as funding resources, time, and class
coverage as their top three barriers.
Top 3 Sources for Training
Source Frequency Percent
State Conferences 143 0.40
Autism Support Services 116 0.33
Local District(s)' Autism Teams 107 0.27
Top 3 Training Preferences
Source Rank
Partial day workshop 2.46
All day workshop 2.86
Onsite coaching and mentoring 2.99
Top 3 Barriers to Training
Barrier Frequency Percent
Funding Resources 245 0.43
Time 204 0.36
Staff class coverage 123 0.22
When queried about the various required services in their district, many of the school
personnel said their district was required to provide full services. However, when asked
about various services available, respondents were most confident that their district had the
capacity to deliver related services, special transportation and paraprofessional supports.
However, they were less confident that capacity existed to provide opportunities for outside
consultation/training, low student to teacher rations or ongoing internal training and
support.
Conducted by HANDS in Autism® Interdisciplinary Training & Resource Center, Indiana University School of Medicine with
support from The Family and Social Services Administration (FSSA), 2014-2016. For questions please contact Naomi Swiezy,
Ph.D., HSPP, Director, HANDS in Autism®, at nswiezy@iupui.edu. Page 30Indiana Autism Support Services Gap
Analysis
What capacity does your district have to provide if needed?
Service Full Partial Some None Missing
Related Services 0.667 0.165 0.1355 0.013 0.029
Special Transportation 0.7855 0.072 0.0555 0.0615 0.0255
Outside Consultation/Training 0.204 0.29 0.311 0.166 0.0395
Paraprofessionals 0.491 0.318 0.1505 0.0235 0.027
Low Student/Teacher Ratio 0.1915 0.396 0.1875 0.0965 0.0635
On-Going Training/Support (from internal
staff) 0.2445 0.3465 0.3045 0.073 0.042
When asked about discipline policies, positive/proactive policies, school wide positive
behavior supports, and response to instruction processes, most of the respondents believed
these to be somewhat effective, if not better.
Discipline Policy Effectiveness
Effectiveness Frequency Percent
Very effective 39 0.15
Somewhat effective 183 0.71
Makes no difference 12 0.05
Somewhat ineffective 18 0.07
Very ineffective 7 0.03
Effectiveness of positive/proactive strategies
Effectiveness Frequency Percent
Very effective 39 18.4%
Somewhat effective 164 77.4%
Makes no difference 6 2.8%
Somewhat ineffective 1 0.5%
Very ineffective 2 0.9%
Effectiveness of SWPBS
Effectiveness Frequency Percent
Very effective 30 0.20
Somewhat effective 106 0.72
Makes no difference 7 0.05
Somewhat ineffective 3 0.02
Very ineffective 2 0.01
Conducted by HANDS in Autism® Interdisciplinary Training & Resource Center, Indiana University School of Medicine with
support from The Family and Social Services Administration (FSSA), 2014-2016. For questions please contact Naomi Swiezy,
Ph.D., HSPP, Director, HANDS in Autism®, at nswiezy@iupui.edu. Page 31Indiana Autism Support Services Gap
Analysis
Effectiveness of RtI
Effectiveness Frequency Percent
Very effective 46 22.7%
Somewhat effective 134 66.0%
Makes no difference 13 6.4%
Somewhat ineffective 7 3.4%
Very ineffective 3 1.5%
Of the school personnel surveyed, they most often collaborated with colleagues and
families to implement best practices methods, and they were least likely to collaborate with
justice system personnel. The top three barriers they listed to collaboration are time,
funding resources, and training with practical information.
Top 3 Barriers to Collaboration
Barrier Frequency Percent
Time 226 0.46
Funding 165 0.34
Training with Practical Information 101 0.21
School personnel were also asked to rank how much knowledge they felt they had in certain
areas. They felt that they had the most knowledge in understanding the characteristics and
learning styles of individuals with ASD as well as the more proactive strategies of
providing visual structure and support, and using positive behavioral support methods. On
average, they felt they had the least amount of knowledge in insurance coverage or financial
support options available and what services are covered as well as understanding of
pharmacological interventions and generally developing post education plans. The three
most acknowledged areas for needing more information were understanding ASD laws and
policy, accessing appropriate mental health services, and providing support and training to
others about ASD.
Top 3 Areas of Knowledge
Area Average Rank
Understanding general characteristics and learning styles of individuals
with ASD 2.25
Using positive behavioral supports 2.35
Providing visual structure and supports 2.5
Conducted by HANDS in Autism® Interdisciplinary Training & Resource Center, Indiana University School of Medicine with
support from The Family and Social Services Administration (FSSA), 2014-2016. For questions please contact Naomi Swiezy,
Ph.D., HSPP, Director, HANDS in Autism®, at nswiezy@iupui.edu. Page 32You can also read