2020 CAN NEWS HELP MEASURE ECONOMIC SENTIMENT? AN APPLICATION IN COVID-19 TIMES - Documentos de Trabajo - Banco de ...
←
→
Page content transcription
If your browser does not render page correctly, please read the page content below
CAN NEWS HELP MEASURE ECONOMIC
SENTIMENT? AN APPLICATION
                                                2020
IN COVID-19 TIMES

Documentos de Trabajo
N.º 2027

Pablo Aguilar, Corinna Ghirelli, Matías Pacce
and Alberto Urtasun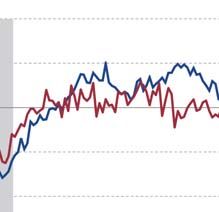
CAN NEWS HELP MEASURE ECONOMIC SENTIMENT? AN APPLICATION
IN COVID-19 TIMES
CAN NEWS HELP MEASURE ECONOMIC SENTIMENT?
AN APPLICATION IN COVID-19 TIMES

Pablo Aguilar, Corinna Ghirelli, Matías Pacce and Alberto Urtasun (*)
BANCO DE ESPAÑA

(*) We thank Silvia Albrizio, Ángel Gavilán, José González, Danilo Leiva-León, Eva Ortega, Javier Pérez, and
Diego Torres for their comments and suggestions. We also thank all participants at the internal seminar of the
Banco de España for their comments. The views expressed in this paper are our own and do not necessarily
reflect the views of the Banco de España or the European System of Central Banks (ESCB). E-mail addresses:
pablo.aguilar@bde.es (P. Aguilar), corinna.ghirelli@bde.es (C. Ghirelli), matias.pacce@bde.es (M. Pacce),
aurtasun@bde.es (A. Urtasun)

Documentos de Trabajo. N.º 2027
2020
The Working Paper Series seeks to disseminate original research in economics and finance. All papers
have been anonymously refereed. By publishing these papers, the Banco de España aims to contribute
to economic analysis and, in particular, to knowledge of the Spanish economy and its international
environment.

The opinions and analyses in the Working Paper Series are the responsibility of the authors and, therefore,
do not necessarily coincide with those of the Banco de España or the Eurosystem.

The Banco de España disseminates its main reports and most of its publications via the Internet at the
following website: http://www.bde.es.

Reproduction for educational and non-commercial purposes is permitted provided that the source is
acknowledged.

© BANCO DE ESPAÑA, Madrid, 2020

ISSN: 1579-8666 (on line)
Abstract

We construct a new newspaper-based sentiment indicator for Spain that allows us to
monitor Spanish economic activity in real-time. As opposed to the traditional survey-
based confidence indicators that are released at the end of the month, our indicator can
be constructed on a daily basis and updated in real-time. We compare our proposed
index with the popular Economic Sentiment Indicator of the European Commission,
and we show that ours performs significantly better in nowcasting the Spanish GDP.
In addition, our indicator proves to be helpful in order to predict the current COVID-19
recession from an earlier date. All in all, our indicator performs similarly to or even
outperforms other soft indicators, with the advantage of being updated daily. Thus, it
provides a valuable option when measuring the confidence in the economy.

Keywords: nowcasting, GDP, recession, real-time, textual analysis, sentiment indicators,
soft indicators.

JEL classification: E32, E37, C53, C23.
Resumen

Se propone un nuevo indicador de sentimiento basado en noticias de periódicos que
permite analizar, en tiempo real, la evolución de la actividad económica en España.
A diferencia de los indicadores de confianza tradicionales que se publican a fin de mes,
nuestro indicador puede construirse con frecuencia diaria y actualizarse en tiempo real.
Se compara el nuevo indicador con el indicador de sentimiento económico que publica
la Comisión Europea, y se obtiene una mejora significativa al incluirlo en un modelo de
previsión de crecimiento de corto plazo del PIB, respecto a la previsión que se obtiene
cuando se utiliza el índice tradicional. Asimismo, nuestro indicador identifica la recesión
económica causada por el Covid-19 con una mayor anticipación. En conjunto, el nuevo
indicador tiene un desempeño similar al de otros indicadores cualitativos, o incluso los
mejora, con la ventaja de que puede actualizarse diariamente. Por todo ello, el índice
propuesto surge como una alternativa valiosa para medir la confianza en la evolución
de la economía.

Palabras clave: previsión a corto plazo, PIB, recesión, tiempo real, análisis textual,
indicadores de sentimiento, indicadores cualitativos.

Códigos JEL: E32, E37, C53, C23.
1            Introduction

          Benchmark data to assess activity are normally provided by the national accounts and are
          available at a quarterly frequency. Nevertheless, there usually exists a significant publication
          lag of, typically, at least 30 days after the quarter of reference has ended. More timely data
          is usually published in the form of economic indicators, both covering quantitative information
          (so-called “hard” indicators) and qualitative information provided by agent surveys of sentiment
          and plans (so-called “soft” indicators). These standard leading indicators, used by practitioners
          and academics alike, are typically available with a short delay, and are available at a monthly
          frequency (see Giannone et al., 2009 or Keeney et al., 2012). Technological progress has enabled
          the development of other sources of data usable for monitoring real-time economic activity, in
          particular, indicators based on textual analysis, including news media (see Shapiro et al., 2020,
          Thorsrud, 2016, 2020 and many others). Following this line of research, this paper proposes a
          new daily economic news sentiment indicator (DENSI) based on newspaper data for Spain as an
          alternative measure of economic confidence, which can be constructed at daily frequencies and
          it is shown to better help the nowcasting of Spanish GDP growth than a widely used popular
          confidence indicator —i.e. the Economic Sentiment Indicator (ESI)1 published by the European
          Commission (EC)—. To construct our measure we rely on Boolean searches,2 which boils down
          to counting the frequencies of specific words in the text, a quite popular procedure in the recent
          literature: for instance, see the influential economic policy uncertainty (EPU) index by Baker
          et al. (2016).3
                      Our indicator, as it is the case for many other textual based indicators, could potentially be
          interpreted as a measure of economic confidence and, therefore, compared with other confidence
          indicators, which are mostly survey-based. Survey-based confidence indicators are probably
          among the most useful soft indicators available to make an assessment of the general economic
          situation. They reflect agents’ perceptions regarding the present and future economic situation.
          Indeed, for each particular country, confidence indicators are highly correlated with GDP growth
          (e.g. see the ESI). However, the COVID-19 crisis has put some of these indicators’ weaknesses
          in the spotlight.

                  1
                      The ESI is built as a composite of five different confidence indicators using the following weights: 40% for
          industry, 5% for construction, 30% for services, 20% for consumers, 5% for retail.
             2
               Alternatively, it would be possible to rely on natural language processes in order to extract the “sentiment”
          or the topics characterizing the news (e.g., Shapiro et al., 2020, Thorsrud, 2020, 2016).
             3
               Following this procedure, a number of EPU indexes have been developed for many countries (e.g. Ghirelli
          et al., 2019 for Spain) and has been used in a number of empirical applications (e.g. Colombo, 2013, Caggiano
          et al., 2017, Fontaine et al., 2017, Meinen and Roehe, 2017).

BANCO DE ESPAÑA        7   DOCUMENTO DE TRABAJO N.º 2027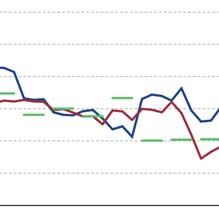
First, most confidence indicators rely on surveys that are conducted during (at most) the
first part of the reference month (for instance the ESIs surveys are carried out in the first three
weeks of the reference month),4 while results are released during the last week of that month. In
general, this strategy would not cause any problem, but if a significant shock occurs during the
second half of the month, the confidence indicators would not reflect it (Shapiro et al., 2020).
Second, as for any survey, its accuracy largely depends on the survey’s responses rates and,
when these are not high enough, potential sampling problems can emerge, especially during some
particular situations (Ludvigson, 2004). Both of these problems have simultaneously emerged
during the COVID-19 outbreak, given it started to affect most European countries during the
second half of March and due to the difficulty of carrying out the surveys during the lockdown.
This situation became evident in the ESI release for March 2020. For instance, the value of the
ESI for March did not reflect the pandemic crisis outbreak that started in the middle of the
month,5 but instead remained at the optimistic levels reached in the previous months (see the
March 2020 observation in the blue line in Figure 1). Moreover, for the case of Italy, the EC
announced that no data could be collected for the month of April due to the strict confinement
measures.
A third issue is that survey-based confidence indicators can show some specific bias along
the business cycle. According to Gayer and Marc (2018), this could happen, for example, if
business managers and consumers adapt their economic expectations to a more modest growth.
Such a bias became evident at the end of the Great Recession, when average economic growth
was significantly lower than that observed during the pre-crisis period but the ESI stood at
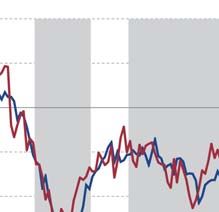
similar average levels in both periods.6 This bias is evident in Figure 1: from 2015, the ESI
frequently had values in the 75–90th percentile of its own distribution, probably being over-
optimistic. Figure 1 also confirms that this bias is not present in our proposed indicator. Its
dynamics, instead, correctly reflect the moderate growth of the GDP during the last recovery,
as opposed to that observed in the pre-crisis period. A reason for the presence of this bias
in survey-based indicators may be the possibility that respondents base their perceptions of
the economic situation on a cross-section comparison, i.e., ignoring the historical perspective.
In contrast, when journalists write an article about the economic situation of a country, they
4
For example, during the month of March 2020, the ESI surveys of consumers, the service sector, and the retail
sector were carried out between the 2nd and the 12th of March, while the surveys of the industry sector and the
construction sector were carried out between the 2nd and the 23rd of March.
5
Spain was locked down on the 14th of March 2020.
6
The average annual GDP growth rate between 2000 and 2007 was around 3.7% and diminished to 2.6% during
the 2014–2019 period. Analyzing the same periods, the average levels for the ESI were, respectively, 105.5 and
106.3 points.
BANCO DE ESPAÑA 8 DOCUMENTO DE TRABAJO N.º 2027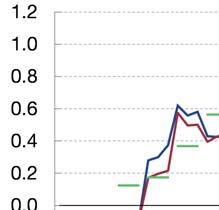
typically make an historical assessment, which may explain why our news-based indicator does
          not show such a bias.
                  Dealing with these weaknesses, our proposed indicator based on newspaper articles emerges
          as an alternative confidence indicator, especially since the COVID-19 pandemic crisis. News-
          paper articles may be a useful data source for constructing confidence indicators to assess the
          current economic situation, for two main reasons: first, the press (especially financial newspa-
          pers or the economic sections of generalist newspapers) provides a daily picture of the economic
          developments of a country; second, since newspapers are published every day, this allows con-
          structing real-time indicators at high (daily) frequencies. Finally, text-based sentiment measures
          can be developed at a very low cost relative to survey-based measures.
                  When proposing the new confidence indicator, we will focus on the Spanish case. Therefore,
          we rely on a large database of Spanish press and construct a sentiment indicator that reflects the
          economic tone of news articles in the short-run. In a nutshell, our indicator reflects the balance
          between the number of news articles that contain keywords related to upturns and downturns
          of the Spanish business cycle. The new proposed indicator closely follows the dynamics shown
          by the ESI. Nonetheless, in contrast to the ESI, in March 2020 the DENSI drops to the level
          of the Great Recession, which appears to be a more correct description of the economic outlook
          given the start of the pandemic crisis.
                  In order to analyze whether the DENSI could do a better job than survey-based confi-
          dence indicators regarding the assessment of the current economic situation, we perform two
          different—but related—exercises. First, relying on mixed-frequency bivariate vector autoregres-
          sive (MF-BiVAR) models, we show that a model including both the DENSI and GDP signifi-
          cantly improves the GDP forecast accuracy when compared to a model that includes the ESI
          and GDP as the main variables. This result suggests that the DENSI could provide a better
          signal for an earlier evaluation of the economic situation than the ESI. Second, we use both
          indicators to compute the implied probability of recessions at short-term horizons. Result show
          that the DENSI does better than the ESI in predicting the business cycle turning points in the
          short-run.
                  A number of papers have constructed text-based measures of economic activity. The latter
          are becoming increasingly popular because they are real time measures (Shapiro et al., 2020).
          E.g., Calomiris and Mamaysky (2019) use news articles to predict risk and return in stock mar-
          kets, while Fraiberger (2016) constructs a sentiment index based on the economic news articles
          produced by Reuters. Nyman et al. (2018) exploit financial market text-based data to predict
          financial system distress. Thorsrud (2020, 2016) show that the information contained in the
          main Norwegian business newspapers articles improves the GDP nowcast. Our paper is closely

BANCO DE ESPAÑA   9   DOCUMENTO DE TRABAJO N.º 2027
related to Combes et al. (2018) and Shapiro et al. (2020). The first authors, who focused on
          France, construct a sentiment indicator of economic activity based on news published in Le
          Monde, the main generalist French newspaper, and show that the index helps to improve the
          short-term GDP forecast and nowcast. In particular, their textual indicator improves forecast-
          ing compared to a simple autoregressive model and an autoregressive model augmented with
          the survey-based Insee Business Climate indicator.7 Shapiro et al. (2020) develop an indicator
          of economic sentiment based on economic and financial newspaper articles and show that daily
          news sentiment is predictive of movements of survey-based measures of consumer sentiment.
          In particular, they estimate impulse responses of the main macroeconomic variables to shocks
          in economic sentiment and find that positive shocks in economic sentiment increase consump-
          tion, output, and interest rates, whereas they dampen inflation. Therefore, they claim that
          newspaper-based sentiment indicators provide useful signals of economic activity at a very low
          cost relative to survey-based measures.
                  We contribute to this literature by proposing a new newspaper-based sentiment indicator
          for Spain, which could be obtained on a daily basis at any point during the month. Moreover,
          we provide evidence that newspaper-based indicators can better deal with the aforementioned
          limitations, which are typical of survey-based confidence indicators (i.e., (i) the monthly value
          refers only to the first half of each month; (ii) potential sampling problems due to a lower
          response rate; (iii) potential bias along business cycles). Finally, in line with the previously
          mentioned literature, we also show that newspaper-based confidence indicators can improve
          classical confidence indicator measures when assessing more recent economic developments.
                  The rest of the paper is organized as follows. In Section 2, we describe our DENSI. Section
          3 presents two empirical applications in which we compare the predictive power of the ESI and
          the DENSI. Section 4 offers some concluding remarks.

          2        Description of the index

          We build a sentiment indicator capturing the economic tone of news articles published in the
          Spanish press. In a nutshell, our indicator reflects the balance between the number of news
         articles that contain keywords related to upturns and downturns in the Spanish business cycle.
                  We consider 7 relevant Spanish national newspapers: El Paı́s, El Mundo, La Vanguardia,
         ABC, Expansión, Cinco Dı́as, and El Economista. The first 4 newspapers are the largest and
         most-read generalist newspapers in Spain, while Expansión, Cinco Dı́as, and El Economista
         are the three main Spanish business newspapers. We focus on the printed editions of these

              7
                  This indicator is equivalent to the ESI for France.

BANCO DE ESPAÑA   10   DOCUMENTO DE TRABAJO N.º 2027
Figure 1: Comparison between the economic sentiment indicator (ESI) and the daily economic
news sentiment indicator (DENSI)
ESI DENSI
Note: Monthly frequencies. The x-axis shows years from 2000 to 2020. The y-axis shows the unit of measurement
(points) of the ESI (100 points, on average) and of the DENSI (0 points, on average).
newspapers and ignore the online versions. Our decision is supported by two arguments: first,
online editions have become more widespread only in the most recent years, while we consider
quite a substantial time span. Ignoring the digital press ensures homogeneity in our index.
Second, printed newspapers ensure meeting standards in terms of the quality and relevance of
the news since editors select the articles to be published in the printed version of the newspaper
given space limitations.
Our main indicator is monthly. However, one advantage of relying on newspapers articles is
that one can construct indicators at higher (daily) frequencies. All searches are carried out using
the Dow Jones’ Factiva service. For each newspaper, we conduct queries from the first month
the newspaper is collected in the Dow Jones’ Factiva database, starting from January 1997. We
restrict all queries to the following articles: (i) articles in the Spanish language; (ii) articles
with content related to Spain, based on Factiva’s indexation; (iii) articles about corporate or
industrial news, economic news, or news about commodities or financial markets, according to
Factiva’s indexation. We then perform three types of queries.
First, we count the number of articles that satisfy the aforementioned requirements, which
provides us with a measure of economic articles. This will serve as denominator for our indicator.
Second, we count the number of articles that, in addition to satisfying the aforementioned
conditions, contain upswing-related keywords. That is, the articles must contain the word recu-
peracion* (recovery) or one of the following words, provided that they are preceded or followed
by either economic* (economic) or economı́a (economy) within a distance of 5 words: aceler*
BANCO DE ESPAÑA 11 DOCUMENTO DE TRABAJO N.º 2027(acceleration), crec*, expansi* (growth), increment*, aument* (increase), recuper* (recovery),
mejora* (improvement). In addition, in order to ensure that the news items are about the Span-
ish business cycle, we also require the article to contain the word Españ* (Spain/Spanish).8
Similarly, we count the number of articles that, in addition to satisfying the aforementioned
conditions, are about downswings. In particular, the articles must contain the word recesión*
(recession) or crisis (crisis) or one of the following words, provided that they are preceded or
followed by either economic* (economic) or economı́a (economy) within a distance of 5 words:
descen*, disminu*, redu* (decrease), ralentiz*, decrec*, desaceler*, contracción* (slowdown).
The articles should also contain the word Españ* (Spain/Spanish).
Then, for each newspaper, we take the difference between the upturn and downturn counts.
To construct the index, we follow the procedure used by Baker et al. (2016). First, we scale
the difference between upturn and downturn counts by the total number of economic articles
in the same newspaper/month. Second, we standardize the monthly series of scaled counts
considering the period of 1997m1–2020m2 so that the volatility of each series is comparable
across newspapers. Third, we average the series across newspapers. Fourth, we rescale the
resulting index to mean 0, considering the period of 1997m1–2020m2, to obtain the monthly
DENSI.
Figure A.1 in the Appendix shows our DENSI against the ESI at the monthly level. The latter
is normalized so that both indexes can share the same y-axis in the graph.9 Both indexes follow
the same pattern throughout the entire time span and are highly correlated (the correlation
index for the period 1997m1–2020m3 is 0.8). However, the behavior of both indexes differs
dramatically in March 2020 after the COVID-19 outbreak in Spain. The DENSI signals the
outbreak correctly and drops to values reached during the Great Recession, while the ESI remains
at the positive levels characterizing the recent months. This is because the ESI relies on answers
mostly collected in the first half of the month, which do not capture the start of the economic
crisis that occurred from the lockdown implemented on March 14th to fight against the spread
of COVID-19.
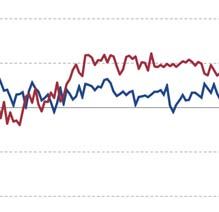
Finally, Figure 2 shows the 7-day moving average of the DENSI from January 1997 onwards
at the daily frequency. Being able to construct daily confidence indicators is a major advantage
of newspaper-based indexes compared to the traditional monthly confidence indicators. This
8
We already require that the content of the article is related to Spain. However, the latter condition is quite
loose since articles that are related to Spain do not necessarily talk about Spanish matters (e.g. they may talk
about foreign matters that have implications for Spain). For this reason, we also require that the article contains
the word Spain/Spanish.
9
The ESI is constructed to have mean 100 and a standard deviation of 10 in a fixed period of time. For details,
see link to Eurostat page. Between 1997m1 and 2020m3, it has mean of 101.
BANCO DE ESPAÑA 12 DOCUMENTO DE TRABAJO N.º 2027Figure 2: Our indicator at a daily frequency
Note: The line depicts the 7-day moving average of the DENSI index.
becomes crucial when important shocks occur in the middle of the month or far from the date
at which the monthly confidence indicators are released. We provide two examples of situations
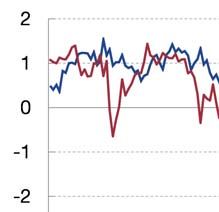
in which the availability of our DENSI has correctly signaled the worsening of the economic
situation in real-time: at the time of the Lehman Brothers bankruptcy in September 2008 (see
right panel of Figure 3) and at the time of the COVID-19 lockdown in March 2020 (see left
panel of Figure 3). According to Figure 3, our indicator responds very quickly to important
economic events: i.e. it drops sharply just after the Leheman Brothers’ announcement of losses in
September 2008 (just before their bankruptcy), and just after the announcement of the Spanish
lockdown in March 2020.
3 Empirical analysis
The ESI has been shown to be helpful in predicting short-term GDP growth (e.g., see Červená
and Schneider, 2014, Mazzi et al., 2014, Gajewski, 2014). In this section, we aim to go one step
further by evaluating whether our proposed indicator could do better than the ESI in this sense
and, consequently, we present two different but related exercises to analyze if this is the case.
In the first one, we rely on the ESI and the DENSI to forecast Spanish GDP growth and we
compare the forecast accuracy obtained in each case. In the second application, we set up a
model to compute the implied probability of recession for Spain based on, alternatively, the ESI
and the DENSI. As in the previous exercise, the main objective is to compare the predictive
power of each indicator.
BANCO DE ESPAÑA 13 DOCUMENTO DE TRABAJO N.º 2027Figure 3: The DENSI during specific shocks
09/2008:
/ Lehman Brothers’ bankrupcty
p y 03/2020:
/ COVID-19 lockdown
Note: The figure shows the evolution of the DENSI around the Lehman Brothers bankruptcy (left panel) and
around the COVID-19 outbreak (right panel).
3.1 Forecasting GDP
GDP figures, which are probably the best measure to proxy the aggregate state of the economy,
are generally released at quarterly frequencies. Of course, between each quarterly publica-
tion, many meaningful economic indicators become available that help in the assessment of the
economic situation. Therefore, mixed-frequency models emerge as one way of exploiting this
intra-quarter information when forecasting short-term GDP growth. Here, we rely on an MF-
BiVAR model, as in Mariano and Murasawa (2010), to compare the GDP forecast accuracy of a
model that alternatively includes the ESI or the DENSI as monthly variables (obviously, GDP
is the quarterly variable included in both cases).
In Mariano and Murasawa’s (2010) notation, the GDP quarter-on-quarter growth rate (yt ),
which is observed every three periods (months), could be written in terms of a latent monthly
growth rate (yt∗ ) through the following arithmetic formula (see Mariano and Murasawa, 2010 for
its derivation):
1 ∗ 2 ∗ ∗ 2 ∗ 1 ∗
yt = y + yt−1 + yt−2 + yt−3 + yt−4 . (1)
3 t 3 3 3
Of course, yt∗ is never observed. By letting xt stand for the monthly variable (the ESI or the
DENSI), it is possible to define Yt = (yt , xt ) and Yt∗ = (yt∗ , xt ) and relate both vectors as10
10
All variables are standardized to have a zero mean and a variance equal to one before estimating the model.
BANCO DE ESPAÑA 14 DOCUMENTO DE TRABAJO N.º 2027Yt = H(L)Yt∗ , (2)
where
⎛ ⎞ ⎛ ⎞ ⎛ ⎞ ⎛ ⎞ ⎛ ⎞
1/3 0 2/3 0 1 0 2/3 0 1/3 0
H(L) = ⎝ ⎠+⎝ ⎠L + ⎝ ⎠ L2 + ⎝ ⎠ L3 + ⎝ ⎠ L4 ,
0 1 0 0 0 0 0 0 0 0
where L is a lag operator. As indicated in Mariano and Murasawa (2010), a Gaussian vector
autoregressive of order P (VAR(P)) model could be assumed for Yt∗ as
Φ(L)Yt∗ = wt , (3)
where wt ∼ IN (0, Σ). For P ≤ 5 and defining St = Yt∗ , ..., Yt−4
∗ , the mixed-frequency VAR(P)
model could then be written under the state-space representation as
Yt = CSt , (4)
St+1 = ASt + Bzt , (5)
where zt ∼ IN (0, I2 ) and
⎛ ⎞ ⎛ ⎞
φ1 · · · φp 02×(5−p)2 Σ1/2
A=⎝ ⎠, B=⎝ ⎠, and C = H0 · · · H4 .
I8 08×2 08×2
The previously described state-space model is estimated by means of maximum likelihood es-
timation. Under this specification (we assume P = 3), we carry out the following forecasting
exercise.
First, we set up a pseudo-real-time nowcasting exercise for GDP. In particular, we assume
it is the last day of each month t and, for our exercise, we use the information that would have
been available at that moment (we use real-time vintages for GDP). It should be noted that
flash estimates for GDP are published 30 days after the end of the reference quarter. Therefore,
within a quarter, we predict the one-quarter-ahead GDP growth no matter whether it is the
first, second, or third month of the quarter. We start the exercise in January 2013, and for each
month until December 2019, we conduct the nowcast of quarter-on-quarter GDP growth when
the ESI and the DENSI are, alternatively, the monthly variable included in the model. Our
target is the second release of GDP figures.
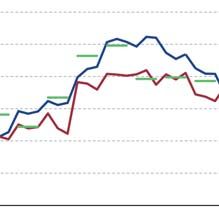
The nowcasts of both models are shown in Figure 4. The blue and red lines represent the
predictions based on the Bi-VAR model with the ESI and DENSI, respectively, while the hor-
izontal green line is the target value. As can be observed, the predictions obtained from the
model that includes the ESI are, in general, above those that include the DENSI. This result
could potentially be explained by the possible positive bias that survey-based confidence indi-
BANCO DE ESPAÑA 15 DOCUMENTO DE TRABAJO N.º 2027cators show during the period after the Great Recession. According to Gayer and Marc (2018),
a possible explanation for this positive bias could be the adaptation of the agents economic
expectations to a more modest growth after the 2008 crisis.
To compare the forecast accuracy of both models, we rely on the forecast root mean squared
error (RMSE). Results indicate that the RMSE of the Bi-VAR model that contains the DENSI is
about 20% lower than that obtained under the model that includes the ESI, the difference being
significant at the 1% confidence level.11 This indicates that the DENSI significantly improves
the nowcast of GDP when compared with the ESI, meaning that it provides a potentially better
signal for the evaluation of the current economic situation.
As already mentioned, one particular advantage of the DENSI is the possibility of computing
it on a daily basis. In the previous section, we highlighted how the DENSI changed around the
Lehman Brothers bankruptcy in September 2008 and the COVID-19 lockdown in March 2020.
Taking each of those events as a case study, we have estimated how the GDP nowcast would
have changed around those particular weeks.12 In particular, on different days of the month
we assume that the values of the DENSI are equal to the average value of the already-known
days of that month, and for each of those particular days we compute the nowcast of the GDP.
In Figure 5 (left panel), we show how each value of the DENSI would have evolved as new
information would have become available. For example, only one week after the end of August
2008, the DENSI would have declined from −5.12 to −5.74, while two weeks after it would have
reached a value of −6.35. Consequently, the nowcast for the third quarter of 2008 would have
been reduced by almost 0.1 percentage points after 15 days. When analyzing the COVID-19
outbreak (Figure 6), the revision of the nowcast under the model is even greater as the days
passed: between March 7 and March 21, the nowcast would have been revised by almost 0.7
percentage points. These results confirm the relevance of having daily real-time information in
order to make a good assessment of the general economic situation.
11
The RMSE of the model that includes the DENSI is equal to 0.137, while the one estimated for the model that
contains the ESI is equal 0.172, meaning that the relative RMSE is about 0.797. To test whether the difference
is significant, we rely on the Diebold and Mariano test.
12
Results for 2008 are mainly indicative and should be cautiously interpreted since only ten years of data are
available for estimating the model prior to computing each forecast (the DENSI series starts in 1997).
BANCO DE ESPAÑA 16 DOCUMENTO DE TRABAJO N.º 2027Figure 4: Quarterly GDP growth nowcast
Note: The blue (red) line represents the predictions obtained from the Bi-VAR model that includes the ESI
(DENSI) and the GDP. The green line depicts the target variable, i.e., the second release of GDP growth rate.
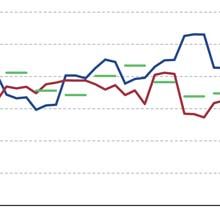
Figure 5: Nowcasts around the Lehman Brothers bankruptcy
DENSI evolution in September 2008 GDP nowcast for 2008:Q3
Note: On the left plot, the dotted lines show the August 2008 monthly value of the DENSI and the values for
September 2008 as they would have been computed on September 7 and September 14. On the right plot, the
GDP nowcast for the third quarter of 2008 from the Bi-VAR model computed on each of those days is shown.
BANCO DE ESPAÑA 17 DOCUMENTO DE TRABAJO N.º 2027Figure 6: Nowcasts around the COVID-19 outbreak
DENSI evolution in March 2020 GDP nowcast for 2020:Q1
Note: On the left plot, the dotted lines show monthly average values of the DENSI as it would have been computed
on March 7, March 14, and March 21. On the right plot, the GDP nowcast for the first quarter of 2020 from the
Bi-VAR model computed on each of those days is shown.
3.2 Predicting the probability of recession
In this section, we test whether our text-based sentiment indicator has predictive content in
terms of business-cycle turning points. For this purpose, we start from a very simple model that
is standard in the literature, where recession probabilities are estimated as a (probit) function
of the present value of the slope of the yield curve—i.e., the difference between short-term and
long-term yields (see Wright, 2006, among many others). In particular, this kind of model is
described by
P (R)(t+n) = α + β1 yield3M
t − yield10A
t + (t+n) , (Model 1)
where P (R)(t+n) stands for the recession probability at a future horizon (t + n), yield3M
t
and yield10A
t are, respectively, the three-month and 10-year Spanish treasury bill yields, and the
residuals t are assumed to be independently and normally distributed. To measure the stance
of the business cycle, we rely on the recession dates given by the Spanish Business Cycle Dating
Committee (Spanish Economic Association, 2015), and we assume that the recession probability
is equal to one when a recession occurred and zero otherwise. Departing from this model, we
check whether forecast accuracy could be improved by adding an economic sentiment indicator
BANCO DE ESPAÑA 18 DOCUMENTO DE TRABAJO N.º 2027(the DENSI or the ESI) as an additional regressor. Therefore, we estimate the following models,
which encompass Model 1:
P (R)ESI
(t+n) = α
ESI
+ β1ESI yield3M
t − yield10A
t + β2ESI ESIt + ESI
(t+n) , (Model 2)
P (R)DEN
(t+n)
SI
= αDEN SI + β1DEN SI yield3M
t − yield10A
t + β2DEN SI DEN SIt + DEN SI
(t+n) .
(Model 3)
Finally, we compute the recession probabilities when the slope of the yield curve is omitted
from the model:
∗ ∗ ∗ ∗
P (R)ESI
(t+n) = α
ESI
+ β2ESI ESIt + ESI
(t+n) , (Model 4)
∗ ∗ ∗ ∗
P (R)DEN
(t+n)
SI
= αDEN SI + β2DEN SI DEN SIt + DEN
(t+n)
SI
. (Model 5)
Each of the five models are estimated for n = 0, 1, ..., 12 (i.e., up to a 12-month horizon)
using a sample period from January 1997 until February 2020. To evaluate the goodness-of-fit of
the different models, we calculate the receiver operating characteristic (ROC) curve. Intuitively,
the ROC curve defines the ability of the model to correctly classify an observation as a recession
by weighting the true positive rate, i.e., how many times the model predicts a recession when
there is a recession, and the false positive rate, i.e., how many times the model predicts a
recession when this did not occur. The area under the ROC curve is a metric that summarizes
the diagnostic ability of a model. It ranges between 0.5, which corresponds to a model with no
ability to classify recessions, and 1, which corresponds to a model with perfect discrimination.
We use this metric to compare the diagnostic ability of our models.
Figure 7 shows the ROC curve under each particular model. Three points are worth noting.
First, in the case of Spain, the standard model (Model 1) is outperformed by all of the other
four selected models at all horizons (the blue line is always below the other lines). The low
performance of the slope of the yield curve as a predictor of recession could potentially be
explained by the key role played by the European Central Bank since the 2012 financial crisis.13
In particular, conventional and unconventional monetary policies such as forward guidance, asset
purchase, and enhanced credit support may have flattened the slope of the yield curve associated
with national bonds, curbing the predictive power of the indicator. Second, the models that
13
Based on the period before the Great Recession, Alonso et al. (1997) and Martı́nez Serna and Navarro
(2005) show that the inclusion of the Spanish yield curve provides relevant information to predict Spanish output
slowdowns or expected economic growth, respectively.
BANCO DE ESPAÑA 19 DOCUMENTO DE TRABAJO N.º 2027Figure 7: Comparing the diagnostic ability of different models
Note: Each line represents the receiver operating characteristic (ROC) curve of each model. A value of 1 represents
a perfect ability to discriminate between two alternative statuses (recession or not), whereas a value of 0.5
represents no ability of discrimination. Model 1: slope of the yield curve; Model 2: slope of the yield curve and
ESI; Model 3: slope of the yield curve and DENSI; Model 4: ESI; Model 5: DENSI.
include either the ESI or the DENSI show a great fit in terms of ROC, being over 0.9 at any
horizon, with the DENSI having slightly better diagnostic ability at longer horizons. Third, once
any of the confidence indicators is included in the model, adding the yield curve as a regressor
does not improve the results.
Nonetheless, as already mentioned, one advantage of the DENSI is that it can be computed
on any day of the month, making it possible to estimate recession probabilities at daily frequen-
cies. Therefore, the DENSI becomes very useful for providing timely predictions of recession
probabilities, such as during the recent episode of the COVID-19 outbreak. In this sense, Figure
8 shows weekly probabilities of recession (estimated at different points in time during March
2020) from March 2020 up to one year ahead. Specifically, we estimate the model using either
the DENSI or the ESI to compute the probability of recession from the current month (March
2020) to 3, 6, 9, and 12 months ahead. To show the importance of having real-time updates of
the DENSI, we evaluate the model using the information available on the 5th, 10th, 15th, 20th,
25th, and 31st of March. On each particular date, we assume that the value of the DENSI for
March would be equal to the average value of the already known days of the month. Therefore,
the value computed on the 31st of March will match the monthly value of the DENSI, while the
values computed on earlier dates are considered as approximations of that monthly value. Of
course, in the case of the ESI, there is only one date available at the end of the month.
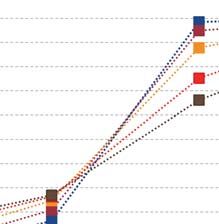
BANCO DE ESPAÑA 20 DOCUMENTO DE TRABAJO N.º 2027Figure 8: Weekly recession probabilities during the COVID-19 outbreak
Note: Each date on the x-axis represents the moment during March 2020 at which we compute the probability of
recession at different horizons based on the model with the DENSI: in March 2020 (blue squares), in June 2020
(3 months ahead, purple squares), in September 2020 (6 months ahead, yellow squares), in December 2020 (9
months ahead, red squares), and in March 2021 (1 year ahead, brown squares). The model with the ESI allows us
to compute such probabilities only on the date of the ESI release, i.e., at the end of the month. Such probabilities
are represented by the circles, with different colors corresponding to the different horizons.
The figure clearly shows how the estimations based on the DENSI adjust correctly to the
rapid economic developments due to the COVID-19 outbreak. By March 14th, when the Spanish
government declared a state of alarm and the country was immediately locked down,14 the
probability of recession increased by a factor of two at least at any horizon and reached values
near 1 during the second half of the month. Given that most of the ESI’s surveys took place
before the implementation of the state of alarm, it is not surprising that the recession probability
for March based on the ESI (see the lower-right corner of Figure 8) remains very low. These
results indicate that in the presence of big events, the DENSI would be able to capture their
impact earlier than the ESI.
Aiming to compare the information content of other high-frequency indicators, in Figure A.2
of the Appendix we also compare, for March 2020, the prediction of recession probabilities by a
model that includes the slope of the yield curve as an explanatory variable with those obtained
by Model 5, in which the DENSI is the only regressor. The very low recession probabilities
of the former model are consistent with the lack of reaction of the sovereign markets to the
14
According to Article 116.2 of the Spanish Constitution, a state of alarm can be declared “in all or part of the
national territory, when there are health crises that involve serious alterations to normality.” The state of alarm
was approved by decree on Saturday the 14th of March and, as a consequence, the country was immediately
locked down.
BANCO DE ESPAÑA 21 DOCUMENTO DE TRABAJO N.º 2027Figure 9: Probability of recession estimated at different horizons
3 months-ahead Average across different horizons
Note: The gray area represents the recession period according to the dates specified by the Spanish Business
Cycle Dating Committee. The blue (red) line represents the probability of recession obtained from the model
with the ESI (DENSI). In the left panel, these probabilities are estimated 3 months before each date shown on
the x-axis. In the right panel, each point represents the average across the probabilities of recession computed for
a given date on the x-axis at different horizons.
COVID-19 outbreak in March (unlike the stock markets), as a consequence of monetary policy
intervention with the announcement of a new temporary asset-purchasing program (i.e., the
Pandemic Emergency Purchase Programme, on the 18th of March).
3.2.1 Predicting the probability of recession in pseudo-real-time
As an additional application, we run a pseudo-real-time exercise to evaluate the estimated reces-
sion probability based on the DENSI and the ESI, alternatively, during the 2012 recession. This
exercise allows us to compare the predicting capacity of both models in terms of (i) anticipating
the crisis, (ii) measuring the increase in the probability of recession during the crisis, and (iii)
foreseeing the end of the crisis. For this exercise, we estimate Model 4 and Model 5 using data
from January 1997 until June 2010 and then compute the recession probabilities at different
horizons (from the current month to 12 months ahead) for the subsequent period. Results for
both models are presented in Figure 9: the left panel shows the estimated recession probabilities
at a specific horizon (3 months), while the right panel shows the probability of recession in a
given month computed as the average probability across all horizons.
Focusing on the left panel of the figure, three points are worth noting. First, both models
were delayed in predicting the beginning of the crisis. Second, during the crisis, the model with
BANCO DE ESPAÑA 22 DOCUMENTO DE TRABAJO N.º 2027the DENSI (red line) showed higher probabilities of recession compared to the model with the
ESI (blue line). Third, the model with the DENSI is better able to anticipate the end of the
crisis, as the probability of recession drops sharply by the summer of 2013.
The right panel of the figure confirms that, on average, the DENSI performs better than
the ESI in the three aforementioned aspects: (i) it anticipates better the start of the crisis (it
jumps from 0 to 0.3 during the first month of the crisis), (ii) it displays, on average, a higher
probability of recession throughout the crisis, and (iii) it drops faster at the end of the crisis.
4 Conclusions
For any policymaker, a prompt assessment of the current economic situation is of key importance.
Since most macroeconomic variables are feasible only after some lag, having meaningful up-to-
date indicators of the state of the economy becomes a priority. Therefore, we have proposed a
new indicator of economic sentiment based on newspaper articles that allows assessing real-time
economic activity in Spain. Our proposed indicator has three major advantages with respect to
the very popular ESI, which is provided by the European Commission: 1) it can be constructed
on a daily basis; 2) it does not suffer from bias along business cycles; and 3) it is very flexible with
respect to the topic of interest (one can easily develop new indicators focused on specific issues
by selecting specific keywords of interest and constructing the indicators backwards, whereas
with survey-based data, new topics need the development of new questions in the survey).
In the empirical part of the paper, we set up two exercises to show that the DENSI is
a better indicator than the ESI for the case of Spain. In a first exercise, we set up mixed-
frequency bivariate VAR models and let the ESI and the DENSI compete in nowcasting the
GDP growth rate. The DENSI provides significantly more precise predictions from January
2013 to December 2019. In addition, we showed two examples in which a major shock occurred
in the middle of the month (in September 2008, with the Lehman Brothers bankruptcy, and in
March 2020 with the COVID-19 lockdown): on both occasions, real-time updates of the DENSI
proved to be very useful in revising downwards the nowcast of economic activity.
In a second exercise, we focused on predicting the COVID-19 economic crisis and computed
the probability of recession at different horizons from March 2020. Our results showed that the
DENSI provides better results compared to the ESI. The probability of recession in March 2020
jumped to about 100% on the 14th March 2020, i.e., the day Spain was locked down. In the
second half of the month, the probability of recession reached values between 90% and 100% at
any horizon. By contrast, the ESI indicator, which in March 2020 provided a poor signal of the
economic situation, yielded a very small probability of recession in the subsequent months.
BANCO DE ESPAÑA 23 DOCUMENTO DE TRABAJO N.º 2027References
Alonso, F., J. Ayuso, and J. Martı́nez Pagés (1997): “How Informative are Financial
Asset Prices in Spain?” Working Papers 9726, Bank of Spain.
Baker, S. R., N. Bloom, and S. J. Davis (2016): “Measuring Economic Policy Uncertainty,”
The Quarterly Journal of Economics, 131, 1593–1636.
Caggiano, G., E. Castelnuovo, and J. M. Figueres (2017): “Economic policy uncertainty
and unemployment in the United States: A nonlinear approach,” Economics Letters, 151, 31–
34.
Calomiris, C. W. and H. Mamaysky (2019): “How news and its context drive risk and
returns around the world,” Journal of Financial Economics, 133, 299 – 336.
Colombo, V. (2013): “Economic policy uncertainty in the US: Does it matter for the Euro
area,” Economics Letters, 121, 39 – 42.
Combes, S., C. Bortoli, and T. Renault (2018): “Nowcasting GDP Growth by Reading
Newspapers,” Economics and Statistics, N.505–506, 2018. Big Data and Statistics (Part 1).
Fontaine, I., L. Didier, and J. Razafindravaosolonirina (2017): “Foreign policy un-
certainty shocks and US macroeconomic activity: Evidence from China,” Economics Letters,
155, 121–125.
Fraiberger, S. P. (2016): “News Sentiment and Cross-Country Fluctuations,” Tech. rep.,
available at SSRN: https://ssrn.com/abstract=2730429.
Gajewski, P. (2014): “Nowcasting Quarterly GDP Dynamics in the Euro Area The Role of
Sentiment Indicators,” Comparative Economic Research, 17.
Gayer, C. and B. Marc (2018): “A “New Modesty”? Level Shifts in Survey Data and
the Decreasing Trend of “Normal” Growth,” European economy - discussion papers 2015,
Directorate General Economic and Financial Affairs (DG ECFIN), European Commission.
Ghirelli, C., J. J. Pérez, and A. Urtasun (2019): “A new economic policy uncertainty
index for Spain,” Economics Letters, 182, 64–67.
Giannone, D., L. Reichlin, and S. Simonelli (2009): “Nowcasting Euro Area Economic
Activity in Real-Time: The Role of Confidence Indicators,” National Institute Economic
Review, 210, 90–97.
BANCO DE ESPAÑA 24 DOCUMENTO DE TRABAJO N.º 2027Keeney, M., B. Kennedy, and J. Liebermann (2012): “The value of hard and soft data
for short-term forecasting of GDP,” Economic Letters 11/EL/12, Central Bank of Ireland.
Ludvigson, S. C. (2004): “Consumer Confidence and Consumer Spending,” Journal of Eco-
nomic Perspectives, 18, 29–50.
Mariano, R. S. and Y. Murasawa (2010): “A coincident index, common factors, and
monthly real GDP,” Oxford Bulletin of Economics and Statistics, 72, 27–46.
Martı́nez Serna, M.-I. and E. Navarro (2005): “The Term Structure of Interest Rates and
Expected Economic Growth ,” Working papers, SSRN.
Mazzi, G. L., J. Mitchell, and G. Montana (2014): “Density nowcasts and model com-
bination : nowcasting Euro-area GDP growth over the 2008-9 recession,” Oxford Bulletin of
Economics and Statistics, 76, 233–256.
Meinen, P. and O. Roehe (2017): “On measuring uncertainty and its impact on investment:
Cross-country evidence from the euro area,” European Economic Review, 92, 161–179.
Nyman, R., S. Kapadia, D. Tuckett, D. Gregory, P. Ormerod, and R. Smith (2018):
“News and Narratives in Financial Systems: Exploiting Big Data for Systemic Risk Assess-
ment,” SSRN Electronic Journal.
Shapiro, A., M. Sudhof, and D. Wilson (2020): “Measuring News Sentiment,” Tech.
rep., Federal Reserve Bank of San Francisco, Working Paper 2017–01, https://doi.org/10.
24148/wp2017-01.
Spanish Economic Association (2015): “CF Index of Economic Activity,” Spanish Business
Cycle Dating Committee.
Thorsrud, L. A. (2016): “Nowcasting using news topics Big Data versus big bank,” Working
Paper 20/2016, Norges Bank.
——— (2020): “Words are the New Numbers: A Newsy Coincident Index of the Business
Cycle,” Journal of Business & Economic Statistics, 38, 393–409.
ˇ
Cerven á, M. and M. Schneider (2014): “Short-term forecasting of GDP with a DSGE model
augmented by monthly indicators,” International Journal of Forecasting, 30, 498–516.
Wright, J. H. (2006): “The Yield Curve and Predicting Recessions ,” Finance and Economics
Discussion Series 2006/07, Federal Reserve Board.
BANCO DE ESPAÑA 25 DOCUMENTO DE TRABAJO N.º 2027Appendix
A Additional figures
Figure A.1: Comparison between the ESI and the DENSI
Note: The gray area represents the recession period according to the dates specified by the Spanish Business
Cycle Dating Committee. The ESI has been normalized (0 mean and 1 standard deviation) in order to have the
same range as the DENSI index.
Figure A.2: Weekly recession probabilities during the COVID-19 outbreak: yield curve vs. the
DENSI
Note: Each date on the x-axis represents the moment during March 2020 at which we compute the probability
of recession at different horizons: in March 2020 (blue symbols), in June 2020 (3 months ahead, purple symbols),
in September 2020 (6 months ahead, yellow symbols), in December 2020 (9 months ahead, red symbols), and
in March 2021 (1 year ahead, brown symbols). The results obtained from the model based on the DENSI are
depicted by squares, while the results obtained by the model based on the yield curve are represented by circles.
BANCO DE ESPAÑA 26 DOCUMENTO DE TRABAJO N.º 2027Figure A.3: Probability of recession 6 months ahead
Note: The gray area represents the recession period according to the dates specified by the Spanish Business
Cycle Dating Committee. The blue (red) line represents the probability of recession obtained from the model
with the ESI (DENSI). Probabilities are estimated 6 months before each date shown on the x-axis.
BANCO DE ESPAÑA 27 DOCUMENTO DE TRABAJO N.º 2027BANCO DE ESPAÑA PUBLICATIONS
WORKING PAPERS
1920 LUIS J. ÁLVAREZ, MARÍA DOLORES GADEA and ANA GÓMEZ-LOSCOS: Inflation interdependence in advanced
economies.
1921 DIEGO BODAS, JUAN R. GARCÍA LÓPEZ, JUAN MURILLO ARIAS, MATÍAS J. PACCE, TOMASA RODRIGO LÓPEZ,
JUAN DE DIOS ROMERO PALOP, PEP RUIZ DE AGUIRRE, CAMILO A. ULLOA and HERIBERT VALERO LAPAZ:
Measuring retail trade using card transactional data.
1922 MARIO ALLOZA and CARLOS SANZ: Jobs multipliers: evidence from a large fiscal stimulus in Spain.
1923 KATARZYNA BUDNIK, MASSIMILIANO AFFINITO, GAIA BARBIC, SAIFFEDINE BEN HADJ, ÉDOUARD CHRÉTIEN,
HANS DEWACHTER, CLARA ISABEL GONZÁLEZ, JENNY HU, LAURI JANTUNEN, RAMONA JIMBOREAN,
OTSO MANNINEN, RICARDO MARTINHO, JAVIER MENCÍA, ELENA MOUSARRI, LAURYNAS NARUŠEVIČIUS,
GIULIO NICOLETTI, MICHAEL O’GRADY, SELCUK OZSAHIN, ANA REGINA PEREIRA, JAIRO RIVERA-ROZO,
CONSTANTINOS TRIKOUPIS, FABRIZIO VENDITTI and SOFÍA VELASCO: The benefits and costs of adjusting bank
capitalisation: evidence from Euro Area countries.
1924 MIGUEL ALMUNIA and DAVID LÓPEZ-RODRÍGUEZ: The elasticity of taxable income in Spain: 1999-2014.
1925 DANILO LEIVA-LEON and LORENZO DUCTOR: Fluctuations in global macro volatility.
1926 JEF BOECKX, MAARTEN DOSSCHE, ALESSANDRO GALESI, BORIS HOFMANN and GERT PEERSMAN:
Do SVARs with sign restrictions not identify unconventional monetary policy shocks?
1927 DANIEL DEJUÁN and JUAN S. MORA-SANGUINETTI: Quality of enforcement and investment decisions. Firm-level
evidence from Spain.
1928 MARIO IZQUIERDO, ENRIQUE MORAL-BENITO and ELVIRA PRADES: Propagation of sector-specific shocks within
Spain and other countries.
1929 MIGUEL CASARES, LUCA DEIDDA and JOSÉ E. GALDÓN-SÁNCHEZ: On financial frictions and firm market power.
1930 MICHAEL FUNKE, DANILO LEIVA-LEON and ANDREW TSANG: Mapping China’s time-varying house price landscape.
1931 JORGE E. GALÁN and MATÍAS LAMAS: Beyond the LTV ratio: new macroprudential lessons from Spain.
1932 JACOPO TIMINI: Staying dry on Spanish wine: the rejection of the 1905 Spanish-Italian trade agreement.
1933 TERESA SASTRE and LAURA HERAS RECUERO: Domestic and foreign investment in advanced economies. The role
of industry integration.
1934 DANILO LEIVA-LEON, JAIME MARTÍNEZ-MARTÍN and EVA ORTEGA: Exchange rate shocks and inflation comovement
in the euro area.
1935 FEDERICO TAGLIATI: Child labor under cash and in-kind transfers: evidence from rural Mexico.
1936 ALBERTO FUERTES: External adjustment with a common currency: the case of the euro area.
1937 LAURA HERAS RECUERO and ROBERTO PASCUAL GONZÁLEZ: Economic growth, institutional quality and financial
development in middle-income countries.
1938 SILVIA ALBRIZIO, SANGYUP CHOI, DAVIDE FURCERI and CHANSIK YOON: International Bank Lending Channel of
Monetary Policy.
1939 MAR DELGADO-TÉLLEZ, ENRIQUE MORAL-BENITO and JAVIER J. PÉREZ: Outsourcing and public expenditure: an
aggregate perspective with regional data.
1940 MYROSLAV PIDKUYKO: Heterogeneous spillovers of housing credit policy.
1941 LAURA ÁLVAREZ ROMÁN and MIGUEL GARCÍA-POSADA GÓMEZ: Modelling regional housing prices in Spain.
1942 STÉPHANE DÉES and ALESSANDRO GALESI: The Global Financial Cycle and US monetary policy
in an interconnected world.
1943 ANDRÉS EROSA and BEATRIZ GONZÁLEZ: Taxation and the life cycle of firms.
1944 MARIO ALLOZA, JESÚS GONZALO and CARLOS SANZ: Dynamic effects of persistent shocks.
1945 PABLO DE ANDRÉS, RICARDO GIMENO and RUTH MATEOS DE CABO: The gender gap in bank credit access.
1946 IRMA ALONSO and LUIS MOLINA: The SHERLOC: an EWS-based index of vulnerability for emerging economies.
1947 GERGELY GANICS, BARBARA ROSSI and TATEVIK SEKHPOSYAN: From Fixed-event to Fixed-horizon Density
Forecasts: Obtaining Measures of Multi-horizon Uncertainty from Survey Density Forecasts.
1948 GERGELY GANICS and FLORENS ODENDAHL: Bayesian VAR Forecasts, Survey Information and Structural Change in
the Euro Area.
2001 JAVIER ANDRÉS, PABLO BURRIEL and WENYI SHEN: Debt sustainability and fiscal space in a heterogeneous
Monetary Union: normal times vs the zero lower bound.2002 JUAN S. MORA-SANGUINETTI and RICARDO PÉREZ-VALLS: ¿Cómo afecta la complejidad de la regulación a la
demografía empresarial? Evidencia para España.
2003 ALEJANDRO BUESA, FRANCISCO JAVIER POBLACIÓN GARCÍA and JAVIER TARANCÓN: Measuring the
procyclicality of impairment accounting regimes: a comparison between IFRS 9 and US GAAP.
2004 HENRIQUE S. BASSO and JUAN F. JIMENO: From secular stagnation to robocalypse? Implications of demographic
and technological changes.
2005 LEONARDO GAMBACORTA, SERGIO MAYORDOMO and JOSÉ MARÍA SERENA: Dollar borrowing, firm-characteristics,
and FX-hedged funding opportunities.
2006 IRMA ALONSO ÁLVAREZ, VIRGINIA DI NINO and FABRIZIO VENDITTI: Strategic interactions and price dynamics
in the global oil market.
2007 JORGE E. GALÁN: The benefits are at the tail: uncovering the impact of macroprudential policy on growth-at-risk.
2008 SVEN BLANK, MATHIAS HOFFMANN and MORITZ A. ROTH: Foreign direct investment and the equity home
bias puzzle.
2009 AYMAN EL DAHRAWY SÁNCHEZ-ALBORNOZ and JACOPO TIMINI: Trade agreements and Latin American trade
(creation and diversion) and welfare.
2010 ALFREDO GARCÍA-HIERNAUX, MARÍA T. GONZÁLEZ-PÉREZ and DAVID E. GUERRERO: Eurozone prices: a tale of
convergence and divergence.
2011 ÁNGEL IVÁN MORENO BERNAL and CARLOS GONZÁLEZ PEDRAZ: Sentiment analysis of the Spanish Financial
Stability Report. (There is a Spanish version of this edition with the same number).
2012 MARIAM CAMARERO, MARÍA DOLORES GADEA-RIVAS, ANA GÓMEZ-LOSCOS and CECILIO TAMARIT: External
imbalances and recoveries.
2013 JESÚS FERNÁNDEZ-VILLAVERDE, SAMUEL HURTADO and GALO NUÑO: Financial frictions and the wealth distribution.
2014 RODRIGO BARBONE GONZALEZ, DMITRY KHAMETSHIN, JOSÉ-LUIS PEYDRÓ and ANDREA POLO: Hedger of last
resort: evidence from Brazilian FX interventions, local credit, and global financial cycles.
2015 DANILO LEIVA-LEON, GABRIEL PEREZ-QUIROS and EYNO ROTS: Real-time weakness of the global economy: a first
assessment of the coronavirus crisis.
2016 JAVIER ANDRÉS, ÓSCAR ARCE, JESÚS FERNÁNDEZ-VILLAVERDE and SAMUEL HURTADO: Deciphering the
macroeconomic effects of internal devaluations in a monetary union.
2017 FERNANDO LÓPEZ-VICENTE, JACOPO TIMINI and NICOLA CORTINOVIS: Do trade agreements with labor provisions
matter for emerging and developing economies’ exports?
2018 EDDIE GERBA and DANILO LEIVA-LEON: Macro-financial interactions in a changing world.
2019 JAIME MARTÍNEZ-MARTÍN and ELENA RUSTICELLI: Keeping track of global trade in real time.
2020 VICTORIA IVASHINA, LUC LAEVEN and ENRIQUE MORAL-BENITO: Loan types and the bank lending channel.
2021 SERGIO MAYORDOMO, NICOLA PAVANINI and EMANUELE TARANTINO: The impact of alternative forms of bank
consolidation on credit supply and financial stability.
2022 ALEX ARMAND, PEDRO CARNEIRO, FEDERICO TAGLIATI and YIMING XIA: Can subsidized employment tackle
long-term unemployment? Experimental evidence from North Macedonia.
2023 JACOPO TIMINI and FRANCESCA VIANI: A highway across the Atlantic? Trade and welfare effects of the
EU-Mercosur agreement.
2024 CORINNA GHIRELLI, JAVIER J. PÉREZ and ALBERTO URTASUN: Economic policy uncertainty in Latin America:
measurement using Spanish newspapers and economic spillovers.
2025 MAR DELGADO-TÉLLEZ, ESTHER GORDO, IVÁN KATARYNIUK and JAVIER J. PÉREZ: The decline in public
investment: “social dominance” or too-rigid fiscal rules?
2026 ELVIRA PRADES-ILLANES and PATROCINIO TELLO-CASAS: Spanish regions in Global Value Chains: How important?
How different?
2027 PABLO AGUILAR, CORINNA GHIRELLI, MATÍAS PACCE and ALBERTO URTASUN: Can news help measure economic
sentiment? An application in COVID-19 times.
Unidad de Servicios Generales I
Alcalá, 48 - 28014 Madrid
E-mail: publicaciones@bde.es
www.bde.esYou can also read