2021 Agriculture in Pennsylvania: 2021 Update The Economic Impact of
←
→
Page content transcription
If your browser does not render page correctly, please read the page content below
The Economic Impact of
Agriculture in Pennsylvania:
2021 Update

                           2021BEGIN ↦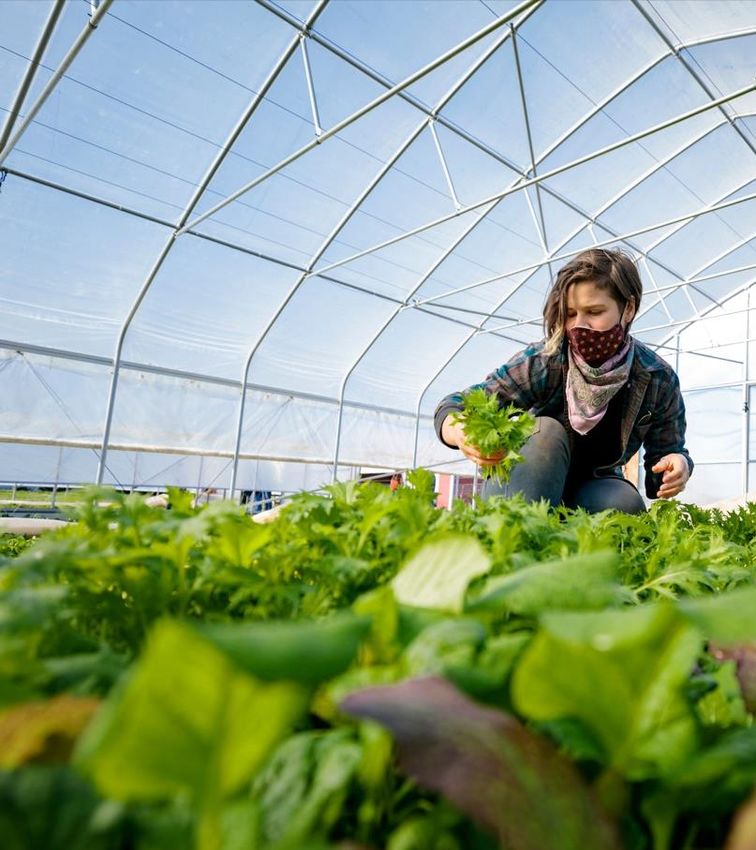
To find your way on a map, first, you must know where you are.
    In 2018, the Pennsylvania Department of Agriculture commissioned an in-depth analysis of Pennsylvania agriculture’s economic impact alongside our partners
    at Team Pennsylvania and the Team Pennsylvania Agriculture Advisory Board. That analysis, in some ways, confirmed what we already knew: that Pennsylvania
    agriculture is significant, both in terms of its unique diversity of businesses and its value as part of the commonwealth’s economy.
    The report, completed by Econsult and the Fox School of Business, identified trends influencing agriculture’s direction, quantified the sector’s enormous total
    economic impact, and provided a roadmap towards launching the Pennsylvania Farm Bill. This was Governor Tom Wolf's bold and necessary investment in
    Pennsylvania agriculture to grow opportunities and resources, remove barriers to entry, and inspire future generations of agricultural leaders. With the backing
    of the Pennsylvania legislature, the PA Farm Bill became law in July 2019, with bicameral, bipartisan support.
    This updated report provides useful perspective that is only possible though comparisons between the years’ data. Understanding this data is the first step in
    shaping strategic policy that supports our agricultural entrepreneurs and enterprises for the future.
    The report is the result of our public-private partnership with PA Department of Agriculture and Pennsylvania agricultural business leaders that serve as part of
    the Team Pennsylvania Agriculture Advisory Board. This work was directed by the Board, who are leaders from across Pennsylvania in our crop and animal
    production, food and beverage manufacturing, forestry, and green industries, and collectively share a commitment to the long-term viability of agriculture in
    Pennsylvania.
    As co-chairs of the Agriculture Advisory Board, we encourage you to explore this report, recognize the trends our state is facing, acknowledge Pennsylvania
    agriculture’s strengths and opportunities, as well as understand the weaknesses revealed during the global pandemic, and potential threats to consider as we
    regain our footing alongside the rest of the national recovery efforts.
    Amid more than a year of unprecedented trials posed by the COVID-19 pandemic, we find it important to also recognize the reinvigorated and renewed
    gratitude for the critical agricultural infrastructure, and the nearly 600,000 Pennsylvanians, responsible for facilitating food and fiber from field to consumer.
    Our for-profit and non-profit ag organizations have exemplified creativity and resiliency this year while rising to meet the challenge of nourishing their fellow
    Pennsylvanians and the world during a time of high need. While Pennsylvania agriculture’s economic impact is quantified through this report and often cited as
    ‘agriculture’s value to the commonwealth’, it is critical to acknowledge the intangible value of our state’s agriculture businesses and organizations as a vital part
    of the story supporting the economic impact.
    This report, a snapshot of where we are today, will inform the path to cultivating a resilient agriculture industry for tomorrow. We will forge ahead in this
    journey with an earnest commitment towards progress by working together.

    In Partnership,

                             Russell C. Redding                                                           Scott Sechler Sr.
                             Secretary of Agriculture                                                     Chairman and President
                             Commonwealth of Pennsylvania                                                 Bell & Evans

↤                                                                           Return to Table of Contents                        Economic Impact of Agriculture in Pennsylvania 2021 2   ↦
About Econsult Solutions, Inc.
    This report was produced by Econsult Solutions, Inc. (“ESI”) and commissioned by Team
    Pennsylvania. ESI is a Philadelphia-based economic consulting firm that provides businesses and
    public policy makers with economic consulting services in urban economics, real estate economics,
    transportation, public infrastructure, development, public policy and finance, community and
    neighborhood development and planning, as well as expert witness services for litigation support.
    Its principals are nationally recognized experts in urban development, real estate, government and
    public policy, planning, transportation, non-profit management, business strategy and
    administration, as well as litigation and commercial damages. Staff members have outstanding
    professional and academic credentials, including active positions at the collegiate level, vast
    experience at the highest levels of the public policy process and extensive consulting experience.

↤                                                                        Return to Table of Contents     Economic Impact of Agriculture in Pennsylvania 2021 3   ↦
Table of Contents
The Economic Impact of Agriculture in Pennsylvania 5
Introduction: The Context of this Report 6
Overview of Economic Impacts 7
Overall Trends in Pennsylvania Agriculture 12
Subsector Analysis 15
Overview 16
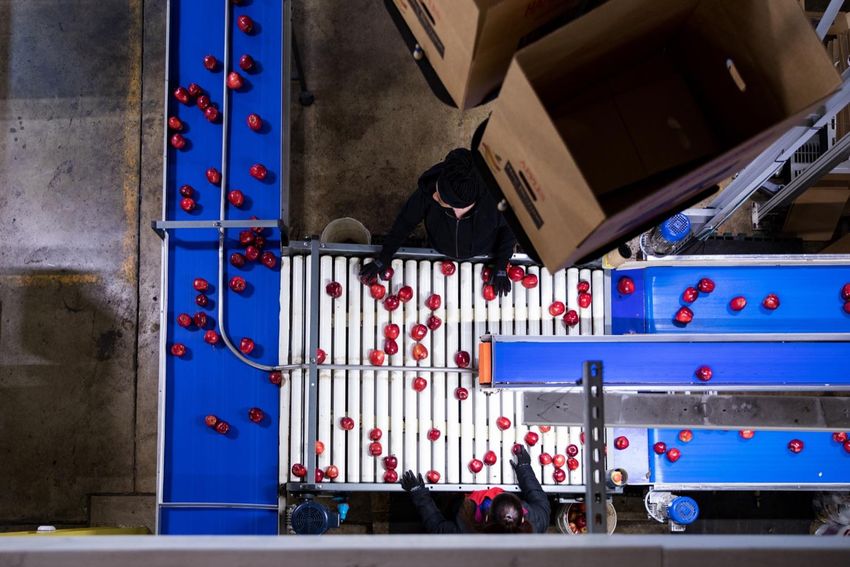
Poultry 17
Beef 19
Dairy 21
Other Animals 23
Fruits and Vegetables 25
Food and Beverage Processing 27
Forestry Production and Processing 28
Nursery and Landscaping 29
Future Impacts 30
Stakeholder Survey: Pre-COVID Sentiments 31
COVID-19 Impact on Pennsylvania Agriculture 32
Pennsylvania Agriculture Policy Going Forward 36
↤ Return to Table of Contents Economic Impact of Agriculture in Pennsylvania 2021 4 ↦
The Economic Impact of Agriculture in
    Pennsylvania
    Introduction: The Context of this Report      6
    Overview of Economic Impacts                  7
    Overall Trends in Pennsylvania Agriculture   12

↤                                                     Return to Table of Contents   Economic Impact of Agriculture in Pennsylvania 2021 5   ↦
Introduction: Context of this Report
    2021 Update
    This report serves as an update to the May 2018 report “Pennsylvania                     At a time of nationwide challenges to the industry, with the number and
    Agriculture: A Look at the Economic Impact and Future Trends, ” which                    acreage of farms decreasing over the past decade, the Pennsylvania Farm Bill
    provided a baseline analysis of Pennsylvania’s agriculture through a data-               provides much-needed support to this $81.5 billion industry in Pennsylvania
    driven approach and informed the development of the Pennsylvania Farm Bill.              which is central to Pennsylvania’s economy and workforce.
    It provides updated numbers on Pennsylvania’s farming sector and offers
                                                                                             Despite these shifts, Pennsylvania agriculture continues to be a strong,
    further insights into why these changes may be occurring. It takes a close look
                                                                                             successful industry and major contributor to the state’s economy. In order to
    at the 2019 Pennsylvania Farm Bill, at national trends in the agricultural
                                                                                             build on the state’s strengths and opportunities, it is essential to understand
    industry, and on the impacts of broader events, including the COVID-19
                                                                                             how the agricultural sector has changed in recent years, how the current
    pandemic and continued impacts from climate change, to present a full picture
                                                                                             context, including the Pennsylvania Farm Bill, the COVID-19 pandemic, and
    of Pennsylvania’s agricultural industry today.
                                                                                             continued environmental shifts have impacted the industry, and the industry’s
    The Pennsylvania Farm Bill, signed into law on July 1, 2019, has resulted in a           importance in the state economy. In line with the 2018 analysis, this report
    total of $37.2 million in support to agriculture in the Commonwealth in the first        represents the production, processing, forestry and hardwoods, landscaping,
    two years, with an additional $13.6 million proposed for the 2021/22 fiscal              ag-related services, and food manufacturing sectors in order to develop a more
    year. Responsive to evolving trends in the industry, the Pennsylvania Farm Bill          complete understanding of Pennsylvania’s agriculture industry.
    includes:
    • Resources for agricultural business development and succession planning,                                Comparing the Two Reports
      including through the Agriculture Business Development Center and a realty
      transfer tax exemption of preserved farmland to qualified beginning
      farmers;                                                                                            2018 Report                             2021 Report
    • Building a strong agricultural workforce, including the Pennsylvania Farm
      to School Grant Program and the Agriculture and Youth Development Grant                Pennsylvania Agriculture: A Look               The Economic Impact of
      Program;                                                                                 at the Economic Impact and                  Agriculture in Pennsylvania:
    • Reduced regulatory burdens to strengthen the agricultural business                               Future Trends                               2021 Update
      climate in Pennsylvania through greater funding and financing;
    • Increased processing capabilities, including through the Pennsylvania Dairy                  2012 Agricultural Census              2017 Agricultural Census, with
      Investment Program and the Center for Animal Agriculture Excellence;                                                                 the 5-year growth applied
                                                                                                                                                forward to 2019
    • New market opportunities and investments in organic, including added
      support to a state-level Specialty Crop Block Grant program for priority
                                                                                                          2017 IMPLAN                               2019 IMPLAN
      crops, increased funding to the PA Preferred Homegrown by Heroes
      Program, and the creation of the PA Preferred Organic Initiative; and
                                                                                                Economic Impact as of 2017                Economic Impact as of 2019
    • Protection for Pennsylvania agriculture through a $4 million Pennsylvania
      Rapid Response Disaster Readiness Account offering protection against
      agricultural disasters including animal health, plant health, and food-borne
      illness.
↤                                                                           Return to Table of Contents                         Economic Impact of Agriculture in Pennsylvania 2021 6   ↦
Overview of Economic Impacts
    The 2018 “Pennsylvania Agriculture: A Look at the Economic Impact and Future              total output from the estimate given in the 2018 report of $83.8 billion. This
    Trends” report defined Pennsylvania’s Agriculture Industry as those industries            decrease is largely driven by a $2.8 billion decrease in food manufacturing,
    involved in the production and processing of crops, the production and                    which is substantial but caused by changes in the operations of individual large
    processing of animals, the production and processing of forestry products,                companies in Pennsylvania. Despite this decrease in food manufacturing,
    landscaping, and horticultural services, agriculture-related support services,            nearly all other categories saw increases over this period (the exceptions being
    and food manufacturing. This report uses the same definition.                             crop and animal processing as well as agriculture-related services). The
                                                                                              reasons for these shifts are complex and are explained in the following section
    In this update, the total direct economic output of these sectors totals $81.5
                                                                                              of this report, which further breaks down these categories into subsectors to
    billion. This represents a 2.7 percent decrease in
                                                                                              examine changes in farm numbers and sizes, commodity prices, and
                                                                                              nationwide trends.
                                                                                                                                                                PERCENT
                                                                                                                                                                CHANGE

                                                                             Food Manufacturing                                                             $22.4 B          - 11.2%

                                                                             Forestry Processing                                                         $21.2 B              + 0.1%

                                                                               Animal Processing                                         $14.2 B                               - 2.2%

                                                                                 Crop Processing                               $9.9 B                                          - 5.2%

                                                                              Animal Production                      $5.9 B                                                   + 3.8%

                                                                                      Landscaping              $3.7 B                                                       + 29.4%

                                                                                 Crop Production              $3.1 B                                                          + 4.0%

                                                                             Forestry Production          $608 M
                                                                                                                                                                            + 57.0%

                                                                             Ag-Related Services          $477 M
                                                                                                                                                                               - 1.9%
                                                                                                                   Sources: IMPLAN (2019), ESI (2021)

↤                                                                           Return to Table of Contents                                  Economic Impact of Agriculture in Pennsylvania 2021 7   ↦
Overview of Economic Impacts

    The direct impacts of Pennsylvania's Agriculture Industry do not
    tell the full story of what agriculture means to the
    Commonwealth's economy. Spillover effects are generated
    through inter-industry linkages between the agricultural sectors
    and other sectors within the economy. These impacts, combined
    with the direct impacts, provide a more comprehensive picture of
    how Pennsylvania’s agriculture contributes to and drives the state
    economy.
    For example, a cattle farm contributes directly to the local
    economy by selling farm products, employing individuals directly
    working on the farm, and paying those employees wages and
    salaries.
    In addition to these impacts, the farmer buys feed from suppliers
    or other farmers, veterinary services, trucking services,
    professional services, and farm equipment maintenance and
    repair, among others. Some of these purchases are from other
    businesses within the agriculture sector and are therefore already
    capitated in the direct impacts of the sector. However, the
    purchases from businesses outside the sector generate additional
    economic impacts. These impacts are captured in the indirect
    impacts.
    The salaries paid to employees working on the farm, as well as to
    the farmers themselves, generate additional economic impact as
    they spend their wages in the local economy. These are captured
    in the induced impacts.

↤                                                                        Return to Table of Contents   Economic Impact of Agriculture in Pennsylvania 2021 8   ↦
Overview of Economic Impacts

    Beyond the 301,900 direct jobs,    In addition to the $81.5 billion         Agricultural industry workers
    indirect and induced spending      direct output, indirect and              earn $14.5 billion in direct labor
    supports an additional 291,700     induced spending generates an            income. Indirect and induced
    jobs within the Commonwealth       additional $51 billion in impact         spending support an additional
    for a total of 593,600 jobs        within the Commonwealth for a            $18.3 billion in labor income in
    supported by the agricultural      total economic impact of $132.5          the Commonwealth for a total
    Industry, representing a 2.5       billion in 2019.                         of $32.8 billion income
    percent increase in total jobs                                              supported by the agricultural
    from the 2017 estimate given in                                             Industry.
    the previous report.

                                             $81.5B
          301,900                          DIRECT OUTPUT                                $14.5B DIRECT                    Agriculture is a major contributor
           DIRECT JOBS                                                                    LABOR INCOME
                                                                                                                         to the state economy:

                                                                                                                         •      Agriculture contributes $1 out of
                     291,700                             $51.0B                                         $18.3B                  every $16 in gross state product.
                  INDIRECT & INDUCED                 INDIRECT & INDUCED                             INDIRECT & INDUCED
                         JOBS                              OUTPUT                                     LABOR INCOME       •      Every dollar of direct output
                                                                                                                                generates $0.63 in additional
                                                                                                                                economic activity.

                                                                                                                         •      Agriculture supports 1 out of every
                                                                                                                                10 jobs in Pennsylvania.
         593,600                                                                           $32.8B
               TOTAL                                                                        TOTAL LABOR                  •      Agriculture supports 7 jobs per $1
                JOBS                        $132.5B                                           INCOME                            million of output.
                                                 TOTAL
                                                OUTPUT

↤                                                                         Return to Table of Contents                    Economic Impact of Agriculture in Pennsylvania 2021 9   ↦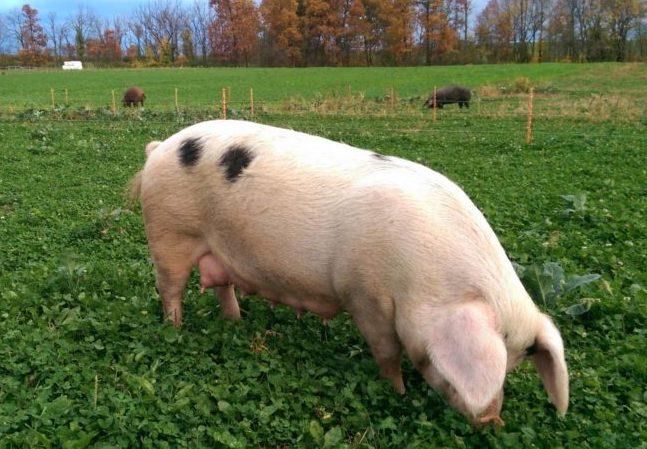
Overview of Economic Impacts

     In 2019, Pennsylvania’s $81.5 billion agriculture sector supported 301,900             Some jobs, such as those in crop production and landscaping, have lower
     direct jobs and $14.5 billion in labor income.                                         average wages compared to agriculture as a whole. Others, including crop
                                                                                            processing, animal processing, and forestry processing have slightly higher
     Agriculture jobs represent approximately 5.8 percent of all private sector
                                                                                            wages. Notably, food manufacturing makes up a relatively small share of
     employment in Pennsylvania. These jobs also support additional jobs in other
                                                                                            agricultural employment compared to its output, meaning that this category is
     industries through their indirect and induced impacts, as described on page
                                                                                            more capital-intensive than others within agriculture.
     10 of this report.

                            301,900 DIRECT JOBS                                                                    $14.5 B LABOR INCOME

                                                                                                              FOOD                           CROP
                     FOOD
                                                      CROP                                            MANUFACTURING                          PRODUCTION
             MANUFACTURING
                                                      PRODUCTION
    AG-RELATED                                                                                                                                              ANIMAL
       SERVICES                                                                                                                         8%                  PRODUCTION
                                             15%                                               AG-RELATED               19%
                                 17%
                                                                ANIMAL                            SERVICES                                      11%
                     3%                                                                                      2%
                                                                PRODUCTION
                                                      10%                                                                                                          CROP
                                                                                                                                                       8%          PROCESSIING
                                                       6%        CROP                                             14%
                          19%                                                                  LANDSCAPING
    LANDSCAPING                                                  PROCESSIING                                                                        9%
                                                     7%
                                                                                                                                                               ANIMAL
                                                             ANIMAL                                                                                            PROCESSING
                                                                                                                               26%
                                       20%                   PROCESSING
                                                                                                                                                         2%
                                                       3%
                        FORESTRY                       FORESTRY                                                      FORESTRY                            FORESTRY
                      PROCESSING                       PRODUCTION                                                  PROCESSING                            PRODUCTION

                                                                         Source: IMPLAN (2019), ESI (2021)

↤                                                                          Return to Table of Contents                         Economic Impact of Agriculture in Pennsylvania 2021 10   ↦
Indirect Economic Impacts
The indirect impacts of agriculture from spending with
companies outside the agriculture sector in Pennsylvania fall
into a wide range of industries, with the largest impacts (in Industry Breakdown of Indirect Jobs Generated
terms of jobs) in wholesale trade, transportation & by Agriculture in Pennsylvania
warehousing, professional services, administrative & waste
management, management of companies & enterprises, and
finance & insurance. While the pie chart at the right shows the
overall indirect impact of agriculture, individual types of 26.2% 19.6%
agricultural production and processing may produce more or ALL OTHER WHOLESALE
fewer indirect jobs in each of these categories. To put these TRADE
numbers in context, the jobs supported by agriculture in
wholesale trade comprise approximately 10 percent of all jobs
in this sector within the state.
As described previously, agriculture also generates induced
effects in the economy through the spending of employees. 5.8% 17.5%
Those induced effects are primarily seen in health care & social FINANCE & TRANSPORTATION
assistance, retail, and accommodation & food services. INSURANCE & WAREHOUSING
7.5%
MANAGEMENT
OF COMPANIES
10.6% 12.8%
ADMINISTRATIVE PROFESSIONAL
& WASTE SERVICES
Source: IMPLAN (2019), ESI (2021)
↤ Return to Table of Contents Economic Impact of Agriculture in Pennsylvania 2021 11 ↦Overall Trends in Pennsylvania Agriculture
The USDA Census of Agriculture is conducted every five years. As a complete Economic Impact and Future Trends” reflect changes between 2012 (reported
count of every farm in the country, it provides a valuable data set on farm in the 2018 study) and 2017 (reported here). In the economic impact section
size, demographics, and production. Every five years, the Census provides a of this report, growth rates from 2012 to 2017 have been brought forward, so
unique glimpse into practices and changes in farms across the country. that output values reflect estimated 2019 output level.
However, lags in data reporting mean that the most current data reflects the Despite this data limitation, the agricultural census remains the most
state of agriculture in 2017, with some individual datasets updated more comprehensive and accurate agricultural dataset, allowing for comparisons
recently. This means that comparisons in the agricultural census between this over time and between states at a detailed level.
report and the May 2018 report “Pennsylvania Agriculture: A Look at the
Pennsylvania’s Trends from 2012 to 2017:
53,157 7.3 M 137 $7.8 B $352 M
FARMS ACRES AVG ACRES MARKET VALUE INCOME
(-10 percent) (-6 percent) (+5 percent) (+5 percent) (+14 percent)
Comparison to National Trends
• The total number of farms in the U.S. declined by 3
percent, mostly due to losses in mid-sized farms while the
number of very small and very large farms increased.
Despite a decrease in the Pennsylvania realized a comparatively large decline (10
number of farms, the percent of total farms), with an increase in only very large
farms and all other farm sizes declining in number.
market value of products
• Unlike the U.S. which saw a 2 percent decrease in
sold and operations income market value, Pennsylvania’s farms realized a 5 percent
both increased between growth rate in market value over this period.
2012 and 2017. • This consolidation into fewer, larger crop farms matched
the national trend and realized some financial benefits
from economies of scale. At the same time, animal farm
consolidation reveals a higher concentration of animals
per farm and therefore larger returns per acre.
↤ Return to Table of Contents Economic Impact of Agriculture in Pennsylvania 2021 12 ↦Pennsylvania matches National Trends of Farm Consolidation
While the total number of PA farms shrank, per farm average sales and number of farms with hogs and pigs on them decreased by more than 10
income realized significant increases. The average farm in Pennsylvania sold percent (see page 22-23 for more information).
$145,962 in products in 2017, a 17 percent increase since 2012. Additionally,
• On the crops side, the amount of corn grown for grain increased by more
average farm-related income increased by 18 percent (+$16,562) while net
than 15 percent (to 144.7 million bushels) even as the number of farms
case farm income increased by 42 percent (+$45,020). This trend towards
decreased by more than 18 percent and acreage decreased by 4.9 percent.
increased consolidation is evident looking at trends across farm sizes. Over
the last five years, all categories of small and mid-sized farms declined while • In nearly all crop types reported, production either increased more than
very large farms ($500,000 or more in sales) increased by 7 percent. farm numbers, or decreased by small margins.
These shifts toward fewer but larger operations hold true in many types of While the specifics vary from one Agricultural Census to the next, these are a
operations, including both livestock and crop farms: continuation of a decades-long trend of consolidation, both in Pennsylvania
and nationally. Larger farms are more technology intensive, increasing
• The number of cattle and calves in Pennsylvania held steady from 2012 to
demand for workers with advanced skills, and also making it more difficult for
2017, even as the number of farms decreased by nearly 10 percent. Even
smaller farms to compete.
so, Pennsylvania beef farms remain much smaller than the national
average (see pages 18-19 for more information).
• Hog and pig inventories increased by more than 9 percent, even as the
Number of Farms, by Sales Category, 2012 and 2017 Farms by Size (Cropland Acres), U.S. 1987 - 2012
(thousands of farms)
19.6 2012 2017
16.9
7.8 6.8 8.9 8.3
5.1 4.5 6.0 5.6 4.9 4.4 4.0 3.6 2.9 3.1
Less than $2,500 to $5,000 to $10,000 to $25,000 to $50,000 to $100,000 to $500,000 or
$2,500 $4,999 $9,999 $24,999 $49,999 $99,999 $499,999 more
Sales Class
Across many types of operations, production or inventory increased
even as the number of operations decreased from 2012 to 2017. This
shift was driven by an increase in large operations, particularly those
with $500,000 or more in sales. Source: National Agriculture Statistics Service, 2017 Agricultural Census (left);
USDA, Economic Research Service and Agricultural Census (above)
↤ Return to Table of Contents Economic Impact of Agriculture in Pennsylvania 2021 13 ↦Notable Farm Characteristics
As of 2017, 12 percent of farms had a young producer (defined as age 35 or younger)
operating as a primary producer, with 17 percent of farms having a young producer present.
About a quarter of these primary producers were working in dairy cattle and milk production
while 17 percent were engaged in crop farming. With 14 percent of all producers in
Pennsylvania age 35 or younger, PA ranks first in the country in the number of young
producers. Lancaster County leads in this area, with more than 2,400 young producers
(LaGrange County, Indiana, which is ranked second nationally has less than half this
number).
The designation of primary producer is an official term used by the USDA that refers to the
person who makes the most decisions on a given farm, as reported by farms to the
Agricultural Census.
Currently, 2 percent of farms in Pennsylvania are certified as organic by the USDA National
Organic Program. However, since 2012, the number of farms producing organic products has
increased by 76 percent, from 600 to 1,055 farms, a trend that is likely to continue due to
consumer trends nationwide as well as supports from the Pennsylvania Farm Bill.
The market value of these organic products skyrocketed by 800 percent from $78 million in
2012 to $707 million in 2017, resulting in the average sales per farm increasing from
$131,000 to $675,000. With this increase, Pennsylvania now ranks third in the U.S. in organic
sales, with nearly 2.5 times the dollar vale of sales of New York, the only other state in the
Northeast in the top 10 (USDA 2019 Organic Survey)
While internet access has grown, 31 percent of farms still did not have internet access as of
2017, down from 38 percent in 2012. With 25 percent of farms nationally lacking internet
service, Pennsylvania lags compared to other states. Internet connectivity can be a challenge
in rural areas in general, but Pennsylvania differs from other states in its large number of
Amish and Mennonite communities, many of whom are farmers. While Mennonites may use
electricity and computers (although at lower rates than the general population), Amish
individuals do not.
Sources: National Agriculture Statistics Service, 2017 Agricultural Census, Sarah Paez and Lauren Muthler, “More than an inconvenience, Pa.’s broadband crisis affects education, medicine and more,”
Centre Daily Times (April 10, 2019), https://www.centredaily.com/news/local/article228780844.html, Rachel McDevitt, “What Does the Future of Farming Look Like: Who and Where are the Big
Questions,” 90.5 WESA (January 31, 2020), https://www.wesa.fm/post/what-does-future-farming-pennsylvania-look-who-and-where-are-big-questions#stream/0
↤ Return to Table of Contents Economic Impact of Agriculture in Pennsylvania 2021 14 ↦Subsector Analysis
Overview 16
Poultry 17
Beef 19
Dairy 21
Other Animals 23
Fruits and Vegetables 25
Food and Beverage Processing 27
Forestry Production and Processing 28
Nursery and Landscaping 29
↤ Return to Table of Contents Economic Impact of Agriculture in Pennsylvania 2021 15 ↦Overview
In addition to analyzing agriculture’s overall impact on the In the later stages, poultry are slaughtered and processed into poultry products. In the
Pennsylvania economy, it is important to understand how the final stages, products are transported from manufacturing plants to distribution
different subsectors within the agriculture industry provide the through wholesaling and then lastly sold to restaurants and grocery stores for final
vital raw materials and inputs needed to sustain numerous consumption.
downstream agricultural and non-agricultural industries within
The subsector analyses to follow will incorporate the production and processing stages
the Commonwealth. The following subsector analysis will
of each commodity. However, data limitations posed significant issues when
include an estimate of the direct, indirect, and induced output,
attempting to isolate commodity-specific wholesale and retail trade impacts which are
as well as the employment and income impacts from eight
not included in the subsector analyses. Nevertheless, by focusing on each commodity’s
subsectors within the broader categories of the agricultural
impact on the Pennsylvania economy, it is possible to understand how the animals and
sector. These subsectors were selected for inclusion in the May
crops produced in the Commonwealth support and enable additional downstream
2018 “Pennsylvania Agriculture: A Look at the Economic Impact
industries.
and Future Trends,” and this section serves as an update and
deeper dive into their recent trends and current conditions. In addition to providing seven deep-dive analyses on Pennsylvania’s agricultural
commodity production and processing, this section will also analyze one sector made
For seven of these subsectors, this analysis will focus on the
possible, in part, through Pennsylvania’s agricultural production:
supply chain of each commodity from initial production to
processing: • Food manufacturing
• Poultry and egg production It is important to note that due to subsector definitions, there is slight overlap of the
economic inputs between sectors in some cases, and for this reason, the subsector
• Dairy production
analyses are not additive in nature (for the overall impact of the sector, please see the
• Beef production prior Economic Impact of Agriculture in Pennsylvania section).
• Other animal production including pigs, sheep, and goats
• Fruit and vegetable production
• Hardwoods and wood product production
• Nursery and landscaping
For example, the poultry subsector encompasses not only the
agricultural production of poultry and eggs but is inclusive of
the entire production process from initial hatching to final sales.
In the first stage—poultry and egg production—broilers,
turkeys, and egg-laying hens are hatched and raised while other
farmers produce chicken feed to support this sector.
↤ Return to Table of Contents Economic Impact of Agriculture in Pennsylvania 2021 16 ↦Poultry
There are four major commercial enterprises in the United States that constitute the
initial production stages of the poultry industry: egg production, broiler production, $4.3B 10,000
raising pullets for replacement purposes, and turkey production. According to the 2017 DIRECT OUTPUT DIRECT JOBS
Census of Agriculture, Pennsylvania ranked 8th nationwide in poultry and egg sales
($1.7 billion), moving up in rank from 10th nationwide in 2012 ($1.4 billion). Poultry $2.0B 4,400 jobs
and egg production accounted for roughly 22 percent of Pennsylvania’s total market Poultry & Egg Production Poultry & Egg Production
value of agricultural products sold in 2017, up from 18 percent in 2012. The number of
poultry farms with sales increased 3.4 percent over this time period (+244 farms) as
poultry inventory increased from 66.8 million to 75.9 million birds. $1.5B 5,000 jobs
Poultry Processing Poultry Processing
Pennsylvania’s 24 percent growth in poultry and egg sales outpaced national growth,
which grew by a healthy 15 percent over the five-year period. The U.S.’s South, Eastern
Mountain Region, and Delta Region together represent 60 percent of poultry and egg $0.8B 600 jobs
sales by dollar amounts in the nation, with Georgia, North Carolina, and Arkansas as the Animal Feed Production Animal Feed Production
top three ranking states (making up nearly a full third of sales). Other high-ranking
states in terms of sales do not necessarily have the highest inventory numbers,
however. Rather, the wide variety in cost per head of poultry drives some of the
$2.8B 16,600
difference in sales among top producing states, with 2017 values ranging from $1.90 INDIRECT & INDIRECT &
INDUCED INDUCED JOBS
per head in Indiana to $9.40 per head in Tennessee. At $4.40 per head, Pennsylvania is
slightly above the 2017 national average of $4.20 (these values exclude commercial
broilers, which have a more consistent value per pound). $7.1B 26,600
TOTAL OUTPUT TOTAL JOBS
Even though the number of layer farms in Pennsylvania was down a slight 2.6 percent from
2012 to 2017, layer numbers increased by 5 percent, pointing toward higher animal
concentrations on a per operation basis. Broiler farms and numbers both increased by over 10
percent, with 173 more farms and 17.2 million more broilers raised in 2017 than 2012.
Additionally, turkeys, ducks, and geese were also up from 2012. In addition to growth in
poultry production, chicken consumption is also increasing in the United States, from 95
pounds per capita in 2012 to 107 in 2017. Egg production and consumption has also increased
nationally, both in raw numbers and on a per capita basis.
In total, chickens comprise 93 percent of Pennsylvania’s poultry inventory followed by turkeys
(4 percent). By type of poultry production, the number of broiler (-7.7 percent) and layer (-2.6
percent) farms in Pennsylvania decreased over the 2012 to 2017 period while turkey (+10.1
percent) and pullet (+8.4 percent) farms increased.
↤ Return to Table of Contents Economic Impact of Agriculture in Pennsylvania 2021 17 ↦Poultry
Poultry and Egg Production
In Pennsylvania, broilers, or chickens raised for meat, made up nearly half Poultry Processing and Animal Feed Production
of the total chicken inventory (46 percent, 34.7 million). Layers, chickens
that produce large quantities of eggs, made up approximately 35 percent of While layers and pullets remain within the production stage, broilers and
inventory (26.3 million). Nearly 62 percent of layers (16.2 million) were turkeys are processed for their meat in the poultry processing stage which
located on 29 large commercial egg production farms. involves the harvest, processing, cutting, and packing of meats. In this
stage, the poultry is either processed for consumption or used to
The remaining 13 percent of Pennsylvania’s chicken inventory are pullets, manufacture animal feed. In Pennsylvania, approximately 23 percent of
chickens supplying the other two enterprise types with replacement flock. processed poultry products demand was met by local production in 2019
In terms of number sold, pullets had the largest increase from 2012 to 2017 (meaning that approximately 23 percent of processed poultry bought, sold,
(+15 percent) while layers realized the largest percent decrease (-31 and/or consumed in Pennsylvania was processed within the state). On the
percent). In 2017, nearly 184 million broilers and over 7 million turkeys supply side, 36 percent of local supply of processed poultry products goes
were sold for meat production (see Poultry Processing below). In to meeting local demand (with the remaining product shipped for
Pennsylvania, approximately 69 percent of poultry and egg products consumption elsewhere).
demand was met by local production in 2019 (meaning that approximately
69 of poultry and egg products bought, sold, and/or consumed in
Pennsylvania were from within the state). On the supply side, 57 percent of
local supply of poultry and egg products went toward meeting local
demand.
Poultry Sold by Type, 2017
Number of Pct Chg Pct Chg Avg. Head per
Operations 2012-2017 Head Sold 2012-2017 Operation, 2017
Layers 1,768 -2% 9,333,000 -31% 5,300
Pullets 346 +34% 17,919,000 +15% 51,800
Broilers 1,568 +12% 183,894,000 +10% 117,300
Turkeys 629 +30% 7,305,000 -14% 11,600
(Source: National Agriculture Statistics Service, 2017 Agricultural Census)
↤ Return to Table of Contents Economic Impact of Agriculture in Pennsylvania 2021 18 ↦Beef
The Beef subsector in Pennsylvania is made up of beef $6.1B 17,900
production (Beef Cattle Ranching and Farming and Beef DIRECT OUTPUT DIRECT JOBS
Cattlelots) and manufacturing (Animal Slaughtering,
Meat Processed from Carcasses, and Other Animal Food $0.7B $2.7B 9,500 jobs 3,700 jobs
Manufacturing). Beef Cattle Ranching & Beef Cattle Ranching &
Farming Animal Harvesting Farming Animal Harvesting
Cattle and calf inventory are divided into three
categories: milk cows, beef cows, and other cattle (for $2.5B $0.1B 4,600 jobs 100 jobs
information about milk cows see the Dairy subsector). Meat Processed from Other Animal Food Meat Processed from Other Animal Food
Carcasses Manufacturing Carcasses Manufacturing
Overall, the number of farms with cattle and calf
inventory decreased over this time period (-9.8 percent)
while total inventory remained largely unchanged (-0.3
$3.0B 21,300
INDIRECT INDIRECT &
percent).
& INDUCED INDUCED JOBS
Cattle and calves was the only PA animal production
sector to experience a decrease in sales over the time
period from 2012 to 2017 (-13 percent) resulting in a $9.1B 39,200
drop in ranking from 22nd to 27th nationally. This TOTAL OUTPUT TOTAL JOBS
decrease occurred despite an 11 percent increase in the
number of beef cow operations with inventory, coupled
with a 47 percent increase in beef cow inventory and a
58 percent increase in sales. Instead, the loss was driven
by minor losses in milk cows as well as more substantial
losses in other cattle, a category which includes bulls,
steers, and heifers.
PA Cattle and Calf Inventory by Type, 2012 and 2017
Nationally, growth in the Northern Plains and Upper
Midwest balanced out losses in the Mountain Region and 2012 2017 Percent Change
Texas, such that cattle and calf sales held steady overall Farms Number Farms Number Farms Number
over this time period (for a 1 percent increase Total 25,189 1,626,374 22,729 1,621,303 -9.8% -0.3%
nationwide). The average value per head is comparable Beef Cows 11,880 148,249 13,176 217,617 +10.9% +46.8%
in Pennsylvania compared to the U.S. average ($1,080 vs. Milk Cows 7,829 532,335 6,914 527,617 -11.7% -0.9%
$1,109) despite variation in average live weight: Other Cattle 21,574 945,790 18,620 876,069 -13.7% -7.4%
Pennsylvania cattle are lighter than the national average
(Source: National Agriculture Statistics Service, 2012 and 2017 Agricultural Census)
(with an average live weight of 1,223 pounds compared
to 1,349 pounds in 2017).
↤ Return to Table of Contents Economic Impact of Agriculture in Pennsylvania 2021 19 ↦Beef
According to the 2017 Census of Agriculture, Pennsylvania ranked 25th Beef Manufacturing and Wholesaling
nationwide in the number of cattle and calves sold (767,000 head), declining
The latter stages of the industry consist of the harvesting, cutting, inspecting,
in rank from 22nd nationwide in 2012 (880,000 head). Cattle and calf sales
packaging, and processing of carcasses into products for consumption or as
accounted for roughly 8 percent of Pennsylvania’s total market value of
inputs into other products. In Pennsylvania, 26 percent of local meat
agricultural products sold in 2017, down from 9.6 percent in 2012. The
harvesting demand is met by local production, meaning that the remaining
number of farms with cows and calf sales decreased six percent from 2012
74 percent of product is brought in from out of state. Similarly, 41 percent of
(19,381 farms) to 2017 (18,149 farms).
local demand for meat processed from carcasses is met by local production,
Beef Production with the remaining 59 percent from out of state. In terms of total production,
27 percent of meat harvested locally goes to meeting local demand, while 34
The number of farms with beef cow inventory has increased, from 11,900 in
percent of locally processed meat serves local demand.
2012 to 13,200 in 2017 (+11 percent), as has the total inventory of beef cows
(+47 percent). Nearly half of these farms (46 percent) are small, with an Once produced and packaged, products are transferred from manufacturers
inventory of one to nine beef cows. to wholesalers for distribution to restaurants, taverns, meat markets, and
grocery stores. It is estimated that there were approximately 1,200
This growth represents larger increases in both operations and inventory
individuals directly employed in the wholesaling of beef products in
compared both to other states in the region and to the United States as a
Pennsylvania in 2019.
whole. The region (aside from Delaware, which has had decreases in both
the number of operations and inventory) collectively has also seen greater Although calves harvested commercially make up a small portion of the
increases than nationally. overall cattle and calf market share, Pennsylvania is particularly strong in
this area, slaughtering more than 19 percent of all calves nationwide. With
In Pennsylvania, approximately 24 percent of beef cattle demand is met by
an average live weight of 428 pounds, calves harvested commercially in
local production, meaning that about a quarter of all beef consumed in
Pennsylvania weighed substantially more than the national average of 250
Pennsylvania comes from within the state. On the production side, 95
pounds. Because of the higher average weights in Pennsylvania, this
percent of beef produced in PA goes to meeting local demand, with the
represents nearly 33 percent of the national total by weight.
remaining 5 percent being consumed elsewhere.
PA Beef Operations and Inventory, 2012 and 2017
Operations % Chg, Beef % Chg, Head/Op,
w/ Inventory 2012-2017 Inventory 2012-2017 2017
Pennsylvania 13,200 +11% 217,600 +47% 17
Delaware 240 -21% 2,400 -37% 10
Maryland 2,500 +3% 48,200 +23% 19
New Jersey 940 +8% 9,400 -1% 10
New York 7,300 +11% 109,900 +28% 15
Ohio 17,700 +5% 300,700 +8% 17
West Virginia 10,300 +2% 205,600 +7% 20
United States 729,000 0% 31,722,000 +10% 44
(Source: National Agriculture Statistics Service, 2012 and 2017 Agricultural Census)
↤ Return to Table of Contents Economic Impact of Agriculture in Pennsylvania 2021 20 ↦Dairy
Pennsylvania’s dairy industry represents a total of $8.3 billion dollars in direct output, including dairy cattle and milk production, fluid milk manufacturing,
cheese manufacturing, dry, condensed, and evaporated dairy, butter manufacturing, ice cream and frozen dessert manufacturing, and animal feed
production. With 6,100 dairies, Pennsylvania ranks second only to Wisconsin in the number of dairy operations by state. The third-ranking state, New
York, has only 4,000 operations. However, with average annual sales of $325,000 (compared to a national average of more than $900,000), Pennsylvania
dairies are much smaller than those in western states but are in range with most of the Region (see the table on the following page).
$8.3B 15,400
DIRECT OUTPUT DIRECT JOBS
$2.8B $2.4B 9,200 jobs 2,900 jobs
Dairy Cattle & Milk Fluid Milk Dairy Cattle & Milk Fluid Milk
Production Manufacturing Production Manufacturing
$1.5B $290M 1,300 jobs 200 jobs
Cheese Dry, Condensed, & Cheese Dry, Condensed, &
Manufacturing Evap. Dairy Manufacturing Evap. Dairy
$260M $540M $616M 100 jobs 1,300 jobs 500 jobs
Creamery Butter Ice Cream & Frozen Animal Feed Creamery Butter Ice Cream & Frozen Animal Feed
Manufacturing Dessert Production Manufacturing Dessert Production
$5.8B 37,900
INDIRECT & INDIRECT &
INDUCED INDUCED JOBS
$14.1B 53,300
TOTAL OUTPUT TOTAL JOBS
↤ Return to Table of Contents Economic Impact of Agriculture in Pennsylvania 2021 21 ↦Dairy
Given the smaller operations in Pennsylvania, the state ranks 6th nationally Fluid milk and other milk product pricing is highly regulated in the United
based on sales. Its one percent growth in sales from 2012 to 2017 was States, with public policy and dairy cooperatives both playing major roles.
overshadowed by much larger increases in the Upper Midwest and Great Class pricing identifies four groupings based on milk’s end use: I - fluid milk,
Lakes Regions, which together represent nearly a third of total milk sales in II - soft products (which include yogurt, cream, and cottage cheese), III -
the U.S. (California, the #1 ranked state with $36.7 billion in sales, hard and soft cheeses, and IV – including butter, evaporated milk, and dry
experienced a 7 percent decrease over this period, but still accounts for 18 products, and prices paid to farmers does not necessarily correspond to
percent of sales nationwide). Pennsylvania is also strong in butter retail prices. Declining prices starting in 2015, for example, were in part tied
production, ranking second nationally based on production volume. to increased competition from outside of the U.S. impacting demand for
exports.
Herd sizes in Pennsylvania are much smaller than the national average, with
an average size of 76 milk cows compared to 175 nationally. Only 15 Nationwide, milk prices have fluctuated substantially in recent years,
percent of all milk cows in the state are located in operations of 500 cows increasing from $18.56 per 100 pounds in 2012 to a peak of $24.07 in 2014,
or more, compared to 66 percent of milk cows nationwide. before declining to $17.69 as of 2017; this trend is mirrored in
Pennsylvania, where prices went from $20.00 in 2012 to $25.70 in 2014 and
then $18.60 in 2017. Also notable is a decrease in fluid milk consumption
nationally: the U.S. has seen steady annual declines from 2009 (179 pounds
consumed per capita) to 2017 (149 pounds consumed). Other dairy
products are experiencing growth, with the most notable growth in cheese
production, which increased from 10.9 billion pounds to more than 12.6
billion pounds from 2012 to 2017.
PA Region Dairy Sales and Operations by State, 2017
Rank in US Number of Avg Sales/
State Dairy Sales ($M) (by Sales) Dairies Operation
Pennsylvania $1,979.4 M 6 6,100 $325,000
Delaware $16.8 M 46 30 $558,000
Maryland $174.5 M 28 390 $449,000
New Jersey $24.0 M 42 70 $347,000
New York $2,528.3 M 3 4,000 $635,000
Ohio $1,001.5 M 11 2,400 $417,000
West Virginia $22.8 M 43 100 $238,000
United States $36,724.4M 40,336 $910,000
(Source: National Agriculture Statistics Service, 2017 Agricultural Census)
↤ Return to Table of Contents Economic Impact of Agriculture in Pennsylvania 2021 22 ↦Other Animals
The “Other Animals” subsector includes pork and pigs, sheep, lambs, Goats
goats, and horses, among other animal categories. Pork and pig Of the 52,600 goats in operations with inventory in Pennsylvania, more than 15,000 are
production and processing is by far the largest of this category, with goats raised for milk. Representing 29 percent of all goat inventory, goats raised for
much larger operations than the others: the 2017 Agricultural Census milk reflects a particular strength within Pennsylvania’s goat operations, even as the
reports approximately 1.2 million hogs in 2,780 farms or operations, majority of goats are raised for meat or other purposes (as only 20 percent of all goat
compared to 94,400 sheep in 3,750 operations and 52,600 goats in inventory nationwide is raised for milk). Additionally, 500 angora goats produce
3,750 operations (likely with some but not complete overlap). approximately 7,250 pounds of mohair annually (in comparison, sheep operations in
Sheep & Lambs the state produce 260,000 pounds of wool).
Nearly three quarters of the 3,750 operations with inventory in Equine
Pennsylvania have fewer than 25 sheep or lambs (74 percent, Pennsylvania has approximately 13,800 operations with horses and ponies, for a total
compared to 69 percent nationwide, as of 2017). While the overall of 88,000 animals, more than 73,000 of which are based at operations with fewer than
number of operations with inventory grew from 2012 to 2017 (by 4 25. This definition excludes boarding, training and riding facilities, as well as any other
percent), the number with wool sales declined by 43 percent, from operation that fails to generate a minimum of $1,000 in sales of equine products. When
more than 1,900 to just 1,090 in 2017. including all activity within the state, there are approximately 224,000 horses, with
Nationally, there was a 15 percent increase in operations with Pennsylvania ranking 8th nationally according to the American Horse Council. There are
inventory, coupled with a 14 percent decline in operations with sales. also 9,583 mules, burros, and donkeys on 2,743 operations in the state.
$2.7B 9,300
DIRECT OUTPUT DIRECT JOBS
$0.4B $1.2B 5,700 jobs 1,600 jobs
Animal Production Animal Harvesting Animal Production Animal Harvesting
$1.0B $0.1B 1,900 jobs 50 jobs
Meat Processed from Other Animal Food Meat Processed from Other Animal Food
Carcasses Manufacturing Carcasses Manufacturing
$1.5B 11,000
INDIRECT & INDIRECT &
INDUCED INDUCED JOBS
$4.3B 20,300
TOTAL OUTPUT TOTAL JOBS
↤ Return to Table of Contents Economic Impact of Agriculture in Pennsylvania 2021 23 ↦Other Animals
Pigs & Hogs
With a 25 percent growth in sales, Pennsylvania’s hog and pig sale growth outpaced the U.S.
average of 17 percent growth over the 2012 to 2017 period, even as the rest of the Northeast
Region experienced a 16 percent decrease in sales. This increase was driven by growth in commercial
slaughter, as the number of heads increased by 21 percent from 2012 to 2017, reaching nearly 3.5
million in 2017. At the same time, a 4 percent growth in average live weight further contributed to
growth as measured in pounds, even as hogs in Pennsylvania are slaughtered at a slightly smaller size
than the national average (271 versus 282 pounds).
Over this period, inventory numbers grew by a more modest 10 percent and the value per head of
inventory dropped from $110 to $96 (after peaking at $130 in 2014). The U.S average value per head
displayed similar trends but at slightly higher values, going from $116 in 2012 to $98 in 2017, with a
peak of $144 in 2014. This 2014 peak was tied to high losses caused by the Porcine Epidemic Diarrhea
Nearly half of all pig production operations in
virus that led to a decrease in supply as demand continued to rise. Increases in production since that
Pennsylvania (representing 59 percent of
year have driven the price per head (and by extension the price per pound) down. The Upper
inventory) are finishers, meaning that they
Midwest, Northern Plains, Heartland, and Eastern Mountain Regions, which all experienced growth,
purchase feeder pigs and bring them to final
make up 78 percent of all U.S. hog sales.
market weight. In farrow to wean and farrow
to feeder operations (representing 19 percent
and 8 percent of inventory, respectively), pigs
are raised until they are either weaned (in
Types of Hog and Pig Operations in Pennsylvania, 2012-2017, and Compared with U.S. farrow to wean) or until they reach
approximately 50 pounds (in farrow to feeder).
Type of Farms, Pct Chg Head, Pct Chg Share of Share of Nursery production (representing 8 percent of
Operation 2017 2012-2017 2017 2012-2017 Inventory, PA Inventory, US inventory) includes operations that purchase
Farrow to Wean 250 -5% 234,000 +11% 19% 12% weaned pigs and bring them to market weight,
while farrow to finish operations (8 percent of
Farrow to Finish 660 +1% 93,300 +7% 8% 26% inventory) raise pigs through the full lifecycle
Finish Only 1240 -13% 725,100 +10% 59% 45% Compared to overall production in the United
Farrow to Feeder 270 -15% 56,900 +45% 5% 1% States, finisher and farrow to feeder
operations make up a larger share of
Nursery 50 -12% 98,200 -3% 8% 8%
Pennsylvania’s pork production, while farrow
Other Practices 300 -20% 31,800 -15% 3% 7% to finish operations make up a smaller share.
In generally, specialization in certain life stages
Total 2,780 -10% 1,239,300 +9% 100% 100%
has increased efficiencies and lowered pork
(Source: National Agriculture Statistics Service, 2012 and 2017 Agricultural Census) prices in the United States,
↤ Return to Table of Contents Economic Impact of Agriculture in Pennsylvania 2021 24 ↦Fruits and Vegetables
Fruit and vegetable production and processing is a subset of both crop production and food and beverage
processing and is inclusive of seed, nut, and mushroom production. While canned fruit and vegetable
manufacturing makes up the largest share of direct output in this category, mushrooms and food grown
under glass represent a larger share of jobs, given the labor-intensive nature of those activities.
From 2012 to 2017, Pennsylvania saw a 6 percent increase in its number of vegetable farms, an increase
driven by growth in the smallest operations (less than one acre). However, because these operations
make up only 1 percent of total acreage, their impact on total production is minimal compared to midsized
and large operations. Midsized operations of 15 to 100 acres also grew in number over this period (by 12
percent), and account for approximately 37 percent of total acreage. Large farms, which make up more
than 60 percent of total acreage as of 2017, have decreased in number from 94 operations in 2012 to 82
in 2017, but grown in average acreage.
States within the region vary widely in the share of crop operations with vegetables or fruit, with 37
percent all crop sales in New Jersey and New York falling within these categories, and Delaware and West
Virginia also having high levels of fruit and vegetable operations and sales. Maryland has a similar profile
to Pennsylvania, while Ohio has a much higher share of corn and soy sales compared to the rest of the
region, which drives down its fruit and vegetable share (see the table on the following page).
$3.5B 16,300
DIRECT OUTPUT DIRECT JOBS
$724M $186M $124M 7,000 jobs 900 jobs
Mushrooms & Mushrooms & 3,300 jobs Vegetable &
Fruit Farming Vegetable & Food Grown Fruit Farming
Food Grown Melon
Melon Under Glass
Under Glass
$425K $2.4B $113M 5 jobs 4,800 jobs 300 jobs
Tree Nut Canned Fruit & Frozen Fruit & Tree Nut Canned Fruit & Frozen Fruit &
Farming Veg Manu. Veg Manu. Farming Veg Manu. Veg Manu.
$2.6B 15,300
INDIRECT & INDIRECT &
INDUCED INDUCED JOBS
$6.1B 31,600
TOTAL OUTPUT TOTAL JOBS
↤ Return to Table of Contents Economic Impact of Agriculture in Pennsylvania 2021 25 ↦Fruits and Vegetables
PA Region Fruit and Vegetable Sales and Farms by State, 2017
Although Pennsylvania ranks only 22nd in crop production
nationally (based on sales), it has the 5th highest number of Farms as Sales as
fruit and vegetable farms in the United States. This is because Number of Avg Sales/ Share of Share
these operations have relatively low sales on average, with the State Farms Sales ($M) Farm State Total of All Crops
average sales per farm at $49,500 (compared to a national
Pennsylvania 7,240 $358.9 M $49,500 21% 13%
average of $259,900 and a regional average of more than
$90,000). Delaware 270 $64.1 M $240,900 20% 20%
While Pennsylvania’s vegetable sales total of $187.3 million Maryland 1,510 $95.1 M $63,000 22% 10%
puts it in only 18th place nationwide, the state is relatively
New Jersey 2,340 $363.8 M $155,500 36% 37%
strong in sweet fresh market corn, cantaloupe, fresh market
pumpkin, snap pea processing, and fresh market strawberries New York 6,670 $778.5 M $116,700 31% 37%
(all of which are classified under vegetable production by the
Ohio 4,910 $193.4 M $39,400 10% 4%
Agricultural Census).
West Virginia 1,850 $32.8 M $17,800 14% 21%
United States 185,310 $48,165.1 M $259,900 18% 25%
(Source: National Agriculture Statistics Service, 2017 Agricultural Census)
Mushrooms (which are actually fungi and are not included in the table above) play an
important role in Pennsylvania agriculture, representing an especially strong
competitive advantage in the state compared to the U.S. as a whole. With 113
operations and 17.3 million square feet in production, Pennsylvania ranks number one in
the United States in mushroom production and sales. Its $612 million in sales represents
46 percent of the U.S. total, even as this amount remains a small share of the state’s
overall crop production.
Although California, Washington, and Florida dominate fruit, tree nut, and berry sales in
the U.S. (making up 86 percent of sales), Pennsylvania is particularly strong in apples,
for which it is ranked 4th nationally (for 4.6 percent of the U.S. total), and peaches, for
which it is ranked 3rd (for 3.4 percent of the U.S. total).
Peach production and value was an area of particular growth, as yields increased from
4.73 tons per acre in 2012 to 5.35 in 2017. These increased yields meant that production
volume increased despite there being less acreage in cultivation, and higher prices meant
further increase in the value of utilized production. This 14 percent increase in value
contributed to Pennsylvania surpassing Georgia and South Carolina in both tonnage
and dollar value of peach production in 2017.
↤ Return to Table of Contents Economic Impact of Agriculture in Pennsylvania 2021 26 ↦Food and Beverage Processing
Food and beverage processing includes a wide range of manufacturing Subsectors such as dog and cat food manufacturing, snack food
activities that interact directly with other elements of the agricultural manufacturing, bottled soda and water manufacturing, and tobacco product
industry. Pennsylvania has a number of large food and beverage processing manufacturing experienced the largest declines, as sales of tobacco and soda
companies and plants, particularly in snack food manufacturing (including continued a downward trend during this time period. Also a factor were plant
pretzels and chips, both particular strengths in the state), as well as bread closures in these categories including of the Altria Tobacco Plant in Limerick
and bakery products and bottled drinks. Changes in an individual large and the Coca-Cola Bottling Company of the Lehigh Valley, as well as the sale
company’s or plant’s operations can drive substantial changes in of animal food manufacturer Ainsworth to Smuckers, which moved some
manufacturing totals from one year to the next. In addition to the large operations out of state. Other categories realized impressive growth,
enterprises that have a strong presence in Pennsylvania, there are a large however. For example, Frozen Cakes and Other Pastries, while small,
number of small companies that also contribute to food and beverage increased the number of Pennsylvania operations from eight plants in 2016
processing in the state. to eleven in 2019. It is important to note that information on food
manufacturing is not available from the Agricultural census, so these
While this sector as a whole realized a -$2.8 billion decline since 2017,
numbers come from other sources, including IMPLAN and secondary
growth rates between individual subsectors had significant disparities.
research.
Examples of activities included in food & beverage $22.4B 50,250
processing include: DIRECT OUTPUT DIRECT JOBS
Bread and Bakery Products $11.2B $4.3B 38,000 jobs 2,900 jobs
Animal Food Animal Food
Food Processing Food Processing
Manufacturing Manufacturing
Frozen Cakes and Other Pastries
$2.4B $3.4B 4,100 jobs 4,900 jobs
Alcoholic Other Beverages Alcoholic Other Beverages
Dry Pasta, Mixes, & Dough Manufacturing Beverages & Ice Beverages & Ice
Roasted Nuts & Peanut Butter Manufacturing $1.0B 350 jobs
Tobacco Product Tobacco Product
Manufacturing Manufacturing
Coffee & Tea Manufacturing
$15.9B 89,750
INDIRECT & INDIRECT &
Tortilla Manufacturing INDUCED INDUCED JOBS
Mayonnaise, Dressing, & Sauce Manufacturing
$38.3B 140,000
Other Snack Food Manufacturing TOTAL OUTPUT TOTAL JOBS
↤ Return to Table of Contents Economic Impact of Agriculture in Pennsylvania 2021 27 ↦You can also read