FIFA World Cup 2014 and Olympics Games 2016 in Brazil: Risks and opportunities for the economic and social development of the country
←
→
Page content transcription
If your browser does not render page correctly, please read the page content below

CATOLICA LISBON SCHOOL OF BUSINESS AND ECONOMICS

 FIFA World Cup 2014 and Olympics
       Games 2016 in Brazil:
   Risks and opportunities for the
 economic and social development of
            the country
                      Master Thesis 2011/2012
                                 Marc-Antoine RIOU - 152109352
                                            03/01/2012

   Dissertation submitted in partial fulfillment of requirements for the degree of MSc in Business
               Administration, at the Universidade Católica Portuguesa, January 2012

Thesis Advisor: Professor Joao Cesar das Neves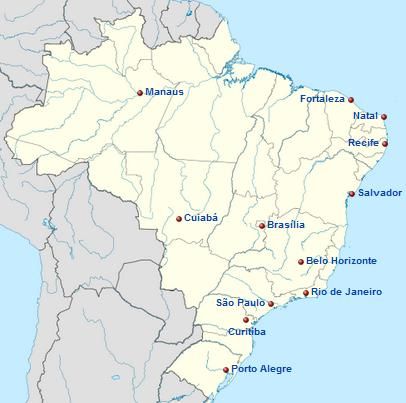
Index
I.         Introduction ................................................................................................................................. - 5 -
II.        Economics of FIFA World Cup and Olympic Games organization ............................................... - 7 -
      A.        FIFA World Cup Economics...................................................................................................... - 7 -
           1.      Organization framework of a men’s FIFA World Cup.......................................................... - 8 -
           2.      FIFA & LOC: Two economic models ..................................................................................... - 8 -
      B.        Olympic Games Economics ................................................................................................... - 12 -
           1.      The Olympic Movement’s organization ............................................................................ - 12 -
           2.      The organization of the Games ......................................................................................... - 13 -
           3.      IOC & OCOG: Expenses and revenues ............................................................................... - 14 -
      C.        Outcomes of previous events ................................................................................................ - 17 -
           1.      In “rich countries” ............................................................................................................. - 17 -
           2.      In “emerging countries” .................................................................................................... - 21 -
           3.      Conclusion ......................................................................................................................... - 22 -
III.            Economics of the events ....................................................................................................... - 23 -
      A.        The Brazilian LOC’s budget (FIFA World Cup) ....................................................................... - 23 -
      B.        The Brazilian OCOG’s budget (Olympic Games) .................................................................... - 23 -
      C.        Public and private investments needed ................................................................................ - 24 -
           1.      2014 FIFA World Cup in Brazil ........................................................................................... - 24 -
           2.      2016 Olympic Games in Rio de Janeiro ............................................................................. - 27 -
IV.             Risks and opportunities for the Brazilian socio-economic environment .............................. - 29 -
      A.        The current economic and social situation in Brazil.............................................................. - 29 -
           1.      Economic evolution ........................................................................................................... - 29 -
           2.      Economic Situation ............................................................................................................ - 30 -
           3.      Balance of payments ......................................................................................................... - 31 -
           4.      Social situation .................................................................................................................. - 32 -
      B.        Expected economic impacts on GDP and balance of payments? ......................................... - 33 -
           1.      Methodology and definitions ............................................................................................ - 33 -
           2.      Expected increase in GDP: figures and forecasts .............................................................. - 35 -
           3.      Balance of payments: which impacts? .............................................................................. - 40 -
      C.        Social and environmental impacts ........................................................................................ - 40 -
           1.      Geographical and social imbalances ................................................................................. - 40 -
           2.      The stake of sustainable development ............................................................................. - 41 -
V.         Conclusion ................................................................................................................................. - 43 -

                                                                                                                                                         -2-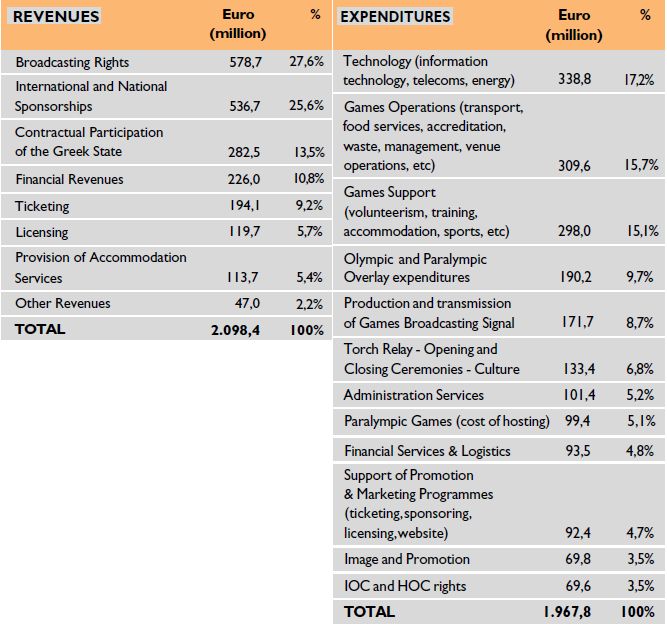
VI.       References ............................................................................................................................. - 44 -

LIST OF TABLES

Table.1 FIFA World Cup™ Income Statement template

Table.2 Local Organizing Committee Income Statement template

Table.3 FIFA World Cup™ Consolidated Income Statement

Table.4 Evolution of Athen’s OCOG budget

Table.5 Athen’s OCOG Financial Results1

Table.6 Impact of Athens Olympics on GDP

Table.7 2006 FIFA World Cup™ Related Income Statement (2003-2006)

Table.8 2010 FIFA World Cup™ Related Income Statement (2007-20010)

Table.9 South African LOC Income Statement

Table.10 Brazilian’s OCOG budget

Table.11 2016 Olympic Games infrastructure investments (in 2008 and 2016 value)

Table.12 2016 Olympic Games Sport Venues Investments (in 2008 value)

Table.13 Brazilian Economic Indicators

Table.14 2006 World Cup and 2014 World Cup comparisons

LIST OF GRAPHS

Graph.1 FIFA revenues repartition (2007-2010)

Graph.2 Organization scheme LOC - FIFA

Graph.3 FIFA Financing Situation

Graph.4 FIFA Liabilities Evolution

1
    Source : Athens OCOG Official Report

                                                                                                                                                   -3-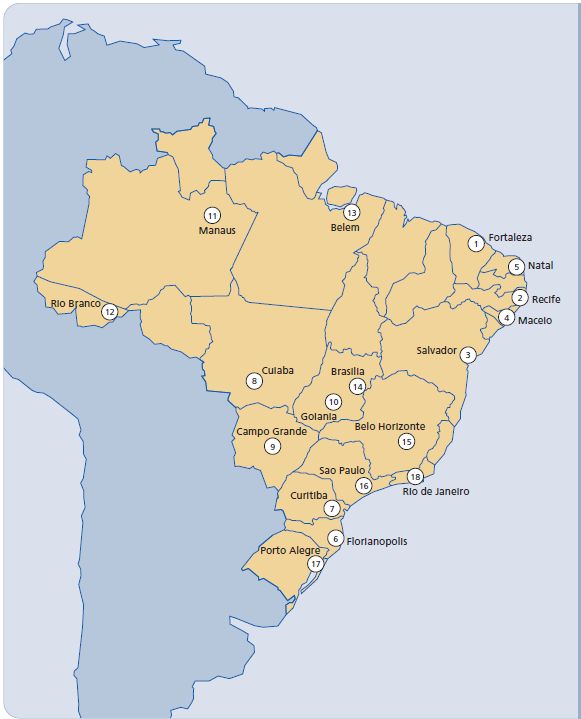
Graph.5 Olympic Movement’s Organization

Graph.6 The Olympic Games Organization

Graph.7 IOC’s Repartition of Revenues (2001 -2008)

Graph.8 German LOC Income Statement

Graph.9 Brazilian’s candidates’ cities

Graph.10 Brazilian’s chosen cities

Graph.11 2014 World Cup infrastructure investments

Graph.12 Brazil’s current account balance (US $ vs Real)

                                                           -4-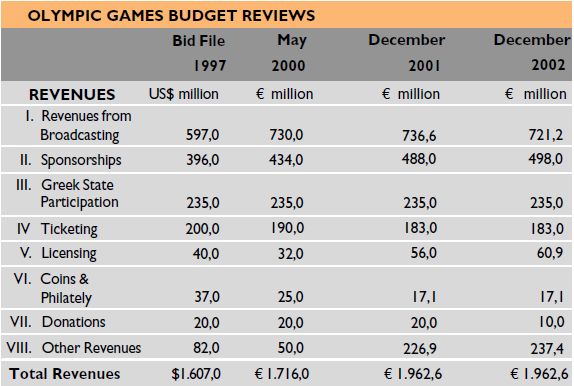
I.      Introduction

Recently many experts have recognized the growing economic power of Brazil. The country now
belongs to the so called BRICS group (Brazil, Russia, India, China, South Africa), acronym of these five
emerging powers, and is currently trying to strongly modernize its society and economy. The country
has had a regular and sustained growth in recent years (7.5% in 2010), which allowed him to climb to
eighth place in the GDP World ranking in early 2011. Brazilians already called the next decade "the
golden decade of Brazil."

Brazil believes in the possibility to become global and economically powerful through the
organization of international events. Everything began in 2007 with the Pan Americans games in Rio
de Janeiro. In 2009 and 2011 Brazil has successively obtained the organization of the 2014 FIFA
World Cup and the 2016 Olympic Games in Rio de Janeiro. Never has a country obtained the
organization of the two biggest sport events in the world two years apart. This success is the result of
an extraordinary will to strengthen the power of the country at regional and global levels based on
the idea that organizing such events will be profitable for the country’s economy and influence.

In fact many countries (Japan in 1964, South Korea in 1988, Spain in 1992 or South Africa in 2010 for
example) have relied on the organization of major sport events as a springboard for economical and
social progress with varying degrees of success. Indeed, the organization of events in this way does
not necessarily guarantee a financial windfall for the host country and can even generate social
imbalances. What about Brazil? Will the dual organization of the 2014 World Cup and Olympic
Games in 2016 maximize the benefits of these major events, or is it a risk in terms of investments
and resources consumption? However, Brazil has little time to turn these events into success: the
main challenges are the needed renovation of stadiums, the construction of airport infrastructures
and hotels, and also a strong attention given to security measures.

The aim of this thesis is to try to analyze the economic viability of these events themselves and also
their impacts (positive and/or negative) on Brazilian economy, society and influence across the
world. The first part of the thesis will be dedicated to an economic and financial analysis of a FIFA
World Cup and an Olympic Games. Attention will be given to the same events previously organized in
the world (South Africa 2010, Beijing 2008…). In the second part of the thesis will be discussed the
potential impact of the organizations of these events on the Brazilian economy, the analysis will be

                                                                                                    -5-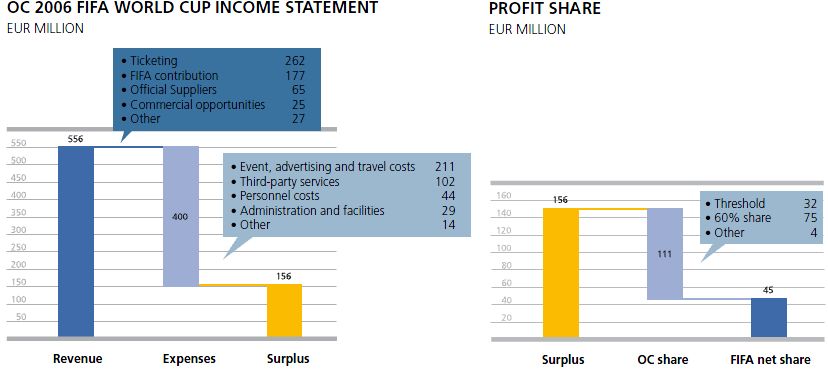
focused on the differences between structural and contextual changes. Finally the thesis will be
about the impacts of these events on the social contract in Brazil. The question of a potential danger
for the national cohesion will be asked.

The basis of the analysis of the impacts on Brazil economy and society of the organization of the two
events will be the official estimates published in governmental agencies’ reports (Ministry of Sport
etc.). GDP will be the main economic indicator to be analyzed along with the balance of trade. The
method used in these reports is based on the Multiplier Effect method.

Of course official reports are also a mean for public authorities to legitimate their former choice to
bid for the organization of these events that is why the figures disclosed might be too much optimist.
The value added of this thesis will be to use former independent reports on previous Olympic Games
and FIFA World Cup to challenge these official figures.

                                                                                                  -6-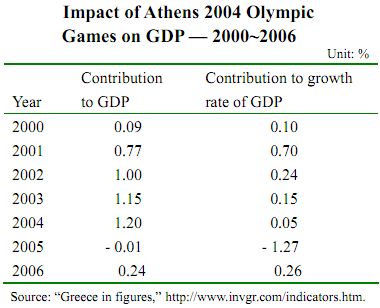
II.     Economics of FIFA World Cup and Olympic Games organization

In order to study the economical consequences of the 2014 FIFA World Cup and 2016 Olympic
Games in Brazil it is necessary to analyze the economics of a FIFA Men’s World Cup and an Olympic
Games tournament. This first part also aims to understand these subjects without paying attention to
the eventual consequences of the organization of these events on the local economy. FIFA Men’s
World Cup economics will be studied first, then the Olympic Games economics and finally the
outcomes of the recent FIFA Men’s World Cups and Olympic Games.

        A.      FIFA World Cup Economics

FIFA (Fédération Internationale de Football Association) is the international governing structure of
football. This is a federation of local football associations (Federação Portuguesa de Futebol,
Fédération Française de Football…). The legal structure of FIFA is an “association according to Art. 60
ff. Swiss Civil Code” and its headquarters are in Zürich. FIFA is in charge of the organization of one of
the biggest sport event and major international tournament in the world: FIFA World Cup. As such
FIFA is the owner of trademarks such as 2010 FIFA World Cup™, 2014 FIFA World Cup™ etc. The
tournament organized each four years is the main event of the FIFA. It represents quasi exclusive
source of revenues for FIFA. For example over the 2007-2010 period 93% of the FIFA’s revenues were
related to football events of which 92% for the sole 2010 South Africa World Cup. These figures are
relatively the same for previous periods.

Graph.1 FIFA revenues repartition (2007-2010)

                                                                                                     -7-
1. Organization framework of a men’s FIFA World Cup
“FIFA works with a four-year financial period, beginning on 1st January of the year following each FIFA
World Cup™”2. The organization of each World Cup is delegated to a Local Organizing Committee
(LOC). This committee is composed of (i) a management board, in which FIFA Secretary General has
to be present, and (ii) a group of directors mainly composed of representatives of the local
government, representatives of the local football association, representatives of FIFA and also
influent persons from the labor and business community. These directors can also be divided into
several sub-committees divided by subjects (finance, legal…). The legal structure of this committee
can be chosen by each organizing country but an agreement describing the economic and legal
relationships between the committee and FIFA must be signed.
In order to fully comprehend the economic systems involved in the organization of a recent FIFA
World Cup, our analysis must be divided in two levels: (i) FIFA and (ii) Local Organizing Committee.
Each of these entities has its own World Cup related economic model.
2. FIFA & LOC: Two economic models
FIFA derives revenues related to its World Cup from TV rights, marketing rights, hospitality rights and
licensing rights. These revenues are generated by contracts which can guarantee a fix payment
(royalties) or a minimum payment plus a share of the profit made by the partner. The expenses
supported by FIFA and related to the event are prize money, contributions to the LOC, TV production,
benefits for football clubs (the football clubs which employ players involved in the tournament get
compensation depending on how long the player has stayed in the competition) and other operating
costs (travel, insurance, refereeing matters etc.). Profit remain inside FIFA although in some
particular cases (2010 South Africa World Cup) a part of this profit can be distributed to a Legacy
Trust which is a non-profit organization financed only by FIFA’s World Cup profit and aiming to
support public initiatives in various fields such as football development, health, education etc.
2
Source: 2006 FIFA Financial Report
-8-Table.1 FIFA World Cup™ Income Statement template
The Local Organizing Committee derives revenues from three sources: (i) ticketing (management of
ticketing is supported by FIFA but all the revenues are then transferred to the LOC), (ii) FIFA
contribution (cash payments and value-in-kind) and (iii) sponsorship from official suppliers. The
expenses supported by the LOC are all the expenses related to the stadium operations (rental,
security, power supplier…) and other operating expenses (human resources, transport, marketing,
insurance…). The eventual profit generated is split between FIFA (around 30% of profit share) and
the local football association.
Table.2 Local Organizing Committee Income Statement template3
3
Source : 2010 FIFA Financial Report
-9-In order to have a comprehensive view of FIFA World Cup economics it is necessary to produce a
consolidated income statement. The two figures below present a scheme of the relationships
between the different entities involved in the organization of a World Cup tournament and a
consolidated Income Statement template.
Graph.2 Organization scheme LOC - FIFA
Table.3 FIFA World Cup™ Consolidated Income Statement
Recently the World Cup related profit acquired a new role, as FIFA is trying to radically change the
way it funds its activities. Until 2006 FIFA pre-World Cup activities were funded with debt that was
paid back thanks to the revenues generated by FIFA World Cup (TV rights, marketing rights…). After
- 10 -the 2002 World Cup in Japan and Korea, FIFA decided to change the way its activities were funded by
the reinforcement of its equity position thanks to the incorporation of reserves. The objective was to
switch from a debt financing to an equity financing in order to secure an equity basis and so to
decrease the dependency of the organization to its World Cup. The accumulation of capital needed
for this change may explain the increase in TV rights revenues from 2002.
Graph.3 FIFA Financing Situation4
This major change has been successful. The FIFA’s equity has been increasing constantly since 2003
thanks to the incorporation of reserves (capital has remained stable at $ 4 million). This trend has
allowed FIFA to fund its 2010 World Cup (2007-2010 periods) activities only with proper resources.
Graph.4 FIFA Liabilities Evolution
1 400
1 200
1 000
800
600
400
200
-
2002 2003 2004 2005 2006 2007 2008 2009 2010
-200
Equity (million USD) Debt (million USD)
4
Source : 2006 FIFA Financial Report
- 11 -B. Olympic Games Economics
The whole Olympic activities are directly or indirectly controlled by the International Olympic
Committee (IOC). The IOC is a Swiss association ruled by the Swiss law which headquarters are based
in Lausanne. The mission of the IOC is to lead and promote the “Olympic Movement” which has as
centerpiece the organization the forth-yearly winter and summer Olympic Games, but also to
promote the values of Olympic, support the sport development all over the world and lead the so-
called “Olympic Movement”.
1. The Olympic Movement’s organization
This Olympic Movement gathers all the organizations and athletes who adhere to the Olympic
Charter that is the founder document of the IOC. The organizations which are members of the
Movement are, in addition to the IOC, the different international sports federations (IFs) and the
national Olympic committee (NOCs). The executive organ of the IOC is its executive commission
which gathers fifteen members and rules the other operating commissions (Finance, Marketing,
Sport Development, Olympic Games etc.).
International Olympic Committee (IOC) is the supreme authority of the Olympic Movement. It
coordinates the activities of all the organizations of the movement (IFs, NOCs but also some Olympic
foundations and agencies)
International Sports Federations (IFs) are non-governmental organizations which aim to
administrate the development and the organization across the world of a specific sport (FIFA for
example is one of these IFs)
National Olympic Committees (NOCs) are the representative of the Olympic Movement at a national
scale. Their mission is to promote and develop the Movement in their countries. They are the
organizations responsible, with the IOC, to create the so-called Organizing Committees of Olympic
Games (OCOGs) directly responsible for the organization of Olympic Games in a city. Each NOC
belongs to a regional association gathering all the NOCs on a geographic basis (the European Olympic
Committees in Europe for example).
- 12 -Graph.5 Olympic Movement’s Organization
2. The organization of the Games
The organization of the Games is delegated by the IOC to a city (not a country) seven years before
the effective date of the Games. Once a city has been chosen to organize the next Olympic Games,
the IOC delegates the administration and the organization of the event to the National Olympic
Committee of the country in which the city is located as well as the city itself.
This mandate is formally organized under a common agreement: the Host City Contract which settles
the rules of the partnership between the IOC, the NOC and the city during the organization of the
Games.
In agreement with the IOC the NOC has to form an Organizing Committee (OCOG). The whole
organization of the Games will be looked after by this committee which will receive instructions and
financing from and report directly to the IOC. The executive organ of this committee has to include at
least some members of the IOC, the President and the Secretary General of the concerned NOC and
representative of the city. In general this committee also includes representatives from the public
authorities and national prestigious figures (well-known athletes etc.).
- 13 -The organization of the entire operating part of the Games is exclusively held by the local OCOG
thanks to its revenues (see below). The rest of the organization which consists in providing the city
chosen with the full infrastructures and venues needed is organized by the city in cooperation with
the OCOG, the different public authorities and sometimes the private sector. These investments
(merely infrastructural) are not funded by the OCOG but by public authorities and/or private sector
and are often realized in the first three years of preparation. This part of the thesis will only focus on
the economics of the OCOG so on the operating part of the organization.
Graph.6 The Olympic Games Organization
3. IOC & OCOG: Expenses and revenues
The IOC derives its revenues from two sources: (i) the sale of broadcasting rights and (ii) the
worldwide marketing and sponsorship program (TOP).
The IOC is responsible for the commercialization of all broadcasting rights (TV, mobile, Internet)
related to Olympic Movements events. The objective is to maximize the revenue in order to ensure
the financial support of the Olympic Movement’s organization but also to maximize the worldwide
coverage of these events. Long-term contracts are signed between the IOC and the different
- 14 -broadcasting associations around the world securing recurrent incomes for the IOC. The broadcasting
production is entirely managed by the IOC through its subsidiary the Olympic Broadcasting Services.
The IOC’s sponsorship program, also called TOP, is the worldwide sponsorship activity of the
organization. This program was created in 1985 with the mission to provide Olympic organizations
with a secured long-term sponsorship program allowing the different OCOGs to have a sure basis of
revenues during the four years of preparation previously to the Olympic Games. The program
consists in a contract signed between the IOC and a corporation (which become a Worldwide
Olympic Partner) for a four-year period (quadrennium). “The TOP program provides each Worldwide
Olympic Partner with exclusive global marketing rights and opportunities within a designated product
or service category. The global marketing rights include partnerships with the IOC, all active NOCs
and their Olympic teams, and the two OCOGs and the Games of each quadrennium. The TOP Partners
may exercise these rights worldwide and may activate marketing initiatives with all the members of
the Olympic Movement that participate in the TOP program.”5 The worldwide Olympic partners for
the 2009-2012 periods are eleven (Coca-Cola, Acer, Atos, Dow, GE, MacDonald’s, Omega, Panasonic,
P&G, Samsung, and VISA).
The IOC distributes during each Olympic period (the four years prior to the Games) around 90% of its
revenues to the organizations which belong to the Olympic Movement including of course the
OCOGs (which receive around 60% of the total amount distributed). This income represents around
50% of a total OCOG’s budget.
Graph.7 IOC’s Repartition of Revenues (2001 -2008)
The funding of the operating part of the Games is organized exclusively through the local Organizing
Committee of the Games. All the infrastructures built on the occasion of the Games (stadia, Olympic
5
In 2010 IOC Marketing Report. www.olympic.org
- 15 -Village, airports, metro, highways etc.) are excluded from the economical analysis of this part of the
thesis since they are looked after by public authorities (governments, region, city etc.) and often still
being used after the end of the Games. The OCOGs are namely exclusively privately funded. This is a
relative new situation in fact in the 70’s and 80’s the OCOGs were mainly funded with public money.
The revenues of the OCOG come from two major sources: the International Organizing Committee
funding (see above) and the domestic commercial revenues. The domestic commercial revenues
include the sales of tickets, the licensing programs around the brand name (London 2012, Rio 2016
etc.) and the domestic sponsorships. All these programs are managed directly by the OCOG but
supervised by the IOC executive commission which controls the compatibility of all these programs
with the IOC’s own sponsorship programs. “The Olympic Games domestic sponsorship program
grants marketing rights within the host country or territory only. The host country NOC and the host
country Olympic team participate in the OCOG sponsorship program because the Marketing Plan
Agreement requires the OCOG and the host country NOC to centralize and coordinate all marketing
initiatives within the host country. Domestic OCOG sponsorship programs usually include several tiers
of partnership, which may include sponsors, suppliers and providers.”6
The IOC tries to negotiate each contract it signs (broadcasting, sponsorship) in order to cover all the
operating costs of the OCOGs. The past Olympic Games show that between 40% and 60% of a total
OCOG’s budget is covered thanks to the money coming from the IOC.
Excluding all the investments in infrastructures and venues (Olympic Village, Stadia etc.) that are paid
by public authorities and/or private organizations, the Games-related costs are fully covered by the
OCOGs. These costs are only organizational and administrative. The most important costs are those
linked with Human Resources (around 15% of the total operating expenditures), followed by all the
information systems, the operation of the different venues (power supply, security etc in Olympic
Village and stadia), the opening and closing ceremonies related costs and the hosting charge of the
Olympic Movement’s personnel.
Previously to the staging of the Games agreements are signed between the IOC, the concerned NOC,
the OCOG and local authorities setting up the rules in case of a shortfall or a profit after the Games
end. The past experiences show that in case of a profit, the surplus is shared between the IOC (often
up to the percentage of IOC’s funding in the total budget of the OCOG), the local NOC and a legacy.
After the 1976 Montreal Olympic Games, which led to a huge debt shared between the IOC, the
Canadian NOC and the city of Montreal, the IOC now asks for financial guarantee from all public
6
In 2010 IOC Marketing Report. www.olympic.org
- 16 -authorities in case of shortfall. Most of the time deficits are paid by local authorities and government
thanks to tax increases and/or public borrowings. In some special cases and especially when the
deficit is forecasted before the beginning of the Games the IOC can step in and participate to the
refunding of deficit mainly by looking for new worldwide commercial partners. This was the case
during 2010 Winter Olympic Games in Vancouver.
C. Outcomes of previous events
In this part the analysis will focus on the Olympic Games economical results (the OCOGs results) from
the 2004 and 2008 editions in Athens and Beijing and also on the 2006 and 2010 editions of FIFA
World Cup in Germany and South Africa.
1. In “rich countries”
2004 Athens Olympic Games: the local OCOG was responsible for the entire operating organization
of the games like for the previous games while public authorities took care of the needed
infrastructures (Olympic Village, new airport…). The final budget of the OCOG was set up at € 1.9 bn
with a Greek State’s participation of € 235 M.
Table.4 Evolution of Athen’s OCOG budget7
7
Source : Athens OCOG Official Report
- 17 -After the Games a budget surplus of 130 M€ was made. Among these 130 M€, 123 M€ were given
back to the Greek State following a previous agreement that stated that the OCOG would have to
participate to “series of actions, such as covering expropriation expenditures, which were deemed
necessary for the hosting of the Games, and always on instructions of the Greek State”8 in case of a
final surplus. A final profit of € 7 million has also been calculated. The total cost of staging the
Olympics (including public investments) reached € 9 bn.
Table.5 Athen’s OCOG Financial Results9
8
Source: Athens OCOG Official Report. p. 520
9
Source : Athens OCOG Official Report
- 18 -Table.6 Impact of Athens Olympics on GDP10
The impact of the Olympics on the Greek economy has been positive all along the years after the
event. The average contribution to the GDP growth is around 0.5%. This data will be used later to
assess the validity of the economic forecasts disclosed by Brazilian public authorities
2006 FIFA World Cup in Germany: The total financial balance for FIFA (FIFA revenues and expenses
linked with 2006 Germany FIFA World Cup™) was CHF 1.977 million.
Table.7 2006 FIFA World Cup™ Related Income Statement (2003-2006)11
The German organizing committee generated a net profit of € 156 millions. This amount was shared
between FIFA (29%) and the LOC which distributed this money to the German football association as
well as to German sport foundations. FIFA had contributed (including ticketing) up to 80% of the total
revenues generated by the LOC.
10
Source : http://www.invgr.com/indicators
11
Source : FIFA 2006 Financial Report
- 19 -Graph.8 German LOC Income Statement12
Four different studies were disclosed before the beginning of the event aiming to estimate the
impact of the World Cup on the German economy. In a study published in 2005 Ahlert13 uses a
simulation model called Sport, using the Input-Output method. The results of this study believe that
German GDP would increase by about € 1.75 billion, which represents only 0.05% of the predicted
GDP in 2007. It was also forecasted that 1.1 million foreign tourists would travel to Germany for the
Cup injecting around € 909 million in the national economy. In a study published in 2006 a German
Chamber of Commerce states that the World Cup would add around € 10 billion into the GDP (Davis,
2006)14. The German Football Association published a study which forecasts a net economic benefit
of € 2.5 billion (Brenke and Wagner, 2006)15. The Credit Suisse in a study published in 2005 estimated
that the direct impact of World Cup football on the German economy remain moderate (about 0.2 to
0.5% of GDP). The differences between all these estimations highlight the difficulty of determining
the monetary impact of such an event before it has started. Regarding the public money invested in
infrastructures, securities etc for the World Cup, official figures announce a total amount of € 4
billion that seems reliable.
Finally the figures of the Deutsche Bundesbank report for the second quarter of 2006 an increase in
GDP growth of 0.25% related to the World Cup. In the third quarter, household final consumption
increased by 0.7%, which contributes 0.4% to GDP growth. This represents a total amount of roughly
€ 6 billion. The tournament also attracted around 2 million of foreign tourists (this represents a 25%
increase regarding the previous figures for this period) who spent around € 600 million in Germany.
12
Source : FIFA 2006 Financial Report
13
Ahlert, G. (2005). What does Germany expect to gain from hosting the 2006 Football World Cup?, GWS
Discussion Paper Series, Onsnabreuk, Germany: Institute of Economic Structures Research
14
Davis, O. (2006). World Cup 2006 Economics, Associated Content
15
Brenke, K. and Wagner, G. (2006) The Soccer World Cup in Germany. Weekly Report No 3, Berlin:
German Institute for Economic Research
- 20 -This data will be used later to assess the validity of the economic forecasts disclosed by Brazilian
public authorities
2. In “emerging countries”
2008 Beijing Olympic Games: According to its official report the Chinese Organizing Committee
made a profit of $ 146 million (income of ¥ 20.5 bn and expenses of ¥ 19.34 bn). The costs supported
by the Committee were higher than expected but this has been covered by higher revenues from
domestic sponsorships (total revenues reached around $ 3bn. whereas “only” $ 2bn. was expected).
There are no official figures about the total public investments made in relation with the Games but
some experts evaluate them around $ 40bn.16
2010 FIFA World Cup in South Africa: The total financial balance for FIFA was positive. Revenues
derived from the 2010 FIFA World Cup™ was over $ 3.5 bn (without ticketing) to be compared with
total costs of $ 1.3 bn which means a net profit of $ 2.2 bn.
Table.8 2010 FIFA World Cup™ Related Income Statement (2007-20010)17
The Local Organizing Committee made a light profit of $ 10 million. This money was given to South
African charities and to the South African Football Association.
16
ANDREW ZIMBALIST – Circling The Basis, Essays on the Challenges and Prospects of the Sport Industry (2011)
17
Source : FIFA 2010 Financial Report
- 21 -Table.9 South African LOC Income Statement18
3. Conclusion
Looking at these figures for the XXI century events, Olympic Games and FIFA World Cups seem
“profitable”. Both in “rich countries” and “emerging countries” the organizing committees got a final
positive balance. This highlights the fact that the financial outcomes of organizing committees do not
seem to depend on the level of economic development of the organizing countries. In fact reaching a
balanced final account only depends on the ability of the concerned countries to adjust their
expenses on their projected revenues.
However these figures do not take into accounts all the public investments made to organize these
events. They neither do take into account all the consequences on local economies. To fully
understand the impacts of such events on a local economy and society it is necessary to analyze all
the eventual consequences and expenses. In fact it is important to distinguish between the analysis
of Organizing Committees budgetary balance (that could be considered as financial or operating) and
the wider impact of these events on the whole national economy. These impacts that derive from
private and public investments are associated with factors such as better infrastructure or increase in
tourism. This is what will be discussed in the next part along with a slight look on the projected
budgets of the Brazilian LOC (FIFA World Cup) and the Brazilian OCOG (Olympic Games).
18
Source : FIFA 2010 Financial Report
- 22 -III. Economics of the events
Brazil will host the next FIFA World Cup in 2014 and also the 2014 Olympic Games in Rio. In this part
will be analyzed the economics of these two sport mega-events.
A. The Brazilian LOC’s budget (FIFA World Cup)
Brazil will host the 2014 FIFA World Cup. The situation is a bit special for two different reasons: (i) the
fact that Brazil was the only candidate country at the moment of the final vote of FIFA
representatives (Colombia was the only country to declare its candidacy in 2006 but finally withdrew
it in 2007 facing not enough preparation) and (ii) the fact that the CBF (the Brazilian football
association) is a totally private hold organization without any relationships with public authorities.
The first consequence is the lack of public figures for the projected LOC’s budget. As a private
company the CBF, responsible for the organization of the tournament, is not forced to disclosure its
accounts. The only things that are publicly disclosed at the time are the name of the LOC members
and the name of the stadiums which will host matches. Even in the official report from the FIFA
inspection committee it is clearly mentioned that “unlike most previous bids, there is no evidence of
corporate support through sponsorship of the bid. It may be that this is intentional and that the bid
LOC has not sought financial support from corporate Brazil”19.
The only thing we know for sure is that the FIFA inspection committee confirmed the budget
presented by the Brazilian’s LOC.
B. The Brazilian OCOG’s budget (Olympic Games)
The budget for the Rio 2016 Olympic Games was presented in 2010 by the Brazilian committee to the
finance inspection committee of the IOC. The financial results from previous Games (Beijing, Athens
and Sydney) along with outcomes from the 2007 Pan American Games organized in Rio have been
used to prepare this budget. The Brazilian government and public authorities (State, City
governments) are fully involved in the organization of the games and they have signed letters of
guarantee that stipulate that they are committed to (i) fund the OCOG, (ii) invest in the needed
infrastructures and (iii) cover any unexpected economic shortfall.
The budget has been established in Brazilian Real and then converted into US dollar. All the
estimates of revenues and expenditures have been prepared taking into account the evolution of the
economic environment in Brazil including the expected inflation rate. This has been done thanks to
the projected figures of the National System of Consumer Price Indices, the Central Bank of Brazil and
the National Monetary Committee. The inflation target of the Central Bank was 4.5% for 2010 (the
real CPI inflation rate for 2010 was 5.04%) and 3.5% for the years 2011 to 2016. Coverage protective
policy has been adopted by the committee to limit financial risks of exchange rates variation.
19
in Brazil Bid Inspection Report for the 2014 FIFA World Cup™
- 23 -The budget is of course balanced. The total revenues expected reach USD 2.8 billion. The big novelty
is that it breaks with past editions where OCOGs were almost exclusively private funded. The budget
presented by the Brazilian OCOG includes public money (25%) brought to the table by Federal, State
and Cities authorities (one-thirst each). The IOC’s contribution only represents 31% of the total
budget.
Table.10 Brazilian’s OCOG budget 20
Revenues (Millions) 2008 2016 %
BRL USD BRL USD
IOC Contribution 1 742 871 2 338 1 010 31%
Broadcasting 1 164 582 1 563 675 21%
TOP Sponsorship 578 289 775 335 10%
OCOG Own Revenues 1 838 919 2 467 1 065 33%
Domestic Sponsorship 1 026 513 1 377 595 18%
Ticketing 722 361 969 418 13%
Licensing 90 45 121 52 2%
Public subsidies 1 383 693 1 857 804 25%
Federal Government 461 231 619 268 8%
State Government 461 231 619 268 8%
City Government 461 231 619 268 8%
Other 667 334 896 387 12%
TOTAL 5 630 2 817 7 558 3 266 100%
C. Public and private investments needed
In this part will be analyzed the public and private investments (stadiums, airports, roads, venues…)
needed to ensure the good organization of the two events.
The first thing to be mentioned is the fact that Brazil will use the efforts made in the previous Pan
American Games (2007) and CISM World Military Games (2011) which can guarantee the early
execution of some infrastructures that will be used during the World Cup and the Games. We remind
you here that temporary venues are in charge of the organizing committees.
There are very significant differences between the involvements of public authorities in the funding
of World Cup and Olympic Games. During the bidding process for the organization of the 2014 FIFA
World Cup, the Brazilian government announced that the tournament will be entirely privately
funded except the eventual transport, security or medical infrastructures that could eventually
improve the local situation and/or be useful for the 2016 Rio Olympic Games.
1. 2014 FIFA World Cup in Brazil
The main investments needed for the organization of the World Cup are stadiums construction
and/or renovation. Facing the beginning of the 2007 economic crisis and the first bad feedbacks from
the organization’s report of the Pan American games government and the CBF (the Brazilian football
20
Source : Rio 2016 Candidacy File
- 24 -association) decided together to give priority to private funding or eventually to private-public
partnerships (the famous PPPs).
Concerning the stadiums a first list of candidate cities to the hosting of matches has been presented
and some first contacts have been taken with eventual private companies. At the time of the bid
(2007) eighteen cities were officially candidates.
Graph.9 Brazilian’s candidates’ cities 21
The final decision on the cities selected to host matches has been announced in May 2009. Twelve
cities have been chosen.
Few cities have provided information about the total amount of money needed to restore and/or
build stadiums. Public information about this issue is quite impossible to be found. The FIFA just
disclosed that according to an estimate made during the bid process by the LOC USD 1.1 billion were
needed. This money had to be brought by the private sector since the government announced that
he will not fund this part of the organization of the Cup. Two years after Brazil was chosen to
organize the cup most of the stadiums had not found yet private investors interested in injecting the
money needed in the upgrading or building of the stadiums. Because of this lack in funds the
Brazilian government decided to intervene through the Bank for Social and Economic Development
(BNDES for Banco de Desenvolvimento Economica e Social) which will lend money to corporations at
21
Source : Brazil Bid Report (FIFA)
- 25 -a rate defined by the government. This rate (Taxa de Juros de Longo Prazo) is around 6% which is
much lower than the interest rate asked by the market to fund the Brazilian Treasury (around 10%).
This mechanism is a way for the government to subsidize corporations investing in stadiums. Here is
the final map of the cities hosting matches during the competition.
Graph.10 Brazilian’s chosen cities 22
Finally the total investment in infrastructures related to the FIFA World Cup according to a survey
conducted by the ministry of sport in 2010 would reach USD 18 billion of which 68% (USD 12.18
billion) will come from federal money (federal financing and general federal budget). Investments
can be split into civil infrastructure (USD 12.4 billion) and services (USD 5.6 billion). The allocation of
these funds through the different types of infrastructures is detailed in the figure below.
Graph.11 2014 World Cup infrastructure investments 23
22
Source : Wikipedia – 2014 FIFA World Cup article
23
in 2014 World Cup in Brazil Economic Impact – Brazilian Ministry of Sport
- 26 -2. 2016 Olympic Games in Rio de Janeiro
The situation concerning the involvement of public authorities in the investments needed for the
Olympic Games is much clearer. From the start the Brazilian government was actively involved in the
organization of the games both by providing Rio with the entire infrastructures needed and
supporting the local OCOG through a financial participation to its operating budget. The
infrastructures take also advantage of the previous organization of the World Cup, at least for some
civil infrastructures (airports, roads…).
The repartition of the funding between the different public authorities has been organized this way:
the three different levels of public governmental institutions (Federal, State and City) are in charge of
(i) the permanent venues and facilities, (ii) the international broadcast center/main press center
(IBC/MPC), (iii) the training venues and (iv) the transport and related infrastructures. The other public
institution involved is the Caixa Economica Federal (CEF) which is the public owned Savings Bank of
Brazil. The CEF is responsible for the funding of the (i) Olympic Village and (ii) the Barra Media
Village. The total investment represents USD 11.6 billion. USD 11 billion are dedicated to capital
investments such as airports, accommodation etc. The rest of the money will be used for operations
expenditures such as security or decoration of the city.
Table.11 2016 Olympic Games infrastructure investments (in 2008 and 2016 value)
Investments (millions) 2008 2016 %
BRL USD BRL USD
Capital Investments 22 118 11 058 29 692 12 826 95,2%
Airports, ports 2 003 1 001 2 688 1 161 8,6%
Roads and railways 8 903 4 451 11 951 5 163 38,3%
Accomodation 111 56 150 65 0,5%
Sport Venues 980 490 1 316 569 4,2%
Olympic Village 854 427 1 147 495 3,7%
Barra Media Village 1 625 812 2 181 942 7,0%
Power infrastructure 1 540 770 2 067 893 6,6%
Environmental Mgt Systems 2 410 1 205 3 235 1 397 10,4%
Medical 20 10 27 12 0,1%
Security 1 626 813 2 183 943 7,0%
IBM/MPC 406 203 545 235 1,7%
Urban legacy 1 640 820 2 202 951 7,1%
Operations 1 117 559 1 500 647 4,8%
Security 875 437 1 174 507 3,8%
Cultural programme 45 23 61 26 0,2%
Decoration of the city 24 12 32 14 0,1%
Special projects 173 87 233 100 0,7%
TOTAL 23 235 11 617 31 192 13 473 100,0%
The main expenses are dedicated to civil infrastructures like airports, roads or railways (47% of the
total amount of public money invested). The set up of environmental management systems aiming to
adapt Rio to the future environmental stakes represent another high part of these investments. The
- 27 -sport venues with an amount of USD 490 million only represent 4% of the total budget. The figure
below establishes a list of all the sport venues concerned.
Table.12 2016 Olympic Games Sport Venues Investments (in 2008 value)
Sport Venues (USD millions) 2008 %
New installations Upgradings TOTAL
Olympic Training Center 195 - 195 39,8%
Olympic Hockey Center 1 - 1 0,2%
Olympic Tennis Center 46 - 46 9,4%
Rio Olympic Velodrome - 35 35 7,1%
Maria Lenk Aquatic Center - 9 9 1,8%
Olympic Aquatics Stadium 38 - 38 7,8%
Lagoa Rodrigo De Freitas - 2 2 0,4%
Marina Da Gloria - 9 9 1,8%
Sambodromo - 13 13 2,7%
Joao Havelange Stadium - 41 41 8,4%
National Equestrian Center - 11 11 2,2%
National Shooting Center - 3 3 0,6%
Olympic Whitewater Stadium 26 - 26 5,3%
Olympic BMX Center 7 - 7 1,4%
Deodoro Arena 41 - 41 8,4%
Deodoro Modern Pentathlon Park 2 - 2 0,4%
Training Venues 11 - 11 2,2%
TOTAL 367 123 490 100,0%
Finally the total public investment forecasted for the organization of both World Cup and Olympics
would reach USD 23.8 billion in 2008 value.
- 28 -IV. Risks and opportunities for the Brazilian socio-economic
environment
A. The current economic and social situation in Brazil
1. Economic evolution
According to the World Bank Brazil is the eighth largest global economy with a GDP of 2.180 billion in
2010. From the early forms of industry (timber, sugar cane etc.), Brazil evolved to become a modern
and dynamic economy.
Brazil experienced two different situations in the 1970’s: (i) a massive influx of capital from the
United States, Europe and Japan that has been used to subsidize state companies and build more
infrastructures in the poorest areas to encourage economic take-off and (ii) an accumulation in the
external debt due to the oil shocks. The immediate result has been significant: GDP grew over 8% per
year over the decade of 1970, despite the double oil crash.
However, Brazil experienced a turnaround during the end of the dictatorship in the 1980’s and was
forced to restrict its spending. This crisis has fueled an increase in inflation and a significant increase
in the debt burden, before some economic austerity measures are taken to stabilize the currency. In
the early 1980’s, the Brazilian economy was first hit by hyperinflation. 1985, the inflation rate
reached 56% in January, 73% in February, and 84% in March. March 15th the new president is
elected and the next day, he presented an ambitious stabilization program including, among others,
a deep currency reform. Three months later, obviously, this project did not meet the expectations of
its authors: indeed, inflation resumed in the same way as before, along with a new recession which
was different from previous ones. At the end of this episode in 1987, the government negotiated an
agreement with its creditors to reschedule debt payments, after suspending its payments. The
agreement did not have the expected results, but was nevertheless enough for the total economic
output ensures a trade surplus to cover the interests of the debt.
In the 1990’s, Brazil has led a tight fiscal policy, but the consequences of the 1998 financial crisis in
Southeast Asia has forced the government to devaluate its currency, the Real, to gain
competitiveness vis-à-vis the U.S. dollar. Under pressure from the IMF, Brazil gradually reduced its
public debt, which came from 57% in 2003 to 51% in 2005. Inflation is under control since
1994. Interest rates remain high with the rate of the Brazilian central bank around 11% in le last
decade. Final borrowers may be subject to interest rates around 25%. These rates, which show that
financial institutions still fear a return of slides, weigh on growth, which varies between 0% and 5%
since the mid 1990.
In the 2000’s the budgetary situation has led Brazil to announce (March 2005) it would not use a new
IMF loan. The austerity policy conducted by the finance minister Antonio Palocci, but disapproved by
the President Lula's electoral base and part of business, has allowed the Brazilian economy to display
historical trade surpluses. Interest rates, despite having begun a significant decline in recent years
- 29 -are still high around 9.5% in May 2010. Brazil has nevertheless entered a virtuous economic circle
with low inflation and low interest (in comparison with the recent past), a high rate of growth, falling
unemployment and rising incomes. This economic success also is the consequence of a political
consensus between former President Fernando Henrique Cardoso (1995-2003) and his successor Lula
(2003-2010) on the economic policy to apply.
“The service sector is the largest component of GDP at 66.8 percent, followed by the industrial sector
at 29.7 percent (2007). Agriculture represents 3.5 percent of GDP (2008). Brazilian labor force is
estimated at 100.77 million of which 10 percent is occupied in agriculture, 19 percent in the industry
sector and 71 percent in the service sector”.24
2. Economic Situation
The current objective of the monetary authorities is to reduce the Real appreciation in order to avoid
“hot money” as much as possible. According to analysts the outlook for the national economy is
positive and the next organization of World Cup and Olympic Games are considered as a positive
source for the local economic growth in the future. The conclusion of a recent study made in June
2011 by the Canadian agency EDC (Export Development Canada) is the following:
“The outlook for the Brazilian economy is positive. Over the short-term, downside risks are associated
with a rapid deterioration in the current account balance that leave the country more exposed to
adverse financial conditions. The government also needs to prevent the formation of asset bubbles in
the economy while banking regulators deal with rising household indebtedness and debt servicing
costs relative to income. In the medium-term, both private and public consumption will continue to
grow faster than GDP, posing pressures on domestic production capacity and prices. More investment
will be needed to keep up with increasing domestic demand. Some structural reforms need to be
undertaken to ensure sustainable growth and improve fiscal accounts. The FIFA World Cup and the
Olympics will offer excellent opportunities for exporters and investors in Brazil over the next 5-7
years”25.
Table.13 Brazilian Economic Indicators26
Economic Indicators 2005 - 2009 2010 2011 (forecast) 2012 (forecast)
Real GDP growth 3,5% 7,5% 4,6% 4,5%
Inflation 5,1% 5,0% 6,6% 6,0%
Budget Balance 2,7% -2,1% -2,1% -2,1%
Export of goods 11,2% 32,0% 6,0% 6,0%
Import of goods 18,1% 42,3% 30,2% 15,2%
Current Account Bal. (% of GDP) -0,1% -2,3% -2,7% -3,5%
Reserves (months of CA debits) 8,8 11,8 9,8 8,8
External debt (% of GDP) 17,9% 16,6% 16,1% 17,3%
Exchange rate (to US $) 2,1 1,8 1,7 1,8
24
« Economy of Brazil » Wikipedia article - http://en.wikipedia.org/wiki/Economy_of_Brazil
25
EDC – Brazil General Information (June 2011)
26
Source : EIU, EDC Economics
- 30 -Graph.12 Brazil’s current account balance (US $ vs Real)27
3. Balance of payments
For a long time has Brazil not been a country open to trade. The idea that Brazil is a very big country,
big enough to stand on its own has prevailed for many years. From the 1930s, the economic
development model adopted by Brazil relied on a policy of industrialization based on imports
substitution. In terms of trade policy, this approach resulted in a strong border protection (tariffs,
quotas, import ban, etc.) to limit imports of goods that could compete with those produced on
national territory. Domestic producers, isolated from international competition, were thus protected.
This protectionist policy has also had a negative impact on the export sector in Brazil. Indeed, exports
did not benefit from any measure of support and were even hampered by restrictive measures such
as taxes on exports. Until the late 80's these policies have resulted in a low degree of trade openness:
10% of GDP rate.
The change of economic model, characterized by openness and a liberalization of the Brazilian
economy, has taken place gradually from the early 1990s. This shift has had a significant impact on
trade policy measures as restrictions on imports and exports have been reduced or eliminated. In
consequence, trade flows have increased significantly and the degree of trade liberalization in Brazil
rose from 11% in 1980 to 28% in 2004.
The country's trade balance has been in surplus since 2000. This surplus is mainly due to the export
of agricultural products. Thus the evolution of Brazil's trade balance since 2000 matches the
evolution of agricultural prices. The balance of trade in industrial products has a structural deficit for
the country but the structure of the balance of primary products and the rising prices of raw
materials increase the positive balance of the total trade balance.
27
Source : Banco Central Do Brazil
- 31 -Graph.13 Brazil’s trade balance 28
Trade balance
US$ billion
260
208
156
104
52
0
Nov Mar Jul Nov Mar Jul Nov Mar Jul Nov Mar Jul Nov Mar Jul Nov Mar Jul Nov Mar Jul Nov Mar Jul Nov
2003* 2004* 2005* 2006* 2007* 2008* 2009* 2010* 2011*
Exports Imports Balance
4. Social situation
The extent of poverty in Brazil was estimated at 35% of the population in 199929 (in the method used
by Gradin is poor who has an income 60% below the median. Poverty is thus measured in relative
rather than absolute). It then declined significantly: 26.9% in 2006, 25.1% in 2007 according to the
PNAD (Pesquisa Nacional por Amostra of Domicílios). The decline is undeniable and it occurred
mainly during the presidency of Lula. The evolution of poverty depends on three factors: the level of
inequality, their evolution and finally the growth of the economy.
Regarding the level of inequality the higher it is the harder it is to reduce poverty. However, Brazil is
one of the most unequal countries in the world. Only looking at the earned income, the Gini
coefficient30 was 0.53 in 2006 when he was around 0.30 in South Korea, around 0.45 in the USA, 0.32
in France and 0.39 in Portugal. The high level of inequality is therefore a negative factor that makes it
harder to reduce poverty.
The second factor is the change in inequality. The more inequality declines, the more poverty
declines. Reducing inequality has also played for the decline in poverty levels.
The third factor is the growth of the economy. The higher the growth rate is, the greater the
reduction of poverty will be. Yet Lula's Brazil has indeed taken advantage from higher and less
volatile growth than in the 1990s, at least until 2008. The last two factors are causing a significant
reduction in poverty despite a level of inequality which remains high. The reduction in inequality is
the result of improved working conditions, both in terms of employment and wages, and a significant
increase in the minimum wage over the period. The effect of social transfers on inequality and thus,
on the level of poverty is modest. Targeted social programs (the famous “Bolsa Familia” for example)
28
Source : Banco Central Do Brazil
29
Gradin, 2010 with data from PNAD (2007)
30
This coefficient measures the level of inequality in a country
- 32 -have reduced by only 6.4% the number of poor in Brazil31, but their situation has improved. The
“depth” of poverty has declined.
Brazil presents strong geographical and sociological contrasts. While much of the territory is covered
by the Amazon rainforest virtually empty of human beings, the southeastern coast is home to the
mega-cities of São Paulo and Rio de Janeiro and one of the largest "urban areas" around the city of
Belo Horizonte. Like it was said before economic inequalities are among the highest in the world and
racial segregation even if informal does exist.
B. Expected economic impacts on GDP and balance of payments?
1. Methodology and definitions
In this thesis the analysis will be focused on the tangible and non-tangible impacts of the two events
on the Brazilian economy and society. It is useful to consider on one side the tangible impact and on
the other side the non-tangible impacts.
Tangible impacts include economic impacts such as new investments, increase in tourism and new
opportunities for business but also better and/or new infrastructure. Economic impact is considered
to be “the total amount of additional expenditure generated within an area, which could be directly
attributable to the staging of a particular event”32.
The most obvious non tangible impact is the world image of Brazil. The country will be in the
spotlight because of the worldwide media cover of the two events. Such impacts also include skills
improvements, sport and cultural activities development, environmental impacts and eventual
increase in HDI through better medical installation etc. The national pride could also be boosted:
particularly focusing on short-term consequences, it appears for instance that a final victory in a
World Cup can have positive impacts on the morale of a population. In a sense, the high morale of a
population will be an important factor in consumption and therefore economic growth. This
could especially be true for Brazil, a country in which sport is a second religion. These non-tangible
impacts will only be dealt with in the third part of this report through the environmental and social
impacts of the two events.
This section particularly focuses on the expected economic impacts and more specifically on the
potential increase in GDP generated by the events. The non tangible impacts will be analyzed in
section C. Social and Environmental Impacts it is useful to distinguish two different types of economic
impacts: direct impacts and indirect impacts. Direct impacts are those “directly” connected to the
event whereas indirect impacts are those which are responsible for stimulus on the economy thanks
to the organization of these events.
31
S. Rocha, « Transferencias de renda e pobreza no Brasil », Revue Tiers-Monde
32
in Measuring Success – UK Sport Ministry
- 33 -You can also read