GOOD GROWTH FOR CITIES - THE LOCAL ECONOMIC IMPACT OF COVID-19 - PWC UK
←
→
Page content transcription
If your browser does not render page correctly, please read the page content below

January 2021

Good
Growth
for Cities
The local economic impact
of COVID-19

                            #GoodGrowth
Contents

Executive summary                  1

Public priorities for growth       3

The economic impact of COVID-19    5

Good growth before the pandemic   22

Strategies for local recovery     30

Agenda for action                 37

Appendix                          39

About the authors                 43
Executive summary
As we begin the new year, the impact of the COVID-19 pandemic is still unfolding. While that impact has been
felt right across the UK, it has not been felt equally. In many ways the pandemic has reinforced existing economic
and social disadvantages.

Since 2012, we have published an annual              Many poorer performing cities in the Good            The pandemic has put all these factors under
Demos-PwC Good Growth for Cities Index to            Growth Index – including Liverpool, Southend,        the microscope. It has led most people to live
measure the performance of cities and regions.       Medway, Doncaster and Bradford – have been           their lives much closer to home, prompting           Many poorer
The Good Growth Index looks beyond GDP               hit hard by the pandemic. These cities have          many to reassess their local surroundings and        performing cities in
and covers broad measures of economic                been more vulnerable to the volatility of the        communities. For some, homes have become
wellbeing, including jobs, income, health, skills,   pandemic and, while they are expected to grow        workplaces and, for most, more time than
                                                                                                                                                               the Good Growth
work-life balance, housing, transport and the        back strongest in 2021, their economies will still   ever has been spent in local communities and         Index – including
environment. In this year’s report, we focus on      be smaller in 2021 than they were in 2019. In        neighbourhoods. This has led to a greater            Liverpool, Southend,
the economic impact of COVID-19 and recovery         the longer term they will need to build resilience   interest and understanding of neighbourhoods,        Medway, Doncaster
prospects for the UK’s largest towns and cities      against future crises.                               and in particular of social inequalities and local
                                                                                                                                                               and Bradford – have
in 2021 and beyond.                                                                                       environmental issues.
                                                     There are exceptions to this pattern. Leicester is
                                                                                                                                                               been hit hard by
Our analysis on the economic impact of               in eighth place in the Good Growth Index yet will    There is now a growing expectation that these        the pandemic.
COVID-19 highlights the challenges ahead for         be one of the cities hardest hit economically by     issues must be addressed as the UK looks
many places across the UK. Many of the cities        the fallout from COVID-19.                           towards its recovery. A palpable sense of the
that have previously performed well in our Good                                                           need to build a better, fairer future. What has
Growth Index – including the Scottish cities of      Our Index tracks the factors that the public         become clearer than ever is that, beyond the
Edinburgh and Aberdeen, along with Norwich,          consider most important to their economic            immediate COVID-19 crisis response, a broader
Swindon, Southampton and Oxford in England –         wellbeing. These factors have stayed largely         approach to economic wellbeing is needed.
have been relatively less economically impacted      consistent over the years, and perhaps               One that embraces social, health and economic
by the COVID-19 pandemic. Their sectoral             surprisingly, have remained largely consistent       outcomes more fully.
mix and performance on broader economic              across 2020 too. Health, jobs, housing and
and social indicators have to some extent            income are ranked as the most important
provided resilience.                                 of our 10 economic and social factors,
                                                     followed by skills, the environment, transport,
                                                     income distribution, work-life balance and
                                                     business start-ups.

                                                                                                                                                                Good Growth for Cities   1
During the pandemic, both government and          As they look to recover, places should consider
business have found new ways of working           how they can become more:
together, and quickly. Building a fair recovery
must also be a shared endeavour. There is an      •   productive and innovative,
imperative for government and business to         •   fair and inclusive,
work together to tackle both the longstanding     •   greener and more sustainable,
inequalities that the pandemic has highlighted,   •   and more resilient.
as well as the new divisions that have emerged.
These are themes we will be exploring further     As leaders from across national and local
in our Future of Government programme             government, as well as the private and third
throughout 2021.                                  sectors, plan their recovery strategies, taking
                                                  a broad approach to economic wellbeing and
For cities and towns across the country, a        building resilience will be essential. Putting the
place-based approach to recovery is needed.       public at the heart of the recovery by answering
The pandemic has reinforced the need to           the call for a better, fairer future, will be key.
‘level up’ across the UK, but also revealed the
need to look beyond regional headlines of the
North-South divide and focus efforts with more
precision on specific places.

There is an imperative for government and business to work together
to tackle both the longstanding inequalities that the pandemic has
highlighted, as well as the new divisions that have emerged.

2    Good Growth for Cities
Public priorities for growth
Globally, there is a growing recognition that                      These are the factors that the public have                  10 factors that matter most to the public:
traditional, narrow measures of success                            consistently told us are most important to their
no longer work, such as focusing solely on                         work and finances.
GDP. If the pursuit of growth is essentially                                                                                   1   Secure jobs

about improving citizens’ prosperity,                              Our aim has been to capture a variety of
opportunities and wellbeing, the focus                             characteristics of UK cities or areas in                    2   Adequate income levels
needs to widen beyond Gross Domestic                               a composite ‘Good Growth’ index. The
Product (GDP) or Gross Value Added (GVA).                          characteristics included within the index are               3   Good health (in order to work and earn a living)2
                                                                   based on those chosen by the UK public
We created our first Good Growth Index with                        as essential for judging economic success,                  4   Time with family/work-life balance
the think tank Demos in 2011,1 based on the                        and are weighted according to their level of
public’s view of what economic success                             relative importance.                                        5   Affordable housing
meant to them. Since 2012 we have published
an annual Good Growth for Cities Index that                                                                                    6   High levels of entrepreneurship and new business start-ups
covers broad measures of economic wellbeing,
including jobs, income, health, skills, work-life
balance, housing, transport infrastructure and
                                                                                                                               7   Good quality transport systems (road and rail in particular)

the environment.                                                                                                                   Having the skills and education needed to be in employment
                                                                                                                               8   and earn a living

                                                                                                                                   Protection of the environment (for example carbon emission
                                                                                                                               9   reduction, preserving forests)

Throughout the Demos-PwC Good Growth series, our aim has                                                                       10 Fair distribution of income and wealth
been to capture a variety of characteristics of UK cities or areas in a
composite ‘Good Growth’ index.

1
    We published our first Good Growth index in 2011. The first Good Growth for Cities report was published in November 2012
2
    The Good Growth for Cities Index measures the proportion of the working age population out of employment due to long
    term sickness. This was selected to reflect the impact of poor health on economic well being through potential earnings.

                                                                                                                                                                            Good Growth for Cities   3
In 2020

                                                                                                                                                                                     76%
Every year, we survey a representative                        This poll identifies which elements in the index           That said, our methodology will continue
sample of around 2,000 members of the                         are considered most important by the public,               to evolve. With public sentiment likely to be
UK’s adult population in order to capture                     and we assign weights accordingly. There are               shaped further by the impact of COVID-19
any shifts in opinion (Figure 1). In our latest               no changes in the weights applied to this year’s           on local communities, we may see new                        agreed healthcare
survey, perhaps unsurprisingly in the context                 index (see Table 1).                                       priorities emerge. We asked the public this                 was an important
of the pandemic but consistent with previous                                                                             year if there were any indicators they would
years, healthcare and employment were                         There has been a slight movement in our public             add to our list. Areas noted by respondents
                                                                                                                                                                                     indicators of
the top priorities for the public, with 76%                   polling weights since our first index, which               included Brexit and immigration, as well                    success of
and 72% agreeing they were an important                       largely reflects the general trend of falling              as education and equality. Our Future of                    economic policy.
indicator of the success of economic policy,                  unemployment rates since the global financial              Government research also showed the
followed by skills (65%), housing (62%)                       crisis of 2007-2008 and the growing recognition            importance of public perceptions around
and income (61%).                                             of environmental issues. It is clear, however,             fairness, feeling listened to and having a voice
                                                              that there is broad consistency in terms of what           – issues we will explore further with public
                                                              matters most to the public.                                research in 2021.

Figure 1: Public priorities for economic policy

90%
80%               76%
                                     72%
70%                                             65%               62%           61%              60%
60%                                                                                                               55%             54%
                                                                                                                                                   51%
50%                                                                                                                                                                   44%
40%
30%
20%
10%
    0%
                Healthcare        Employment    Skills          Housing        Income       The Environment Time with family The distribution    Transport       Entrepreneurship
                                                                                                                                of wealth
           % agree important
Source: Polling of 2,000 UK adults, between 27 November – 1 December 2020

Table 1: Latest weightings compared to 2019
                                                                   Work-life     New                                                                                  Income
                    Jobs              Income      Health           balance       businesses       Housing         Transport        Skills          Environment        distribution

2019 weights                 14            12            14               8             6               10               8                  12               8               8

2020 weights                 14            12            14               8             6               10               8                  12               8               8

Source: PwC analysis

4        Good Growth for Cities
The economic impact
of COVID-19
While COVID-19 has impacted the economy              Nationwide impact
of every region, city and town across the UK,
the effects are playing out differently in each      The impact of COVID-19 has affected all regions
place. This is largely due to the health, social     and cities across the UK. It has also impacted
and economic conditions in different places,         a broad scope of sectors, most notably the
including the balance of sectors which               entertainment and hospitality sectors. For
support each local economy. Increasingly,            example, our UK Hotels Forecast predicts that it
the levels of restrictions in different areas will   could take four years for hotel occupancy rates
impact recovery profiles too.                        to return to pre COVID-19 levels. Continued
                                                     restrictions such as social distancing measures
In this section, we explore the economic impact      and curfews have put many businesses in these
of COVID-19 on cities across the UK and provide      sectors under intense commercial pressure.
insight on their economic recovery prospects
into 2021.

The impact of COVID-19 has affected all regions and cities across the
UK. It has also impacted a broad scope of sectors, most notably the
entertainment and hospitality sectors.

                                                                                                        Good Growth for Cities   5
Sectors
Fig 11 under pressure Consumer sentiment has remained relatively businesses should enable businesses to
buoyant despite the pandemic and we continue operating to support the recovery.
As reported in the PwC January UK Economic anticipate that most sectors will return to Additionally, the health sector is also expected
Outlook (Figure 2), sectors such as hospitality growth in 2021, including hard-hit sectors like to grow strongly, as the sector attempts to
and leisure, transport and food service retail and hospitality as they recover from a vaccinate tens of millions of people against
industries have been most negatively impacted low base in 2020. We expect the construction COVID-19 in a matter of months.
in GVA terms by the pandemic. sector to grow in 2021, partly driven by fiscal
measures to boost infrastructure investment.
Similarly, adaptations made by manufacturing
Figure 2: Projected GVA growth rate by industry sector under ‘Quick recovery’ scenario, % annual change in 2020 and 20213
Accommodation and food service activities -38.8%
13.1%
Arts, entertainment and recreation -30.6%
-2.0%
Other service activities -27.1%
5.6%
Transportation and storage -22.9%
4.1%
Activities of households -18.9%
4.9%
Admin and support services -18.4%
1.9%
Education -15.4%
5.2%
Health and social care -15.1%
20.7%
Construction -11.7%
14.2%
Retail and wholesale -11.1%
1.3%
All industries -11.0%
4.8%
Manufacturing -10.4%
5.4%
Professional and technical services -7.3%
6.6%
Information and Telecoms -7.0%
4.7%
Extraction -5.9%
2.6%
Electricity gas, steam and air -4.6%
3.1% Given current conditions, our
3
Finance and insurance -2.8% projected GVA growth rate is
0.5%
Water supply, sewerage etc. -1.9% based on a ‘quick recovery’
2.1%
Real estate -0.9% scenario. However, in our UK
0.7% Economic Outlook, we also
Agriculture, forestry and fishing -0.7%
3.7% include a ‘slow recovery’
Public Admin, Defence 2.0% scenario where the GVA impacts
0.6%
are greater to each sector in
-40% -30% -20% -10% 0% 10% 20% 30% the economy.
% GVA impact
2020 2021
Source: PwC UK Economic Update, January 2021
Source: PwC UK January 2021 Economic Outlook
6 Good Growth for Cities
20.7               %
projected GVA growth in health
and social care in 2021 compared
to an average of 4.8% growth for
all industries.

                                   Good Growth for Cities   7
This national level analysis is part of our                        The hardest hit cities in 2020 range
                             methodology in calculating the GVA impacts                         geographically across England, from Liverpool,
                             to each city economy in our index. The other                       Doncaster and Bradford in the North and
                             components of the GVA calculation include the                      Yorkshire, to Southend and Medway in the South.
                             COVID-19 local infection rates, Google Mobility                    These are all cities which also perform poorly in
                             index, Universal Claimant Count and the UK                         the Good Growth Index. Those cities that have
                             Government Coronavirus Job Retention scheme                        to date showed most resilience to the economic
                             statistics (see ‘Our Methodology’ section for                      impacts of the pandemic include Edinburgh and
                             further details).                                                  Aberdeen in Scotland, and Norwich, Swindon,
                                                                                                Southampton and Oxford in England.
                             Figure 3 plots where each city defined by its
                             travel to work area lies in terms of change in                     Broadly, those cities that perform well in the
                             GVA4 in 2020 and its score in the Good Growth                      Good Growth for Cities Index have been relatively
                             for Cities Index. It is clear that cities will face very           less impacted by the pandemic than those that
                             different challenges and opportunities as they                     perform less well, although there are notable
                             recover from the economic impacts of COVID-19.                     exceptions to this pattern, including Leicester
                                                                                                (see Spotlight on Leicester).

                             The hardest hit cities in 2020 range geographically across England,
                             from Liverpool, Doncaster and Bradford in the North and Yorkshire,
                             to Southend and Medway in the South. These are all cities which also
                             perform poorly in the Good Growth Index.

                             4
                                  conomic impact is measured in Gross Value-Added (GVA) terms in this analysis. When referring to ‘2020 impact’, this
                                 E
                                 measures the differences in economic output in 2020 compared to 2019 levels.

8   Good Growth for Cities
2020 annual GVA growth rate and Good Growth 2020 Index score
Figure 3: 2020 annual GVA growth rate (%) and Good Growth for Cities Index score
0.0 Low Good Growth score High Good Growth score
low economic impact Norwich Edinburgh low economic impact
Aberdeen
-9.5
Swindon
Portsmouth
Southampton Oxford
-10.0 Brighton
Birkenhead
Reading
Hull Cambridge Bristol
-10.5 Glasgow
2020 annual GVA growth (%)
Swansea London (Boroughs Only)
Milton Keynes
-11.0 Sunderland Wolverhampton Preston
Sheffield
& Walsall Coventry
Middlesbrough & Stockton Nottingham
Belfast Stoke-on-Trent
London
-11.5 Cardiff
Derby Birmingham
Newcastle
Wakefield & Castleford
-12.0 Leeds
Leicester
Warrington & Wigan
Manchester
-12.5 Doncaster
Bradford
Medway
-13.0
Southend
Low Good Growth score High Good Growth score
large economic impact Liverpool large economic impact
-13.5
-0.2 -0.1 0.0 0.1 0.2 0.3 0.4 0.5 0.6 0.7 0.8 0.9 1.0 1.1 1.2
Good Growth for Cities Index score
Low High
Cities are defined by travel to work areas.
Plymouth was excluded from the analysis due to data limitations.
Source: PwC Analysis
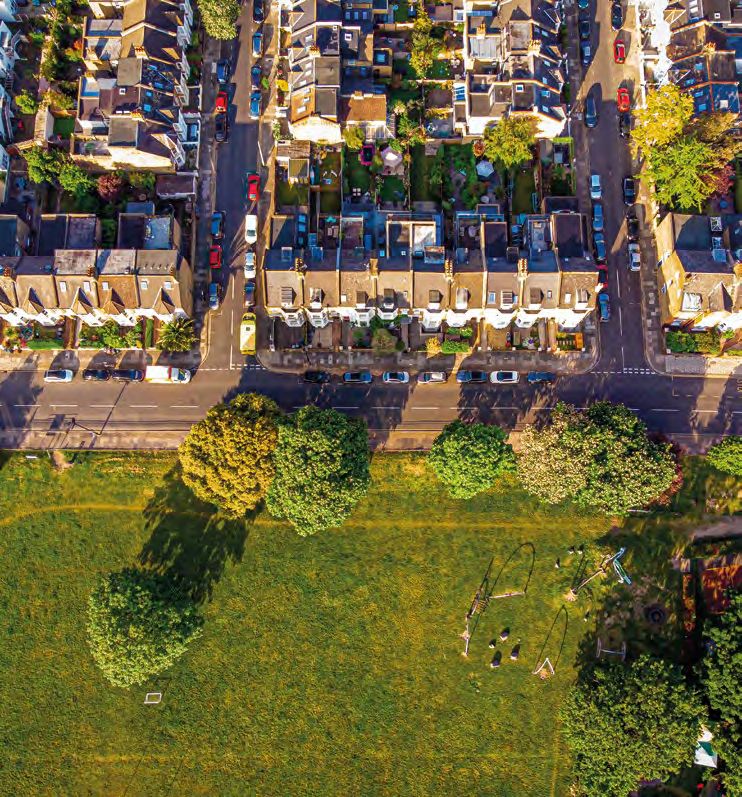
Good Growth for Cities 9Figure 4 illustrates what the economic impacts However, a return to pre-pandemic conditions In 2020
will look like for cities in the index, mapping the will not necessarily instigate a sudden increase
2021 GVA recovery rates with the 2020 GVA
impacts. Looking ahead to 2021, GVA recovery
rates range from 3.9% (Edinburgh) to 5.7%
(Medway), with an average recovery rate in 2021
in economic activity in relatively low-performing
cities and make these cities more prosperous
than before the pandemic. Rather, we estimate
that for these cities their economies in 2021
12.5%
decrease in economy
of 4.8% across all cities in the index. will be slightly less than the size of their for Liverpool, Southend
economies in 2018. and Bradford.
Cities with the strongest GVA growth rates
projected for 2021 are those that have been Our GVA analysis does not specifically take
hardest hit in 2020. For example, Liverpool, into account the impact of the different levels
Southend and Bradford will all see their of tiered restrictions in place across the UK,
economy decrease by more than 12.5% in but the level and length of local and regional
2020. But these cities are also predicted to restrictions will likely impact the growth
recover more effectively than most other cities prospects for different places, as we can see
in 2021, with growth rates of 5.3% and higher. in the case of Leicester.
This means that as sectors that have been
most impacted by restrictions reopen, cities
that have been most negatively affected due to
their sectoral mix will see stronger recoveries
back to pre-pandemic conditions.
Looking ahead to 2021, GVA recovery rates range from 3.9%
(Edinburgh) to 5.7% (Medway), with an average recovery rate in 2021
of 4.8% across all cities in the index.
10 Good Growth for Cities2020 & 2021 annual GVA growth rates. Size of each city bubble represents size of the city’s economy
Figure 4: 2020 and 2021 annual GVA growth rates
5.8
Medway
Doncaster
5.6
5.4
Liverpool Southend
Bradford
5.2
Manchester
2021 annual GVA growth (%)
Wakefield & Castleford Cardiff Sheffield
5.0 Nottingham
Warrington & Wigan Derby Middlesbrough & Stockton
Leeds Newcastle Belfast Preston
Leicester Sunderland Swansea
4.8 Stoke-on-Trent
Birmingham Wolverhampton Cambridge
& Walsall Glasgow
4.6
London (Boroughs Only) Hull
4.4 London Coventry
Reading
Bristol Oxford Norwich
4.2 Birkenhead Portsmouth
Southampton
Aberdeen
Brighton
Milton Keynes
4.0 Swindon
Edinburgh
0.0
-13.4 -13.2 -13.0 -12.8 -12.6 -12.4 -12.2 -12.0 -11.8 -11.6 -11.4 -11.2 -11.0 -10.8 -10.6 -10.4 -10.2 -10.0 -9.8 -9.6 -9.4 -9.2 -9.0
2020 annual GVA growth (%)
Cities are defined by travel to work areas.
Plymouth was excluded from the analysis due to data limitations.
Size of economy measured by 2018 total GVA Line of best fit
Source: PwC Analysis
Good Growth for Cities 11Fig 12
Spotlight on Leicester Figure 5: Leicester Community Vision Footfall Trend
Leicester is one of the few cities with a
140
relatively strong performance in the Good
Growth for Cities Index that is projected to be
significantly economically impacted by the 120
pandemic. Leicester was the first city to have
stricter restrictions imposed on its citizens 100
following the relaxing of the initial national
lockdown in June 2020.
14-day average
80
Though non-essential retail was allowed from
1 August, the public was restricted to essential 60
travel only. As a result, compared to the average
UK city, Leicester city saw a significantly lower
40
footfall rate during June – August, with the lowest
point from the UK average seen on 2 August,
with footfall in the Leicester travel to work area 20
(TTWA) at 29.2% of its pre-pandemic levels while
the average UK city returned 71.0% of its pre- 0
pandemic levels (Figure 5). Jan Feb Mar Apr May Jun Jul Aug Sep Oct Nov Dec
2020 2020 2020 2020 2020 2020 2020 2020 2020 2020 2020 2020
Month
Leicester TTWA Leicester City Council UK Index (Jan 2020:100)
Source: Huq Industries Limited
Source: Huq Industries Limited
12 Good Growth for CitiesLeicester city saw a significantly lower
footfall rate during June – August, with
the lowest point from the UK average
seen on 2 August, with footfall in
Leicester travel-to-work area (TTWA) at
29.2 %
Good Growth for Cities 13The decreased footfall in Leicester city during
Figure 6: Leicester Mobility Index
the summer period is likely to further reduce the
performance of Leicester’s retail sector.
140 Leicester was the
Beyond the city centre, mobility data from Huq first city to have
Industries demonstrates that despite Leicester 120 stricter restrictions
facing restrictions in the summer period, people imposed on its
continued to move around the city as much as
they did in other cities (Figure 6). From June to
100 citizens following
August, the Leicester TTWA and Leicester City the relaxing of
14-day average
Council experienced a relatively similar level of 80 the initial national
mobility to the UK average city, with Leicester City lockdown in
Council increasing to above the national average 60 June 2020.
over the Autumn months.
40
20
0
Jan Feb Mar Apr May Jun Jul Aug Sep Oct Nov Dec
2020 2020 2020 2020 2020 2020 2020 2020 2020 2020 2020 2020
Month
Leicester TTWA Leicester City Council UK Index (Jan 2020:100)
Source: Huq Industries Limited
Source: Huq Industries Limited
14 Good Growth for CitiesEmployment in focus Figure 7: Take-up rate of the Coronavirus Job Retention Table 2: Top 10 and bottom 10 city take-up rates of the UK
Scheme, 31 October 2020 Coronavirus Job Retention scheme
Employment has consistently remained a top
priority for the public when it comes to good Highest take-up rates Lowest take-up rates
growth. One way to capture the impact of the
pandemic on employment is to understand the London Southampton
number of workers furloughed as part of the UK (Boroughs Only) 6.5%
Coronavirus Job Retention Scheme (CRJS). 10.0%
London Derby
As Figure 7 demonstrates, the take-up of the
9.7% 6.4%
government furlough scheme varies across
the UK, with a particularly high take-up rate5 Cardiff Oxford
in London. 9.3% 6.3%
Belfast Medway
8.8% 6.1%
Swansea Sunderland
8.8% 6.0%
Edinburgh Swindon
8.7% 6.0%
Employment has consistently Plymouth
Glasgow
remained a top priority for the public 5.9%
8.6%
when it comes to good growth.
Birmingham Doncaster
8.3% 5.9%
Source: HM Revenue & Customs Coronavirus Job Retention Scheme Manchester Norwich
statistics December 2020 (claims received up to 31 October 2020) 8.0% 5.8%
Brighton Wakefield & Castleford
7.8% 5.7%
5
Take up rate is defined as the number of individuals that have been furloughed divided by the number of individuals that are able to work.
Good Growth for Cities 1510.0 % take-up rate of the UK Coronavirus Job Retention scheme in London (Boroughs Only) 16 Good Growth for Cities
According to latest statistics, the city with the   Figure 8: Percentage of population aged 16 to 64 in                    Table 3: Top 10 and bottom 10 city claim rates of Universal
highest take-up rate of the CRJS is London –        each local authority making claims to Universal Credit,                Credit, correct as of 12 November 2020
where 10% of all workers in the city were on        UK, correct as of 12 November 2020
the furlough scheme as of 31 October 2020.
In contrast, areas in the North of England had                                                                             Highest             12 Nov 09 Jan Lowest        12 Nov 09 Jan
smaller proportions of their workforces on the                                                                             Universal           2020 2020 Universal         2020 2020
CRJS, while Middlesbrough and Stockton had                                                                                 Credit                            Credit
the lowest proportion at 5.4%.                                                                                             claimant city                     claimant city

There is still uncertainty over the local and                                                                              Birmingham          8.8%     4.8%     Belfast            5.0%     2.4%
national labour market outlook but the impact
of the pandemic on unemployment is becoming                                                                                London
                                                                                                                                               8.3%     3.0%     Portsmouth         5.0%     1.9%
apparent in benefit claimant rates. Figure 8                                                                               (Boroughs Only)
illustrates the percentage of the population in
                                                                                                                           Bradford            8.2%     4.4%     Bristol            4.9%     2.0%
each local authority claiming Universal Credit.
Latest figures show that Birmingham has the
highest take-up rate of Universal Credit, with                                                                             Liverpool           8.1%     4.3%     Milton Keynes 4.9%          1.8%
8.8% of its population aged 16 to 64 claiming
benefits on 12 November 2020. This compares
                                                                                                                           London              7.7%     2.8%     Southampton 4.7%            1.9%
to 4.8% of its population aged 16 to 64 claiming
benefits as of 9 January 2020. Oxford has
the lowest percentage of Universal Credit                                                                                  Leeds               7.4%     3.8%     Norwich            4.5%     2.0%
claimants, at 3.8%. 1.5% of its population
aged 16 to 64 were claiming benefits before                                                                                Manchester          7.4%     3.6%     Reading            4.4%     1.6%
the pandemic.

                                                                                                                           Doncaster           7.3%     3.7%     Cambridge          4.4%     1.6%

                                                                                                                           Middlesbrough
                                                                                                                                         7.3%           4.4%     Swindon            4.2%     1.7%
                                                                                                                           & Stockton

                                                                                                                           Sunderland          7.2%     4.5%     Oxford             3.8%     1.5%
                                                    Source: ONS – CC01 Regional labour market: Claimant Count by unitary
                                                    and local authority (experimental)
                                                                                                                           Source: ONS - CC01 Regional labour market: Claimant Count by unitary and
                                                                                                                           local authority (experimental)

                                                                                                                                                                        Good Growth for Cities        17
In 2020 Table 4: Top 5 and bottom 5 city increases in
5.2pp
the Universal Credit claimant rate from January
2020 to November 2020
increase in universal 1 London 5.2 pp Nottingham 2.6pp
credit claimant (Boroughs
Only)
count in London
between January and 2 London 4.9pp Norwich 2.5pp
November 2020.
3 Birmingham 4.0pp Swindon 2.5pp
4 Bradford 3.8pp Swansea 2.5pp
5 Liverpool 3.8pp Oxford 2.3pp
Source: ONS – CC01 Regional labour market: Claimant
Count by unitary and local authority (experimental)
Table 4 shows that the greatest increase in the
claim rate of Universal Credit is the London
Boroughs, increasing from 3.0% in January
2020 to 8.3% in November 2020. This is more
than double the lowest increase in claimants,
found in Oxford at 2.3 pp. Birmingham has
seen the third highest increase since January
2020 and had the highest claimant rate as of 12
November 2020.
18 Good Growth for CitiesSocial group divides Figure 9: % of young people economically inactive and unemployed from 2001 Q4 – 2020 Q3
The pandemic has had a disproportionate
impact on certain social groups, including
9.5 In absolute terms,
young workers, black and ethnic minority 9.0 2020 Q3 youth
communities and lower income individuals 8.5 unemployment
and families.
8.0 was 9% higher
% of individuals aged 16 - 24
7.5 than in 2019 Q3,
Young workers
7.0
and it is 19%
Younger workers tend to have less 6.5
higher compared
experience, fewer skills and often work in
6.0
to the same quarter
sectors that have been heavily impacted by
COVID-19 restrictions.
in 2018.
5.5
5.0
We are already beginning to see the
impact the pandemic has had on youth 4.5
unemployment rates, which rose by 0.7% in 0.0
2020 Q3 compared to the previous quarter 2002 2003 2004 2005 2006 2007 2008 2009 2010 2011 2012 2013 2014 2015 2016 2017 2018 2019 2020
(Figure 9). This is the highest quarterly Year
increase in youth unemployment since 2011, Economically inactive Unemployed
when the brunt of the global financial crisis Source: ONS – Young people not in education, employment or training (NEET) November 2020
deterred many businesses from hiring school
leavers and recent graduates.
Source: ONS - Young people not in education, employment or training (NEET) November 2020
Recessions have proven to have long-term Young workers are therefore entering the
In absolute terms, 2020 Q3 youth
effects on employment, lifetime earnings and labour force in one of the toughest economic
unemployment was 9% higher than in 2019
occupation of young workers. According to the environments, which will exacerbate
Q3, and it is 19% higher compared to the
Resolution Foundation, unemployment rates unemployment rates, make employment
same quarter in 2018.
for those that had left education with GCSE- opportunities even more competitive and
equivalent qualifications over the previous two potentially undermine social mobility.
years increased from 22% to 32% between Cities that have the highest proportion of
2007 – 2011. Young people are also likely to younger people (including students), such
start on a lower pay band as a consequence as Bristol, Leicester, Nottingham, Sheffield
of fewer well-paid jobs being available in the and Brighton, are likely to face challenges in
economy, which may see them failing to catch finding the right employment opportunities
up with their peers who started jobs in better for young people.
economic times. Non-graduates had the
largest and longest scarring effects.
Good Growth for Cities 19Black, asian and ethnic Low income families
minority communities and individuals
There are clear
People from black, asian and ethnic minority Additionally, from the outset the pandemic has
had a disproportionate effect on the lowest
implications for cities
communities are more likely than those from
white communities to be diagnosed with earners in the economy. Figure 10 illustrates with high proportions of
COVID-19, more likely to be admitted to hospital how low income earners were impacted more low income earners, such
and intensive care, and more likely to die from severely by the initial lockdown in terms of hours as Liverpool, Sunderland
the virus, according to studies. Cities with worked and earnings made. This is likely due to and Birkenhead.
significant ethnic minority communities, such as many low income earners working in sectors that
London, Birmingham and Manchester, should have been more heavily impacted by restrictions,
consider how COVID-19 has unequally affected such as hospitality.
these communities in their recovery strategies.
There are clear implications for cities with high
proportions of low income earners, such as
Liverpool, Sunderland and Birkenhead. With
income a key factor in raising living standards,
these cities will need to consider how they can
overcome the disproportionate impact that their
communities face from the pandemic.
Cities with significant ethnic minority communities, such as London,
Birmingham and Manchester, should consider how COVID-19 has
unequally affected these communities in their recovery strategies.
20 Good Growth for CitiesFigure 10: Survey results illustrating that those earning less, worked less and earned less in the first Summary
week of April 2020 compared to the previous week
Our analysis shows that many of the
economies of cities that perform
The pandemic
100
well in our Good Growth Index have has also revealed
90 been relatively less impacted by the new disparities.
COVID-19 pandemic. The sectoral
80
mix and performance on broader
For example,
areas with younger
Proportion of respondents (%)
70 economic and social indicators
60
in these cities has to some extent populations,
provided resilience. greater numbers of
50
Many poorer performing cities in the ethnic minorities or
40
Good Growth Index have been hit hard higher proportions
30 by the pandemic. While these cities of lower income
are expected to grow back strongly in
20 2021, the pandemic has exposed their
individuals may
10 vulnerabilities and lack of resilience in face much higher
terms of broader economic and social unemployment over
0 wellbeing that will be critical to longerGood growth before the pandemic
While few predicted what 2020 would Figure 11: Average change in score since 2016-18, by element of the index
have in store, there are some signs in
the Good Growth for Cities Index of what
has unravelled. Before the pandemic, the
0.25
Before the
gap between those cities at the top of the
0.20
pandemic, the
index and those at the bottom had started 0.15
gap between
to widen after many years of narrowing. 0.10
those cities at
The scores for the average skills levels of 0.05
young people had started to decline, as had
the top of the
0.00
the scores for health. These are all trends index and those
-0.05
that the pandemic has amplified and are at the bottom had
-0.10
challenges in delivering on the Government’s started to widen
commitment to ‘levelling up’. -0.15
after many years
-0.20
Across the 10 measures included in the
of narrowing.
-0.25
Total index value
Income
Work-life-balance
Jobs
Skills (25+)
Environment
Income distribution
Transport
House price to earnings
Skills (16-24)
Health
Owner occupation
New businesses
Good Growth Index, the biggest driver of
improvements between 2016-18 and 2017-196
has been the impact of increasing household
income levels (Figure 11). There were also
continued broad improvements in the
unemployment rate – which was already at an
historically low level, the skills of older workers
and work-life balance, perhaps reflecting more Particularly worrying, in light of the pandemic, country, and a failure to tackle these will hamper
flexible working patterns. However, there were there was also a decline in average scores for the rate of recovery that cities experience in the
also signs of pressures regarding housing, with both the health and the skills of younger people, aftermath of the pandemic. Alongside health,
a reduction in housing affordability and falling as well as new businesses. addressing unemployment and improving skills
owner-occupation rates. levels should be a priority nationally and locally –
COVID-19 has shone a spotlight on some of the particularly for younger people.
wider social and economic challenges facing the
6
s in previous editions, we use rolling three year averages in order to minimise the impact of volatility which can be
A
present in annual data at a local level. The period covered in this index (2017-19) means that the impact of coronavirus is
not captured in the results, however the rankings and individual scores across variables provide a useful indication of how
cities were performing going into the pandemic.
22 Good Growth for CitiesVarying degrees of readiness Figure 12: Good Growth for Cities Index (2017-19)
Oxford and Reading are the two highest Oxford It is notable that
performing cities in the latest Index, with Oxford Reading
increasing its lead in first place. Oxford performs Southampton Southampton has
particularly strongly in jobs, income, health and
Milton Keynes edged ahead of
Edinburgh
skills of the adult population, scoring within Bristol Edinburgh to become
the top five cities for each of these variables. Aberdeen the third highest
Leicester
Southampton is in third place (see Spotlight on performing city in the
Brighton
Southampton) and Milton Keynes in fourth. Cambridge
Swindon
Good Growth Index.
Figure 12 presents the overall distribution of Leeds
Norwich
cities’ scores, defined by travel to work areas London
(TTWAs) and averaged over 2017-19. Coventry
Preston
Portsmouth
London (Boroughs Only)
Plymouth
Birkenhead
Manchester
Warrington & Wigan
Birmingham
Glasgow
Liverpool
Newcastle
Cardiff
Derby
Medway
Nottingham
Bradford
Hull
Sheffield
Belfast
Stoke-on-Trent
Southend
Wolverhampton & Walsall
Swansea
Middlesbrough & Stockton
Wakefield & Castleford
Sunderland
Doncaster
-0.4 -0.2 -0.0 0.2 0.4 0.6 0.8 1.0 1.2 1.4
Good Growth for Cities 23Spotlight on Southampton Figure 13: Southampton’s Good Growth Index performance The estimated
GVA growth rate in
Southampton is in third place in the
latest Good Growth for Cities Index, yet it 0.5
Southampton for
Southampton change Average change
continues to face economic challenges. 2020 is
-9.9%
0.4
Figure 13 outlines the drivers behind 0.3
Southampton’s performance. 0.2
The city experienced a strong improvement
0.1 compared to
in the number of new businesses, rising
0.0 the average UK
from 5,360 in 2016 to 6,280 in 2019. This -0.1 growth rate of
represents the fourth largest improvement in -0.2
-11.0% in 2020.
the new businesses score of any city in the -0.3 Total Index value
Jobs
Income
Health
Work-life-balance
New businesses
House price to earnings
Owner occupation
Transport
Skills (16-24)
Skills (25+)
Income distribution
Environment
index over this period.
There have also been improvements in
income, the skills among the adult population,
commuting times and house price to earnings.
For example, in 2019 more than 64% of
25+ year olds held at least an NVQ level 3
qualification, compared to 61% in 2016.
The estimated GVA growth rate in Some of the initiatives the city is pursuing
However, alongside these improvements, Southampton for 2020 is -9.9%, compared in response to these economic challenges
Southampton experienced a greater decline in to the average UK growth rate of -11.0% in and to build on its unique strengths include
its health, income distribution and the skills of 2020. In 2021, Southampton’s economy is a proposed reconfiguration of the airport
16-24 year olds relative to the index average. estimated to grow by 4.2% in 2021 compared runway, application for Freeport status, a
to the average of 4.8%. This is due to the £55m investment in a new next-generation-
Southampton’s economy is expected to sectoral mix within Southampton, which has ready cruise ship terminal, supported by
be less impacted by COVID-19 than the a greater reliance on sectors that have been Solent LEP, bidding for City of Culture 2025
average UK city, but also to recover less heavily impacted by the pandemic, such and Fawley Waterside, an ambitious £1 billion
strongly in 2021. as transportation and storage which make development of an intelligent merchant city
up 9.1% of its economy. This sector alone, that is creating homes and jobs in a deprived
which contains the cruise ship industry, has area of the city on the doorstep of the New
contracted by 22.9% in 2020 and is predicted Forest and Solent sea.
to grow only by 4.1% in 2021.
24 Good Growth for CitiesGood Growth scores in
Figure 14: Good Growth in Combined Authorities, 2016-18 and 2017-19
combined authorities
Tees Valley
Figure 14 shows the change in Good Growth
Index scores for combined authorities in
North-East
England and equivalent areas in Scotland and
Wales between 2016-18 and 2017-19, with those
Swansea By City Region
represented by an elected mayor shaded.
Sheffield City Region
Cardiff Capital Region
West Midlands
Liverpool City Region
Glasgow and Clyde Valley
West Yorkshire
North of Tyne
Greater Manchester
Cambridgeshire and Peterborough
Inverness
Edinburgh
Aberdeen
West of England
-0.4 -0.2 -0.0 0.2 0.4 0.6 0.8 1.0
Index score (2017-19) Index value (2016-18) Metro Mayor Combined Authorities
Good Growth for Cities 25Table 5 shows the performance of combined
Table 5: Breakdown of Good Growth scores for combined authorities8
authorities relative to the average for all Local
Enterprise Partnerships (LEPs).7 Interestingly, Combined Authority Greater Sheffield West Liverpool North West Tees Cambridgeshire West of North
every combined authority has at least one ‘red’ Manchester City Region Yorkshire City Region East Midlands Valley and Peterborough England of Tyne Cambridgeshire
and two ‘green’ ratings, reflecting that each Jobs
and Peterborough
area has relative strengths alongside potential and the West of
Income
areas for development. England perform
Health above average
All of the combined authorities perform
above average on jobs and work-life Work-life balance on income.
balance, and below average on owner New businesses
occupation. Beyond that, they have different
strengths and challenges. For example, only House price earnings
Cambridgeshire and Peterborough and the Owner occupation
West of England perform above average
on income, suggesting jobs growth is not Transport
necessarily translating into income growth in Skillls 16-24
many places. However, they are also the only
two to perform below average when it comes Skills 25+
to housing affordability. Tees Valley is the only Income distribution
combined authority to score below average on
environment, reflecting the industrial nature Environment
of the area.
Above average (approx mean + 1 SD) Around average Below average (approx mean – 1 SD)
7
ombined authorities are typically more similar in size to LEPs than cities, and hence LEPs have been chosen as a more appropriate group for comparison. This comparison sheds light on how
C
combined authorities perform relative to other areas across the country.
8
Green = above average (approx mean + 1 SD) Amber = around average red = below average (approx mean – 1 SD). Although not strictly a Combined Authority, the Good Growth scores for the
London Boroughs covered by the Greater London Authority are provided for comparison.
26 Good Growth for CitiesGood Growth scores in the
Figure 15: Cities in devolved administration scores, 2016-18 and 2017-19
devolved nations
Derry Edinburgh, Inverness
Figure 15 shows the latest Good Growth Index
scores for a selection of cities in the devolved
and Aberdeen remain
nations of Scotland, Wales and Northern Ireland. Swansea the top three cities
This includes the six cities outside England that in the devolved
are in the overall index, plus five more (Derry,9 Belfast
administrations.
Stirling, Perth, Dundee and Inverness).
Stirling
Edinburgh, Inverness and Aberdeen remain the
top three cities in the devolved administrations. Cardiff
Belfast, Swansea and Derry saw particularly
strong improvements in their scores, with Glasgow
notable improvements also seen in Cardiff.
The majority of the cities in the devolved
Dundee
administrations experienced an increase in their
score in this year’s index, and only Derry is still
Perth
below the 2011-13 UK average.
Aberdeen
Iverness
Edinburgh
-0.6 -0.4 -0.2 0.0 0.2 0.4 0.6 0.8 1.0
Index score (2017-19) Index score (2016-18)
9
For brevity, we refer to ‘Derry’ here rather than Derry/Londonderry.
Good Growth for Cities 27Good Growth scores in England’s Figure 16: Good growth scores across LEP areas, 2017-19
LEP areas
Buckinghamshire Thames Valley
Oxfordshire
Our final piece of analysis shows Good
Enterprise M3
Growth index scores for the 38 Local Thames Valley Berkshire
Enterprise Partnership (LEP) areas in England. Cheshire and Warrington
Figure 16 represents the score for each LEP, Worcestershire
relative to the average score for all English LEP West of England
areas in 2011-13. Dorset
York, North Yorkshire and East Riding
Coast to Capital
Leicester and Leicestershire
Gloucestershire
South East Midlands
Swindon and Wiltshire
Solent
Heart of the South West
Hertfordshire
London
Coventry and Warwickshire
Cornwall and Isles of Scilly
Greater Manchester
Greater Birmingham and Solihull
Greater Cambridge & Greater Peterborough
Leeds City Region
Lancashire
Cumbria
New Anglia
Liverpool City Region
The Marches
South East
Stoke-on-Trent and Staffordshire
Derby, Derbyshire, Nottingham
and Nottinghamshire
North Eastern
Sheffield City Region
Black Country
Tees Valley
Greater Lincolnshire
Humber
-0.4 -0.2 -0.0 0.2 0.4 0.6 0.8 1.0 1.2 1.4
28 Good Growth for CitiesLessons from the financial crisis For some cities, economic recovery took longer The short-term focus in a downturn is often on
than others, but our latest 2017-19 results continue protecting jobs and maintaining income levels, but
The economic impact of the COVID-19 pandemic a trajectory of improvement first identified clearly policy-makers should ensure that they are also
is very different in its nature to the 2008 global in our 2015 report, surpassing levels seen before building the foundations for long-term recovery.
For some cities,
financial crisis. For example, our Emerging Trends the financial crisis. In the wake of COVID-19, it will be important to economic recovery
in Real Estate survey highlighted that capital continue to focus on skills development to ensure took longer than
remains plentiful but paused, unlike the global It is also interesting to consider how the drivers of people have the skills they need for future jobs. others, but our latest
financial crisis after which it receded dramatically. improvements in overall index scores have varied In particular younger workers, who are more
2017-19 results
However, there is much that can be learned from between the short and long term, as shown in likely to be working in industries impacted by
how cities recovered from the 2008 crisis in terms Figure 17. Addressing structural issues – such as the pandemic – such as hospitality and retail – continue a trajectory
of good growth. improving local skills, encouraging new business and whose skills saw an absolute decline in the of improvement first
development and addressing local environmental latest index. identified clearly
Our long-term data on cities suggests that challenges – have provided a greater source in our 2015 report,
performance over time in our index is not driven of good growth since 2006-07 than traditional
surpassing levels
primarily by a city’s starting position, but rather by economic measures.
a combination of local and national improvements. seen before the
financial crisis.
Figure 17: Change in average Good Growth Index scores by variable, across all cities since 2005-07 and 2016-18
2.5 16-18 to 17-19 change 05-07 to 17-19 change
2.0
1.5
1.0
0.5
0.0
-0.5
-1.0
-1.5
Skills (25-64)
Skills (16-24)
New businesses
Environment
Work-life-balance
Income
Health
Jobs
Income distribution
Transport
House price to earnings
Owner occupation
Good Growth for Cities 29Strategies for local recovery
While the challenges of responding to These principles are at the centre of the recent While the furlough scheme has provided a
COVID-19 cannot be understated, and amendments to the Green Book appraisal short-term safety net, many jobs have been
ongoing uncertainties will require local process and are also echoed in the National lost and many more will be, and focused
leaders to stay agile in the months to come, Infrastructure Strategy, which places its focus support will be needed to support people back Each region, city or
beyond the pandemic there are glimpses on levelling up through Building Back ‘Fairer, into work, particularly younger generations. town will have different
of a better future. We must not lose sight Greener, Faster’. But we are also seeing an challenges, opportunities
of the imperative to act now to mitigate the increasing focus on the ESG (environmental, Central to this will be a renewed focus on and areas of focus,
worst impacts of the economic downturn social and governance) agenda in the private skills. If the UK is to improve productivity and
and build the foundations for a fair and sector, with, for example, 58% of respondents deliver inclusive growth across the country,
but there are common
inclusive recovery. to our Emerging Trends in Real Estate survey focusing on developing the right skills for themes that will feature
indicating that incorporating social impact / future jobs will be essential. Not all jobs can in all local economic
COVID-19 has amplified many long-term value contributions in their portfolios will be be protected, but government and business strategies.
trends in the economy and in our society. It has more important to them in 2021. have a responsibility to ensure that people have
shone a spotlight on existing and longstanding the skills they need for future jobs. Investing
inequalities in UK society as well as introducing Each region, city or town will have different in skills development will be key in responding
new ones. challenges, opportunities and areas of focus, both to the impact of the immediate economic
but there are common themes that will feature crisis but also the longer-term disruption to
Given the different health, social, environmental in all local economic strategies. Addressing the labour market.
and economic challenges that places face both each of these areas will require genuine
in responding to the pandemic and in driving collaboration and coalition-building locally, and Local leaders have a key role to play in
an ensuing fair and sustainable recovery, it between local and national government. developing interventions that will help match
is increasingly apparent that a place-based people to skills training and job opportunities.
approach is needed. Successful recovery Focus on inclusive growth A locally-driven model would see skills
strategies will need to consider broad measures planning carried out on the basis of place, with
of economic success, encompassing health, Younger workers, ethnic minority communities employers in the driving seat, shaping skills
social, environmental and economic outcomes, and those on lower incomes have been planning in line with their own unique labour
and how they interact with each other. disproportionately impacted by the pandemic. market strengths, weaknesses and potential.
30 Good Growth for CitiesEconomic renewal in Sheffield
City Region
When the COVID-19 pandemic began, Sheffield
City Region moved quickly to redevelop its
economic recovery plan for the post-pandemic
landscape. Drawing on the experience the
city region faced in recovering from the last
recession, the region was keen to identify
interventions that would not just support
recovery but also economic renewal.
Through scenario modelling on the future
potential impacts of COVID-19 on the region,
analysis and extensive stakeholder engagement,
the resulting renewal action plan focuses on
how Sheffield City Region can come out of the
pandemic stronger, greener and fairer.
• An economic transformation: creating
not just a bigger economy but a better
and stronger one, with better jobs, more
innovation and greater resilience.
• A transformation for wellbeing and inclusion:
improving quality of life, reducing inequality,
and widening opportunity.
• A green transformation: decarbonising
the economy, improving the environment,
transforming transport infrastructure.
Good Growth for Cities 31Productivity and innovation A roadmap to recovery in the
West Midlands
Our analysis suggests that levelling-up
productivity across the regions in the UK could In response to COVID-19, the West Midlands
boost GDP by more than £80 billion. There adapted its Local Industrial Strategy to take
are wide regional variations in productivity per account of the impact of the pandemic and set
job across the UK, mostly due to productivity out the following seven priorities for recovery:
differences within particular sectors. Our
analysis suggests that variations in skills levels • Harness the potential of green technology
and connectivity are the most important factors to deliver green growth and create green
in explaining differences in productivity across manufacturing jobs.
UK local areas and so should be a particular
focus of investment for both government • Maximise job creation for local people from
and business. HS2, the Commonwealth Games and City
of Culture.
The most successful places will be those
with a commercial culture that encourages • Invest in healthcare innovation, building a
entrepreneurship, investment and innovation more resilient medtech supply chain and
to flourish. There is a balance to be struck improving health outcomes.
between supporting existing businesses
and key assets, and nurturing future growth • Build better digital and transport links,
industries. Disruption brought about by investing in sustainable transport projects to
COVID-19 has created new opportunities support economic growth and housing.
and many companies – from video calling
to delivery services – have thrived during • Regenerate and build brownfield land and
social distancing. build at least 35,000 new homes.
Forging strong relationships between the • Get people back into work, with a particular
public sector, universities and business will focus on equipping people with the skills
be an important competitive differentiator, they need for the future.
particularly for cities in the UK that will have to
increasingly compete on the global stage. This • Back the region’s businesses, helping them
will be a key area of focus for places as they to adapt to the post-COVID-19 environment.
revisit or develop their local recovery strategies
and identify priorities to boost productivity and
support innovation.
32 Good Growth for Cities‘Levelling up’ through trade Liveable and sustainable places
and investment
Through our Future of Government research,
Each region, city
the public across towns, cities and rural
International trade and investment can be
areas told us how important the ‘liveability’ of or town will have
a powerful engine for growth. Longer-term
their place is. People want to live in inclusive different challenges,
success internationally will depend on
increasing productivity and competitiveness
and healthy local areas where they feel safe opportunities and areas
and welcome. of focus, but there are
at home. The UK’s new relationship with
the EU and changing relationship with other common themes that
With more people working from home,
international partners is increasing the will feature in all local
previously disconnected towns and cities have
urgency of developing growth strategies
new opportunities to build virtual connections economic strategies.
and partnerships across and within the UK’s
and play to their strengths in terms of liveability,
regions which harness the benefits of trade
affordability and community. Our public survey
and investment.
found that around 30% of those who previously
thought they would move to a city centre
Trade and investment needs to become a
now want to live in the suburbs or towns and
team sport. Government, central and local,
villages. Likewise, 19% of those who previously
will need to engage businesses – including
thought they would move to the suburbs
smaller, less productive ones – to understand
now think they will move to a town or village.
their priorities and how they can be supported
However, for now, younger people and those at
to expand on the international stage. It
earlier stages of their careers are still inclined to
will need new partnerships and business
stay in the city.
models, including between large and small
firms; between local communities, business,
There is still much uncertainty over how these
academia and government; and between
trends will play out, but it is possible that
the UK and its regions, and new and existing
increased working from home – particularly
international partners.
in the business services sector – could lead
to more people choosing to move away from
major cities and, in particular, from London.
This opens up opportunities for places that
have advantages in terms of liveability and
community, and where ‘price of success’
factors, such as housing affordability, are
less of an issue.
Good Growth for Cities 33Return to the high street The pandemic’s profound impact on local high streets, town centres and city centres is clear. Our research with the Local Data Company shows that a record number of shops (11,120) permanently closed their doors in the first half of 2020. However, over the same period there have also been consistent openings (5,119 – the highest since 2017). Working as part of the High Streets Task Force with the Institute of Place Management and consortium partners, we have investigated the drivers behind post-lockdown high street recovery to understand the pace and shape of the recovery across different locations. Our analysis found that, overall, recovery varies significantly by town and is dependent on a variety of factors, including a town’s demand profile before COVID-19, its accessibility and the nature of its attractions. Traditional offerings are no longer enough to draw in visitors, leaving place makers with the challenge of designing successful and sustainable spaces which meet the needs of their wider catchment communities. As people return to our town and city centres, there is an opportunity to reimagine high streets and town centres, putting them once again at the heart of our local communities and economies. The high street will not go back to how it was and cannot recover through the retail sector alone. The future high street will bring together homes and workplaces, and community and green spaces. Businesses, communities, local and central government need to come together and create liveable, vibrant and unique places where people want to live, work and visit. 34 Good Growth for Cities
A new lens on connectivity                         Resilience and recovery in
                                                   Greater Manchester
COVID-19 has opened up a new lens on
connectivity and the future focus may              Greater Manchester’s COVID-19 strategies
increasingly be less about getting people to       draw on the established history and structures
jobs, and more about getting jobs to people.       of joint-working across the city region, focusing
                                                   on how the whole system can work together
With a greater number of people working,           to deliver the interventions needed to build
or studying, at home, investment in digital        resilience and move towards recovery.
connectivity will also be key to more physically
peripheral places. In line with the focus on       The city region’s longer-term vision includes
inclusive growth, issues of digital poverty also   10 priorities for making Greater Manchester
need to be addressed to ensure that everyone       fairer, addressing education and skills, health
can benefit from online working, learning and      and wellbeing, the environment, and work
access to services.                                and economic growth – all aspects reflected
                                                   in the Good Growth Index. Its approach to
                                                   economic recovery covers an employment
                                                   and skills recovery plan, the development of
                                                   social infrastructure to drive more inclusive
                                                   economic growth, a housing programme to
                                                   support greener economic recovery, support to
With a greater number of people                    innovative businesses and to sectors which can
                                                   exploit new opportunities, alongside expanding
working, or studying, at home,                     the Greater Manchester Good Employment
investment in digital connectivity                 Charter to drive more secure work.
will also be key to more physically
peripheral places.

                                                                                                       Good Growth for Cities   35
You can also read