Basildon Borough Council Castle Point Borough Council Rochford District Council Southend-on-Sea Borough Council Thurrock Council South Essex ...
←
→
Page content transcription
If your browser does not render page correctly, please read the page content below
Basildon Borough Council
Castle Point Borough Council
Rochford District Council
Southend-on-Sea Borough Council
Thurrock Council

South Essex Retail Study
Volume 1: Main Report

Peter Brett Associates
November 2017

Office Address:

33 Bowling Green Lane, London, EC1R 0BJ
T: +44 (0)207 566 8600 E: london@peterbrett.com
Project Ref 37898

                         Name                Position                    Signature            Date

                         Ashleigh Cook       Graduate Planner       AC

     Prepared by:        Jonathan Ngige      Planner                JN

                         Francesca
                                             Senior Planner         FR
                         Rowson
     Prepared and
                         Cathy Hall          Senior Associate       CH
     reviewed by:

     Approved by:        Kieran Rushe        Equity Director        KR

    For and on behalf of Peter Brett Associates LLP

Peter Brett Associates LLP disclaims any responsibility to the client and others in respect of any
matters outside the scope of this report. This report has been prepared with reasonable skill, care and
diligence within the terms of the contract with the client and taking account of the manpower,
resources, investigations and testing devoted to it by agreement with the client. This report has been
prepared for the client and Peter Brett Associates LLP accepts no responsibility of whatsoever nature
to third parties to whom this report or any part thereof is made known. Any such party relies upon the
report at their own risk.
© Peter Brett Associates LLP 2017

THIS REPORT IS FORMATTED FOR DOUBLE-SIDED PRINTING.
.

                                                                                                      ii
South Essex Retail Study
Volume 1: Main Report

CONTENTS
1     INTRODUCTION .......................................................................................................... 1
      Structure of report ........................................................................................................ 2

2     EXISTING RETAIL AND LEISURE EVIDENCE BASE ................................................ 3
      Key findings.................................................................................................................. 6

3     PLANNING POLICY MATTERS .................................................................................. 7
      Introduction .................................................................................................................. 7
      National Planning Policy Framework ............................................................................ 7
      National Planning Policy Guidance............................................................................... 8
      Strategic planning ........................................................................................................ 9

4     MARKET AND ECONOMIC TRENDS ........................................................................10
      Introduction .................................................................................................................10
      Market trends ..............................................................................................................10
      Economic trends .........................................................................................................14
      Implications for South Essex .......................................................................................17
      Key findings.................................................................................................................19

5     NETWORK OF CENTRES ..........................................................................................20
      Introduction .................................................................................................................20
      Basildon ......................................................................................................................21
      Castle Point .................................................................................................................22
      Rochford .....................................................................................................................23
      Southend-on-Sea ........................................................................................................23
      Thurrock ......................................................................................................................23
      Competing centres ......................................................................................................24
      Key findings.................................................................................................................26

6     SPENDING PATTERNS .............................................................................................27
      Introduction .................................................................................................................27
      Household survey and study area ...............................................................................27
      Spending patterns .......................................................................................................28
      Population and expenditure growth .............................................................................34
      Key findings.................................................................................................................36

7     QUANTITATIVE RETAIL NEED .................................................................................37
      Introduction .................................................................................................................37
      Claims on expenditure growth .....................................................................................37

November 2017                                                                                                                       iii
South Essex Retail Study
Volume 1: Main Report

       Quantitative need ........................................................................................................38
       Key findings.................................................................................................................42

8      QUANTITATIVE LEISURE NEED...............................................................................43
       Introduction .................................................................................................................43
       Leisure spending growth .............................................................................................43
       Food and beverage sector...........................................................................................45
       Cinema sector .............................................................................................................45
       Key findings.................................................................................................................47

9      RETAIL IMPACT ASSESSMENT ...............................................................................48
       Introduction .................................................................................................................48
       Method ........................................................................................................................48
       Impact assessment .....................................................................................................49
       Key findings.................................................................................................................52

10     RECOMMENDATIONS ...............................................................................................53
       Introduction .................................................................................................................53
       Scale of growth ...........................................................................................................53
       Hierarchy of centres ....................................................................................................54
       Distribution of growth...................................................................................................55
       Principles for town centre uses in strategic housing allocations ...................................57

TABLES
Table 4.1 Summary of long-term retail growth prospects ......................................................15
Table 4.2 Adjusted Special Forms of Trading Market Shares (%) .........................................16
Table 5.1 South Essex and competing centres Venuescore 2015/16 ..................................21
Table 6.1 Study area zones and geography .........................................................................28
Table 6.2 South Essex comparison spending patterns summary..........................................28
Table 6.3 Comparison spending patterns summary..............................................................30
Table 6.4 South Essex convenience spending patterns summary ........................................31
Table 6.5 Convenience spending patterns summary ............................................................31
Table 6.6 South Essex leisure spending patterns summary .................................................32
Table 6.7 Food and drink leisure spending patterns summary ..............................................33
Table 6.8 Cinema leisure spending patterns summary .........................................................33
Table 6.9 Study area population growth 2016-2037 .............................................................34
Table 6.10 Comparison expenditure growth 2016-2037 (exc. SFT) (£M) ..............................35
Table 6.11 Convenience expenditure growth 2016-2037 (exc. SFT) (£M) ............................35
Table 7.1 Comparison commitments ....................................................................................37
Table 7.2 Step-by-step comparison need .............................................................................38

November 2017                                                                                                                        iv
South Essex Retail Study
Volume 1: Main Report

Table 7.3 Baseline comparison needs summary (sqm net) ..................................................39
Table 7.4 Housing-led comparison needs summary (sqm net) .............................................39
Table 7.5 Baseline convenience needs summary (sqm net) .................................................41
Table 7.6 Housing-led convenience needs summary (sqm net)............................................41
Table 8.1 Leisure expenditure growth by sector and LPA 2016-2037 (£m) ...........................43
Table 8.2 Food and beverage need by LPA 2016-2037 (£m) ...............................................45
Table 8.3 Cinema screen capacity by LPA 2016-2037 (£m) .................................................45
Table 9.1 Retail impact assessment method ........................................................................48
Table 9.2 Pre- and post-Lakeside and Bluewater market shares ..........................................49
Table 9.3 Adjusted market share comparison needs summary (sqm net) – baseline scenario
.............................................................................................................................................49
Table 9.4 Adjusted market share comparison needs summary (sqm net) – housing-led
scenario ...............................................................................................................................50
Table 9.5 Difference in comparison need across the five authorities – baseline scenario .....50
Table 9.7 Diversion to Lakeside and Bluewater extensions from and impact on selected
destinations in South Essex in 2026 .....................................................................................51
Table 10.1 Scale of retail and leisure growth to 2037 ...........................................................53
Table 10.2 Hierarchy of town centres in South Essex ...........................................................54
Table 10.3 Comparison and convenience retail needs by local authority in South Essex
(2026)...................................................................................................................................55

FIGURES
Figure 2:1 South Essex sub-region retail evidence structure ................................................. 3
Figure 4:1 UK Grocery operators’ growth 2013-2018 ...........................................................12
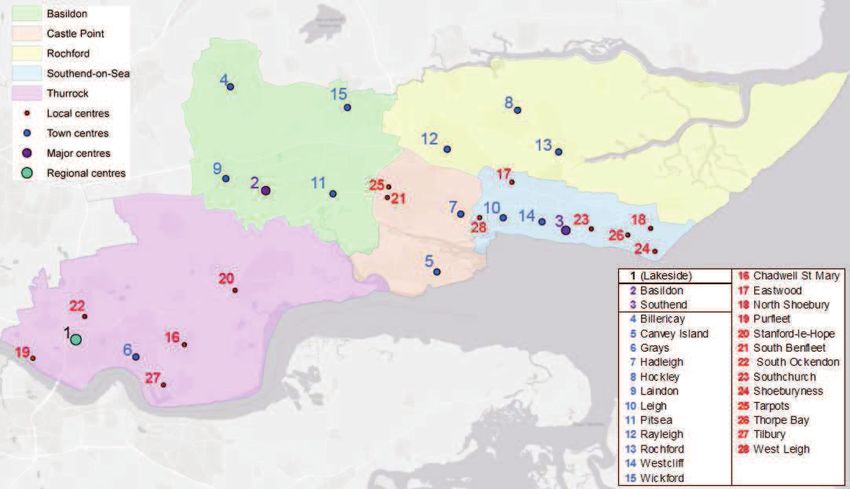
Figure 5:1 South Essex network of centres ..........................................................................20
Figure 6:1 South Essex comparison local resident spending and inflow spending patterns ..29
Figure 7:1 Comparison needs requirements (net) – baseline and housing-led scenarios .....40
Figure 7:2 Convenience needs requirements – baseline and housing-led scenarios (net) ....42

VOLUME 2: APPENDICES (SEPARATE DOCUMENT)
APPENDIX A STATEMENT OF COMPLIANCE
APPENDIX B STUDY AREA
APPENDIX C QUANTITATIVE RETAIL CAPACITY
APPENDIX D CATCHMENT AREA PLANS
APPENDIX E QUANTITATIVE METHOD
APPENDIX F LEISURE CAPACITY
APPENDIX G IMPACT ASSESSMENT
APPENDIX H FOSSETTS FARM CAPACITY SENSITIVITY

November 2017                                                                                                                                v
South Essex Retail Study
Volume 1: Main Report

VOLUME 3: HOUSEHOLD SURVEY DATA (SEPARATE DOCUMENT)

November 2017                                     vi
South Essex Retail Study
Volume 1: Main Report

1       INTRODUCTION
1.1     National planning places a duty on local planning authorities to cooperate on strategic
        cross-boundary planning issues including the provision of retail and leisure
        development. This Study has been commissioned to provide a common evidence
        base to assist cooperation between the South Essex authorities on cross-boundary
        retail and leisure planning matters.
1.2     Peter Brett Associates LLP (PBA) was instructed by the consortium of five authorities
        in April 2016 to provide a strategic retail evidence base for the South Essex sub-
        region (tier one evidence). The five authorities are; Basildon Borough Council (BBC),
        Castle Point Borough Council (CPBC), Rochford District Council (RDC), Southend-
        on-Sea Borough Council (SBC) and Thurrock Council (TC). This Study provides a
        common evidence base to assist cooperation between the South Essex authorities on
        cross-boundary retail and leisure planning matters.
1.3     The South Essex authorities are also producing joint evidence on housing and
        employment matters. The Strategic Housing Market Assessment (SHMA) (May 2016)
        and subsequent addendum (May 2017) were prepared by Turley in partnership with
        Edge Analytics and provides a consistent evidence base for the five South Essex
        authorities on objectively assessed need for housing, aligned with forecast job
        growth.
1.4     PBA has been commissioned to prepare updates to selected local authorities retail
        and leisure evidence base (‘tier two evidence’) for TC, CPBC and SBC in parallel with
        this Study. A new household survey was undertaken by NEMS market research in
        July 2016 to provide the basis for a common evidence base for the South Essex
        Strategic Retail Study (SESRS) and the tier-two retail studies. Updates to the existing
        retail evidence base for Basildon and Rochford are not required since the existing
        evidence is considered to be sufficiently up to date.
1.5     The objectives of this Study are as follows:
            Review the context in which this Study is undertaken including; relevant planning
            policies, existing available retail evidence for each Authority and key market and
            economic trends in the retail and leisure sectors;
            Undertake a strategic overview of the existing network of centres in the defined
            study area, including those centres within the five authorities and the main
            competing centres;
            Analyse retail and leisure spending patterns for the South Essex sub-region
            informed by a new household survey of shopping patterns and assess the
            catchment areas of the main centres;
            Assess the need for additional convenience and comparison retail floorspace and
            key high order leisure uses up to 2037 and consider a range of scenarios for the
            spatial distribution of the assessed retail and leisure needs between the five
            authorities;

November 2017                                                                                  1
South Essex Retail Study
Volume 1: Main Report

            Consider the need for new retail and leisure facilities generated by large strategic
            housing developments; and,
            Recommend options for the spatial distribution of the assessed retail and leisure
            needs across the five authorities up to 2037.

        Structure of report
1.6     Responding to the Study objectives, the report is structured as follows:
            Section 2 summarises the current retail and leisure evidence base for the five
            South Essex authorities
            Section 3 reviews the relevant planning policy in relation to plan-making and retail
            and other town centre uses
            Section 4 reviews the key market and economic trends in the retail and leisure
            sectors
            Section 5 assess the existing network of centres in the study area
             Section 6 analyses retail spending patterns in the comparison (non-food) and
            convenience (food) sector and leisure spending patterns across the study area in
            2016
            Section 7 summarises the quantitative assessment of retail need for the
            comparison and convenience sector undertaken at Appendix C
            Section 8 summarises the quantitative assessment of leisure need for the food
            and drink and cinema sector undertaken at Appendix F
            Section 9 summarises the retail impact assessment undertaken at Appendix G
            which assess the impact of additional retail floorspace at Lakeside regional centre
            upon the surrounding network of centres
            Section 10 presents key recommendations for the spatial distribution of the
            assessed retail and leisure needs across the five authorities up to 2037, as well
            as providing principles for planning for retail and leisure needs which take account
            of the health of the existing network of town centres as more detail about the
            distribution of housing growth across South Essex become clearer within
            emerging policy documents.

November 2017                                                                                   2
South Essex Retail Study
Volume 1: Main Report
2 EXISTING RETAIL AND LEISURE EVIDENCE BASE
2.1 This section will briefly summarise the existing retail evidence base for each of the
South Essex authorities. First it summarises the existing evidence on retail need in
Castle Point, Southend and Thurrock which will be updated through the preparation
of new retail studies in conjunction with this study (tier two evidence).
2.2 The existing local evidence on retail need in Rochford and Basildon is then
summarised. Updates for these authorities will not be prepared due to the evidence
being published recently. To provide consistency, a statement of compliance for
Rochford and Basildon is provided within Volume 2 of this report (Appendix A).
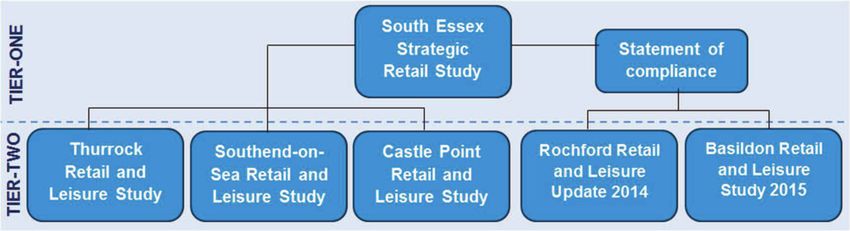
2.3 The diagram below explains the structure of the retail evidence base for the South
Essex sub-region.
Figure 2:1 South Essex sub-region retail evidence structure
Source: PBA (2016)
Castle Point Employment and Retail Needs Assessment
2.4 The current retail evidence base for CPBC is contained within the 2012 Castle Point
Employment and Retail Needs Assessment (ERNA) prepared by consultants
Nathaniel Lichfield and Partners.
2.5 Section 8 provides an assessment of future retail needs over the period from 2012 to
2031 and the headline quantitative needs outputs for Castle Point are summarised
below:
Comparison goods: 3,414 sqm net by 2021 and 8,353 sqm net by 2031
Convenience goods: 1,200 sqm net by 2021 and 2,267 sqm net by 2031
Other A2-A5 retail uses: 3,600 sqm gross by 2031
2.6 In terms of distribution, the ERNA states that new floorspace should be directed
towards Canvey Island and Hadleigh town centres where masterplans are being
prepared in order to support town centre vitality and viability.
2.7 Section 9 provides an assessment of commercial leisure needs which estimates a
need for a further 3,600 sqm gross floorspace up to 2031 for Class A2-A5 retail uses
and Class A1 retail services, based on a 25% uplift. The ERNA recognises that
Castle Point has a limited selection of large commercial leisure facilities; however; the
potential to provide additional facilities in Castle Point is limited because residents
November 2017 3South Essex Retail Study
Volume 1: Main Report
have good access to a wide range of large leisure facilities in neighbouring authorities
(BBC and SBC).
Southend Retail and Town Centre Study
2.8 The current retail evidence base for SBC is contained within Southend Retail and
Town Centre Study (SRTCS) published in 2011 and advice note published in 2012,
both prepared by consultants CB Richard Ellis (CBRE).
2.9 The 2012 advice note reviews the findings of the 2011 SRTCS and provides revised
quantitative retail capacity forecasts for the period from 2015 to 2025 for the
comparison and convenience goods sector. The headline quantitative needs outputs
for SBC from the 2012 advice note1 are summarised below:
Comparison goods: 53,492 sqm net by 2020 and 86,873 sqm net by 2025
Convenience goods: 3,619 sqm net by 2025
2.10 In terms of distribution, the SRTCS directs all floorspace capacity towards the town
centre to support the regeneration of the town centre and the Southend Central Area
Action Plan (SCAAP).
2.11 Although there was no borough-wide need for additional convenience floorspace up
to 2020, because out-of-centre convenience floorspace commitments exceed
capacity, both the SRTCS and the 2012 advice note2 identified need for 308 sqm net
convenience floorspace in Southend town centre.
Thurrock Retail Study Update
2.12 The existing retail evidence base for TC is contained within the 2012 Thurrock Retail
Study Update (RSU) prepared by RTP (now PBA).
2.13 Section 5 of the RSU provides an updated quantitative assessment of retail needs
over the period from 2011-2026 for the comparison and convenience goods sector.
The headline quantitative needs outputs for TC are summarised below:
Comparison goods: 23,900 sqm net by 2021 and 35,000 sqm net by 2026
Convenience goods: 7,400 sqm net by 2021 and 8,600 sqm net by 2026
2.14 Section 7 of the RSU provides advice on retail growth at Lakeside, including the
shopping centre and surrounding retail parks. In terms of the distribution of
floorspace, 90% of total floorspace needs are directed to Lakeside Basin area to
support the establishment of a new town centre. The remaining 10% is directed
elsewhere.
2.15 The delivery of new comparison floorspace at Lakeside is restricted by planning
policy to 50,000 sqm net by up to 2019. This floorspace should improve the diversity
of the shopping offer by providing a variety of different unit formats and sizes to suit a
range of different operators. In the convenience sector, the RSU identified an
1
Table 4b
2
Table 4a
November 2017 4South Essex Retail Study
Volume 1: Main Report
opportunity to provide two supermarkets at Lakeside; a food supermarket of up to
1,500 sqm net as part of the Lakeside shopping centre expansion; and, a food
superstore of up to 3,500 sqm net delivered centrally within the new town centre.
Rochford Retail and Leisure Study Update
2.16 The retail evidence base for RDC is contained within the Rochford Retail and Leisure
Study Update (RLSU) prepared by NLP and published in 2014.
2.17 Section 3 provides an assessment of future retail needs up to 2031 and the headline
quantitative needs outputs for Rochford under the baseline population scenario are
summarised below:
Comparison goods: 1,824 sqm net by 2024 and 4,937sqm net by 2034
Convenience goods: 1,697 sqm net by 2024 and 2,711 sqm net by 2034
2.18 These capacity figures set out above are based up on the population projections from
the Thames Gateway/South Essex SHMA.
2.19 Section 4 considers the requirement for other town centre uses. It identifies a
potential requirement for up to 3,000 sqm gross of Class A3-A5 floorspace for new
food and beverage outlets. In terms of distribution, the priority should be for new A3
restaurant and café units within Rayleigh and Hockley.
Basildon Retail and Commercial Leisure Capacity Study
2.20 The retail evidence base for BBC is contained within the Retail and Commercial
Leisure Capacity Study (RCLCS) prepared by PBA and published in 2015.
2.21 Section 5 provides an assessment of future retail and leisure needs up to 2035 and
the headline quantitative needs outputs for BBC are summarised below:
Comparison goods: 14,592 sqm net by 2021 and 72,162 sqm net by 2035
Convenience goods: 4,349 sqm net by 2021 and 5,899 sqm net by 2035
2.22 Section 6 considers the requirement for commercial leisure floorspace and finds that
there is considerable scope to improve the food and drink offer (Class A3-A5) in
Basildon, Pitsea and Wickford centres. There is capacity for 5,500 sqm gross
floorspace up to 2021 and 16,600 sqm gross floorspace up to 2035, the majority of
which should be directed to Basildon town centre in order to compete with the
Festival Leisure Park.
November 2017 5South Essex Retail Study
Volume 1: Main Report
Key findings
This report has summarised the scale of need for new retail and commercial
leisure floorspace as established in the existing retail evidence base for each
South Essex authority.
Castle Point: 3,414 sqm net comparison floorspace and 1,200 sqm net
convenience floorspace by 2021.
Southend: 53,492 sqm net comparison floorspace by 2020. Localised need
for 308 sqm net convenience floorspace in Southend town centre by 2020 but
no borough wide convenience capacity up to 2020.
Thurrock: 23,900 sqm net comparison floorspace and 7,400 sqm net
convenience floorspace by 2021.
Rochford: 1,824 sqm net comparison floorspace and 1,697 sqm net
convenience floorspace by 2024.
Basildon: 14,592 sqm net comparison floorspace and 4,349 sqm net
convenience floorspace by 2021.
November 2017 6South Essex Retail Study
Volume 1: Main Report
3 PLANNING POLICY MATTERS
Introduction
3.1 This chapter of the report provides a summary of the national and local planning
policy context. As a starting point, we review the National Planning Policy Framework
(NPPF) and National Planning Policy Guidance (NPPG) as it applies to plan making.
We then review the strategic planning framework for South Essex.
National Planning Policy Framework
3.2 The NPPF was published by the Government in 2012. Paragraph 14 includes a
presumption in favour of sustainable development, which for plan-making means that:
‘Local planning authorities should positively seek opportunities to meet the
development needs of their area;
Local plans should meet objectively assessed needs, with sufficient flexibility to
adapt to rapid change, unless:
Any adverse impacts of doing so would significantly and demonstrably outweigh
the benefits, when assessed against the policies in this Framework taken as a
whole; or
Specific policies in this Framework indicate development should be restricted.’
3.3 Chapter 2 ‘Ensuring the vitality of town centres’ deals with retail and other town
centre uses. Paragraph 23 states that planning policies should be positive, promote
competitive town centre environments and set out policies for the management and
growth of centres. There is a requirement for local authorities to recognise town
centres as the heart of their communities and to define a network and hierarchy of
centres that is resilient to anticipated future economic changes. Finally, there is an
important requirement that:
“needs for retail, leisure, office and other main town centre uses are met in full and
are not compromised by limited site availability”
3.4 The NPPF requires local plans to be based on adequate, up-to-date and relevant
evidence about the economic, social and environmental characteristics and prospects
of the area. In terms of a retail evidence base, paragraph 161 states that they should
assess:
‘the needs for land or floorspace for economic development, including both the
quantitative and qualitative needs for all foreseeable types of economic activity
over the plan period, including for retail and leisure development;
the role and function of town centres and the relationship between them, including
any trends in the performance of the centres;
the capacity of existing centres to accommodate new town centre development;
locations of deprivation which may benefit from planned remedial action.’
November 2017 7South Essex Retail Study
Volume 1: Main Report
3.5 The NPPF places a Duty on Public bodies to cooperate on strategic cross-boundary
planning issues, including the provision of retail and leisure development. Paragraph
178 states that such joint working enables local planning authorities to meet
development requirements which cannot wholly be met within their own areas. There
is a requirement for authorities to provide evidence of effective cooperation on cross-
boundary planning issues. Paragraph 180 states that this could be demonstrated by a
memorandum of understanding or jointly prepared evidence base.
3.6 To be considered sound, Paragraph 182 requires Local Plans to be positively
prepared (i.e. based on a strategy which seeks to meet objectively assessed
development and infrastructure requirements), justified (i.e. the most appropriate
strategy, when considered against the reasonable alternatives), effective (i.e.
deliverable and based on joint working) and consistent with national policy (paragraph
182).
National Planning Policy Guidance
3.7 The NPPG online resource was launched in March 2014 to provide further guidance
on and support to the policies contained within the NPPF.
3.8 Town centre matters are set out in the section ‘Ensuring the vitality of town centres’,
paragraph 002 states that a positive vision or strategy for town centres, articulated
through the Local Plan, is key to ensuring successful centres which enable
sustainable economic growth and provide a wider range of social and environmental
benefits.
3.9 Paragraph 003 states that strategies should be based on evidence on the current
performance of the town centre. Strategies should also identify opportunities to meet
development needs; support town centre viability and vitality; and, identify changes in
the hierarchy of town centres, including where a town centre is in decline. In these
cases, strategies should seek to manage decline positively to encourage economic
activity and achieve an appropriate mix of uses commensurate with a realistic future
for that town centre.
3.10 Paragraph 005 of the NPPG sets out 10 indicators of vitality and viability that should
be considered when assessing the health of town centres.
3.11 Paragraph 009 states that authorities should allocate sufficient sites to meet the
assessed need for town centre uses in accordance with the sequential approach. If
needs cannot be met on town centre sites then sequentially preferable sites (i.e. edge
of centre and then out of centre) should be considered. Sites should be assessed for
their suitability, availability and viability with regard to the nature of the need that is to
be addressed.
3.12 Paragraph 014 states that the impact test may be used in plan-making to determine
whether proposals in certain locations would impact on ‘existing, committed and
planned public and private investment or on the role of centres’.
November 2017 8South Essex Retail Study
Volume 1: Main Report
Strategic planning
3.13 This Study has been prepared in a way which is consistent with the emerging
evidence base. Section 7 of this report will present two sets of quantitative retail and
leisure capacity forecasts based on alternative population forecasts, as follows;
Baseline scenario: Experian MMG3
Housing -led scenario: SHMA and Experian MMG3
3.14 In the baseline scenario, population from figures from Experian MMG3, are applied to
all zones in the study area. In the housing-led scenario, population growth rates
derived from the 2017 SHMA are applied to those zones in the study area which
relate to the five South Essex authorities and the Experian figures are applied to all
other zones. The 2017 SHMA population figures used relate to the upper end of the
2017 OAN Addendum. As such, this Study provides a consistent set of evidence for
the South Essex authorities to set policies on future retail and leisure development.
3.15 It should be noted that in the housing-led scenario, the population distribution used is
the indicative split within the housing market area (HMA). The NPPF only requires
housing needs to be met in full at the HMA level; it is therefore possible that housing
needs may not be met in accordance with the indicative split identified in the SHMA.
However, an alternative distribution has not been agreed so for the purpose of this
study, we have adopted the indicative split. A recommendation of this study will
include revisiting this distribution in the form of an addendum to deal with housing
distribution if and when an alternative approach is agreed between the client group.
November 2017 9South Essex Retail Study
Volume 1: Main Report
4 MARKET AND ECONOMIC TRENDS
Introduction
4.1 This section summarises published industry research on the future role and function
of town centres with a review of key trends which are likely to influence the demand
for new retail and commercial leisure floorspace in South Essex. The second part of
this section will summarises the headline economic forecasts which feed into the
quantitative assessment of retail and leisure needs in Section 6 and 7.
Market trends
4.2 The market context for town centres, and retail in particular, is continuously evolving.
The role of the town centre is not as clearly defined as it has been in the past, and
indications are that the town centres which have best weathered the recent economic
downturn are those which have a diverse range of uses.
4.3 In this section, the key changes in the retail and leisure market that are considered
likely to have the most significant implications on town centres are discussed. The
key trends include:
Polarisation trend
Restructuring of the convenience (food) sector
Growth of commercial leisure sector
Effects of digital technology
Polarisation
4.4 Since the last economic downturn, several factors have created a need for retailers to
rapidly adapt their business strategies and store formats to economic changing
circumstances. These factors include
Reduced consumer expenditure growth
Changes in customer requirements
Growth of internet and multi-channel retailing
4.5 The culmination of these factors resulted in a ‘polarisation trend’ in the comparison
sector whereby retailers have increasingly concentrated trading activities within larger
retail centres and out-of-town retail parks. As a result, the strength of the comparison
retail offer in larger centres continues to improve relative to small centres.
4.6 Retailers have altered their business models in this way in order to compete with
internet based retailers which have significantly lower overhead costs. Operating a
strategic network of large stores in larger centres with capacity to stock full product
ranges provides greater efficiency compared to a network of smaller-format stores
which offer a limited range of products. The growing popularity of multi-channel
retailing means that many retailers now require fewer stores than before to reach
their customer base. In 2011, Deloitte estimated that the polarisation trend could
November 2017 10South Essex Retail Study
Volume 1: Main Report
result in portfolio reductions of between 30 to 40% in the short to medium term in
certain retail categories3.
4.7 National retailers have become increasingly concentrated within the larger regional
‘top 100’ centres and the share of comparison retail sales conducted through town
centre shops declined from 64% in 2002 to just over 40% by 20134. The main
beneficiaries of this trend have been out of town retail parks.
4.8 Retailers are increasingly looking to out of town retail parks to meet the demand for
large format units. The retail warehousing market has seen increasing demand from
traditional high street retailers since these units are considered best placed to serve
the multi-channel customer. Key anchor retailers have continued to invest in new
large format stores in out of centre locations such as John Lewis at Home and Next
Home. These larger stores display their full range of products and provide click and
collect facilities in accessible locations.
4.9 Increased demand for out of centre floorspace has reduced vacancy levels down to
pre-recession levels. Due to a shortage in new space, landlords are focusing on
improving the quality of existing retail parks through refurbishment and the
introduction of a greater range of uses, including leisure. As a result, retail parks are
becoming destinations in their own right offering customers an enhanced shopping
experience5.
4.10 The retail development pipeline has slowed and 2012 saw the lowest quantum of new
floorspace delivered in the UK since the 1990’s. However, since 2012, a number of
major retail schemes opened including Trinity Shopping Centre in Leeds owned by
Land Securities in 2013; Old Market in Hereford owned by British Land in 2014; and,
Grand Central in Birmingham owned by Birmingham City Council in late 20156.
4.11 The scale and type of investment is different to that experienced during the ‘golden
age’ of shopping centre development, between 1997 and 2007. In line with the
polarisation trend, investment in new comparison retail floorspace is becoming
increasingly concentrated in the larger city centres and regional shopping centres.
Restructuring of the convenience sector
4.12 During the economic downturn the convenience goods sector was a key driver of
growth. This sector has traditionally been dominated by the ‘Big Four’ supermarket
operators: Asda, Morrison’s, Tesco and Sainsbury’s and large foodstores (2,300 sqm
net) were the primary driver of growth in the sector. However, structural changes
have taken place in the sector, as follows:
Discount food operators: operators such as Aldi and Lidl have increased their
market share of the grocery market significantly and are continuing to expand
3
Deloitte LLP, The Changing Face of Retail (2011)
4
Peter Brett Associates, Investing in the High Street: Town Centre Investment Management (2013)
5
Colliers International, Heading out of town-the changing landscape of the retail warehousing market (2016)
6 BCSC (2013) Shopping Centre Development Pipeline Report
November 2017 11South Essex Retail Study
Volume 1: Main Report
‘C-format’ stores: major grocery retailers have expanded their network of smaller
convenience stores in order to increase their market share (Tesco Express,
Sainsbury’s Local and Little Waitrose)
Online shopping: the ‘race for space’ over the last decade has resulted in major
operators investing in online grocery shopping in order to increase market shares.
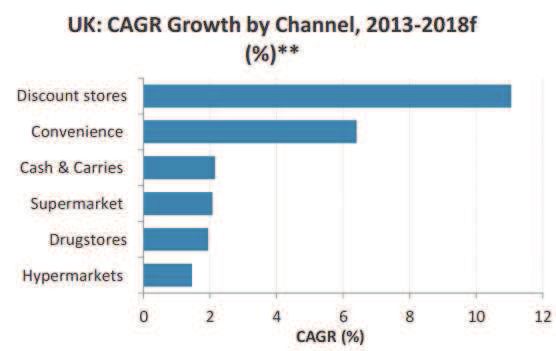
Figure 4:1 UK Grocery operators’ growth 2013-2018
Source: Planet Retail, European Grocery Retailing (2016)
4.13 Discount retailers are now important forces in the convenience goods market and are
expected to continue to take market share from the Big Four supermarket operators.
4.14 As shown in Figure 4:1, between 2013 and 2018 the compound annual growth rate
(CAGR) of discount retailers (such as Aldi and Lidl) and convenience (C-format
stores) is expected to reach 11% and almost 7% respectively whereas the growth
rate among supermarkets is forecast at just 2%.
4.15 Verdict expects that the proportion of floorspace accounted for by ‘smaller stores’ will
increase from 37.6% in 2007 to 41.6% by 2017. This shift has been driven by a shift
in consumer behaviour; shoppers are undertaking an increased number of smaller
‘top-up shopping’ or ‘basket shopping’ trips instead of a weekly food shop to a large
out of centre foodstore. This is trend has been exacerbated by the growth of online
grocery shopping, as customers undertake top-up shopping to supplement the main
grocery delivery.
4.16 Convenience operators’ business models have shifted towards the expansion of
smaller ‘C-format’ stores. Both Sainsbury’s and Tesco now have more ‘C-stores’ than
large supermarkets. In January 2015, Tesco announced they would abandon the
development of 49 ‘very large’ foodstores and close 43 unprofitable stores. Both
Sainsbury’s and Morrison’s have withdrawn from a number of large development
schemes across the UK which has directly affected the study area.
4.17 In late 2015 Morrisons withdrew from a development scheme in Pitsea, where the
company had agreed to take a 6,968 sqm unit. The unit was subsequently sub-let to
value homeware retailer The Range. Similarly, a commitment in Thurrock (Lakeside)
November 2017 12South Essex Retail Study
Volume 1: Main Report
for a Morrisons store has not materialised. Elsewhere in the study area, Tesco
stepped away from their previous aspirations to deliver foodstore-led scheme
adjacent to Southend Victoria station; Sainsbury’s also withdrew proposals for a
foodstore at Southend United football ground and instead housing is being
progressed on that site.
Growth of the commercial leisure sector
4.18 Most commentators predict that commercial leisure, such as cafes, bars, restaurants
and cinemas, will constitute a growing share of town centre floorspace. This is partly
a replacement activity as a consequence of the reduced demand for traditional retail
space, and partly driven by the increase in leisure expenditure as discretionary
household expenditure rises. These key trends include7:
Cinema sector: expected to expand via acquisition and diversification of the
market despite falling attendance figures over the last two years. The big three
cinema operators are focusing on larger markets where there is limited
competition. The second tier and boutique operators are focusing on the
qualitative difference in their offer to enable them to create specialist markets.
Restaurant sector: contributed significantly to the continued growth of the leisure
sector throughout and since the recession. Demand for A3 space is being driven
by the regional expansion of successful A3 operators established in London.
Health and fitness: the market is expected to experience continued growth in
market value with annual memberships increasing from 12.6% to 13.2% and 177
new facilities opened in the year up to 2014 predominantly in the budget sector.
Class D2 leisure use (children’s play): resurgence from the large format D2
leisure operators since the last economic downturn. Operators are offering
increasingly diverse activities with companies from abroad seeking space in the
UK (e.g. laser combat and trampolining) because of consumers spending more of
their disposable income on leisure-based activities.
4.19 When considering leisure expenditure available to households, spending on food and
drink typically accounts for more than 50% of total leisure spending, compared to
around 15% on ‘cultural services’ (e.g. going to the cinema, theatre, art galleries or
live music) and under 10% on hotels, games of chance and recreation/sporting
services.
4.20 There is scope for town centres to capitalise on this trend, redefining their function as
leisure ‘destinations’ in their own right. The development of a strong commercial
leisure offer can help to increase footfall, particularly outside of retail hours, and
visitors undertaking ‘linked trips’ between retail, leisure and other uses also spend
increased dwell-time in centres.
7 Savills (2015) UK Commercial Market in Minutes, Savills World Research
November 2017 13South Essex Retail Study
Volume 1: Main Report
Effects of digital technology
4.21 The rapid uptake of digital technology in the retail sector has facilitated the growth of
online sales which has had a noticeable impact on the built environment in terms of
the ways in which retailers utilise physical floorspace.
4.22 The increased threat posed by internet retailing has prompted many National retailers
to adopt new business strategies. In the non-food sector, the most competitive
retailers have rationalised their property portfolios and focused new investment in
online retailing (web development, mobile retailing and click and collect) in order to
boost the efficiency of their operations.
4.23 Property portfolio rationalisation has resulted in many retailers closing smaller less
profitable stores, typically in small to medium sized towns and concentrating
investment in building a smaller network of large stores in larger shopping
destinations and highly accessible out of town retail parks.
4.24 Experience has shown that retailers who have invested in multi-channel retailing have
proved most successful in recent years. Multi-channel retailing includes a digital
online retail presence complimented by physical stores located in a range of
accessible and attractive locations. Some retailers are increasingly utilising digital
technology in order to drive footfall and in-store purchases. Examples of such
practices include:
in-store handheld internet devices: to provide customers with detailed product
information and enable online ordering;
geo-referencing: sending information to customers’ mobiles about offers and
promotions when they pass close to a store; and,
mobile loyalty card programmes: allow offers to be tailored to individuals shopping
habits.
Economic trends
4.25 This section provides an overview of key retail and leisure forecasts taken from the
Experian Retail Planner Briefing Note (ERPBN14) including expenditure growth,
multi-channel retailing and floorspace efficiency growth, which inform the estimates of
expenditure capacity set out in Section 6.
Expenditure growth
4.26 According to Experian, the outcome of the June 2016 vote in favour of Brexit from the
EU has created major economic uncertainty in the short term. Experian expect this to
have negative implications for investment and hiring plans, while the recent decline in
value sterling is forecast to result in higher inflation. This combination of slower
employment growth and higher inflation is expected to reduce retail sales growth to
just 1% in the short-term (2017-2018).
4.27 Table 4.1 shows the forecast growth for convenience, comparison and leisure
spending per capita for five distinct periods; pre-recession (1997-2007); the recession
and its aftermath (2008-2011); the recovery (2012-2015); medium-term forecast
November 2017 14South Essex Retail Study
Volume 1: Main Report
(2016-2025) and long-term forecast (2026-2035). This allows for an easy comparison
of historic and long-term trends.
Table 4.1 Summary of long-term retail growth prospects
Growth per
Annual average growth (%)
capita
Period 1997-2007 2008-2011 2012-2015 2016-2025 2026-2035
Total retail 5.1 -0.5 2.1 1.8 2.4
Convenience -0.3 -3.2 -1.0 -0.1 0.1
Comparison 8.0 0.6 4.1 2.7 3.2
Leisure -0.9 -3.3 1.7 1.2 1.5
Source: Figure 1 and figure 2, ERPBN14 (November 2016)
4.28 In the short term, according to Experian, retail spending growth will slow sharply
because of economic uncertainty related to the Brexit vote. Convenience retail
spending is forecast to slow from 0.0% in 2016 down -0.9% in 2019 and comparison
retail spending growth is expected to slow from 3.3% in 2016 down to 1.0% in 2018.
Leisure spending is also expected to slow quickly from 1.9% in 2016 down to 0.2% in
2018.
4.29 Retail sales volumes are expected to recover in the medium-term as Brexit-related
uncertainty subsides which is reflected in the higher retail spending growth rates
forecast from 2016-2025 as shown in Table 4.1. It should be noted that this scenario
assumes an orderly transition process with continued access to the EU single market.
4.30 In the long term, forecast growth in retail sales per capita will recover to reach 2.4%
although this is well below the historic pre-recession rate of 5.1% for the reasons set
out above. The failure of the convenience sector to post a sustained recovery in
recent years despite the strengthening of household finances has resulted in
Experian’s long-term growth forecasts remaining subdued over the long term (0.1%).
Experian’s long term comparison growth forecast will remain significantly lower than
the pre-recession period (8.0%) due to the economic constraints posed by Brexit and
the ongoing need for fiscal restraint.
4.31 Leisure spending is forecast to perform well in the long-term compared to historic
trends as shown in Table 4.1. Experian expect that spending will reach 1.5% in the
long-term (2026-2035) which is a reversal of the historic trend of declining per capita
leisure expenditure.
Multi-channel retailing
4.32 Special Forms of Trading (SFT), driven by the increasing popularity of internet
shopping, has significantly outpaced traditional retail sales in recent years and
Experian forecast that it will continue to do so for several years to come. SFT data is
collected by the ONS and includes all non-store retail sales (internet, catalogue,
outdoor markets, telephone sales and door to door).
November 2017 15South Essex Retail Study
Volume 1: Main Report
4.33 SFT now accounts for 15% of all retail sales and the growth of SFT over the last
decade has been driven by the increasing popularity of online shopping. Internet
sales have been rising much more rapidly than general retail sales in recent years.
The share of internet sales as a share of total retail sales increased significantly from
4.7% in June 2008 to 11.7% in mid-2016.
4.34 Experian expect that the growth of SFT retailing will outperform traditional forms of
spending. The SFT share of retail spending is forecast to reach 18.6% by 2022 and
20.4% by the mid-2030s. The continued growth of internet retailing over this period
will be sustained by the uptake of new technology, such as mobile shopping and
interactive TV shopping. Table 4.2 sets out Experian’s adjusted SFT market share
growth forecasts up to 2035.
Table 4.2 Adjusted Special Forms of Trading Market Shares (%)
2016 2018 2026 2031 2035
Total SFT 9.6 10.6 12.7 13.3 13.8
Comparison 13.2 14.4 16.1 16.3 16.5
Convenience 3.0 3.4 4.6 5.0 5.3
Source: Figure 5, ERPBN13 (October 2015)
4.35 The rise of internet retailing has changed how retailers utilise traditional retail outlets
and internet retailing is now seen as both a threat and an opportunity to businesses.
4.36 The growth in online sales has generally had the most negative impact on those
sectors which are more exposed to the digitisation of products and services, such as
electrical goods, books and music. As a result, the number of retailers selling these
products from ‘bricks and mortar’ stores have reduced over recent years.
4.37 The failure of retailers to adapt to new technologies and shopping habits has led to
the high-profile closure of national retailers including Woolworths, Blockbuster and
BHS. However, retailers with a successful multi-channel shopping experience are
expected to see increasing demand for ‘bricks and mortar’ stores driven by online
sales growth. Multi-channel retailing refers to an integrated shopping offer whereby
retailers utilise traditional stores as a showroom for products, a service location and a
collection/drop off point for online orders. Receiving specialised product information
and the opportunity to view, compare and test products before purchase is becoming
increasingly important to customers and this trend will continue to support demand for
retail floorspace.
Sales density growth
4.38 Sales density growth, also referred to as floorspace efficiency growth, refers to the
ability of retailers to achieve increases in their turnover year on year that exceed
inflation. It is important for retail assessments to take this into account since it allows
for a certain amount of expenditure growth to be 'ring-fenced' to be spent within
existing businesses. This is also important for retailers to remain viable over time.
November 2017 16South Essex Retail Study
Volume 1: Main Report
4.39 Conventionally, retail capacity assessments make an allowance for the year-on-year
growth in average sales densities of existing floorspace as a claim on expenditure
growth. Since there is limited evidence on annual turnover growth achieved by
retailers it has been necessary to make informed assumptions about sales density
growth in the convenience and comparison sector based on data provided by industry
bodies, Experian and Pitney Bowes.
4.40 The quality and configuration of floorspace will determine its ability to achieve sales
density growth. Modern large format retail units have greater potential to grow its
sales density year on year compared with small traditional shop units. In the
comparison sector, a range of expenditure growth rates are applied from 2016
onwards depending on the nature of the property offer, as follows:
High (2.5%): locations with a significant proportion of modern retail property or a
high-quality retail offer (i.e. premium retailers);
Medium (1.9%): locations with a mix of modern and older retail properties and a
mixed retail offer; and,
Low (1.5%): locations with a significant proportion of older retail properties or a
low-quality retail offer (i.e. discount stores)
4.41 This is a PBA estimate which is considered to be consistent with the long-term year-
on-year expenditure growth forecast at around 2.0% by Experian.
4.42 The ability for the convenience sector to improve its turnover year or year is restricted
due to the high trading levels that already exist relative to the comparison sector.
Experian forecast negative growth rates in the convenience sector up to 2024 when
growth will resume at just 0.1% from 2024-2035. For these reasons, PBA have not
allowed for the existing floorspace to improve its turnover year-on-year.
Implications for South Essex
4.43 The long-term effects of the polarisation trend have meant that South Essex’s retail
geography is increasingly dominated by several very large centres including within
the study area (Lakeside) but also outside at Bluewater, the improvement of facilities
in Chelmsford and with the development of Westfield Stratford City. At the same
time, as national comparison retailers have rationalised their portfolios in secondary
centres, so too have there been pressures on other centres in South Essex, notably
Basildon and Southend.
4.44 There have been several very immediate impacts on the shift in convenience retail
formats on South Essex. This includes enhancement of local provision by the main
foodstore operators. However, it also includes several larger foodstore schemes
stalling as operators (Morrisons, Sainsbury’s and Tesco) have pulled back from
proposals or commitments in Southend, Basildon and Thurrock. We provide further
analysis of this in the following section.
4.45 While there has been growth the commercial leisure sector in South Essex, larger-
scale development has been focused outside town centres (new out-of-centre
multiplex cinema and A3 uses in Basildon) or has not yet been realised (e.g. the long-
November 2017 17South Essex Retail Study
Volume 1: Main Report
standing leisure-led commitment at Lakeside has yet to commence on site or
development at Fossetts Farm in Southend). That is not to say that change has not
happened in town centres, with all centres playing a role in meeting leisure needs: we
explore in forthcoming sections the leisure role of study area’s centres.
4.46 All centres in South Essex will have experienced the effects of digital technology,
most immediately in terms of a reducing share of particularly comparison spending
being transacted through physical floorspace. However, as set out above, because
the line between physical and online spending is increasingly blurred, the rise of
facilities like Collect+ in even the smallest centres has had the effect of driving footfall
and spending in these locations. Managed shopping centres typically better able to
incorporate digital technologies to enhance the shopping experience which means
that centres like Southend, Basildon and Lakeside have responded better to these
shifts.
November 2017 18South Essex Retail Study
Volume 1: Main Report
Key findings
This report has identified a number of market trends which are likely to influence
the demand for new retail and commercial leisure floorspace across the plan
period:
Polarisation to higher-order centres: National comparison retailers are
increasingly rationalising their property portfolios with fewer large stores
concentrated in high-order centres shopping malls and regional centres.
Restructuring of the convenience goods sector: Since the economic
downturn major retailers have increased their network of small in-centre
stores and invested in online shopping while discount food operators such as
Aldi and Lidl have increased their market shares.
Growth of commercial leisure sector: Commercial leisure uses will
constitute a growing share of town centre floorspace driven in part by the
increase in household leisure expenditure and reduced demand for retail
space in secondary centres.
Effects of digital technology: Digital technologies facilitating online sales
have altered the ways in which retailers utilise physical floorspace and it is
likely that new technologies will impact on the retail sector in unpredictable
ways.
This report has also identified a number of quantitative forecasts which will inform
the assessment of need set out in Section 7:
Retail expenditure growth: Experian estimates a growth rate of 3.1% per
annum between 2016 and 2035 for comparison goods. Convenience
expenditure is expected to grow extremely modestly over the same period
(0.1% per annum).
Leisure expenditure growth: Experian forecasts growth rate at 1.4% per
annum between 2016 and 2035 for leisure.
Sales density growth: PBA assume a range of efficiency growth rates for
existing comparison floorspace from 1.5% to 2.5% per annum but no growth
for existing convenience floorspace.
Growth in e-commerce/m-commerce: Experian forecast that growth in non-
store retailing will outperform traditional retailing although only moderately
after mid-2020. Rapid growth forecast in the short term (2015-2019) will be
sustained by new technology, such as purchasing through mobile devices.
November 2017 19You can also read


