Youthreach SEN Initiative Research Study Report - Dr Mary Gordon NEPS - ETBI
←
→
Page content transcription
If your browser does not render page correctly, please read the page content below
Youthreach
 SEN Initiative
Research Study

    Report

         Dr Mary Gordon
                   NEPS
         November 2013
2
Page
Summary                                     4
  1. Background and rationale for study     5
  2. Research methodology                   8
  3. Research findings                     11
     3.1 Assessment of learner needs       11
     3.2 Inputs                            12
     3.3 Interventions and structures      15
     3.4 Impact on learners                21
  4. Discussion                            35

Bibliography                              36

Appendices
  A. WebWheel model                       38
  B. Participating centres                44
  C. Assessment of learner difficulties   46
  D. Comparison study survey form         50
  E. Mentor survey questionnaire          55

                                  3
The changes introduced since 2007 in 20 Youthreach centres as a result of the Special
Educational Needs Initiative (SENI) led to marked and significant benefits across a wide
range of learner outcomes. When compared with their counterparts in a matched group of
20 Non-SENI centres, SENI learners showed significantly greater rates of retention in the
programme, higher levels of formal accreditation, better progress in the acquisition of
personal and social competencies and more successful progression. On virtually every
measure examined in this research study the SENI centres outperformed the non-SENI
centres.
The SEN Initiative is an innovatory and cost-effective way of addressing SEN in an
educational setting. Using a broad definition of special needs, it results in organisational
change and the systematic building of centre capacity to respond flexibly and practically to
the unique situation of each individual learner. As well as promoting good quality teaching
in a secure, ordered environment, the SENI model crucially involves listening to the learner’s
voice and understanding their view of the world. It augments professional support services
with informal and non-formal approaches and provides additional training, guidance and
support to staff. Through its emphasis on the development of learners’ emotional and
social competencies, the Initiative successfully piloted ways of recording and measuring soft
skill outcomes along with more formal academic and vocational learning.
Initiative interventions – in particular, mentoring and inter-agency liaison – substantially
increased learners’ engagement in the Youthreach programme and their ability to address
barriers to participation and learning. Among the biggest differences found in this study
between the two groups of centres were the higher levels of SENI learners achieving success
in learning and accreditation, showing initiative and willingness to take responsibility for
tasks and being open to the world around them. SENI learners were more likely than their
non-SENI counterparts to demonstrate self-awareness and to manage negative feelings and
conflicts. More of them were willing to acknowledge their difficulties and to seek help when
they needed it. In enhancing their emotional resilience, mental wellbeing and social
capabilities, the Initiative also significantly increased learners’ capacity and readiness for
further training or work.
41.
1.1 Background to SEN Initiative
Early school leaving is associated with a wide range of adverse outcomes for individuals,
including low levels of literacy, poverty, social exclusion and marginalisation, unemployment
or insecure and/or poorly paid work, , alcohol and drug misuse, youth offending, lone
parenting and homelessness (DES, 2008; NESSE, 2010). The Youthreach programme is the
state’s principal response to early school leaving, offering a systematic second chance
opportunity for young people to re-engage in education, participate in vocational training
and acquire key life skills.
The Special Educational Needs Initiative (SENI) was set up by the Department of Education
in January 2007 to respond to the special needs of learners participating in the Youthreach
programme. It was established in twenty centres on a pilot basis and has continued in them
since that time. SEN is interpreted for the purposes of this initiative as representing any
factor which hinders a young person’s engagement in or ability to benefit from the
Youthreach programme. These factors may comprise within-learner disabilities and
difficulties, family and social circumstances or harmful early experiences.
A wide range of risk factors are considered to be characteristic of Youthreach learners
(Gordon, 2007). These include low achievements in basic skills; reduced motivation and
expectations; poor physical health and factors undermining mental health such as stress,
low self-esteem, depression and lack of emotional regulation; and practical difficulties which
impinge on learners’ participation in the programme, possibly deriving from home or
community challenges, homelessness, low income, substance misuse or engagement in
criminal activities. In addition, the incidence of disability in Youthreach is estimated to be
significantly higher than in mainstream schools, particularly in the areas of specific or mild
general learning difficulties (Smith, 2002) and emotional and behavioural difficulties
(Gordon, 2009).
1.2 Model of learner support used in SEN Initiative
New approaches or programmes that involve additional funding need to have a clear
evidence base to the approach they are taking (CES, 2012). The particular model of support
provided under the SEN Initiative was premised on psychological, developmental, systemic
and ecological social psychology principles – see Gordon (2009) for a full account of the
theoretical and research framework underpinning the approach. The two years that a
learner typically spends in a centre are seen as an opportunity for them to grow and mature
5through the formation of good quality relationships with adults and peers, through
engagement in structured educational and training activities, through having the chance to
identify their preferred career and life options for the future and through a combination of
formal and informal experiences that foster personal and social development.
A key focus of the programme is on the development of emotional and social competencies
as these have a very significant impact on both future employability and mental health:
“Good social, emotional and psychological health helps protect young people against
emotional and behavioural problems, violence and crime, teenage pregnancy and the
misuse of drugs and alcohol… It can also help them to learn and achieve academically, thus
affecting their long-term social and economic wellbeing” (NIHCE, 2009).
Under the SEN Initiative twenty centres received additional resources for the purposes of
implementing specific forms of support provision for their learners and building staff
capacity to respond effectively to learners’ needs. The resources were provided to each
centre in the form of a general allocation of additional monies. The level of resourcing was
determined by the assessment of learner needs (Gordon, 2007), comparable provision for
students with SEN in mainstream schools and identified principles of best practice in the
allocation of SEN resources (EADSNE, 2003). The precise amount allocated to each centre
was determined by its number of learner places. In a 25-place centre this additional
resourcing amounted to €38,500 per annum. €32,500 of this was assigned to staffing, with
€2000 earmarked for staff training and €4000 for professional case supervision and staff
support. The staffing input was to allow for the introduction, on a formal and timetabled
basis, of a mentoring provision known as the WebWheel model (see Appendix A), the
development of an individual action plan with each learner, the introduction of targeting
teaching and support interventions to take account of each learner’s identified needs and,
when appropriate, engagement in inter-agency working with local services.
Faithful implementation of the SEN Initiative model by centres (i.e. ‘programme integrity’)
was managed by the issuing of clear practice guidelines and planning and reporting
templates, by the provision of a specially designed programme of initial and follow-up
training for mentoring staff and by the monitoring of practice through detailed annual
reports from centres and regular site visits by the psychologist leading the initiative.
Despite this, one SENI centre discarded the SENI model for a brief period, altering the form
of support delivered to its learners to a more restricted and academically focused key
working intervention. This centre was not using the WebWheel model of mentoring during
the period examined in the study.
61.3 Previous evaluations
An external evaluation conducted in the early stages of the implementation of the initiative
found that the model being used accorded well with the international research literature’s
identification of good practice and compared favourably with other support systems in
place in Ireland for SEN, both in terms of its inclusive approach and value for money (Clarke,
Classon & Phillips, 2007). Clarke et al. (2007) recommended that the initiative be rolled out
nationally to all centres on a phased basis.
An internal report of the initial 18 month period of the pilot project concluded that the SEN
Initiative provided an appropriate, effective and inexpensive response to high incidence
special needs among Youthreach learners, including those associated with most emotional
and behavioural difficulties (Gordon, 2009). Now, over four years since its inception, it was
decided that the initiative was sufficiently ‘bedded down’ to allow for a more systematic
evaluation of its outcomes and, as recommended (e.g. CES, 2012), to consider the
organisational learning that has resulted.
72.
2.1 Form of the study
The research study contained two elements. The first consisted of a comparison between
the group of twenty SENI centres and a matched control group of twenty non-SENI centres.
The focus was on the total differences between the two groups with a view to seeing
whether there were any significant differences between them and, if there were, the
direction of these differences. Variation within each group was not examined.
The purpose of this research was to identify the differences between the two groups both in
their capacity to address their learners’ special needs and in the outcomes for learners that
resulted from the changes introduced. As the Youthreach programme itself was designed to
provide for the needs of early school leavers it must be acknowledged that staff in all
centres were aware of and responsive to their learners’ needs. It was the additional
capacity of the SENI centres to do this efficiently and effectively that was being examined in
this research.
The second part of the study looked at the central support intervention of mentoring. The
mentors were surveyed to gain an understanding of how mentoring was being organised in
their centres and to obtain their perception of its effectiveness on learners and its impact on
themselves as practitioners. The data collected under both parts of the study are integrated
in the findings section.
2.1.1 Logic model format
The logic model was used to structure both the Initiative and the research study. This
model provides a way of defining the key strategic elements in an initiative introduced for
the purpose of bringing about organisational or systemic change. The guidelines for the SEN
Initiative centres issued by the Department, along with the planning and reporting
templates, were designed to follow the stages of the logic model (see diagram below). It
was the annual reporting template that formed the survey instrument used in the
comparison study (this is reproduced in Appendix D). It is worth noting that the
coordinators in the SENI centres were used to filling this in at the end of each academic
year, while the survey was new to the coordinators in the non-SENI centres.
8Figure 1: Diagram of logic model
In the SEN Initiative the Problem Statement relates to the learners’ SEN as discussed above
and the Goal to the achievement of improved outcomes for the learners in terms of
enhanced personal and social capacity, including ability to cope with their difficulties. The
centres in the research were asked to identify learner difficulties which impacted on their
education and training, those acting against their personal and social development and
those relating to factors which created barriers to their participation in the programme. The
Rationales and Assumptions are based on the model of support being used in the SEN
Initiative and its theoretical framework (Gordon, 2009). The Resources in question are the
additional financial inputs provided to the SENI centres, as outlined above. These are
realised concretely in the SENI centres in the form of additional teaching hours and extra
provision for staff training and support. The purpose of the initiative is to put in place
particular tailored Activities or interventions to support learners and address their needs.
While these are prescribed for the SENI centres the non-SENI centres were also asked to
describe the specific activities they engaged in for the purposes of supporting their learners’
SEN. The Outputs for the most part refer to the structural arrangements made to facilitate
and back up learner support activities. The Outcomes are the changes in the learners that
result from the measures put in place to support them. While they were not specifically
explored in this study, External Factors impinge on the initiative in a range of ways,
including the progression opportunities available to learners when they leave the centre.
The following are the key areas examined in the study:
A. Learner needs (problem statement)
B. Inputs (resources)
C. Structures and interventions (activities and outputs)
D. Impact on learners (outcomes)
9The twenty SENI centres report annually on the implementation of the initiative in the
previous academic year using a report template based on this logic model. This same
template was used to collect the data for this research study, with the non-SENI
coordinators contributing their information on the basis of goodwill.
2.1.2 Matching the centres
The original twenty SENI centres were chosen to represent the broad spectrum of
Youthreach centre types across the country. The twenty non-SENI centres chosen to act as
research comparisons were picked to match these as closely as possible in the
characteristics of centre size and demographic location i.e. whether in a city or suburb, large
town, small town or village. The two groups of centres were successfully matched in terms
of these two variables (see Appendix B).
Centre size
Small: < 20
Medium: 20 – 30
Large: 31 – 50
Very large: > 50
Table 1: Matching by SENI centres Non-SENI centres
centre size
Small 2 2
Medium 8 9
Large 7 6
Very large 3 3
Total no. of places 710 706
Centre location demographic1
Village or small town: 75,000
Table 2: Matching by SENI centres Non-SENI centres
centre location
Village or small town 5 5
Mid-sized town 6 6
Large town 2 3
City 7 6
Total population 1,587,500 1,483,500
1
Population figures from Census Office, 2011
103. 3.1 Assessment of learner needs The SENI centres provided fuller answers to this question, producing over two and half times the response of their non-SENI counterparts. This may be because SENI centre coordinators were more experienced in carrying out this analysis and therefore more attuned to noticing their learners’ difficulties. In regard to the nature of the difficulties described however, there was no difference between the two groups of centres. The exact same issues were identified by both and these are summarised below, with the full list itemised in Appendix C. While it must be acknowledged that not all learners present with the problems outlined, the incidence of these problems is higher in Youthreach centres than in mainstream schools and sensitivity to them on the part of staff is a necessary prerequisite to carrying out a comprehensive assessment of learner needs. 3.1.1 Education and training Education and training difficulties were defined as those which impact on the academic and vocational training aspects of the programme and which tend to hinder the learners’ ability to make academic progress. Poor attainments in basic literacy, numeracy and IT skills were cited along with a broad range of learning problems, including dyslexia, dyspraxia, attention deficit disorders and speech and language difficulties. Disruptive and challenging behaviours also featured frequently, linked to a lack of engagement with or belief in the value of academic achievement. Negative previous experiences of school and a history of poor attendance were also considered to have had an impact on learner attainments, motivation and engagement. 3.1.2 Personal and social development Personal and social development problems were defined as being to do with emotional, social, mental or physical wellbeing issues and as usually arising as a result of individual experiences or circumstances. The kinds of social skill deficits listed included unawareness of social norms, poor communication skills, introversion and lack of empathy. Difficulties with bullying, with interacting with peers and with managing anger were mentioned frequently. Life skills concerning self-organisation and self-presentation also featured. Issues affecting the emotional wellbeing of learners included past or current experiences of bereavement and of physical or sexual abuse. Coordinators listed a broad range of mental health concerns – some very serious – including anxiety, depression, eating disorders, self-harming
and attempted suicide. For some learners, physical ill health was considered to be a
significant issue, either because of the presence of specific illnesses or medical conditions
(e.g. poor eyesight, miscarriage, diabetes, epilepsy) or a more generalised lack of health due
to insufficient nourishment during childhood, ongoing poor diet and lack of exercise.

    3.1.3 Barriers to participation and progress
Barriers to participation and progress were defined as factors relating to life outside the
centre which had the effect of creating barriers to good attendance and participation or to
successful learning and progression. Most coordinators referred to the learners’ home
situations as a significant factor. For some learners it was a case of their basic needs for
food and clothing not being met or of chaotic, unstable and volatile family circumstances.
Learners were frequently described as lacking guidance from their parents or experiences of
structure, routine and discipline. Education was generally described as not being highly
valued within the learners’ families or communities.

Other contextual factors included rural isolation and poor public transport, uncertainty in
living arrangements, homelessness and lone parenting. All coordinators referred to
learners’ lifestyle activities and, in particular, to substance misuse as a barrier to their
progress in the programme. Involvement in anti-social behaviour and criminal activities was
also cited, resulting in possible engagement with the probation services, court appearances
and risks of physical violence. A number of coordinators referred to the particular needs of
learners who were or had been in the care of the HSE. Finally, the current economic context
was mentioned as having an impact on learners’ belief in the value of learning and
certification for progression to employment.

         3.2 Inputs
The inputs being referred to in this study were the resources allocated to the SENI centres
as a result of the SEN Initiative. It should be noted that these were additional to the
resources available in the normal way to centres. All Youthreach centres have some, albeit
limited, access to capacity building through a staff training budget and to learner support
through a guidance, counselling and psychological services budget. The only difference
between the two groups of centres then was in relation to the SEN Initiative inputs.

         3.2.1 Learner places
As intended, the number of learner places between the two groups of centres was virtually
the same.

Table 3: Inputs by learner places   SENI centres        Non-SENI centres
No. of learner places in centres    710                 706

                                              12
3.2.2 Staff working in centres
There was, however, a significant difference between the two groups in the size of their
staff teams. This was due to the fact that the resources provided under the SEN Initiative
were primarily for the purpose of delivering additional supports to learners by members of
staff rather than, for example, by professional practitioners or services outside the centre.
Thus the main impact of the initiative was to increase overall staffing levels of both full time
and part time teachers by 22%.
Table 4: Inputs by staff SENI centres %ages Non-SENI centres %ages
No. of full time staff 95.5 126% 75.5 100%
No. of part-time staff 157 120% 131 100%
Total no. of staff members 252.5 122% 206.5 100%
3.2.3 Staff training
Increasing the capacity of centre staff teams to address the needs of their learners was a
further goal of the SEN Initiative and a portion (5%) of the SENI resource was therefore
allocated to staff training. The effect of this was to produce a small but consistent
difference in the amount of training taking place for whole teams, sub-groups and individual
members of staff in the SENI centres.
Table 5: Inputs by staff training In SENI Mean in In non- Mean in
centres SENI SENI non-SENI
centres centres centres
As a whole centre team 70 3.5 55 2.8
As a sub-group of staff 49 2.5 43 2.2
As an individual member on behalf of the centre 61 3.0 52 2.6
or for their own professional development
The mentors’ survey outlined the training inputs that they had received. Many received
more than one input and some had undertaken relevant training independently.
Table 6: Mentoring training inputs %age
in SENI centres
Introduction to the WebWheel model 81
Review of the model 45
Mentoring skills 51
Counselling training 33
Other 40
133.2.4 Staff support
Likewise, the provision of staff support was an essential part of the initiative, with 10% of
the budget being dedicated to two aspects of care for mentors: case supervision and
professional staff support. The purpose of case supervision is to ensure that staff with no
specific training in counselling or psychotherapy can engage safely in mentoring learners
who might have very serious or complex problems. It provides a protection for the learners
while creating an opportunity for mentors to increase their professional understanding and
expertise. Professional staff support takes account of the emotional toll on staff of working
as mentors, with the high level of personal engagement and commitment that this role
requires. The main function of this form of support is to help mentors to establish clear
boundaries around what is – and what is not – their responsibility, to be confident about
referring to and linking with other professional services and to deal with the impact of this
work on their own wellbeing
As would be expected, there was a significant difference between both groups of centres in
the amount of staff support sessions that took place over the course of the year, whether
for case supervision or professional staff support (or a mix of both in the one session) and
whether delivered on a group or one-to-one basis.
Table 7: Staff support inputs in SENI Mean no. %age of Mean no. of %age of
centres of sessions SENI sessions in non-SENI
in SENI centres non-SENI centres
centres receiving centres receiving
Group sessions for case supervision 5.5 70% 4.2 52%
One-to-one sessions for case supervision 8.4 60% 1.9 30%
Group sessions for staff support 2.8 50% 1.7 35%
One-to-one sessions for staff support 9.5 60% 1.2 20%
Group sessions for mix of supervision and 6.3 75% 5.2 35%
support
One-to-one sessions for mix of case 4.5 40% 0.1 10%
supervision and staff support
SENI centres were required to locate a fully qualified practitioner to provide their staff
support. The criteria for qualification have been defined as consisting of the following:
formal accreditation in psychotherapy or psychology, relevant professional practice,
experience of supervising others and membership of an appropriate professional body.
There is no requirement on non-SENI centres to organise staff support. Although the table
above indicates that staff support is available in a significant number of the non-SENI
centres the quality of that support might not be totally reliable since in only seven of those
centres did the practitioner meet the full qualification criteria.
14Table 8: Professional qualifications No. of Percentage No. of Percentage
input of practitioner providing staff SENI of SENI non-SENI of non-SENI
support in SENI centres centres centres centres centres
with receiving with receiving
Formally qualified as a psychologist or 20 100% 7 35%
psychotherapist
The mentors’ survey enquired into the mentors’ satisfaction levels with the supervision and
support they had received. While the majority were happy with it a small number were not
entirely satisfied.
Table 9: Satisfaction level of %age
staff support input in SENI
centres
Excellent 48
Satisfactory 38
Just adequate 10
Unsatisfactory 4
Totally inadequate 0
3.3 Interventions and structures
3.3.1 Core practices
The SEN Initiative required the SENI centres to provide regular timetabled mentoring
sessions to their learners, at which individual action plans would be drawn up. The purpose
of these plans was to outline the teaching and support interventions that would be provided
by the centre and, if indicated, any liaison with local services or agencies that would be
pursued to address particular needs. It was not expected, however, that the activities listed
were necessarily being provided in the non-SENI centres.
Coordinators were asked to indicate the number of their learners for whom the following
support practices were put in place: key working, mentoring, development of individual
action plans and inter-agency working. Both key working and mentoring are relationship-
based forms of support and require the assignment of a particular staff member to interact
regularly with the young person. In the survey form key working was defined as being to
increase the learners’ engagement with and participation in the programme of the centre
and as having its primary focus on learning and compliance with centre rules.
In mentoring the primary focus was defined as being on the learner’s needs or difficulties,
with the mentor attempting to understand the learner’s perspective and to help them with
personal or other difficulties that might be placing their general welfare at risk and
15interfering with their participation in the programme. The definition of mentoring used also
contained a frequency requirement – i.e. the sessions were at least once a fortnight – while
the definition of key working required that it only needed to happen once a term.
The development of individual learning plans is a normal feature of the work of centres and
considered a quality standard in the Youthreach quality assurance process (O’Brien, 2005 –
see http://www.youthreach.ie/qualityframework/). THE QFI expects that these plans will
be drawn up “in conjunction with” learners. Under the SEN Initiative, a separate individual
action plan is devised during the mentoring sessions. This specifies any actions that will be
taken by the learner and/or staff members to address the issues discussed in mentoring. An
individual action plan can be distinguished from an individual learning plan is that it is
defined as only containing items that the learner wishes to be there. In the study the
coordinators were asked about individual planning and not instructed to distinguish
between learning and action plans.
Likewise, the Quality Framework promotes good communication and liaison with relevant
organisations in the education, training, welfare, justice, health, youth and community
sectors. It is thus normal practice for centres to engage in inter-agency working.
3.3.2 One-to-one forms of support
In the SENI centres the vast majority of the learners received mentoring support rather than
key working. The small percentage of learners who were not allocated a mentor either
attended the centre that had briefly broken with the integrity of the programme or, in the
case of the other centres, had left before being allocated one. In some non-SENI centres
staff were described as acting as “mentors” in the sense that they supported learners,
usually a subset of the centre’s learners, in relation to their personal, as opposed to
academic, difficulties. However, the mentoring sessions they conducted were never
frequent enough to meet the criterion being applied in this study. The development of
individual plans was a feature of the practice in most of the non-SENI centres, with over two
thirds of their learners having plans.
16Table 10: Learner support measures No. of %age of No. of %age of
SENI SENI non-SENI non-SENI
learners learners learners learners
Assignment of a key worker 452 5% 415 42%
Assignment of a mentor 803 94% 583 6%
Provision of regular key working 45 5% 474 48%
sessions (at least one a term)
Provision of regular mentoring session 791 92% 04 0%
using the WebWheel process (at least
one a fortnight)
Development of an individual plan 834 97% 681 69%
for/with the learner
Engagement in inter-agency work on 570 67% 314 32%
behalf of the learner
Another difference between the SENI and non-SENI centres was in the proportion of staff
engaging in one-to-one work. In the SENI centres almost half of all staff members were
acting as mentors, compared to only 15% acting as key workers in the non-SENI centres.
Table 11: Staff engaging in one- No. of %age of SENI No. of %age of non-
to-one learner support SENI centre staff non-SENI SENI centre
measures teachers teachers staff
Acting as key workers 5 2% 32 15%
Acting as mentors 122 48% 10 5%
3.3.3 Organisation of mentoring in SENI centres
Mentors in the SENI centres were surveyed to gather additional information about the
mentoring provision. There was a 70% response rate from centres to the questionnaire
(see Appendix D), which covered the mentors’ role and experience in Youthreach, the
nature of their work contracts, the organisation of the mentoring in their centre, their
¹ In one SENI centre monthly key working sessions rather than mentoring was provided to learners in the
2011/12 year
3
In some non-SENI centres staff were described as acting as “mentors” in the sense that they supported
learners, usually a subset of the centre’s learners, in relation to their personal, as opposed to academic,
difficulties
³ In one non-SENI centre WebWheel mentoring was provided to all the learners but only four times over the
course of the year.
17assessment of its value for their mentees and their evaluation of the training and support they had received. They were also invited to describe any aspect of the mentoring that they found difficult and to suggest any changes that might make it easier. In general, mentors tended to be veterans of the programme, with the majority having over five years’ experience of working in Youthreach and as many as 44% with over ten years. Table 12: Youthreach %age experience of mentors in SENI centres > 10 44 6 – 10 28 1–5 26
The number of mentees varied considerably with a small number of mentors seeing over 12
learners per fortnight. The majority saw between 4 and 12, with nearly a quarter dealing
with only three or less.

Table 16: No. of mentee by        %age
mentors in SENI centres
> 12                                          6
8 – 12                                       27
4–7                                          44
non-SENI counterparts. The types of support interventions listed were similar for both
groups, with most of the centres citing the availability of individual counselling for learners.
Mentoring tended to feature only in the SENI responses. In all cases, the number of support
interventions listed by coordinators was significantly higher in the SENI centres. These
included career guidance and/or advocacy (from the FÁS-funded Advocacy service); specific
forms of counselling (e.g. addiction, bereavement, crisis, rape); various forms of therapy
(e.g. art, acupuncture); programmes to address particular areas of need (relating e.g. to
anger management, bullying and conflict resolution, sexuality, money management, self-
harm and suicide awareness, stress management, parenting, etc); and particular structural
interventions (e.g. the setting up of a learners’ council or a girls’ activity group, the provision
of a cooked breakfast, the organisation of an annual health or mental health promotion
week).

Interagency work with services outside the centre was a feature of many of the
interventions. These included the arrangement of medical appointments for doctor,
hospital, optician, dentist, sexual health clinic and psychiatric services; supporting learners
to engage with outreach addiction facilities, sexual health clinics, probation and welfare
services and housing agencies; liaison with family support and social services; engaging with
learners’ residential units and foster placements and supporting learners who are leaving
the care of the HSE to live independently. In some cases SENI centres provide a tracking and
support service to learners for the first twelve months after they leave the centre.

        3.3.5 Inter-agency working
While inter-agency working is clearly a feature of the work of all centres the difference in
practice between the two groups of centres in terms of the amount of liaison was striking.
The SENI centres related to over three times as many local services and agencies as the non-
SENI centres.

Table 17: No. of local services liaised with         By SENI     Mean for By non-        Mean for
                                                     centres     SENI     SENI           non-SENI
                                                                 centres  centres        centres
Number of local services and agencies with whom            487          24         143              7
centre staff liaised for information and advice
and/or with whom collaborative actions were put
in place for particular learners

The non-SENI centres liaised with local services in respect of one third of their learners while
the SENI centres liaised in respect of two thirds.

Table 18: Percentage of learners on whose            In SENI     %age        In non-     %age
behalf liaison took place                            centres                 SENI
                                                                             centres
Number of learners on whose behalf the centre        570         67%         314         32%
engaged in inter-agency work

                                                20
3.4 Impact on learners
3.4.1 Retention
A major and highly significant difference in outcome between the two groups relates to
retention. It is this single finding that underpins many of the other outcome differences
found in the study. The number of learners who did not complete the full academic year is
indicated by the number of learners attending over the number of places. As is evident
from the figures in the table below, the retention rate in the non-SENI centres was
considerably lower than in the SENI centres, with almost double the turnover rate.
All the outcome measures described in this section are in terms of percentages, i.e. based
on the numbers achieving each outcome as a function of the total number of learners
attending the centre at any point during the year. The greater number of learners attending
the non-SENI centres had the effect of reducing the proportions achieving each outcome
relative to the SENI centres.
Table 19: Learners SENI centres %ages Non-SENI centres %ages
attending over no. of
learner places
No. of learner places in 710 100% 706 100%
centres
No. of learners who attended 857 121% 989 140%
for any part of the year
3.4.2 Certification outcomes
The learners in the SENI centres achieved a significantly higher level of accreditation than
their peers in the non-SENI centres. While it may not be useful to treat all certification as
summarisable in this way because of the wide range of levels involved, it is possible to
compare accreditation outcomes across the two groups of centres.
In table 20 below both actual learner numbers and the percentage of learners achieving
accreditation in the centres are given. In the case of the Leaving Cert Applied (when both
years of the programme are counted) the differences in absolute numbers between the
groups was relatively small and the non-SENI centres achieved more major awards at FETAC
level 5. This suggests that more able learners may not need the supports provided by the
SEN Initiative to achieve certification. In general however the SENI centres did better than
the non-SENI centres, not just in percentage terms but in absolute values.
21Table 20: Learner formal SENI learners Non-SENI learners
accreditation outcomes
No. of learners %age of No. of %age of
learners learners learners
Junior Cert (partial/Year 1) 1 0.1% 2 0.2%
Junior Cert (full) 23 2.7% 11 1.1%
Leaving Cert Applied (partial/Year 1) 53 6.2% 8 0.8%
Leaving Cert Applied (full) 51 6.0% 90 9.1%
General Leaving Cert (partial/Year 1) 12 1.4%
General Leaving Cert (full) 23 2.7% 19 1.9%
FETAC Major award Minor award Major award Minor award
No. %age No. %age No. %age No. %age
FETAC level 1
FETAC level 2 18 2.1% 15 1.5%
FETAC level 3 75 8.8% 185 21.6% 31 3.1% 195 19.7%
FETAC level 4 76 8.9% 159 18.6% 59 6.0% 114 11.5%
FETAC level 5 49 5.7% 15 1.5% 9 0.9%
Achieving any kind of formal 725 84.6% 568 57.4%
certification
Coordinators were also asked to indicate any other forms of certification achieved by their
learners. The SENI centres ran a broader range of additional accredited short courses than
their counterparts.
Table 21: Learner informal SENI learners Non-SENI learners
accreditation outcomes
No. of %age of No. of %age of
learners learners learners learners
ECDL (full) 13 1.5% 19 1.9%
FIT 70 8.2%
Gaisce 21 2.5% 9 0.9%
Safe Pass 8 0.9%
Safe Food Award 2 0.2%
First Aid Cert 22 2.2%
Manual Handling 20 2.3%
Travel and Tourism 5 0.6%
First Impressions (employability skills) 7 0.8%
En Vision 5 0.6%
Heart and Soul 25 2.9%
Introduction to Coaching Soccer 12 1.2%
Boxing Certs 7 0.8%
Benefit 3 0.3%
223.4.3 Competency outcomes
For this section, centres were asked to identify the number of learners who had made
significant progress in a range of competency areas by acquiring new or increased abilities
and skills or by showing increased levels of effectiveness. The competencies involved
represent a core part of the work of centres. They are frequently less easy to measure than
hard outcomes such as certification but are no less relevant for that.
The information sought was the number of individuals making satisfactory improvement
over the course of the year in key competencies associated with emotional maturation,
personal and social skills development and employability. In order to assess this progress,
coordinators were required to make use of a range of methodologies, including direct
evidence from certificate exams and other formal tests, from portfolios of work done and
objects made and from actions, behaviours and performances observed by the staff. In
addition, information could be obtained from consultation with the learners themselves and
from consultation with others such as peers, parents and employers. Frequently the
assessment was based on the evaluative judgements of staff, considering each learner in
turn against the items listed under the competency headings. Staff were asked to decide on
whether the improvement in question was sufficient to constitute significant progress.
What the staff considered to be significant required a judgement call on their part. To make
these judgements less subjective, coordinators were advised to discuss with their staff
teams what they would define as the standard of significant progress for each item and to
consult with as many members of the staff team as possible before arriving at a decision on
the areas of significant improvement made by each learner.
The competencies considered for this section are mostly soft rather than hard and often
involve a combination of skills and attitudes. They relate to academic learning (i., iii.), to
vocational training (iii., iv.), to practical life and employability skills (i., ii., iv., v., vi.), to socio-
emotional development and the enhancement of factors promoting mental health (vi., vii.,
viii).
3.4.3.1 The development of basic skills
By basic skills is meant the communication skills of oral language, literacy, numeracy and IT.
Basic skills are necessary for educational progression but also constitute important life skills
for living effectively in society. The greatest difference found between the two groups was
in relation to the acquisition of literacy and numeracy skills.
23Table 22: Basic skill outcomes SENI Non-
SENI
1. Acquired literacy and numeracy skills 77% 34%
2. Acquired information and communication technology skills 83% 60%
3. Were effective in the use of oral communication skills 76% 46%
4. Were able to apply processing skills when studying (e.g. 62% 37%
attention, memory)
100%
80%
60%
SENI
40%
Non-SENI
20%
0%
1 2 3 4
Figure 2: Graph of basic skill outcomes
3.4.3.2 The development of life skills
Life skills consist of the kind of practical knowledge and competencies that are needed to
live effectively in Ireland in the 21st century. Practical knowledge and skills in relation to
accessing public facilities and services might include sourcing information, filling in forms
and opening a bank account. Presenting appropriately refers to issues of practical
competence, reliability and appearance. Engagement in the world would be demonstrated,
for example, by participating in community events and travelling outside the locality.
Budgeting, planning and saving are involved in the effective management of money and
being at ease eating in public refers to being comfortable eating in the presence of others
and having the table skills to be relaxed eating in a restaurant. The biggest difference found
between the two groups related to the increased willingness of the SENI learners to engage
with the wider world.
24Table 23: Life skill outcomes SENI Non-
SENI
1. Showed practical knowledge and skills in relation to accessing public 69% 50%
facilities and services (e.g. sourcing information, filling in forms)
2. Presented appropriately (e.g. in terms of practical competence, reliability, 64% 43%
appearance, etc)
3. Showed knowledge and understanding of the world outside the locality 60% 31%
4. Engaged in the world (e.g. participating in community events, travelling 58% 31%
outside the locality)
5. Managed money effectively (e.g. budgeting, planning, saving) 47% 33%
6. Were at ease eating in public (both inside and outside the centre) 73% 62%
7. Were able to play and have fun with others (e.g. joke, tease, enjoy 80% 63%
recreational activities)
80%
70%
60%
50%
40% SENI
30%
Non-SENI
20%
10%
0%
1 2 3 4 5 6 7
Figure 3: Graph of life skill outcomes
3.4.3.3 The acquisition of formal accreditation in academic and vocational
subjects
Formal accreditation refers specifically to FETAC, Junior Cert and Leaving Cert and Leaving
Cert Applied. This section also looks at learners’ attitudes to formal academic learning. It
was these attitudes that showed the greatest difference between the two groups.
Table 24: Learning outcomes SENI Non-
SENI
1. Achieved accreditation in formal study areas whether academic or 68% 54%
vocational
2. Showed motivation to learn and made real progress in understanding 71% 28%
and study skills
3. Showed academic ambition and an interest in progressing to further 61% 25%
education or training after they leave the centre
25100%
90%
80%
70%
60%
50% SENI
40% Non-SENI
30%
20%
10%
0%
1 2 3
Figure 4: Graph of learning outcomes
3.4.3.4 The acquisition of vocational skills
While vocational learning is formally accredited through FETAC and state exams, the focus
of this section is on the actual acquisition of vocationally-related skills, whether accredited
or not.
Table 25: Vocational skill outcomes SENI Non-
SENI
1. Gained practical skills in useful but non-formal vocational skill areas 72% 63%
2. Achieved non-formal or informal accreditation in:
a. Driving, safe pass, computer skills, First Aid, etc 55% 36%
b. Music, sound technology, drama, performance, etc 52% 41%
c. Art, design, photography, film, graphics, etc 30% 18%
d. Gaisce, Failte Ireland, Enterprise, etc 19% 9%
e. Sports, fitness, outdoor pursuits, etc 73% 55%
f. SPHE, sexual health, life skills, Copping On, etc 73% 59%
g. Other (Drugs Programme) 20% 7%
3. Gained practical skills in vocational subjects 77% 48%
26100%
80%
60%
SENI
40% Non-SENI
20%
0%
1 2a 2b 2c 2d 2e 2f 2g
Figure 4: Graph of vocational skill outcomes
3.4.3.5 Development of effectiveness in work and learning settings (e.g. study
skills, time management, working with people)
Effectiveness in work and learning settings requires a range of soft skills, such as study skills,
time management and ability to work collaboratively. A career path plan can be in relation
to work, further education or family life. The SENI learners were considered to have more
of these soft employability skills, and particularly to show more willingness to take
responsibility for tasks and work on their own initiative and to cope effectively with complex
situations.
Table 26: Effectiveness in work and learning settings outcomes SENI Non-
SENI
1. Behaved appropriately in context 74% 50%
2. Participated in and engaged with learning experiences 81% 58%
3. Successfully completed work experience placement(s) 60% 48%
4. Developed a personal career path plan (e.g. in relation to 67% 42%
work, further education or family life)
5. Showed a willingness to take responsibility for tasks 69% 40%
6. Were able to work on their own initiative 64% 33%
7. Were able to work as part of a team 73% 49%
8. Were able to cope with complex situations and make 63% 25%
reasonable judgements in them
27100%
90%
80%
70%
60%
50% SENI
40% Non-SENI
30%
20%
10%
0%
1 2 3 4 5 6 7 8
Figure 5: Graph of effectiveness in work and learning setting outcomes
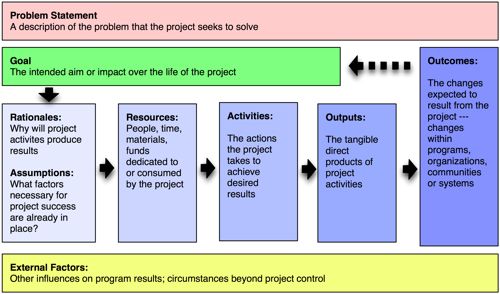
3.4.3.6 Socio-emotional development (i.e. ability to manage emotions and
relationships)
This section deals with awareness of emotions, ability to deal with them effectively,
sensitivity to others and ability to manage relationships. The greatest differences found
were in the ability to manage negative feelings, self-awareness and effectiveness in dealing
with conflict.
Table 27: Socio-emotional development outcomes SENI Non-
SENI
1. Were able to manage negative feelings and express them 77% 28%
appropriately
2. Showed self-regulation 58% 33%
3. Showed self-awareness 67% 31%
4. Showed skill at interacting with others 71% 46%
5. Showed understanding and consideration for others 65% 38%
6. Were assertive and confident when dealing with conflict and 53% 20%
showed a willingness to employ problem-solving approaches
28100%
80%
60%
SENI
40% Non-SENI
20%
0%
1 2 3 4 5 6
Figure 6: Graph of socio-emotional development outcomes
3.4.3.7 Resilience and mental health (including confidence and self-esteem)
This section is about ability to cope with one’s life and to be able to be reasonably happy
and confident. The biggest difference between the two groups related to openness to new
experiences, which accords with the previous finding of SENI learners being more willing to
engage in the world.
Table 28: Resilience and mental health outcomes SENI Non-
SENI
1. Showed happiness or contentment 63% 41%
2. Showed self-esteem and confidence 60% 40%
3. Were able to cope with their circumstances 65% 47%
4. Were open to new experiences 73% 40%
100%
80%
60%
40% SENI
20% Non-SENI
0%
1 2 3 4
Figure 7: Graph of resilience and mental health outcomes
293.4.3.8 Ability to acknowledge difficulties and to seek out and benefit from
available support services within and outside the centre
When life is not going well for a learner can they recognise what their problems are and act
to try to resolve them? Acknowledging difficulties may well mean an increase in the
reporting by learners of serious difficulties (including suicidal thoughts, risk-taking activities,
self-harming behaviours, drug and alcohol misuse, involvement in abusive relationships).
However, acknowledging difficulties is also the first step to taking action to deal with them.
This is central to the promotion of resilience and mental health. The mentoring sessions
provided SENI learners with the experience of receiving both practical and emotional
support and this in turn led to their greater willingness to recognise what was not going well
for them, to see alternative possibilities and to act to pursue improvements in their
situations.
Table 29: Ability to acknowledge difficulties and seek support SENI Non-
outcomes SENI
1. Were able to acknowledge their difficulties to themselves 72% 31%
2. Were aware of available supports inside and outside the centre 82% 56%
3. Were willing to accept suitable help when it was offered 72% 37%
4. Were pro-active about seeking support when they felt they needed 59% 19%
it
100%
80%
60%
SENI
40% Non-SENI
20%
0%
1 2 3 4
Figure 8: Graph of ability to acknowledge difficulties and seek support outcomes
303.4.3.9 Benefit from participation in the Youthreach programme
It is interesting to see that both groups of coordinators believed that the vast majority of
their learners benefitted from their participation in the Youthreach programme in their
centre. The difference between the two groups is not significant.
Table 30: Percentage of learners considered to have SENI mean Non-SENI
benefited from participation in Youthreach programme percentage mean
percentage
1. Benefited significantly from their participation in the 85% 83%
Youthreach programme
2. Did not benefit to any significant extent from their 10% 12%
participation
100%
80%
60%
SENI
40%
Non-SENI
20%
0%
1 2
Figure 9: Graph of learners considered to have benefited from participation in
Youthreach programme
In the mentor survey, the majority of respondents considered the mentoring to be
extremely beneficial to their mentees, with 17% seeing it as somewhat beneficial and 4%
indicating that the mentoring had not been beneficial in the case of a small minority of their
learners.
Table 31: Learners considered to have %age
benefited from mentoring in SENI centres
Extremely 83
Somewhat 17
Not very 1
5
Waste of time 3
5
Specifically in the case of particular learners, while judged to extremely or somewhat beneficial to others
313.4.4 Progression outcomes
Having identified the total number of learners who had attended the centre for any part of
the academic year, even if they had not engaged fully with the programme and/or left after
just a few weeks, coordinators were asked to identify their current location or situation
within six months of the end of the year in question. These were the outcomes that were
most affected by external factors. Clearly since the Initiative was introduced in January
2007 the economy has declined substantially, greatly reducing the opportunities for learners
to obtain employment and increasing the competition for places in further education
colleges and on vocational training courses. Analysis of the differences on this measure
indicated that much of the variation between the two groups of centres was not statistically
significant. The biggest differences found were in the greater number of non-SENI learners
reported to have completed the Youthreach programme but not yet progressed to further
education, training or employment (at the 0.05 statistical level of significance) and the
greater number of non-SENI learners choosing to leave without completing the programme
(at the 0.10 significance level).
Table 32: Progression outcomes for No. of %age of No. of %age of
learners attending for any part of the 12 SENI SENI non- non-SENI
month period learners total of SENI total of
857 learners 989
Returned after the summer 480 56% 443 45%
Progressed successfully to further training 131 15% 111 11%
Progressed successfully to employment 41 5% 57 6%
Completed the programme but have not 56 7% 130 13%
yet progressed to further training or
employment
Left the centre for a practical reason like 61 7% 68 7%
moving away, having a baby, going to
prison
Dropped out of the centre by their own 63 7% 136 14%
choice
Left as a result of being asked to leave by 45 5% 32 3%
the board of management / VEC
32100%
90%
80%
70%
60%
50% SENI
40% Non-SENI
30%
20%
10%
0%
1 2 3 4 5 6 7
Figure 10: Graph of estimate of benefit to learners of mentoring in SENI centres
334.
The differences found in this study between the two groups of centres are significant and
comprehensive. The resourcing and programmatic changes introduced as a result of the
SENI Initiative led to distinctive differences in the interventions and supports that were
made available to learners and to the capacity-building activities engaged in by the staff.
These outputs and activities were consistent with the recommendations in the literature on
good practice in vocational education and training for learners with special educational
needs (EADSNE, 2013). They also accorded fully with the premise that secondary education
(defined broadly so as to include centres of education) has a clear role to play in the
development of emotional and social competencies (NIHCLE, 2009) and the promotion of
mental health and wellbeing (Barry & Jenkins, 2007; Weare and Gray, 2003).
Specifically, the SEN Initiative utilised mentoring as its principal mechanism of learner
support. This has been identified as a key factor in programmes that are effective in
preventing early school leaving (NESSE, 2010) and in increasing disaffected young people’s
involvement in education, training and work (Newburn & Shiner, 2006). Research into the
strategies that can be shown empirically to lift engagement and completion rates for at-risk
students has identified mentoring and the coordination of welfare needs as effective
targeted interventions when underpinned by an institution-wide commitment to a
supportive culture and the use of what the researchers termed ‘familial-based contexts’ –
i.e. small scale institutions such as mini-schools or centres (Lamb & Rice, 2008).
Another key factor that is strongly recommended in the literature is the building of staff
capacity and the addressing of teachers’ own emotional and social needs (e.g. Weare &
Gray, 2003). These were addressed in the SEN Initiative through the inservice and staff
support elements. In their survey the mentors indicated that they valued the training they
had received and would welcome more on specific aspects of the role. They also found the
professional support and supervision important. While some were satisfied with the level
and form of support they received, others wrote that they would like to have more access to
a supervisor and more opportunities to share their practice with mentors in other centres.
For much of its data set, the comparative study relied on the professional judgements of
centre coordinators and tutors about the gains made by learners. A factor in the differences
found may be due to the greater experience that staff in the SENI centres had relative to
their non-SENI peers of monitoring and reporting on learner outcomes. The SENI
coordinators were more familiar with the information being sought in the survey because
they provided an outline of their own practice and their learner outcome details on an
annual basis. This, along with the mentoring itself, meant that they observed their learners
34more closely, were more aware of their difficulties and more involved in both supporting
and measuring the progress made by them over time.
The main finding of this research study was that the interventions introduced as a result of
the SEN Initiative led to marked and significant differences in learner outcomes across every
element of the Youthreach programme.
A major factor in the substantial differences in learner outcomes between the SENI centres
and non-SENI centres resulted from the significantly greater retention of learners in the
SENI centres. This was evidenced by the smaller throughput over the course of the
academic year, with the non-SENI centres having almost twice the number of learners failing
to stay. The higher percentage of learners in the SENI centres achieving accreditation and a
wide range of personal and social competencies was thus in large part due to their more
successful retention in the programme.
The Youthreach programme is regularly evaluated through internal quality assurance
processes (O’Brien, 2005b) and external inspections (DES, 2010) and was designated an
efficient and effective programme under a recent value for money appraisal (DES, 2008). It
is well-regarded internationally (e.g. European Commission, 2010, 2011; CEDEFOP, 2010,
2011; OECD/CERI, 2000; Nevala & Hawley, 2011). Thus completing the programme in itself
leads to a wide range of benefits for the early school leaver and increases their chances of
progressing successfully to further education, training or employment.
The interventions made possible by the Initiative – in particular, the mentoring and inter-
agency liaison – increased the learners’ engagement with the programme and their ability
to address barriers to their participation and learning. The greatest differences between
the SENI and non-SENI learners in terms of personal and social competency outcomes were
found to be in the areas of engagement with learning and accreditation, initiative and
willingness to take responsibility for tasks, self-awareness and ability to manage negative
feelings and conflict, openness to the world around them and willingness to acknowledge
difficulties and seek help. These competencies represent core employability skills as well as
being indicative of greater levels of social capability and of mental wellbeing and resilience.
35You can also read