The Benefits and Costs of the Clean Air Act from 1990 to 2020
←
→
Page content transcription
If your browser does not render page correctly, please read the page content below

The Benefits and Costs of the
Clean Air Act from 1990 to 2020

     U.S. Environmental Protection Agency
     Office of Air and Radiation
     March 2011

        S U M M A R Y              R E P O R T
The Benefits and Costs of the Clean Air Act from 1990 to 2020: Summary Report

Acknowledgements

The study was led by staff from the US Environmental Protection Agency Office of Air and Radiation, with support
provided, under contract to EPA, by the organizations participating on the Study Team.

The full integrated report and this summary report were reviewed by the EPA Science Advisory Board’s Advisory
Council on Clean Air Compliance Analysis (hereafter the Council) and its three technical subcommittees. The
individual detailed reports that focus on each of the key analytical components of the overall study were also
reviewed by the Council and/or one or more relevant subcommittees.

The study was greatly improved by the ideas and expertise of the individuals and firms participating on the Study
Team, and by the rigorous and thoughtful expert review by the external review panels. However, responsibility for
the study’s results, the analytical decisions leading to those results, the interpretations reported herein, and the
recommendations made for future efforts, rests with the Environmental Protection Agency.

Study Team                                                      Study Review Panels
US EPA Office of Air and Radiation                              Advisory Council on Clean Air Compliance Analysis
Industrial Economics, Incorporated                              Air Quality Modeling Subcommittee
E.H. Pechan & Associates                                        Health Effects Subcommittee
ICF International                                               Ecological Effects Subcommittee
Research Triangle Institute
Stratus Consulting
Sonoma Technologies

For further information

This document is an abridged version of a longer report which evaluates the benefits and costs of programs
implemented pursuant to the 1990 Clean Air Act Amendments. The longer report in turn summarizes and
integrates a series of technical reports documenting particular analytical tasks, such as estimation of compliance
cost and projection of air quality changes. Data presented in this summary report are documented in the full
integrated report and/or the supporting technical analyses.

Electronic copies of this summary report, the full integrated report, and all publicly available supporting technical
documents can be downloaded at: http://www.epa.gov/oar/sect812/prospective2.html

Paper copies of this summary report can be obtained by submitting a request indicating the number of copies
required to: CAAA.Benefit‐Cost‐Study@epa.gov

For information about the technical aspects of the study, contact Jim DeMocker, Senior Policy Analyst, Office of Air
and Radiation, US EPA at democker.jim@epa.gov

For information about the peer review of the study, contact Stephanie Sanzone, Designated Federal Official for the
Council at sanzone.stephanie@epa.gov

                                                                                                  1
The Benefits and Costs of the Clean Air Act from 1990 to 2020: Summary Report
Summary of Findings and Recommendations
Findings
This study evaluates the benefits and costs of programs implemented pursuant to the 1990
Clean Air Act Amendments, relative to a hypothetical baseline which assumes control programs
established under the 1970 Clean Air Act and 1977 Amendments stayed fixed at their 1990 levels of
scope and stringency. The study applies the framework and principles of benefit‐cost analysis to
estimate significant beneficial and costly effects of these programs, express these effects where feasible
and appropriate in dollar value terms to
facilitate comparison of disparate effects, and $2,000
Billions
then calculate the overall net economic
benefits (benefits minus costs) of the changes $1,800
in Clean Air Act‐related programs resulting
from the 1990 Amendments. $1,600
Based on the scenarios analyzed in this $1,400
study, the costs of public and private
efforts to meet 1990 Clean Air Act $1,200
Amendment requirements rise
throughout the 1990 to 2020 period of $1,000
the study, and are expected to reach an
annual value of about $65 billion by $800
2020.1
$600
Though costly, these efforts are
$400
projected to yield substantial air quality
improvements which lead to significant
$200
reductions in air pollution‐related
premature death and illness, improved
$0
economic welfare of Americans, and
2000 2010 2020
better environmental conditions. The
economic value of these improvements is
Costs Benefits
estimated to reach almost $2 trillion for
the year 2020, a value which vastly
Exhibit 1. Primary Central Estimates of direct benefits and
exceeds the cost of efforts to comply direct costs for the 2000, 2010, and 2020 study target years.
with the requirements of the 1990 (In billions of 2006 dollars). The graph shows the extent to
Clean Air Act Amendments. which benefits exceed costs throughout the study period.
1
Because of inflation, the value of a US dollar varies from year to year. In this study, dollars are defined according
to the value they held in the year 2006.
2
The Benefits and Costs of the Clean Air Act from 1990 to 2020: Summary Report
The extent to which estimated benefits exceed estimated costs and an in‐depth analysis of
uncertainties indicate that it is extremely unlikely the costs of 1990 Clean Air Act Amendment
programs would exceed their benefits under any reasonable combination of alternative
assumptions or methods identified during this study. Even if one were to adopt the extreme
assumption that air pollution has no effect on premature mortality –or that avoiding such effects
has no value—the benefits of reduced non‐fatal health effects and visibility improvements alone are
more than twice the total cost of compliance with 1990 Clean Air Act Amendment requirements.
Economy‐wide modeling was also conducted to estimate the effect of the 1990 Amendments on
overall U.S. economic growth and the economic welfare of American households. When some of
the beneficial economic effects of clean air programs were incorporated along with the costs of
these programs, economy‐wide modeling projected net overall improvements in economic growth
and welfare. These improvements are projected to occur because cleaner air leads to better health
and productivity for American workers as well as savings on medical expenses for air pollution‐
related health problems. The beneficial economic effects of these two improvements more than
offset the costly effects across the economy of expenditures for pollution control.
The most significant known human health effects from exposure to air pollution are associated
with exposures to fine particles2 and ground‐level ozone pollution. Many of these effects could be
quantified for this study; but other health effects of fine particles and ozone, health effects
associated with other air pollutants, and most air pollution‐related environmental effects could be
quantified only partially, if at all. Future improvements in the scientific and economic information
needed to quantify these effects would be expected to further increase the estimated benefits of
clean air programs.
2
Particle pollution, also known as "particulate matter" or PM, is a term used to describe a broad class of extremely
small solid particles and liquid droplets suspended in the air. Particle pollution can include one or more different
chemical components, including acids (such as nitrates and sulfates), organic chemicals, metals, and soil or dust
particles. The size of particles has been linked to their potential for causing health problems since it is easier for
smaller particles to bypass protective mechanisms in the nose and throat and enter deeply into the lungs. The
number which sometimes follows the term PM refers to the aerodynamic diameter of particles expressed in units
of microns (millionths of a meter); so PM2.5, for example, refers to a mixture of aerosol particles which are less
than or equal to 2.5 microns. EPA classifies particle pollution into two main categories: (1) "inhalable coarse
particles" such as those often seen near roadways and dusty industrial activities, which are larger than 2.5 microns
but smaller than 10 microns, and (2) "fine particles" such as those found in smoke and haze, which are 2.5 microns
and smaller. The terms PM2.5 and "fine particles" therefore refer to the same fraction of particle pollution.
3
The Benefits and Costs of the Clean Air Act from 1990 to 2020: Summary Report
Recommendations
The findings of this study have potentially significant implications for policy, programs, and
research related to air pollution in the U.S. The recommendations presented below focus on research
needs and the expansion and refinement of future studies.
Clean Air Act programs address a wide variety of air pollutants beyond the fine particle and
ozone pollution which emerged as the primary focus of this study’s quantitative results. The
data and modeling tools needed to estimate the health and environmental consequences of
these other pollutants, however, are limited. There is an ongoing need for investment in
research to improve the coverage of potentially important effects in benefit‐cost studies of air
pollution control programs. Additional research is also needed to reduce uncertainties in the
estimates of effects already incorporated in benefit‐cost studies, especially relatively significant
effects such as those associated with fine particle‐ and ozone‐related premature mortality and
the economic value of avoiding those outcomes.
Programs to reduce key Clean Air Act pollutants through national ambient concentration
standards such as those for fine particles and ozone, programs to address air pollutants with
more localized affects such as toxic compounds and heavy metals, and programs and policies
which reduce emissions of greenhouse gases may impose various requirements on a given
source of emissions. Future air pollution program assessments would be more useful to
policymakers and the public if they were designed to provide insights on the combined effects
of programs to address these different categories of air pollution.
Typical macroeconomic modeling tools and practices tend to focus on assessment of effects
across the economy of compliance expenditures while ignoring the economy‐wide benefits of
cleaner air. Consideration should be given to improving macroeconomic modeling of major
environmental programs so their benefits as well as their costs are reflected in projections of
how these programs affect the overall economy and the economic welfare of American
households.
4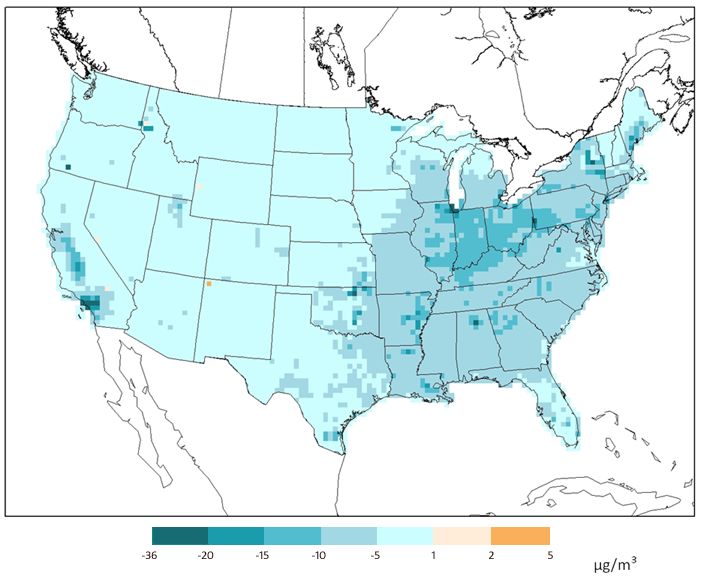
The Benefits and Costs of the Clean Air Act from 1990 to 2020: Summary Report

About this Report

This report is the third in a series of EPA studies        CLEAN AIR ACT SEC. 312. ECONOMIC IMPACT
which estimate and compare the benefits and                ANALYSES (as amended, in part):
costs of the Clean Air Act and related programs.           (a) The Administrator…shall conduct a comprehensive
                                                           analysis of the impact of this Act on the public health,
                                                           economy, and environment of the United States…
The first report was called the Retrospective
                                                           (b) In describing the benefits of a standard described
Study, and was published in 1997. This first
                                                           in subsection (a), the Administrator shall consider all of
study estimated the benefits and costs through             the economic, public health, and environmental
1990 of programs implemented pursuant to the               benefits of efforts to comply with such standard…
1970 Clean Air Act and the 1977 Amendments,                The Administrator shall assess how benefits are
and included an analysis of the benefits and               measured in order to assure that damage to human
costs of phasing out leaded gasoline.                      health and the environment is more accurately
                                                           measured and taken into account…
The second report was called the First                     (c) [T]he Administrator shall consider the effects…on
                                                           employment, productivity, cost of living, economic
Prospective Study. Published in 1999, it
                                                           growth, and the overall economy of the United States.
evaluated the incremental benefits and costs of
                                                           (e) [T]he Administrator…shall appoint an Advisory
the 1990 Clean Air Act Amendments and
                                                           Council on Clean Air Compliance Analysis
associated programs through the year 2010,                 of…recognized experts in the fields of the health and
relative to controls in place as of 1990. In               environmental effects of air pollution, economic
addition to evaluating the effects on human                analysis, environmental sciences, and such other fields
health, the economy, and the environment of                that the Administrator determines to be appropriate.
Titles I through V of the Amendments,3 the First           (g) The Council shall‐
Prospective Study analyzed the benefits and                     (1) review the data to be used for any analysis
costs of phasing out stratospheric ozone                   required under this section and make
                                                           recommendations to the Administrator on the use of
depleting chemicals such as chlorofluorocarbons
                                                           such data;
(CFCs) under Title VI.
                                                                (2) review the methodology used to analyze such
                                                           data and make recommendations to the
The current report is called the Second                    Administrator on the use of such methodology; and
Prospective Study. This new study updates and                   (3) prior to the issuance of a report…review the
expands the First Prospective Study by using               findings of such report, and make recommendations
new and better data and modeling tools. The                to the Administrator concerning the validity and utility
new study also looks further out into the future           of such findings.
by evaluating the costs and benefits of 1990
Clean Air Act Amendment programs through the              Exhibit 2. Clean Air Act Section 312 statutory language
                                                          (abridged) as amended by Section 812 of the 1990
year 2020.                                                Amendments. The text of the law defines Congress’
                                                          direction to EPA regarding the scope and review of these
                                                          studies.
3
 The Clean Air Act is comprised of a number of statutory titles. Title I requires attainment of national air quality
standards for designated pollutants such as ozone, Title II focuses on mobile source control programs, Title III
addresses hazardous air pollutants, Title IV establishes programs to address acid deposition and related effects,
Title V establishes permitting requirements, and Title VI focuses on protection of the stratospheric ozone layer.

                                                                                                  5
The Benefits and Costs of the Clean Air Act from 1990 to 2020: Summary Report

The Second Prospective Study focuses on evaluating the significant changes made over the last decade
in the implementation of Titles I through IV. Readers interested in benefit and cost information related
to Title V (permits) and Title VI (stratospheric ozone protection) are referred to the First Prospective
Study and subsequent EPA Regulatory Impact Analyses.

The effects of the 1990 Clean Air Act Amendments estimated herein reflect actions and partnerships
across multiple levels of government, private organizations, households, and individuals. This combined
effort involves federal standard setting and implementation, state and local programs to meet federal
standards, and expenditures by private entities to achieve the requisite emissions reductions.

Goals and Objectives of the Study

During the legislative efforts leading up to enactment of the 1990 Clean Air Act Amendments, members
of Congress working on the Act’s reauthorization made it clear they wanted more and better
information from EPA about the economic, health, and environmental effects of air pollution control
programs. To ensure this improved information was available to support future policymaking, Congress
added statutory language which required EPA to conduct periodic studies to evaluate the benefits and
costs of the Clean Air Act itself. Enhanced credibility and continual improvement in data and methods
were promoted by requiring that the design, implementation, and results of each study would be
reviewed by a multidisciplinary panel of outside experts.

To meet Congress’ goals for the third study in this series of Clean Air Act benefit‐cost analyses, EPA
defined a central objective and three supplementary objectives. Consistent with the central objectives
defined for the two preceding studies, the current study was designed to estimate the direct4 costs and
direct benefits of the Clean Air Act as a whole, including the major federal, state, and local programs
implemented to meet its requirements. The present study focuses on estimating the incremental
effects of the 1990 Amendments in particular, and covers the period from 1990 –when these most
recent Amendments were passed—through the year 2020.

A second, subsidiary objective of the study was to gauge the economy‐wide effects of the 1990 Clean Air
Act programs, including evaluation of the Act’s effects on the overall growth of the U.S. economy and
the economic well‐being of American households.

4
 In this study, “direct” costs or benefits refer to first‐order economic effects of pollution control programs. For
example, the expenditure of funds to purchase, install, and operate pollution control equipment is considered a
direct cost of a pollution control program. Similarly, the reduction in risk of a pollution‐related health effect is a
direct benefit of the reduction in emissions achieved by the use of that equipment. Indirect effects are those
which emerge as consequences of the direct effect, such as the higher cost of producing steel if the direct cost to
an electric utility of installing pollution control equipment leads to an increase in electricity prices paid by a steel
plant. An example of an indirect benefit is the improvement in worker productivity achieved when the direct
benefit of avoiding pollution‐related illness helps workers avoid sick days. The present study focuses on evaluation
of direct benefits and costs but also, to a limited extent, assesses indirect effects through economy‐wide modeling.

                                                                                                   6
The Benefits and Costs of the Clean Air Act from 1990 to 2020: Summary Report
EPA also sought, as a third objective, to be as comprehensive as possible –subject to practical limitations
imposed by budget and information constraints—by considering a wide range of human health, human
welfare (i.e., quality of life), and ecological effects. While some of these effects may contribute only
minimally, if at all, to the quantitative estimates of benefits and costs generated for this study, looking
at a broad range of effects was intended to ensure that (a) effects of concern to various stakeholders
were included and (b) EPA and outside researchers could obtain additional insights about any
deficiencies in the scope and quality of current information.
A fourth and final objective of the current study was to assess its limitations and uncertainties to identify
opportunities for improving data and methods, and to explore the need for refining the scope and
design of future air pollution benefit‐cost studies. External peer review by the outside experts serving
on the Council was a critical aspect of efforts to meet this objective, as well as the other objectives of
this study.
Study Design
The current study is similar to the previous two in its fundamental design. To isolate the effects of Clean
Air Act programs, the study configures and compares two alternative states of the world: one with the
1990 Clean Air Act Amendments, and one which assumes the 1990 Amendments were not passed.
In particular, the first scenario was built to reflect the actual history of post‐1990 Clean Air Act
implementation, including known programs already established, and future programs and control
strategies anticipated in the later years of the study period. This scenario was called the “with 1990
Clean Air Act Amendments scenario,”
or With‐CAAA case for short, and it
represents a world of lower emissions
but higher costs following enactment
of the 1990 Clean Air Act Amendments.
The With‐CAAA case is represented by
the lower line in Exhibit 3, which
depicts a not‐to‐scale schematic
illustrating the scenarios analyzed.
The second, contrasting scenario
reflects a hypothetical world which
assumes federal Clean Air Act and
related programs were frozen as of Exhibit 3. Second Prospective Study scenarios conceptual
November 1990, the month the schematic. This exhibit is a schematic depiction of the scenarios to
illustrate their timing and conceptual foundations. The differences
Amendments were signed into law.
in emissions between studies and between years are not to scale
Therefore, 1990 serves as the “base and should not be viewed as a comparison of emission reductions
year” of the analysis when the two achieved between studies or between years.
7The Benefits and Costs of the Clean Air Act from 1990 to 2020: Summary Report
scenarios are initially set as equal but then begin to diverge. The counterfactual scenario was called the
“without 1990 Clean Air Act Amendments scenario,” or Without‐CAAA case. The hypothetical Without‐
CAAA case is represented in Exhibit 3 by the upper 1990 to 2020 trend line showing the higher emissions
which would result if standards stayed fixed but the economy and the population of the U.S. grew over
the 1990 to 2020 period.
Once they were configured, the With‐CAAA and Without‐CAAA scenarios were processed through a
series of economic and physical effects models, and their differences were estimated and compared.
Specifically, each scenario was analyzed using a sequence of models to estimate what pollution control
measures were (or might be) taken by government, private industry, and individuals; and what the
effects of those measures might be in terms of economic and environmental change. The sequence of
modeling steps followed to analyze the two scenarios is shown in Exhibit 4. Detailed descriptions of
each analytical step –including the particular data, models, and methodologies used and their attendant
uncertainties—are provided in the full integrated report and supporting technical documents.
One consequence of this sequential modeling approach is that the scenarios were defined early in the
study. As such, this study reflects a particular snapshot in time with respect to known and anticipated
control programs, especially those incorporated in the With‐CAAA scenario. Several important
programs, however, have been initiated or revised since the analytical scenarios were locked for the
study in late 2005. For example, the With‐CAAA scenario reflects the Clean Air Interstate Rule (CAIR)
which had been recently promulgated when the scenarios
were set, but this rule is now being replaced by a different rule
designed to address the problem of long‐range atmospheric
transport of air pollution. Information about the estimated
benefits and costs of recent rules is available in the relevant
EPA Regulatory Impact Analyses.
To ensure high‐quality, credible results, the study used the
best available data and state‐of‐the‐art modeling tools and
methodologies. Most important, the design of the study,
many of the intermediate methodological choices and
findings, and the final results and their interpretation were all
reviewed by the Council and its three technical
subcommittees. The specialized expert review of the
emissions and air quality, human health effects, and ecological Exhibit 4. Analytical sequence of the
effects study components by the three technical Second Prospective Study. This flowchart
shows the order of the major analytical
subcommittees complemented and supported the Council’s steps followed to conduct the study.
broad expertise, which included substantial expertise in
economics.
8The Benefits and Costs of the Clean Air Act from 1990 to 2020: Summary Report
Primary Results
Direct Cost
Compared to the baseline scenario without
the 1990 Clean Air Act Amendments and
Electricity generating units
related programs, the With‐CAAA scenario
adds controls across five major categories
of emission sources. All significant Non‐utility industrial
emissions sources are assigned to one of
these five major source categories. Two of Onroad vehicles & fuel
these categories cover stationary point
sources of emissions, two cover mobile Nonroad vehicles & fuel
sources, and the fifth category covers
smaller sources dispersed over wide areas.
Area sources
The categories are:
Local controls
1. Electricity generating units (e.g., coal‐
fired power plants)
Additional controls to
2. Non‐utility industrial sources (e.g., meet national standards
industrial boilers, cement kilns)
3. Onroad vehicles and fuel (e.g., cars, $0 $10 $20 $30
buses, trucks) Billions
4. Nonroad vehicles and fuel (e.g.,
aircraft, construction equipment) Exhibit 5. Year 2020 direct cost of compliance by source
5. Area sources (e.g., wildfires, category. (In billions of year 2006 value dollars). The first five
construction dust, dry cleaners) darker orange bars show how compliance costs compare for
the five major categories of emissions source. Additional
controls applied to these five source categories at the local
The costs incurred to reduce emissions level for the purposes of meeting air quality standards are
from these sources under the 1990 Clean shown by the sixth darker orange bar. The seventh, lighter
Air Act Amendments are estimated to rise orange bar also reflects additional local controls but these are
shown separately because their costs are significantly more
steadily throughout the 1990 to 2020 study uncertain.
period. By 2020, the study target year
when differences between the With‐CAAA and Without‐CAAA scenarios are at their greatest, additional
annual compliance expenditures are estimated to be about $65 billion (in year 2006 value dollars).
As shown in Exhibit 5, these incremental costs of compliance did not fall evenly across the five major
source categories. Almost half of the year 2020 direct costs are to meet requirements for onroad
vehicles and the fuels used to operate them. About 40% of the $28 billion in onroad expenditures is to
meet fuel composition requirements and the rest is incurred to meet tailpipe standards and implement
vehicle inspection and maintenance programs.
9The Benefits and Costs of the Clean Air Act from 1990 to 2020: Summary Report
Electric utilities account for the second largest area of expenditure, with costs in the year 2020 equal to
a little over $10 billion. The programs leading to the bulk of these expenditures include the Title IV acid
rain sulfur dioxide allowance trading program, the Clean Air Interstate Rule, programs targeted at
reducing nitrogen oxide emissions (e.g., the NOx SIP Call), and controls required to meet the national
ambient air quality standards for fine particles and ozone.
Implementation of federal and regional control programs to meet the national fine particle and ozone
standards accounts for much of the cost incurred by the five major emissions source categories.
However, for many local areas, emissions reductions achieved by these programs are not sufficient to
reach attainment with national air quality standards. Under the Clean Air Act, these local areas are
required to implement additional controls tailored to their particular needs and opportunities for the
further emission reductions needed to improve air quality and attain the national standards.
Expenditures for local controls which could be identified as both suitable for a given location and cost‐
effective to implement were estimated to reach about $6 billion by 2020.
By the year 2020, reaching the 8‐hour National Ambient Air Quality Standard (NAAQS) for ozone in some
locations appears to be a significant challenge. Some of these locations are assumed under the With‐
CAAA scenario to apply all controls identified as technologically feasible and cost‐effective for their
location yet still show modeled ozone concentrations higher than the 8‐hour national standard. The
With‐CAAA scenario therefore assumes additional emissions reductions are achieved using “unidentified
controls” of unknown cost and/or technological availability and applicability. Since the particular control
strategies for each of these locations cannot currently be identified, their costs are highly uncertain. The
With‐CAAA scenario assumes that the additional emissions reductions achieved by unidentified controls
will cost $15,000 per ton. The $15,000 per ton assumed value could turn out to be too high or too low
depending on local circumstances and the prospects for near‐term improvements in control
technologies and cost, although there is some evidence that local areas would be reluctant to
implement measures that cost more than $15,000 per ton. The total incremental cost of these
additional local controls using unidentified technologies is estimated to be $13 billion. Given the
relatively high level of uncertainty in this component of Clean Air Act program compliance costs, it is
reported as a subtotal separate from the identified control measures subtotal of $52 billion.
Emissions Reductions
The controls applied across the major categories of emissions sources under the With‐CAAA scenario
achieve substantial reductions in emissions contributing to ambient concentrations of fine particles,
ozone, and other air pollutants. As shown in Exhibit 5, the total costs of control from some sectors –
such as electricity generating units and onroad vehicles and fuels—were high relative to other source
categories, but these sources also achieved the greatest reductions in emissions. For example, onroad
vehicles and fuel represent 46% of total control costs in 2020 but they also contribute 41% of the year
2020 reduction in total NOX emissions. The full range of emissions reductions estimated under the With‐
CAAA case and the breakdown by source category are described in the full report, but the overall
10The Benefits and Costs of the Clean Air Act from 1990 to 2020: Summary Report
reductions in pollutants which
contribute most to changes in fine
Without‐CAAA90 With‐CAAA90
particles and ozone are highlighted in 35
Millions of tons
Exhibit 6.
In addition to directly‐emitted fine 30
particles,5 three other pollutants
designated for control under the Clean 25
Air Act contribute to increases in
ambient concentrations of fine
particles through secondary formation 20
and transport in the atmosphere. 6 For
example, gaseous sulfur dioxide can
15
be transformed in the atmosphere to
particulate sulfates. Volatile organic
compounds (VOCs) and nitrogen 10
oxides are also key pollutants
contributing to the formation of
ground‐level ozone. 5
The estimated With‐CAAA scenario 0
emissions reductions depicted in Volatile Nitrogen Sulfur Fine
Exhibit 6 are large because they reflect Organic Oxides Dioxide Particles
both absolute reductions relative to Compounds (Direct)
1990 base year conditions and
avoided increases in emissions which
Exhibit 6. Year 2020 key pollutant emissions under the With‐CAAA
result under the Without‐CAAA case
and Without‐CAAA scenarios. (In millions of short tons). The
when standards stay fixed at 1990 difference in height between the orange and blue bars for each
levels but economic activity increases pollutant shows the estimated reduction in that pollutant achieved
from 1990 to 2020. Approximately 75 by 1990 Clean Air Act Amendment programs.
percent of the 2020 emissions
reductions are attributable to improvements relative to 1990, while the remaining 25 percent is
attributable to avoiding increases in emissions that could result if Clean Air Act standards stay fixed
while population and economic activity grow.
5
Fine particle pollution already in a solid or liquid aerosol state at the point of emission from a tailpipe or
construction site is commonly referred to as “directly emitted fine particles,” or sometimes “primary particles.” In
contrast, fine particles which form in the atmosphere later from gaseous precursors, such as sulfur dioxide, are
referred to as “secondary fine particles.”
6
In recent years the importance of ammonia in secondary formation of fine particle air pollution has become
clearer. However, unlike the other pollutants shown in Exhibit 6, ammonia is not currently a designated air
pollutant under the Clean Air Act, and there are no explicitly assumed differences in control requirements for
ammonia between the With‐CAAA and Without‐CAAA scenarios.
11The Benefits and Costs of the Clean Air Act from 1990 to 2020: Summary Report
Most of the reduction in volatile organic compounds is achieved by controls on evaporative emissions
from area sources such as household solvents, controls on vehicle and nonroad engine tailpipe and
evaporative emissions, and controls on non‐utility industrial sources.
For nitrogen oxide emissions, all five major source categories achieve emissions reductions under the
With‐CAAA scenario; but the most substantial contributions to lower emissions are attributable to
tailpipe standards for onroad vehicles and reductions achieved by utilities subject to cap‐and‐trade
programs and/or the Clean Air Interstate Rule. Requirements related to the national standards for fine
particles also reduce nitrogen oxides emissions.
Electricity generating units such as coal‐fired power plants are the source category which achieves the
most significant reductions in sulfur dioxide emissions, accounting for about 75 percent of the total
reduction projected in 2020. Cap‐and‐trade programs, the Clean Air Interstate Rule, and other control
programs implemented pursuant to the national fine particle standards account for most of the
estimated difference in sulfur dioxide emissions between the With‐CAAA and Without‐CAAA scenarios.
About 40 percent of the year 2020 reduction in directly‐emitted fine particles is achieved by controls on
area sources such as construction dust and residential woodstoves. Reductions from utilities and from
nonroad and onroad sources also contribute toward meeting the requirements of the national ambient
air quality standards for fine particles.
Air Quality Improvements
The substantial reductions in emissions which contribute to ambient concentrations of ozone and fine
particles lead to significant differences in modeled air quality conditions under the With‐CAAA and
Without‐CAAA scenarios. Air quality modeling results for all pollutants and all target years analyzed in
this study are available in the full report, though the estimated change in fine particle concentrations is
highlighted here because reductions in exposure to this pollutant are responsible for the vast majority of
benefits which could be evaluated in economic terms for this study.
Exhibit 7 shows that reductions in fine particle concentrations by 2020 are large and widespread, as
demonstrated by the pervasive blue colors indicating improvement in air quality. The most significant
reductions occur in California and the Eastern U.S., especially the Ohio Valley region, primarily due to
sulfur reductions from electric utilities and industrial facilities combined with mobile source reductions
concentrated around heavily‐populated metropolitan areas. Because these areas had relatively high
fine particle concentrations in the 1990 base year, the modeling results imply that 1990 Clean Air Act
Amendment programs were effective in targeting high emissions sources in and around locations where
improvements in air quality would benefit the greatest number of people. There are a few locations in
the West where fine particle concentrations are estimated to be slightly higher in 2020 under the With‐
CAAA scenario due to localized effects related to electrical generating unit dispatch or fuel choice.
These localized disbenefits, shown by the isolated spots of orange color in Exhibit 7, are negligible
12The Benefits and Costs of the Clean Air Act from 1990 to 2020: Summary Report
Exhibit 7. Difference in annual average fine particle (PM2.5) concentrations between the With‐CAAA and
Without‐CAAA scenarios: With‐CAAA minus Without‐CAAA for 2020. (In micrograms per cubic meter). The
map shows the change in concentrations of fine particles in the atmosphere achieved by 1990 Clean Air Act
Amendment programs. The darker the blue color, the greater the improvement in air quality. The few spots
of orange on the map are isolated locations where the air quality model projected slightly higher fine particle
concentrations under the With‐CAAA scenario than under the Without‐CAAA scenario.
compared to the large and widespread overall reductions in fine particle pollution under the With‐CAAA
case.
Ozone concentrations are also significantly lower overall under the With‐CAAA scenario relative to the
Without‐CAAA scenario. As shown by maps provided in the full report, the patterns of air quality
improvements for ozone are similar to those observed for fine particles with widespread regional
improvements across the East and improvements in the West occurring predominantly in areas
influenced by Southern California population centers.
13The Benefits and Costs of the Clean Air Act from 1990 to 2020: Summary Report
Health Improvements
The steady improvements in air quality estimated under the With‐CAAA case from 1990 to 2020 period
lead to increasing health and environmental benefits over the entire study period. By 2020, the
differences in air quality and human health outcomes between the With‐CAAA and Without‐CAAA
scenarios are considerable.
Health Effect Reductions
Fine Particle and Ozone (PM2.5 & Ozone Only) Pollutant(s) Year 2010 Year 2020
Pollution
PM2.5 Adult Mortality PM 160,000 230,000
The largest reductions in fine PM2.5 Infant Mortality PM 230 280
particle concentrations are
achieved in areas with relatively Ozone Mortality Ozone 4,300 7,100
poor air quality and/or high Chronic Bronchitis PM 54,000 75,000
population density (see Exhibit
7). This result is due in large part Acute Bronchitis PM 130,000 180,000
to the effective design of federal,
Acute Myocardial Infarction PM 130,000 200,000
state, and local programs aimed
at meeting ambient air quality Asthma Exacerbation PM 1,700,000 2,400,000
standards in ways which
Hospital Admissions PM, Ozone 86,000 135,000
maximize public health
improvements. The Emergency Room Visits PM, Ozone 86,000 120,000
effectiveness of these programs
Restricted Activity Days PM, Ozone 84,000,000 110,000,000
in achieving well‐ targeted
reductions in exposure means School Loss Days Ozone 3,200,000 5,400,000
that the differences in health
outcomes between the With‐ Lost Work Days PM 13,000,000 17,000,000
CAAA and Without‐CAAA
Exhibit 8. Differences in key health effects outcomes associated with fine
scenarios are substantial, even
particles (PM2.5) and ozone between the With‐CAAA and Without‐CAAA
dramatic. scenarios for the 2010 and 2020 study target years. (In number of cases
avoided, rounded to 2 significant digits). The table shows the reductions
For example, as early as 2000, in risk of various air pollution‐related health effects achieved by 1990
Clean Air Act Amendment programs, with each risk change expressed as
annual average exposures7 to the equivalent number of incidences avoided across the exposed
population.
7
“Average exposure” in this case refers to “population‐weighted annual average exposure,” which is calculated by
dividing the total population exposure over the course of a year by the total number of people in the exposed
population. This measure provides a helpful summary indicator of overall exposures and exposure changes, in this
case across all people living in the 48 states; though people living in particular locations may experience much
higher or much lower exposures or exposure changes than people in other locations. To illustrate, consider a
population of three people where two people experience a change in exposure from 30 to 10 micrograms per
cubic meter (µg/m3), and a third person’s exposure change is from 25 to 20 µg/m3. The change in population‐
weighted average exposure would be (20+20+5) divided by 3 = 15 µg/m3. While the 15 µg/m3 change provides a
14The Benefits and Costs of the Clean Air Act from 1990 to 2020: Summary Report
fine particles among the U.S. population are lower by an average of 5 micrograms per cubic meter under
the With‐CAAA scenario. By 2020, the average exposure difference between the scenarios increases to
an estimated 9 micrograms per cubic meter, all as a result of programs related to the 1990 Clean Air Act
Amendments. This 9 microgram per cubic meter reduction is tantamount to cutting exposures almost in
half, because the population average exposure for 2020 under the Without‐CAAA scenario is slightly
higher than 19 micrograms per cubic meter.8
The large reduction in risk of premature mortality associated with fine particles is the most significant
outcome among those listed in Exhibit 8. Ozone health studies also indicate there is a separate, additive
contribution to reduced premature mortality risk from this pollutant beyond the premature mortality
effect associated with fine particle exposures. This study’s estimates for these incidence reductions are
based on a strong and extensive foundation of peer‐reviewed epidemiological literature. The
methodologies used to apply these epidemiological studies to the estimation of reduction in population
risks from fine particle and ozone exposure have also been extensively peer‐reviewed.
In addition to reductions in incidences of premature mortality,9 reductions in exposure to fine particles
and ozone are also estimated to achieve major reductions in serious diseases such as chronic bronchitis
and acute myocardial infarction, as well as fewer hospital admissions, emergency room visits, lost work
days, and lost school days.
Hazardous Air Pollutants
Controls on emissions of hazardous air pollutants, including heavy metals and toxic gases, are known to
reduce adverse health effects, though data and tools to quantify the full extent of the reductions in
health risks from these pollutants are limited. A case study assessing the effects of the 1990 Clean Air
Act Amendments in reducing benzene emissions and exposures in the Houston area was conducted as
part of this study. The study found a significant cancer‐reducing benefit overall in the region, but also
found that 1990 Clean Air Act Amendment programs led to the most substantial reductions in those
areas with the highest baseline cancer risks. These results are described in detail in the full report and in
a separate technical report documenting the Houston benzene case study.
useful measure of the shift in overall population exposure, it may obscure the fact that the third individual
experienced a significantly smaller improvement and is left with a significantly higher residual exposure.
8
For perspective, this level of population‐wide annual average fine particle exposure is about the same as that
experienced by people living in Los Angeles in the year 2000. (See Text Box 4‐1 of the full report.)
9
The term “incidence” is not intended to represent premature mortality of a particular known individual, but
rather small reductions in risk experienced by many people that sum to an aggregate change in population risk
numerically equivalent to one avoided premature mortality.
15The Benefits and Costs of the Clean Air Act from 1990 to 2020: Summary Report
Other Clean Air Act Pollutants
Reductions in ambient concentrations of other Clean Air Act pollutants such as carbon monoxide also
confer health benefits, though many of these benefits are difficult to quantify for various reasons. For
example, in the case of carbon monoxide, available health studies are not well suited to isolating the
incremental contribution of carbon monoxide reductions to improved health when significant
reductions in other pollutants, such as fine particles, are modeled at the same time. Furthermore,
health effects of some pollutants can be quantified in physical terms but economic studies supporting
valuation of the changes in physical outcomes are unavailable. Whether the limits on quantification of
these other criteria pollutant10 effects emerge at the physical effect or economic valuation step, the
result is that these effects are not reflected in the primary estimates of health improvements presented
in this report.
Other Benefits to People and the Environment
Beyond the direct health benefits of Clean Air Act programs, a variety of other improvements to human
well‐being and ecological health are assessed in this study. Efforts to evaluate these other “non‐health”
effects were motivated by the study’s goal of providing insights on the full range of outcomes which may
affect people and the environment, including those which might either be important to particular
stakeholders or warrant further research to support more or better quantitative treatment in future
studies.
The first step in this study’s assessment of non‐health effects was a literature survey to identify
ecological effects of Clean Air Act‐related pollution reductions at various levels of biological organization
(e.g., ecosystem, community, individual, cellular). The range of potentially relevant effects found in this
literature review is described
in the full report and Quantified Human Welfare and Ecological Effects Pollutant(s)
supporting technical
documents. Based on the Visibility in residential areas (metropolitan areas) PM, Ozone
results of this broad
Visibility in recreational areas (large parks in three regions) PM, Ozone
assessment, the analysis was
then narrowed to focus on Commercial timber (commercially important tree species) PM, Ozone
those ecological and human Agriculture (commercially important crops) Ozone
health effects for which
Recreational fishing (Adirondacks) Acid Deposition
economic valuation
information was available Materials damage (a few acid‐sensitive materials) Sulfur Oxides
and could be applied. This
Exhibit 9. Ecological and welfare effects included in primary estimates of
narrowing of focus served the benefits. For each effect in the table, the limited geographic range or the
principal goal of the study, subset of effects included in the primary results is listed in parentheses.
10
There are six Clean Air Act “criteria pollutants” for which national ambient air quality standards are established:
particulate matter, ozone, carbon monoxide, sulfur dioxide, nitrogen oxides, and lead (Pb).
16The Benefits and Costs of the Clean Air Act from 1990 to 2020: Summary Report
which was to evaluate the various health, economic, and environmental effects of the Clean Air Act
using comparable measures of value. In the end, only a very limited number of non‐health effects could
be included in the primary estimate of benefits, and these quantified and monetized ecological and
welfare effects are listed in Exhibit 9.
In addition to limitations in the range of effects included in the primary results, several of the included
effects were subject to limitations in geographic coverage or the number of commodities or ecosystems
covered. The limited scope of quantified effects or limited geographic coverage for each effect is
described in Exhibit 9. For example, available data and modeling tools supported assessment of the
effects of changes in ozone exposure only for select, commercially important crops and tree species; and
other effects such as changes in recreational fishing opportunities due to acidic deposition could only be
addressed through case study examinations not suitable for extrapolation to other areas of the country.
This study is therefore subject to the same persistent limitations in data and methods for evaluating
potentially important ecological and human welfare outcomes which have impaired other benefit‐cost
studies of air pollution control programs. The consequence is ongoing uncertainty about the potential
magnitude of these effects relative to the human health effects which can be more readily evaluated in
terms of physical outcomes and changes in economic value.
Visibility
Based on measurable economic value, improvements in visibility emerged as one of the most significant
non‐health effects of better air quality under the With‐CAAA scenario. A new methodology was applied
to estimate the economic value of visibility improvements in metropolitan areas, and the effect of this
new approach was to expand the number of locations where visibility improvements could be valued in
economic terms. The significance of the results obtained using this new methodology highlights the
importance of improved visibility for enhanced quality of life.
There are two types of visibility improvement benefits estimated in this study: recreational visibility and
residential visibility. Recreational visibility benefits reflect the values people assign to reductions in
obscuring haze and resulting improvements in scenic views at important U.S. recreational areas, such as
the Grand Canyon and other federal “Class I” areas. 11 Residential visibility benefits capture the value
people assign to improved visibility where they live.
The differences in air pollution‐related visibility impairment under the With‐CAAA and Without‐CAAA
scenarios used to estimate both recreational and residential visibility benefits are shown in Exhibit 10.
While benefits are estimated for all target years of the study, Exhibit 10 contrasts the county‐level
visibility conditions under the With‐CAAA case relative to the Without‐CAAA case for the year 2020.
Visibility impairment is measured in Deciviews, which is a rating scale aimed at measuring and then
valuing perceptible changes in visibility. In Exhibit 10, the darker the color, the greater the impairment
11
Under the Clean Air Act, a “Class I” area is one in which visibility is protected more stringently than under the
national ambient air quality standards. Class I areas include national parks, wilderness areas, monuments, and
other areas of special national and cultural significance.
17The Benefits and Costs of the Clean Air Act from 1990 to 2020: Summary Report
in visibility; so the lighter orange areas in the lower With‐CAAA map indicate improved visibility resulting
from 1990 Clean Air Act Amendment programs.
Previously established methods were used to estimate visibility improvements at federal Class I areas
across the U.S. Because of limitations in the applicability of available economic valuation studies,
however, the primary
estimate of benefits
presented herein includes
only 86 parks and
recreational areas in
California, the Southeast,
and the Southwest. The
total value of visibility
improvements at these 86
Class I areas is estimated
to reach $19 billion by the
year 2020.
Applying the new
methodology supporting
expanded coverage of U.S.
metropolitan areas,
residential visibility
benefits are estimated to
reach $49 billion in 2020,
a number which is
significant but consistent
with the substantial
improvements in visibility
across major population
centers. The $67 billion
combined total for
residential and
recreational visibility
benefits in the year 2020
slightly exceeds the entire Exhibit 10. Visibility conditions at the county level under the With‐CAAA and
$65 billion estimated cost Without‐CAAA scenarios for 2020. (In Deciviews). The maps show visibility
conditions under each scenario with lighter colors indicating better visibility.
of 1990 Clean Air Act
compliance for that year.
18The Benefits and Costs of the Clean Air Act from 1990 to 2020: Summary Report
Comparison of Direct Costs and Direct Benefits
The final step in the benefit‐cost analysis conducted for this study was to express the various health,
welfare, and environmental benefits of 1990 Clean Air Act Amendment programs in dollar values so the
benefits could be compared to the dollar‐based estimates of control costs. As illustrated in Exhibit 11,
comparison of the central estimates for benefit and costs supports a conclusion that programs related
to the 1990 Clean Air Act Amendments
are expected to yield benefits which $2,000
Billions
vastly exceed their costs. Benefits by Category
$1,800
EPA is confident that this finding of
positive net benefits of 1990 Clean Air $1,600
Act Amendment programs is robust for
$1,400
several reasons. First, the benefits of
improved morbidity and improved $1,200
visibility alone are more than twice the
estimated cost of compliance with 1990 $1,000
Clean Air Act Amendment requirements;
so even if one chose to ignore the
$800
substantial reductions in mortality risk $600
achieved by these programs or assigned
them a value of zero, benefits would still $400
be projected to exceed costs. Second,
many beneficial outcomes involving $200
human health or environmental
$0
improvement could not be expressed in
terms of economic values because the
scientific and economic studies to
support such valuations remain
inadequate or unavailable. If methods
were available to quantify these omitted
effects, the estimate of net benefits
Exhibit 11. Year 2020 Primary Central Estimates of direct costs
would further increase. Some and direct benefits with breakdown of benefits by effect
components of cost are also subject to category. (In billions of year 2006 dollars). The two leftmost
uncertainty or omission, but cost bars show the extent to which total benefits exceed total costs,
and the bars to the right provide the breakdown of benefits by
uncertainties are comparatively minor in
category of effect. The third bar shows the extent to which
number and significance relative to mortality reduction benefits exceed all other effects, including
uncertainties on the benefit side of the total costs. The Other Non‐$ bar to the right is intended to
ledger. Finally, the in‐depth assessment emphasize the extensive benefit endpoints which could not be
monetized, and the question mark indicates the potential value
of key uncertainties described in the full of these effects is unknown.
report indicates that the chances are
19The Benefits and Costs of the Clean Air Act from 1990 to 2020: Summary Report
extremely small that uncertainties
in the analysis could lead to a Estimating and Valuing Reductions in Risk of Premature
scenario in which costs exceed Mortality
benefits.
Exposure to some forms of air pollution increase a person’s chances
of experiencing an illness they would not otherwise have
Those who nevertheless find that
experienced, or dying earlier than would otherwise have been
uncertainties and other limitations
expected. For the fine particle pollution which dominates the
of benefit‐cost analysis render outcome of this benefit‐cost study, changes in health risk differ
these results less than satisfactory among individuals based on factors such as age and initial health
for obtaining policy insights may status. For example, individuals who have already experienced stroke
prefer to use other paradigms for or heart disease may experience a different loss in future life
measuring, comparing, and expectancy due to increased exposure to fine particle pollution than
evaluating the outcomes projected others in the population might experience. This variability in risk from
by this study. For example, it is a given change in pollution exposure means that different individuals
experience different shifts in their “survival curve” which, in the air
possible to avoid assigning
pollution context, represents the expectations an individual may have
uncertain dollar‐based values to
for additional years of life as different ages are reached. This
changes in risk of premature
variability among different segments of the population complicates
mortality and, instead, compare efforts to estimate the overall change in risk experienced by the
the costs of Clean Air Act programs population as a whole following implementation of programs such as
with the projected number of those associated with the Clean Air Act.
avoided incidences of premature
mortality or illness. The full report Moreover, a further complication arises in the context of benefit‐cost
for this study and the supporting analyses aimed at gauging the value to society of the reductions in
technical documents provide premature mortality risks achieved by these programs. In addition to
variability in how different individuals’ survival curves shift when fine
details about the estimated
particle pollution is reduced, different individuals may also assign
benefits achieved in terms of
different values to a given shift in their survival curve. The extents to
physical outcomes as well as the
which people may assign different economic values to mortality risk
estimated economic value of those reductions based on age, initial health status, or the source or nature
outcomes, and these detailed of the risk (e.g., voluntary versus involuntary, sudden versus
results can be used to support protracted) are significant uncertainties.
alternative assessments of value.
In the absence of sufficient scientific and economic data and tools for
One example of an alternative capturing the variability within the population in both the reduction in
paradigm for assessing and risk and the value individuals assign to such risk reduction, the
estimates for both the population‐wide risk change and the overall
comparing the value of premature
value to society of the aggregate risk change are uncertain. While the
mortality risk reductions achieved
methods used for this study are state‐of‐the‐art and consistent with
by the 1990 Clean Air Act
other recent analyses, the key uncertainties which nevertheless
Amendment programs is to divide persist in estimating the magnitude and value of changes in mortality
compliance costs for a given year risk due to air pollution are discussed and evaluated in detail in this
by the number of incidences of study’s full report and in the technical reports on health effects and
avoided premature mortality on uncertainty which accompany this study.
20You can also read