Napier Gisborne Line Assessment of the Commercial Viability of the Line - 18 May 2012
←
→
Page content transcription
If your browser does not render page correctly, please read the page content below
Napier Gisborne Line
Assessment of the Commercial Viability of the Line
18 May 2012

                                                     1
                      Commercial in Confidence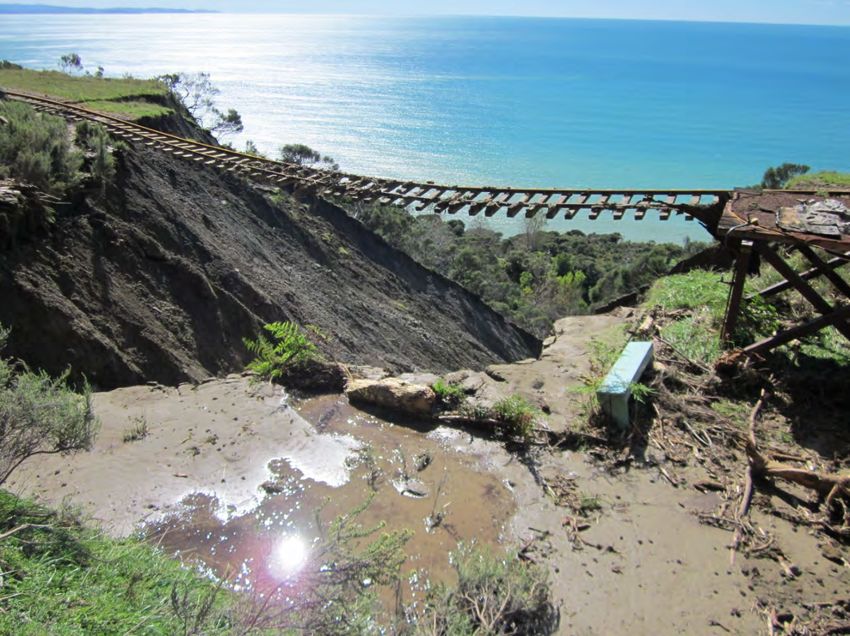
Section 1: Introduction
1 Executive Summary
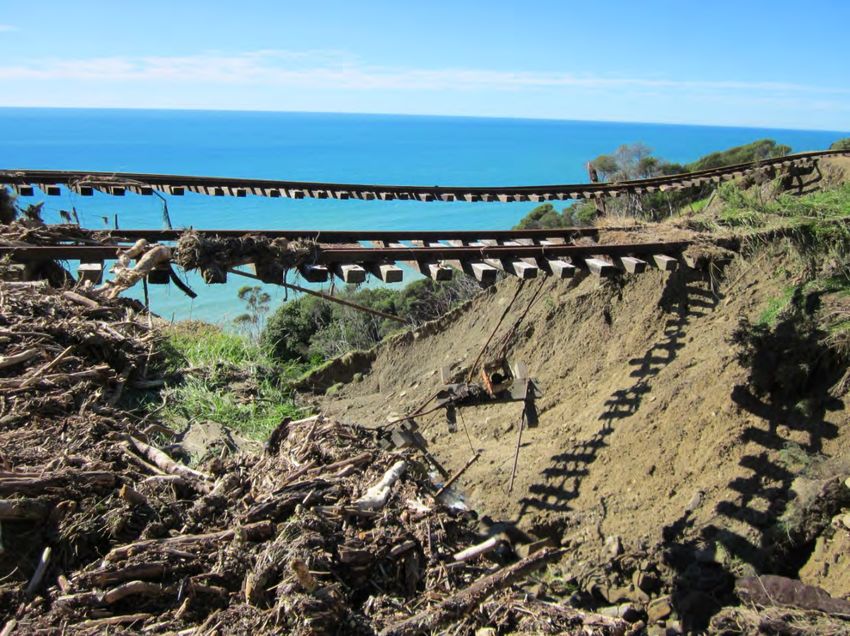
• The Napier Gisborne line is currently closed from Wairoa to Gisborne following major
storm damage.
• Reinstatement costs to repair the current slips is around $4m.
• There are currently two services a week operating between Wairoa and Napier.
• The line is not commercially viable to operate today or in the foreseeable future. This
is true for both the full line and sub section from Napier to Wairoa.
• Based on current estimations an annualised subsidy in the order of $6m per annum
would be required to continue to operate.
• Advice sought from the NZTA concludes that if the line were closed that there would
be minimal impact on the overall level of service on the highway.
2 Introduction
The purpose of this paper is to provide an assessment of the future viability of the railway
line between Napier and Gisborne. This assessment has been accelerated as a result of a
major weather event during March which caused several major washouts between Gisborne
and Wairoa.
The line between Wairoa and Gisborne has been closed temporarily pending a decision to
repair the damage. Note that this paper presents costing and impacts in ranges as it is
difficult to quantify with a degree of specificity the exact numbers. A range provides the
likely bounds of the costs and impact assessments.
Note a detailed report is attached to this paper as Appendix 1.
3 Background
• The Napier to Gisborne line is part of the Palmerston North to Gisborne Line. By rail,
the distance between Napier to Gisborne (212 kilometres) is approximately the same
distance by road.
• The corridor currently generates approximately $1m of revenue per annum, of which
$270,000 is revenue associated with product which either commences or ends its
journey on other lines but which passes through the Napier-Gisborne corridor.
• The Wairoa to Gisborne section of the line has suffered four significant washouts,
caused when culverts became inundated with wood debris. This has brought forward
the decision on the future viability of the line. KiwiRail Infrastructure teams have
estimated the cost to reinstate the line by repairing the slide damage at
approximately $4m. This is a one off cost which will enable the line to reopen.
4 Current and Potential Revenue Options
• The Napier to Gisborne line until recently carried up to 3 return trains a week. These
are timed around the requirements of in Napier. Some weeks
there are no trains, depending on seasonal fertiliser demand, and on the availability
of fertiliser wagons.
2
Commercial in Confidence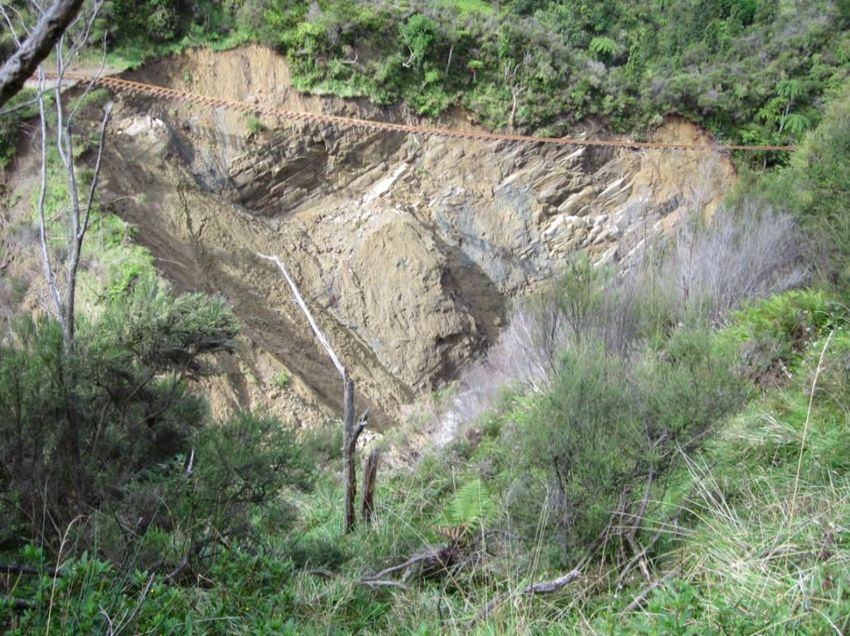
•   Current rail volumes on the Napier to Gisborne route are approximately 50,000
    tonnes per annum – which equates to 1,700 (29 tonne) truckloads of freight a year,
    which deliver just over $1m dollars in revenue.
•   KiwiRail is currently adopting a conservative level of expenditure, as it considers the
    future of the line. If the line was to remain open, over the long term line maintenance
    costs would be between $4 and $8m per annum.
•   The line currently produces a cash deficit for KiwiRail after operating costs and
    annual line maintenance costs of approximately $2.4 m for FY12.
•   The line is supported to a degree by key freight forwarders,
                  however the transit times between Auckland and Napier are such that
    there is limited potential to grow this market and these volumes can fluctuate
    considerably. One such customer moved around $200,000 in 2009, and this has
    fallen to less than $35,000 in 2012.

•   The KiwiRail Freight sales team has been reviewing current and potential customers
    on the line to determine what potential upside revenue is available within the region
    that, if transported on rail, could assist with the long term viability of the line.
•   One of the revenue opportunities identified is the potential to move the large volumes
    of wood from the Gisborne area to the Napier port once harvesting commences in or
    around 2019. This is still some seven years away and even then it would appear the
    opportunity is only available for a period of seven to 10 years depending on the rate
    at which the forests are harvested. In addition, short haulage distances from some
    forests, and costs of double handling also combine to make rail a less attractive
    cartage option for forest owners.
•   Viable opportunities that have been identified by KiwiRail are as follows:
       o   Forest volumes – KiwiRail has been in discussions with plantation owners
           with control of major forest plantations in the Gisborne and Wairoa regions.
           This volume is due to commence harvesting in 2019 and has the potential to
           travel on rail (for export via the Napier port). Indicative numbers suggest
           between 1 and 2 million tonnes per annum could travel on rail – albeit this
           might only last for 7-10 years;
       o   Timber products                     from Gisborne to Napier port equivalent to
           4 TEU per week;
       o   Fertiliser –              – 15 wagons per week;
       o   Apples and Onions – 8,000 tonnes combined;
       o   Squash – 30,000 tonne seasonal between January and April;
       o   Aggregate – potential for 20,000 tonne from Gisborne to Napier/Hamilton;
       o   Export lamb                        averaging 7 FEU per week.
•   Each revenue opportunity has been assessed for likelihood and included in a 10 year
    future look at the line. From this analysis it is feasible to expect the revenue on the
    line to grow from the current $1m to approximately $2.5m per annum.
•   Over and above the revenue generated from within the line – there is additional
    $266k revenue attributable to other lines, which would be lost to the business if the
    Napier Gisborne line is no longer available.

                                                                                      3
                              Commercial in Confidence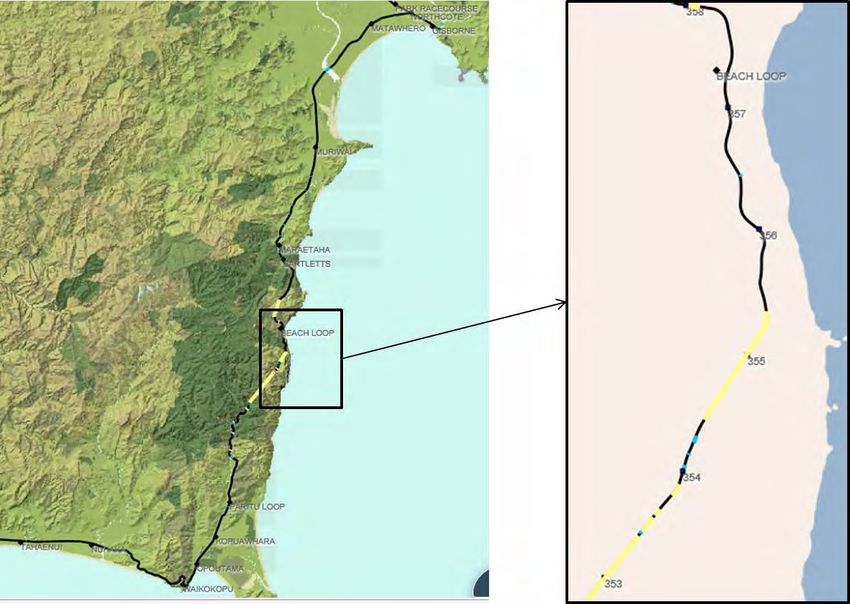
Napier Gisborne Line Performance for FY12

                                                                 FY12

            Number of Trains on Line             [#]              163
            Freight Tonnes Moved              [tonne s ]        44,325
            Net Tonne Kilometres               [NTKs ]           9,369

            Revenue Attributable to line      [$000's ]         $1,044
            Above Rail Operating Costs        [$000's ]          $716
            Below Rail Operating Costs        [$000's ]         $2,125
            Capital Expenditure               [$000's ]          $113
            Return on Capital Deployed        [$000's ]          $512

            Cash Deficit                     [$000's]          -$2,422

            Note: Data has been annualised

5   Options
    •   Not repairing the slip damage and only operating the line between Wairoa and Napier
        has been discounted as not viable. Under this scenario the likely revenue falls from
        $1.5m per annum to $0.7m per annum, as the Wairoa traffic is forestry related and
        has lower yield than Napier-Gisborne traffic.
    •   KiwiRail has identified three options: reinstate the line; mothball the line; or close the
        line.

    •   Reinstating the Line
           o   To retain the line open in full will require the line to firstly be reinstated at
               Beach Loop. This is an estimated cost of $4m and is likely to take six months
               from a decision to proceed until the line is opened for commercial operation;
           o   To keep the line open, the KiwiRail Infrastructure team has advised that to
               deliver a line which is fit for purpose that would not require any additional
               major one-off expenditure, either during the next 10 years or beyond, would
               require annual capital and maintenance in the order of $4 to $8m per annum;
           o   The additional revenues generate a small positive cash contribution prior to
               below rail operating and capital costs ($600k off a $2.5m revenue base or a
               margin of 24%);
           o   When the long run below rail maintenance and capital costs are added to the
               equation the line generates an annual cash shortfall in the order of $4-$8m;
           o   The size of the gap therefore would require the revenue to grow in the order
               of $30m (at 24% margin this produces a contribution of $7.5m);
           o   Based on the size of the market and the opportunities identified there simply
               is not this level of business within the region that could practically travel on rail
               at rates which would make rail an attractive option over alternative transport
               modes;
           o   From KiwiRail’s perspective, the line is not commercially sustainable and
               would require a separate line of funding to remain open. Over the next

                                                                                               4
                                   Commercial in Confidence
10 years the level of additional funding would be in the order of $6m per
           annum;

•   Mothballing:
       o   This requires the line to be secured and made safe;
       o   The rail and operating systems remain in place but no commercial train
           services will operate on the line. The designation would remain;
       o   The current twice weekly service between Wairoa and Gisborne would cease
           with the customer being given 6 weeks’ notice of the cessation of services;
       o   An annual maintenance budget in the order of $200 - 800k per annum will be
           set aside to undertake checks on the line and to keep drains clear and weeds
           and vegetation under control with an initial one off spend of approximately
           $2-$4m to make the line safe;
       o   In this case the majority of the staff currently employed to maintain the line
           would be surplus to requirements, this is in the order of  staff depending on
           the on-going maintenance requirements.

       o   If the line was to be reinstated into commercial service subsequently the line
           would require the $4m to be spent on fixing the current slip damage, plus
           work to repair and replace components on the track that would have been
           replaced during the mothballing phase;
       o   It is concluded that the future revenue opportunity for the line would have to
           be substantial to make this option even a remote possibility of occurring.

•   Close the line:
       o   If it was considered that there was no likely chance of making the line
           commercially viable in the foreseeable future then the next available option is
           to close the line;
       o   The line would be physically uplifted and the usable components used on
           other parts of the rail network;
       o   The adjacent land could then be sold back to the adjoining land owners, or
           sold to the Crown who would then elect what the best alternative use for the
           benefit of New Zealand could be for the land;
       o   As with the mothballing option, staff currently employed to maintain the line
           would be surplus to requirements;
       o   The closure costs have been estimated to be between $7 to $10m;
       o   The business would look to offset some of this cost by reusing some of the rail
           or selling this for scrap. An estimate of the value of this has not been
           determined as a more detailed analysis of the current state of the track and its
           assets would need to be undertaken.

                                                                                      5
                             Commercial in Confidence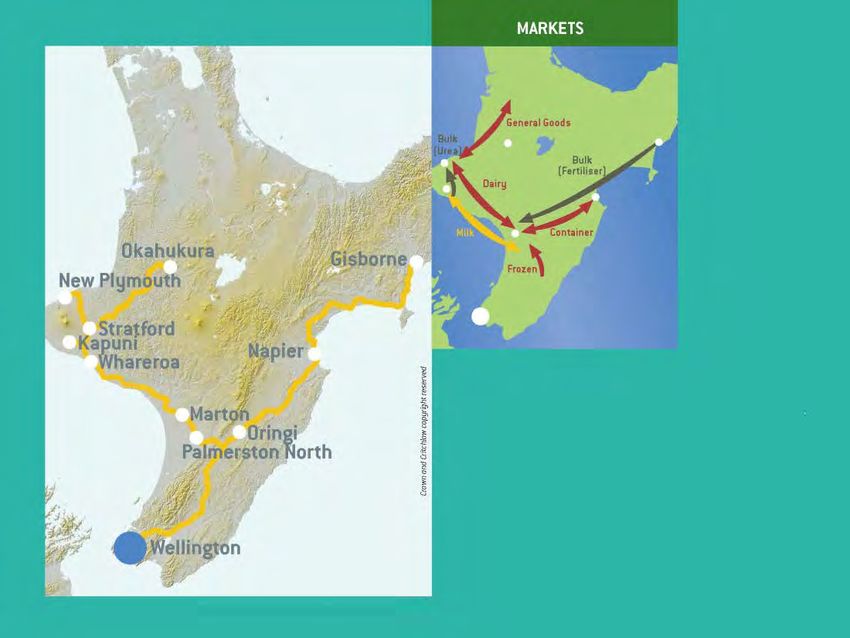
6   Other network implications
    •   If Gisborne is to cope with the volumes of timber that have been forecast to be
        harvested from the East Cape, further investment in the Gisborne Port will be
        required within the next few years.
    •   KiwiRail understands a plan has been developed for upgrading the Port, including the
        construction of new berths, storage areas, sea walls and dredging. The estimated
        cost in 2001 was $46m. If those improvements are not made there is a risk of the
        Port being unable to adequately cope. The rail service would at least provide one
        option for taking product to an alternative port.
    •   Recent discussions with some forestry owners have indicated that even with the
        proposed upgrades to Gisborne Port, there would still be a requirement to move a
        significant portion of the timber from Wairoa and below south to the Port of Napier.
    •   In preparing this paper, KiwiRail have been working directly with officials from NZTA
        to gather their input into the wider impacts that this line plays in the region.
    •   The NZTA advice is that, 81,620 trucks use the state highway annually, and any
        increase based on current freight carried by rail (1,700 per annum) will have little
        impact on traffic volumes. Even if freight grows to the 2022 forecast, it would still
        only add an additional 5,715 truck movements per annum or 16 a day. This level of
        increase will have minimal impact on the condition of the road, the annual
        maintenance budget, or road safety.
    •   The NZTA also advise that there are no significant resilience or route security issues,
        and that most closures of the road are short duration, with longer duration road
        closures (over 10 hours) occurring at a rate of less than one per year.

7   Risks and opportunities
    •   The loss of the Napier to Gisborne line will have minimal effect on the overall
        strategic rail network.
    •   There is uncertainty surrounding long-term oil prices. The price of fuel for rail has
        more than doubled over the past three years and over the past seven years has gone
        up by a factor of four. Both road and rail have been severely affected by fuel price
        rises. Whilst short trains operating to Gisborne are currently not as efficient as they
        could be compared to trucking, the potential for bigger trains could make rail more
        than four times fuel efficient than trucks.

8   KiwiRail Conclusion
    •   The line is not economic to operate today or in the foreseeable future based on the
        known current list of potential opportunities and their respective probabilities of
        success.

                                                                                          6
                                  Commercial in Confidence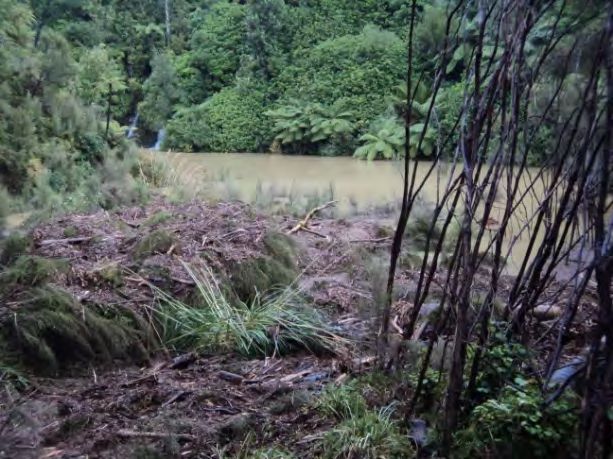
•   The cost of reinstating the line, when considered in the context of the short to
    medium term revenue does not make commercial sense.
•   From a purely financial perspective, mothballing the line presents the lowest net
    present value number for KiwiRail and therefore is the recommended approach.
•   The benefits of mothballing are:
       o   It avoids the additional cost associated with reinstating the line following the
           slips;

       o   It preserves the option that should a major revenue generating opportunity
           present itself in the near future then the business is able to consider that
           opportunity in the light of the actual costs to reinstate and operate the line
           going forward;
       o   Allows the Government time to consider what strategic value the line has to
           the wider New Zealand economy, including alternative uses for the corridor
           and how best to realise that value for the good of the New Zealand economy.

•   KiwiRail would look to engage in conversations with the Government in this regard to
    ensure the interests of all stakeholders are taken into account.

                                                                                      7
                             Commercial in Confidence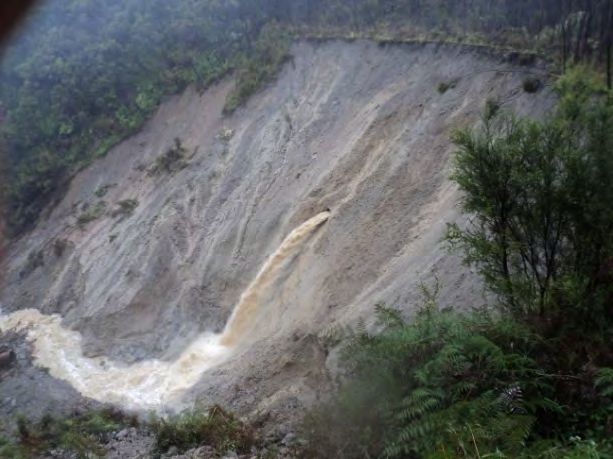
Appendix 1

DETAILED ASSESSMENT OF NAPIER TO GISBORNE LINE

1.      Overview/History Napier - Gisborne Rail System

The Napier-Gisborne rail system comprises the Napier to Gisborne portion of the Palmerston North to
Gisborne Line (PNGL). For the purposes of this report, the assessment includes all traffic that begins
or ends its journey north of Napier.

                                   Figure 1: Napier - Gisborne Rail

The Napier - Gisborne rail system includes 212 km's of track. The rail distance is not materially
different from the road distance. However, the road route between Napier and Gisborne is identified
as hilly of mountainous. Nevertheless the travel time is three hours by road, and five by rail.

Around 70kms of rail track in the district originally constructed to carry farm produce, logs/quarried
rock is now closed. This was predominately the Gisborne to Motohoura line (70kms) opened 1914,
closed in 1959. The last four kilometres of this line is mothballed (the Makaraka branch) and could
potentially be used for private vintage rail operations in the Gisborne area.

                                                                                                 8
                                    Commercial in Confidence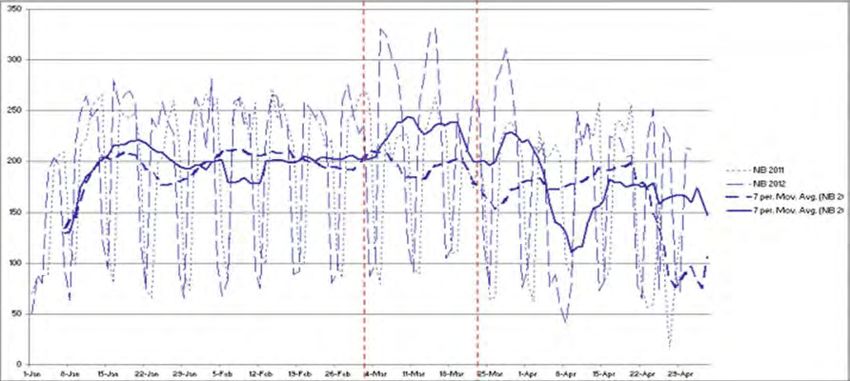
Table: Napier - Gisborne Rail Key Metrics
                 Key Metrics - Napier-Gisborne                                      Metric
                 Track KM's (Napier - Gisborne)                                       212
                 Number of Bridges                                                     79
                 Number of Tunnels                                                     21
                 Train KMs per Year                                                 39,774
                 Wagon KMs per Year                                                 634,709
                 Trains per Year                                                      189
                 Average Trains per Week                                               4
                 Locomotives                                                           2
                 Bogie Wagons                                                          29

                 Tonnes Carried                                                     49,716
                 Direct NTKs [millions]                                              10.3
                 Total NTKs [millions]                                               18.2
                 Average Train Size [net tonnes]                                     263
                 Average Train Size [gross tonnes]                                   549
                  [above figures relate to 12 month period preceding slip damage]

2.      Current Napier – Gisborne Freight Traffic

2.1     The Existing Rail Service
The Napier to Gisborne line until recently carried up to three return trains a week. These are timed
around the requirements of                             in Napier. Some weeks there are no trains,
depending on seasonal fertiliser demand, and on the availability of fertiliser wagons. Wagons are
also needed for delivery to destinations to the south and west of Napier and can be held up on these
other runs for several days at a time.

2.2     Trends in Freight Traffic
Freight volumes have fluctuated significantly between 2006 and today. In 2009 volumes were at their
lowest at a mere 13,000 tonnes, with the highest traffic in the 9 months to March 2012 of 44,000
tonnes. Most of the tonnage (normally over 50%) is fertiliser.

The following tables illustrate the usage and commodities carried on the Napier - Gisborne line over
the past few years. Of particular note is the fact that fertiliser revenue has fallen away since the 2006
financial year which in part was due to the closure of the line for a couple of months due to the
collapse of the Nuhuka Bridge. This effectively saw the line closed for several months of that financial
year. The first tables show revenue and tonnage trends from 2006 to 2012 and customer details for
revenue directly attributable to line section only while the tables on the following pages show revenue
generated by the Napier-Gisborne Line for the network as a whole.

                                                                                                    9
                                          Commercial in Confidence
Napier - Gisborne Line Revenues by Commodity
2006 2007 2008 2009 2010 2011 2012
[000's] [000's] [000's] [000's] [000's] [000's] [000's]
Commodity ***
Fertiliser $457 $404 $182 $83 $258 $395 $322
Timber $126 $201 $90 $0 $0 $1 $34
Vegetables $0 $0 $0 $0 $0 $0 $122
Other $119 $143 $147 $128 $136 $124 $305
$701 $749 $419 $210 $394 $520 $783
Notes *** 2012 period is only for 9 months [July-March]
Revenue refers to only Napier-Gisborne Line Revenue
Other includes Freight Forwarding
Fertiliser makes up a fair portion of the traffic on the line. The $122k of additional vegetable volume in
the current financial year relates to a contract to move squash.
Napier - Gisborne Line Tonnages by Commodity
2006 2007 2008 2009 2010 2011 2012
[tonnes] [tonnes] [tonnes] [tonnes] [tonnes] [tonnes] [tonnes]
Commodity ***
Empties 11 1 3 227 136 309 3
Fertiliser 26,394 22,353 9,612 4,680 15,224 18,250 17,490
Meat 15 151 73
Timber 6,175 7,735 2,041 12 315 10,619
Vegetables 6,876
Other 7,521 9,846 8,732 8,091 8,226 6,181 9,264
40,101 39,950 20,388 13,010 23,737 25,055 44,325
Notes *** 2012 period is only for 9 months [July-March]
Revenue refers to only Napier-Gisborne Line Revenue
Other includes Freight Forwarding
The above table illustrates the key customers of KiwiRail on the line.
10
Commercial in ConfidenceNapier - Gisborne Line Revenues
2006 2007 2008 2009 2010 2011 2012
[000's] [000's] [000's] [000's] [000's] [000's] [000's]
***
Napier - Gisborne Line Intra Revenue $195 $283 $155 $43 $67 $77 $395
Inter Revenue $506 $466 $264 $167 $327 $443 $388
$701 $749 $419 $210 $394 $520 $783
Other Lines Inter Revenue $149 $123 $134 $184 $193 $152 $266
$850 $872 $553 $394 $587 $672 $1,049
movement 3% -37% -29% 49% 15% 56%
Notes *** 2012 period is only for 9 months [July-March]
Over and above the revenue generated from within the line there is an additional $266k revenue
attributable to other lines, which would be lost to the business if the Napier-Gisborne line did not exist.
3. Rail Resources Used for Napier – Gisborne Rail
3.1 Existing Locomotive and Wagon Fleet
In April 2012 the Napier-Gisborne Rail locomotive fleet comprised one DX class Locomotive and one
DC class locomotive with a provision for a spare locomotive required from time to time. Generally two
locomotives would be required to maintain a reliable service, particularly if the service were to run
more frequently.
The rail wagon fleet to service the line once a week comprises around 30 wagons providing a
capacity of 800 tonnes net.
3.2 Service Requirements and Staffing Levels
Train sizes on the Napier-Gisborne line are generally small with the net payload in both directions
usually less than 300 tonnes. Trains can comprise up to 20 wagons during peak season. There were
189 trains run in the 12 months preceding the slip damage that has closed the line.
Counting empty returns, train kilometres were approximately 40,000 for the 12 months preceding slip
damage. Wagon kilometres are approximately 630 thousand.
Staff in the Auckland Service Centre are utilised to assist with train planning, locomotive allocation,
train build, crew rostering, crew assignment and linehaul management.
3.3 Track Costs
Track costs cover maintenance of track and associated physical structures, train control and other
infrastructure services. KiwiRail’s estimated fully allocated track maintenance costs for Napier -
Gisborne is a cost of $4.22 m (low end) to $7.78 m per year (high end).
The table below splits the costs between the Napier to Wairoa and the Wairoa to Gisborne segments
on the line. The costs estimates have been undertaken with a high and low range.
It should be noted that the cost ranges exclude any potential one off events such as we have just
seen with the Beech Loop slip.
11
Commercial in ConfidenceItem Napier to Wairoa Estimate Wairoa to Gisborne
of Annual Costs
Estimate of Annual Costs
Estimate of Future Annual $1.474m $1.256m
Maintenance Costs to
maintain level of service
Increase Geotechnical $50k to $150k $150k to $250k
Resilience Estimates (not
based on a detailed study)
Ahuriri Estuary Bridge $26K to $53k
(estimated 15 year period costs
converted into an average annual
cost)
Other Bridges $25k to $50k $53k to $80k
(estimated 15 year period costs
converted into an average annual
cost)
River Works $0k to $50k Y1 to Y3
$0.266m to $0.5m
(higher spend in 1st three years for
repair between 347km – 350km)
Y4 to Y15
$0k to $150k
Track Renewals $500k to $1,700k $425k to $1,445k
Incident Costs Per Annum $0 to $250k $0 to $500k
TOTALS $2.07m to $3.727m Y1 to Y3
$2.15m to $4.031m
Y4 to Y15
$1.884m to $3.681m
12
Commercial in Confidence4. Current Financial Performance and Analysis
The Napier to Gisborne line, on a fully allocated cost basis, is making losses. On current and
projected financial performance the highest Net Present Value (NPV) to KiwiRail is to mothball the
Napier to Gisborne railway line.
The table below illustrates the current financial performance of the Napier to Gisborne line on an
avoidable (generally direct) costs basis for 2011-12 patterns of traffic.
Table: Current Financial Performance Napier – Gisborne Rail
Napier Gisborne Line Performance for FY12
FY12
Number of Trains on Line [#] 163
Freight Tonnes Moved [tonnes ] 44,325
Net Tonne Kilometres [NTKs ] 9,369
Revenue Attributable to line [$000's ] $1,044
Above Rail Operating Costs [$000's ] $716
Below Rail Operating Costs [$000's ] $2,125
Capital Expenditure [$000's ] $113
Return on Capital Deployed [$000's ] $512
Cash Deficit [$000's] -$2,422
Note: Data has been annualised
The above deficit of $2.4m is forecast to increase to $4-$8m over the next 10 years. The key drivers
of this deficit remain the below rail costs, with below rail operating costs forecast to average between
$3-$4m over the 10 year period, with below rail capital expenditure forecast to be $1-$4m (combined
the below rail portion is between $4m-$8m).
The line continues to be particularly exposed to sudden renewals of infrastructure assets:
• Cyclone Bola damage of 1988 nearly closed the line.
• Nuhaka bridge collapse in 2005.
• Recent storm related damage.
Allowance has only been made in analysis for the current damage repair costs – estimated at
$3-$4m. No allowance has been made for future events of this magnitude.
Scenarios
The following options have been considered for the line:
1. Keep the line open in part or in full.
2. Mothball the line – in part or in full.
3. Close the line in part or in full.
13
Commercial in ConfidenceOption 1: Keep the line open in part or in full
To retain the line open in full will require reinstatement of the wash-out damage. This is estimated to
cost $4m and is likely to take six months from a decision to proceed until the line is opened for
commercial operation.
The option of not repairing the slip damage and only operating the line between Wairoa and Napier
has been discounted as not viable. Under this scenario the likely revenue falls from $1.5m per annum
to $0.7m per annum, as the majority of freight needs to travel through the current slip area. The
Wairoa traffic is forestry related and has lower yield than Napier-Gisborne traffic.
Retention of the full line is assumed to enable the identified growth to be able to be captured on rail.
Based on current estimates of future revenue growth, and anticipated annualised below rail costs, the
line will require an annual top up of between $5 and $8m.
The table below shows the forecast position for keeping the line open in full. Two positions are shown
– being the ‘lower’ infrastructure cost estimates versus the ‘upper’ infrastructure cost estimates.
Summary of Forecast Position for Line
Low I&E Projections High I&E Projections
FY12 FY13 ------> FY22 FY12 FY13 ------> FY22
Number of Trains on Line [#] 163 655 ------> 861 163 655 ------> 861
Freight Tonnes Moved [tonnes ] 44,325 109,887 ------> 165,742 44,325 109,887 ------> 165,742
Net Tonne Kilometres [NTKs ] 9,369 19,123 ------> 31,781 9,369 19,123 ------> 31,781
Revenue Attributable to line [$000's ] $1,044 $1,541 ------> $2,498 $1,044 $1,541 ------> $2,498
Above Rail Operating Costs [$000's ] $716 $1,298 ------> $1,905 $716 $1,298 ------> $1,905
Below Rail Operating Costs [$000's ] $2,125 $3,300 ------> $3,034 $2,138 $4,613 ------> $4,263
Capital Expenditure [$000's ] $113 $4,464 ------> $1,299 $113 $7,674 ------> $3,519
Return on Capital Deployed [$000's ] $512 $430 ------> $1,014 $512 $430 ------> $1,014
Cash Deficit [$000's] -$2,422 -$7,950 ------> -$4,755 -$2,435 -$12,473 ------> -$8,204
NPV for 10 Yrs [using rate of 8.9%] [$000's ] -$34,057 -$59,259
Option 2: Mothball the line
Should Option 1 above prove unacceptable, the next option would be to mothball the line, namely not
repair the slip damage and secure the line so as to preserve the option of reopening the line for
commercial services if and when the financial justification can be substantiated.
The Infrastructure team has estimated that an initial mothballing cost of $2-$4m with annual
maintenance costs thereafter of $0.2-$0.8m. This shows a net present value for this scenario of
between -$3m and -$8m.
Mothball Line Low Projections High Projections
Initial Mothball costs $2.0m $4.0m
Ongoing Costs $0.2m $0.8m
NPV at 8.9% -$3m -$8m
14
Commercial in ConfidenceOption 3: Close the line.
This scenario closes the line, removes the track and structure where possible, while leaving the
corridor safe for other future use. The cost for removal of track and structures is partially offset by
scrap revenue. To maintain future safety, there would be ongoing annual costs.
The Infrastructure team has estimated an initial closure cost of $7-$10m with annual maintenance
costs thereafter of $0.2-$0.8m. This shows a net present value for this scenario of between -$9m and
-$14m.
Close Line Low Projections High Projections
Initial Closure costs $7.0m $10.0m
Ongoing Costs $0.2m $0.8m
NPV at 8.9% -$9m -$14m
Based on the above results, mothballing the line shows the lowest cost to KiwiRail. Analysis is shown
in more detail in Attachment 2.
5. Viability of the Current Service and Future Prospects
5.1 Introduction
The existing level of use of the rail line is far from economically viable. It has been suggested that an
annual freight volume of between 100,000 and 200,000 tonnes per annum (current tonnage is 44,000
1
YTD for 2012) would be enough to keep the line going . At this volume the line could be seen as
contributing to the strategic rail network, at least in the medium term, and could be sufficient to
warrant on-going operating and maintenance expenditure (although not enough to cover long-run
2
capital replacement costs ). On the other hand, one could argue that an annual freight volume of
100,000 – 200,000 tonnes would barely cover the annual operating cost of the line. From a
commercial standpoint, for the service to be viable, it has to be profitable – either profitable in its own
right, or contributing in a significant way to the profitability of the national rail service. From this
perspective the Gisborne line currently does neither of these things, and would still not succeed at
100,000 – 200,000 tonnes of freight per annum. Somewhere in the order of 400,000 or even 800,000
tonnes per annum would be necessary. This would be between 10 to 20 times the amount of freight
currently transported on the Gisborne line.
As an annual tonnage per kilometre of track (a standard measure of track usage), 800,000 tonnes,
over 212 kilometres of rail line from Napier to Gisborne, works out to 3,800 tonnes per kilometre. For
comparison, the line from Kawerau to Tauranga in the Bay of Plenty currently operates at 8,000
tonnes per kilometre. A target 800,000 tonnes per annum for the Gisborne service therefore would
not be unprecedented, and would still be slightly less than half the load or ‘density’ of use on the
Kawerau line.
5.2 Effective Removal of Trucks from the State Highway
Because of the low freight volumes, the existing rail service is having only a minor effect in terms of
reducing the number of trucks on State Highway 2. Fifty thousand tonnes of freight per annum (in a
normal year) currently moved by rail is the equivalent of 1,387 loaded 29 tonne truckloads per annum,
if the same amount of product was to be transferred to road. This in turn equates to about 6 loaded
1
This figure is understood to be derived from historical freight loadings on the Gisborne line.
2
For example replacement of sleepers (currently about 10 years serviceable life remaining) or replacement of major bridges (including the
bridge at Pandora).
15
Commercial in Confidence3
trucks per day working 5 days a week, or 5 loaded trucks per day over 365 days of the year . It will
4
be making about a 2% difference to the 300 or so heavy trucks a day on the State Highway .
Shifting 100,000 to 200,000 tonnes per annum over 365 days a year would remove the equivalent of
between 10 and 20 trucks a day from the state highway – making a 3% to 6% difference to the total
number of heavy vehicles on the road.
By comparison, 400,000 to 800,000 tonnes per annum would remove between 40 and 80 heavy
vehicles from the state highway – a 13% to 26% reduction in the number of trucks on the highway.
5.3 State of the track and structure
KiwiRail Infrastructure and Engineering advise that the Napier – Gisborne railway line is still in
reasonable condition. Some sleepers are in need of replacement, but the majority of them still have
at least another 10 years of life remaining. The tracks themselves are sound and the condition of the
ballast is also reported to be good.
Of more concern are the bridges. The existing structures are safe, but the collapse of the Nuhaka
Bridge in May 2005 illustrates that there are some major structures on the line that are coming due for
significant maintenance or replacement. As long as the line continues to attract only marginal
volumes of freight, any major replacement works are likely to be held off for as long as possible. The
most immediate challenge is the reinstatement costs as a result of the March slips.
If freight volumes (and therefore income on the line) increases significantly over the next couple years
then there will be more funding available to put back in to some of these capital expenses. If,
however, the volumes of freight do not increase then some difficult decisions may lie ahead for
KiwiRail on whether or not it is worth committing to these expenses and keeping the line in operation
in the longer term.
5.4 Carrying Capacity of the Line
The main limitation on the Gisborne line is gradient. Towing capacity and drawbar strength limits
mean that an individual locomotive making the full journey from Napier to Gisborne is limited to towing
a gross weight (including wagons) of up to 820 tonnes. Double locomotives can tow a gross weight of
up to 1,400 tonnes.
These limits are not unusual for a railway line in New Zealand. The line south of Hastings, for
example, has a limit of 750 tonnes for a single locomotive due to the steepness of the gradient at the
Opapa bank (near Te Aute).
The steepest section on the Napier – Gisborne line is in the 80 kilometres of rail track between
Wairoa and Matawhero, and in particular, the inclines at Kotemaori and Wharerata. On the easier
gradients south of Wairoa loadings of up to 2,000 tonnes are possible, and north of Matawhero they
increase again to 1,600 tonnes, but it is the Wairoa to Matawhero section that is the limiting factor.
A gross weight limit of 820 tonnes on a single locomotive equates to about 16 loaded rail wagons,
5
each carrying 35 tonnes of freight . This in turn equates to 560 tonnes of freight per single-locomotive
train. This is the about the same carrying capacity as 19 fully-laden road trucks, each carrying 29
tonnes of freight. By adding a second locomotive the total amount of freight that can be carried
3
These figures are yearly averages only and do not take account of the seasonal variation. During the peak of the fertiliser season the truck-
equivalent will rise to about 18 trucks per day. In the off-season the volumes will be correspondingly lower.
4
NZTA data shows that there are currently about 300 heavy vehicles a day passing over the permanent road counter at Tangoio. The data
shows that while total traffic numbers have increased by about 12%, total heavy traffic volumes have not changed significantly (either up or
down) at this count station over the last 5 years.
5
Assuming an empty carriage weight of 15 tonnes.
16
Commercial in Confidenceincreases to about 980 tonnes. This would be the equivalent carrying capacity of about 33 fully laden
road trucks.
If a future volume of 100,000 to 200,000 tonnes of freight per annum was aimed for it would require
between 3 and 7 single-locomotive trains a week, or between 2 and 4 double-locomotives a week to
shift it.
If the target of 400,000 to 800,000 tonnes was used then it would require between 13 and 27 single-
locomotive trains a week, or 8 to 15 double-locomotive trains per week to shift this amount of freight.
Infrastructure confirms that the line would be able to cope with these volumes. And if such volumes
were achieved then this would stimulate intensified maintenance, upgrading and replacement of
capital structures on the line.
5.5 Opportunities for Achieving Viability
Clearly, in order to achieve anywhere near the 800,000 or even 400,000 tonnes per annum that
KiwiRail consider to be the economic minimum, the Gisborne line would need to pick up a very large
amount of additional freight on top of the current 44,000 tonnes per annum.
This is not impossible. If there are 300 trucks a day on the Napier – Gisborne road (SH2), and if each
is assumed to be carrying 29 tonnes, then the total freight load on the highway would be in the order
6
3 million tonnes per annum . If all of this freight were to be transferred from road to rail it would be
more than enough to keep the rail service running.
But the problem is that very few businesses seem interested in using rail for sending goods in and out
of Gisborne. Instead they are mostly choosing road transport – presumably because they either find it
cheaper, or faster, or more convenient than sending goods through the rail service.
7
Rail has the advantage of lower fuel consumption . It also requires fewer people to run a train than if
the same amount of freight was transported by road. But these advantages are diminished by the
costs of maintenance of the line itself and often by the costs of double or triple handling of freight at
either end of the journey. Added to this are the convenience costs of having to fit in with the timetable
for the train (whereas trucks have greater flexibility), and in the case of the Napier – Gisborne line, the
lack of a regular scheduled service. Furthermore, because the rail service out of Gisborne only goes
south, goods destined for Auckland or Tauranga or other centres to the north of Gisborne, if carried
by rail, must take a circuitous route via the Manawatu Gorge (adding about the equivalent of 800 km
to the slower time of rail per kilometre and cost of the overall journey). Further the direct rail transit
time from Napier to Gisborne is about five hours compared to about three hours by road which makes
rail less competitive on timing also. All of these factors, on balance, are favouring the use of road
over rail transport in and out of Gisborne at the present time.
It is possible that with on-going marketing effort KiwiRail will secure more of a share of the existing
freight business in and out of Gisborne in the future. Unless there is a profound shift in the relative
economics of road versus rail transport, specifically between Napier and Gisborne, it seems unlikely
that rail will ever do anything more than pick up just bits and pieces of the existing trade – and it will
take more than this to make up the 400,000 to 800,000 tonnes per annum that KiwiRail have
suggested is the minimum for a viable freight service on the Gisborne line.
6
In practice it would be less than this. Not all trucks will be fully loaded. But it would certainly exceed 800,000 T/yr.
7
A single locomotive towing a full load of carriages on the Gisborne line (about 560 tonnes, or the equivalent of about 19 truck-loads) is
reported to consume around 5.15 litres of diesel per km. A fully laden truck will use about 0.66 litres per km. Multiplied by 19 trucks, the
total fuel consumption, using road transport, is therefore about two and a half times that of the equivalent load of freight carried by rail on
the Gisborne line. The total difference in fuel consumption for a return journey to Gisborne would be about 3,200 litres (roughly $3,400
worth of fuel). This equates to about 170 more litres (or an additional $180) of fuel per truck.
17
Commercial in Confidence6. Market Opportunities
The KiwiRail Freight Sales team has over recent months been compiling a long list of current and
potential revenue opportunities in the market. The list is extensive albeit when a hard look is taken of
converting some of the potential opportunities into commercial reality the list becomes very short.
The following section seeks to describe some of these opportunities and the potential market
dynamics that are at play as KiwiRail investigates the future of the Napier to Gisborne line.
6.1 Forestry
There are large areas of forest both north and south of Gisborne that are now coming to their peak of
maturity. Indeed, the total plantation area between Hawke’s Bay and Cape Runaway is said to be
8
larger than the whole of Kaingaroa Forest . KiwiRail have recognised that this is the one most
promising area for building up future freight volumes.
One option, for example, would be to transport logs from the big
forests at Mohaka. There will be about 1,000,000 tonnes of logs per annum coming out of these
forests over the next few years. However, the forest companies have made it clear that rail is simply
not an option for them at Mohaka. The total distance from the Willowflat Road/SH2 intersection to the
Port of Napier is a mere 71 kilometres. Double handling on to rail wagons for this kind of cartage
distance is not considered feasible. Furthermore, if logs were destined for the mill at
Whirinaki (rather than just the Port of Napier) they would have to be transferred back on to trucks
again in Napier for cartage to the site. There is no rail link to the Whirinaki mill.
Another possibility would be to cart logs from the forests at Wharerata. All of this
wood is destined for the mill just south of Gisborne. But, once again, with a travel distance of
less than 40 kilometres from forest to mill there is no way that rail could expect to compete as an
alternative to road transport once the costs of double-handling are taken in to account.
The smaller, more scattered forests in northern Hawke’s Bay are likewise not an option. If rail cannot
work at either Mohaka or Wharerata (which together currently account for at least 80% of all available
mature forest off SH2 between Napier and Gisborne) then it is less likely to work for any of other the
minor forests in between. These are mostly even closer to Napier than the Mohaka Forest and are
individually too small to provide the kind of continuous wood supply needed to keep a rail service
running.
It is also unlikely that the rail service will attract any of the timber originating from north of Gisborne,
up towards the East Cape. There are vast areas of forest here, but because the rail line goes no
further north than Gisborne, any logs originating from the East Cape area would first have to be
trucked down to Gisborne before they could be put on to rail. And once the logs arrive at Gisborne,
which has its own wood processing industries and, more importantly, its own log port, there is little or
no reason for them to be carried any further south. As long as Gisborne’s port remains open, and is
able to cope with the volume of timber coming on stream, very little timber or wood product (other
than containerised product) will need to be sent south – either by road or by rail.
The situation is different for the timber processing plants in Wairoa. There, at least, most product
does go south 9. Wairoa has two established mills
which have recently formed a joint venture and which together produce about 60,000 tonnes of
finished wood product per year. But for them rail is not currently an option because of the lack of a
8
Pers comm. I. McSporran, East Coast Lumber, Wairoa.
9
Currently about 90% of loads from the mills go south. This will drop to about 60% (36,000T) from 2006 onwards once the proposed new
on-site kiln-drying facility has been built. North-bound product (23,000T/yr) mainly goes by road via the Waioeka Gorge to the pulp mill at
Kawerau. South-bound product in future will go to the Port of Napier (24,000T/yr) and other southern destinations (12,000T/yr).
18
Commercial in Confidence10
rail siding through the mill site. Nor could a siding be easily installed . Any product sent out by rail
would therefore have to be first loaded on to trucks and then transferred to rail. As far as the mills are
concerned, if double handling is required, they would not be interested in switching to rail.
Overall, therefore, in the Mohaka and Wharerata Forests, the smaller northern Hawke’s Bay Forests,
the forests to the north of Gisborne and the Wairoa and Gisborne timber mills there appears to be no
obvious prospect for either logs or wood product to be carried by rail. The short haulage distances,
the need for double-handling, the lack of sidings, the absence of a rail line north of Gisborne, and
above all the presence of a log port at Gisborne all combine to make rail either an uneconomic or
simply unnecessary cartage option for the purposes of the forest industry in the north.
Concerns have been raised by some forestry owners that the Port of Gisborne will be restricted for
volume as age profile of all major east coast forests are similar and the Eastland Port will not be able
to cater for all of this volume of circa 35M tonnes in particular as majority of this volume is north of
Gisborne and lends itself to short haul road to Gisborne. Napier will have to play a significant part in
particular for forests south of Gisborne.
6.2 Carting of Aggregate
Another possibility for rail on the Gisborne line is the carting of aggregate from the Mohaka River.
There are understood to be prospects for aggregate from the river to be carried by rail wagon to
markets in Napier, Gisborne, and possibly further afield.
The venture is understood to be at the investigation stage only. It therefore still remains to be seen
whether or not it will proceed. However, if it does proceed, it could potentially mean the cartage of up
to 40,000 tonnes per annum of aggregate on the Napier – Gisborne line. According to the Hawke's
Bay Regional Council Works Dept, which oversees the management of regional gravel resources,
11
40,000 tonnes is about the maximum sustainable annual take from the Mohaka River .
An additional 40,000 tonnes, on top of the normalised 50,000 tonnes of freight already carried, would
bring the total volume on the line (or at least part of the line) up to about 90,000 tonnes per year.
Although still short of KiwiRail’s target, this amount of freight would come close enough to the
minimum threshold for what is a viable loading for continued maintenance of the Napier to Gisborne
line.
Gravel has been carried out of Raupunga by rail before, but this was discontinued about 5 – 6 years
ago. It remains to be seen whether the current investigation finds that the use of rail is once again a
viable alternative.
6.3 Other Opportunities
Other emerging freight opportunities in addition to those discussed above on the Napier to Gisborne
line being currently investigated include:
• New ply mill being commissioned in 2011 in Matawhero. Potential to move this product via
rail;
• Export timber via Napier, with woodchips being sent to Kawerau. KiwiRail has done a trial of
moving these woodchips via rail, but the wagons have a 5 day turn around due to having to
move the product down to Palmerston North and then up the country from there;
• Currently 25,000 tonnes of Squash goes to Japan in Hi Cube containers;
• A feasibility study is being undertaken for the movement of diesel from
Napier to Gisborne;
10
The mills are located about 700 metres from the railway line, with residential houses in between. A siding connection would require the
purchase of one or more houses in order to physically put the line through.
11
Pers comm. V. Byrne, HBRC Works Dept.
19
Commercial in Confidence• Bulk wine ex Gisborne is currently trucked to Auckland, with the potential to rail the product.
The challenge with this product is the long asset turn for the equipment used due to the need
to go south to Palmerston North before heading north;
• Meat products from Wairoa.
7. General Economic Benefits and Costs – Input from NZTA
7.1 Impacts on the State Highway 2
State Highway 2 between Gisborne and Napier (State Highway 2 (south)) is a parallel route for Napier
to Gisborne section of the PNGL rail line. Any impacts from a temporary or permanent closure of the
Napier to Gisborne section of PNGL would affect this route.
This analysis of impacts responds to key concerns raised by the community, and includes a
discussion of the potential impacts: on network efficiency, road safety, maintenance costs, and route
security.
7.2 Network efficiency
State highway 2 (south) is classified as Regional Strategic route. The classification provides of
indication of the general levels of service that road users can expect, and typical service targets for a
Regional Strategic route include: providing moderate to high journey speed (70-90 km-rural), targeted
improvements to network efficiency and development passing lane opportunities, a 3-4 start safety
rating and active maintenance programme.
Using State highway 2 (south), it is two-hundred and fifteen kilometres from Napier and Gisborne.
One hundred and ten kilometres of the route is identified as hilly or mountainous and the average
journey time between centres is just over 3 hours. In 2011, just over 742,000 vehicles travelled on this
road, with trucks making up 11 percent or 81,620 of this total.
2011 traffic counts SH2 Napier to Gisborne (at Tangoio telemetry site)
SH2 Napier to Gisborne (Tangoio)
north daily ave south daily ave total
Light vehicles 316522 867 344439 944 660961
11-17m trucks 6692 18 5718 16 12410
>17m trucks 48462 133 20370 56 68832
TOTAL 371676 1018 370527 1015 742203
% trucks 15% 7% 11%
While the daily average can be calculated at just over 220 trucks, in practice the pattern for heavy
vehicle movements is a mid week peak of around 200 – 300 trucks day (subject to seasonal
fluctuations) tailing off to 100 trucks daily before and after the weekends. These peaks are also
impacted by one off events, and the closure of the Waioeka Gorge (on SH2 north of Gisborne) on
3 March, three weeks before the washout on the PNGL rail line, has significant impact on number of
vehicles using State highway 2 (south). But while there was a spike in truck volumes following both of
these events, truck operators quickly adjusted, and heavy vehicle movements returned to normal
patterns.
20
Commercial in ConfidenceAverage seven day truck numbers (at Tangoio telemetry site)
Waioeka Gorge PNGL closure
If the fifty thousand tonnes of freight (per annum) in a normal year) currently moved by rail, was
transferred to road, it would be equivalent of 1,387 loaded 29-tonne truckloads per annum. That is a
daily average of just over 4 trucks. However, even that freight is transported according to current
pattern of mid week peaks, the increase in volume of trucks, compared to existing number of trucks
using the route is so small as to have a minimal impact on the overall level of service provide on the
state highway. In fact, the recent closure and continuing limited service (one lane) caused by slip in
the Waioeka gorge is likely to have had more impact.
Additionally even if, the forecast growth in tonnages for 2013 were to occur, at one hundred thousand
tonnes of freight, this would only be an additional 3789 truck a year, or 10 trucks a day, while forecast
growth for 2022 of one hundred and sixty-five thousand tonnes would only be an additional 5715
trucks a year, or 16 a day, neither of which will impact significantly on the total volume of trucks, the
capacity of the network or other road users.
Looking forward, the planned development of the route for use by High Productivity Motor Vehicles
12
(HPMV) , will increase the overall capacity of the state highway to increase the tonnage of freight,
without increasing the number of trucks. In addition, there is an active programme to improve passing
opportunities, and the 12/15 National Land Transport Program is likely to include the development of
6 additional passing opportunities.
7.3 Maintenance costs
For the Gisborne region, state highway maintenance and renewals per land kilometre were $39,447,
for 2009/10 year. For local roads, it was $7,332.00 per kilometre. For purposes of comparison, the
aggregated costs (for 2009/10 years) in Hawke's Bay region were $22,396, and $5,329 respectively.
A key reasons for high average costs in Gisborne, is the cost of maintaining State Highway 35. The
average maintenance costs for State Highway 2 (south), (a large portion of which is located in
Hawkes Bay) is similar to the Hawkes Bay.
However, the small number of additional truck movements as result of the closure of the line, when
considered in the context of the existing numbers of vehicles and other trucks currently using the
highway means that any impact on maintenance costs is minimal.
12
Currently, the route provides for limited HPMV capability. Strengthening, three bridges (with the Waikari Bridge the most
significant investment at $3-4 m) would enable the route to provide for full HPMV capability, and accommodate both longer and
heavier truck (up to 58 tonnes), further increasing its capacity.
21
Commercial in Confidence7.4 Road Safety
Although in general, this route is assessed as having a low to medium safety risk, a feature of the
safety profile for this region are the relatively high number of single vehicle crashes (including truck
rollovers) as a percentage total crashes. There is range of factors (driver behaviour, alcohol, vehicle
safety, network condition) that all contribute to this trend, but in relation to trucks, crashes have been
steadily trending down. The relatively small increase in the number of trucks if freight is transferred
from rail to road will not significantly impact on this trend, or the overall safety risk for the route.
Truck crashes on State Highways across Gisborne and Wairoa districts 2003-2012
Vehicle Local Body 2003 2004 2005 2006 2007 2008 2009 2010 2011 2012 Grand
Crash Type Total
Truck fatal Gisborne District 1 1 2 1 1 6
Wairoa District 3 1 1 1 6
Truck Gisborne District 1 1 2 2 1 1 1 3 12
serious
Wairoa District 2 3 4 1 1 11
Truck minor Gisborne District 1 1 5 3 5 5 3 5 3 1 32
Wairoa District 5 3 3 1 2 4 1 1 20
Truck non- Gisborne District 17 11 9 12 8 10 9 19 16 6 117
injury
Wairoa District 10 5 11 4 12 5 5 6 4 2 64
Total SH truck crashes 37 23 34 24 33 28 20 34 26 9 268
7.5 Route security
A key concern of community is the potential isolation risks to communities of only being able to rely on
the road network should the rail line remain closed. Annually, there is an average of 2-3 road
closures on each of the two sections of SH2 between Gisborne and Napier. Half of these closures
are for less than four hours, while 28 percent (15 closures) are between 4-10 hours duration. Long
duration closures are very infrequent and complete road closures for over 10 hours occur at a rate of
less than one a year. Any closures tend to be seasonal, with over half of the closures occurring in the
winter time.
13
SH2 Gisborne–Napier road closures over 10 year period May 2002-May 2012
SH2 Route Total Total < 4 hours 4 to 10 >10 hours # >4 hours % winter % closed
closure closures hours with no closures 18:00
hours route June-Sept 06:00
alternatives
Gisborne to 132 23 14 6 3 0 43% 22%
Wairoa
Wairoa to 265 31 13 9 9 14 55% 45%
Napier ex
Matahoura
Gorge
13
These records cover 61 road closure events over the 10 year period from May 2002 to May 2012. This comprises single lane closures,
complete closures and complete closures for part of the stated duration. Seven of the closure events on the Wairoa to Napier section will not
reoccur, as the Matahoura gorge has now been bypassed by a new alignment. These events are not included in this analysis.
22
Commercial in ConfidenceThe Gisborne to Wairoa section of SH2 is generally less affected by road closures, particularly those
of a long duration (over 10 hours). The impact of any closures is also reduced by the opportunity to
divert traffic onto an alternative route via Tiniroto and Frasertown. The Wairoa to Napier section of
SH2 has a higher incidence of road closures, particularly those over 10 hours. These longer closures
occur on average once per year. While, there is no single alternative route covering the Wairoa to
Napier section, there are a number of smaller detours which are able to bypass sections of the state
highway during closures. While most of these detours are better suited to cars than trucks, our best
information suggests that none of the road closures in the last 10 years have resulted in the
transhipment of freight (or passengers) from road to rail.
Cyclone Bola in 1988 is the only event (we have knowledge of) where the rail bridge over Wairoa
River, between Awamate Rd and Wairoa airport, was modified and opened as a shared ‘rail-road’
bridge for 19 months. This reduced the detour around Wairoa from 32km to 12km, until the
replacement road bridge was built in Wairoa town.
7.6 Conclusion
In our view, if the PNGL rail line between Napier and Gisborne is closed, any increase in volume of
trucks from the potential closure of the rail based on current volumes would have minimal impact on
the overall level of service on the highway. Equally, the network has sufficient capacity to cope with
any potential increase in truck volumes based on forecast increases in freight volumes.
There are also no significant resilience or route security issues. Although the route does suffer from
relatively frequent road closures, these are generally of short duration and there is no evidence that
the road closures in the last 10 years have resulted in the transhipment of freight (or passengers)
from road to rail. Although one-off events can always occur, possible closure would not have
significant impact on current safety risk for the highway.
8. Other Considerations
8.1 Tourism Impacts
Tourism is not such a significant contributor to the Gisborne economy as it is to say the Northland
economy. Tourism numbers in the Gisborne region are lower than just about any other region in New
Zealand because of Gisborne’s out of the way nature.
8.2 Future of the Port of Gisborne
Only if there were a major failure at the Port of Gisborne would this scenario be likely to change. If
the Port at Gisborne was no longer operating, or was grossly over-loaded, then there would be no sea
outlet for some or all of the logs and wood product (and squash) that is currently exported from there.
In that case, the timber that currently passes through the Port of Gisborne would either be carted to
Napier, or to Tauranga, or simply left unharvested in the forests because of the added (and often
already marginal) cost of transport.
The Port of Gisborne is confident of their future – although further investment will clearly be needed
within the next few years if Gisborne is to cope with the volumes of timber that have been forecast to
14
be harvested from the East Cape – if indeed those forecasts prove correct . A plan has been
developed for upgrading the Port, including the construction of new berths, storage areas, sea walls
15
and dredging. The estimated cost in 2001 was $46m .
If, however, the Port of Gisborne failed to make these improvements, there will be an increased risk of
the Port being unable to adequately cope with future growth in wood exports or even function as an
14
Sources from within the forest industry suggest that these forecasts will not prove correct. There are large amounts of timber north of
Gisborne but much of it is said to be in poor condition, with inadequate road access.
15
Source: GHD Report (2001) Tairawhiti Regional Development Plan, Gisborne & Wairoa Districts, p.30).
23
Commercial in ConfidenceYou can also read