Does Melbourne need another central city rail tunnel? - A report by Dr. Paul Mees Environment & Planning Program School of Global Studies, Social ...
←
→
Page content transcription
If your browser does not render page correctly, please read the page content below
Does Melbourne need another
  central city rail tunnel?

                     A report by

                    Dr. Paul Mees
           Environment & Planning Program
  School of Global Studies, Social Science & Planning
                   RMIT University
                      Melbourne

                      July 2008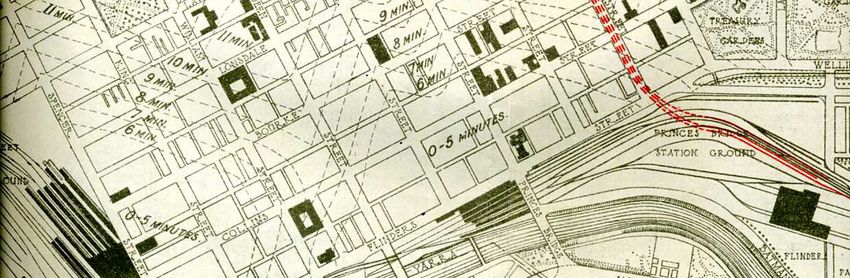
Does Melbourne need another central city rail tunnel?

                       Cover: from the 1929 Melbourne Town Plan

                                          2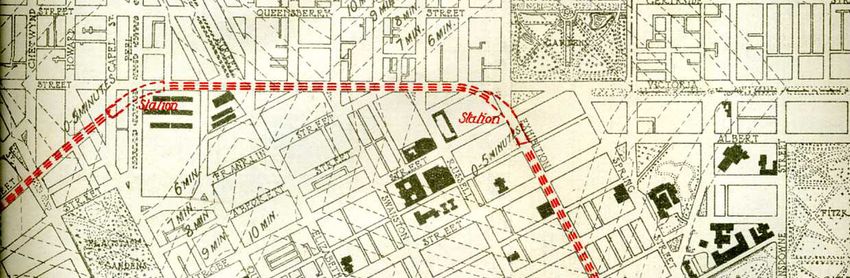
Does Melbourne need another central city rail tunnel?

Summary
• While other cities are extending their rail systems to cope with rising oil prices and
climate change, Melbourne has not built a new suburban railway since the Glen
Waverley line opened in 1930. The Department of Transport and Connex say the
system cannot be expanded because there is a ‘capacity crisis’ on the City Loop.

• The Eddington report has backed these claims, and proposes spending $8.5 billion
on a new central city rail tunnel that will not be completed until at least 2019. This
will mean no new rail extensions until then, and possibly longer because there may be
no money left.

• Melbourne appears poised to repeat the mistakes of the 1970s, when some $5 billion
was spend building the City Loop in anticipation of patronage increases that never
came. Because the loop used up all the available funds, Melbourne did not build any
new suburban rail lines.

• The tunnel proposed in the Eddington report is unnecessary. Melbourne’s rail
system is currently carrying substantially lower volumes of passengers and trains than
the City Loop and associated inner city works were designed to handle.

• Rail patronage in peak hour has increased by 20-25% over the last 5 years, but peak
services have hardly increased at all. The failure to increase services in line with this
modest increase in patronage has produced severe overcrowding.

• The current ‘capacity crisis’ is the result of inefficient operating practices that
developed during and after the 1980s, when rail patronage had fallen to only a third
the level the City Loop was expected to handle. Because all the staff with the skills
and ‘corporate memory’ needed to operate the system according to its original designs
left at or before privatization, neither Connex nor the Department has the ability to
efficiently utilize the capacity that has already been provided at such huge cost.

• The City Loop and inner city rail system has 8 in-bound tracks available for
suburban trains in peak hour (this is a third more than Sydney’s system offers). Each
of these trains can handle 24 trains an hour, giving a total capacity of 192 trains, more
than double the 94 trains currently operated in the busiest hour.

• The technical documents produced for the Eddington report detail the ‘reasons’
Connex and the Department offer for not utilizing the full available capacity. On
closer scrutiny, these all turn out to be examples of inefficient work practices that
would not be tolerated in a competently-run rail system.

• The Department of Transport has agreed to fix some of the work practices, enabling
hourly train throughput to increase from 94 trains currently to 136. This will provide
enough capacity for train lines that operate through Clifton Hill and Burnley, and the
Sandringham line, but not for the ‘Northern’ or ‘Caulfield’ groups. Strangely, the
Department has not considered fixing the remaining inefficiencies, even though in
some cases this would be easier than the changes they have agreed to implement.

                                            3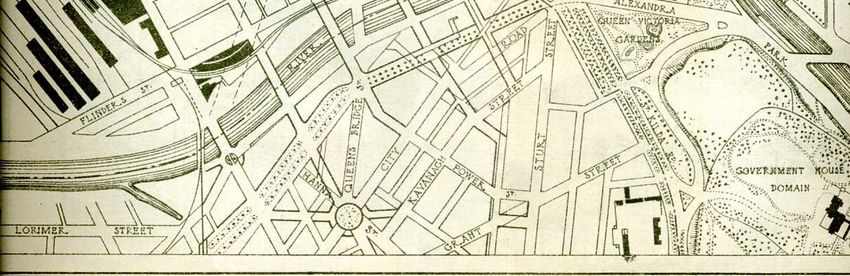
Does Melbourne need another central city rail tunnel?

• The proposed $8.5 billion tunnel would allow another 40 trains per hour to operate,
but fixing the remaining inefficient management practices would allow another 56
trains to run, providing more extra services at virtually no capital cost. The changes
required are terminating LaTrobe Valley peak period services at Flinders Street
instead of Southern Cross, reopening closed platforms at Flinders Street station,
reducing turnaround times at Flinders Street from 7.5 to 5 minutes (still longer than in
the 1920s), and improving ‘dwell times’ at stations to allow an extra 4 trains per track
per hour.

• The real problem with the Melbourne rail system is what the international expert
Professor Vukan Vuchic calls ‘self-defence of incompetence’, as the Department of
Transport and Connex collaborate to shield each other from suggestions that
efficiency can be improved. Rather than fixing this problem, Eddington proposes to
reward the incompetence with $8.5 billion in capital funding.

• Melbourne needs a dynamic, ‘European-style’ system of rail governance and
management. This will only come about through reform led by advice from
internationally recognised experts. Although adequate funding is also important, in
the absence of these changes the money will be wasted, and Melbourne will repeat the
sagas of Myki, the City Loop and Regional Fast Rail.

                                           4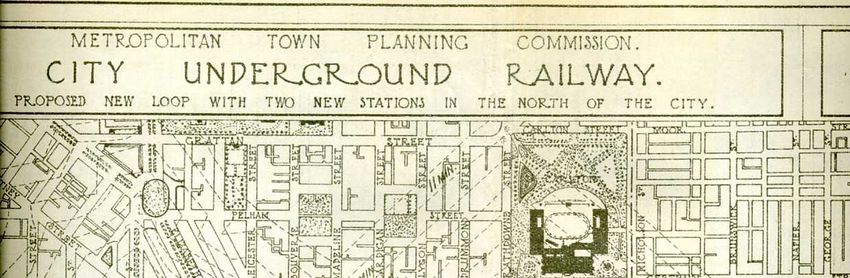
Does Melbourne need another central city rail tunnel?

     Does Melbourne need another central city rail tunnel?
Introduction

With world oil prices at record levels and widespread agreement on the dangers of
global warming, the need for a viable public transport alternative to the car has never
been clearer. Many Canadian and European cities made the necessary transport policy
shift years ago and are already well-placed to meet these challenges.

Perth is also enjoying the benefits of wise transport policy decisions made earlier this
decade. The $1.6 billion New Metro Rail project, which doubled the size of the city’s
rail system, was completed late last year with the opening of the new Southern
Railway to Mandurah. This new 72-kilometre line, incorporating an underground
section through the city centre, was built in less than four years, for around $1 billion.
It is already attracting 80% of its projected daily patronage of 50,000.

Rail patronage across Perth has increased six-fold in the last 20 years, but the Western
Australian government is not resting on its laurels. It has ordered new trains to cope
with rising demand, and is now planning a second round of rail extensions, with six
new or extended lines proposed, including a new link to Perth Airport.1

Meanwhile, in Melbourne, nothing seems to be happening. Rail patronage is
increasing after decades of decline, but service levels remain stagnant, resulting in
increasing overcrowding. There has not been a new suburban railway built since the
Glen Waverley line opened in 1930. The Department of Transport (formerly the
Department of Infrastructure) and Connex, the private rail operator, argue that nothing
can be done because growth in patronage means the system is at capacity and cannot
cope with additional trains. Interestingly, only four years ago the Department
convinced the government to bail Connex out with additional $1 billion in subsidies
because patronage was lower than had been expected.

The East-West Transport Needs Study by Sir Rod Eddington has endorsed the claims
that nothing can be done, and advocated spending $8.5 billion on a new rail tunnel
from Caulfield to Footscray, plus a new line between Footscray and Werribee (via
Deer Park and Tarneit), for V/Line (country) trains.2 The project would take until at
least 2019 to complete.

This report examines the central claim of the Department of Transport and the
Eddington Report, namely that the central city rail system is at capacity and cannot
accommodate significantly more services unless the Caulfield-Footscray tunnel is
built. It concludes that this claim is baseless, and can be shown to be so by
scrutinising the consultant reports available on Eddington’s own website. The central
city rail system has the capacity to accommodate twice the current level of service,

1
  ‘Public transport plays centre stage in Labor’s future vision’, Media Release, WA Premier, 29 June
2008 (www.mediastatements.wa.gov.au).
2
  Investing in Transport: East West Link Needs Assessment – A Study by Sir Rod Eddington, available
at: www.doi.vic.gov.au/eastwest (‘main report’), p. 214.

                                                  5
Does Melbourne need another central city rail tunnel?
and the real capacity problems lie in the Department of Transport and Connex, not in
the city loop.3
Why these questions are important
The Eddington report proposes the largest single investment in infrastructure in
Australian history, with a total cost (road and rail) 10 times that of Perth’s New Metro
Rail project, 18 times that of the Mandurah line, and 15 times the Alice Springs to
Darwin Railway. Yet, after more than a decade of construction and the expenditure of
all this money, Melbourne’s rail system would be much the same as it is now: no links
to the Airport, Doncaster, Monash or other places that should have been served by rail
years ago.
The Eddington Report expressly rejects a rail line to Doncaster, and since its release
Eddington has publicly ruled out a rail link to the airport. Eddington claims
Melbourne’s airport is not busy enough to justify a rail link –– unlike Perth’s,
apparently! Although he has not explicitly rejected other rail extensions, if his
recommendations are accepted these projects will not go ahead until at least 2020 –
and by then, there may well be no money left.
The $8.5 billion rail tunnel budget alone could pay for:
• elimination of all rail level crossings in greater Melbourne ($3 billion), plus
• new lines to East Doncaster, Rowville (via Monash), Mornington, Aurora, Mernda
(via South Morang) and Melbourne Airport ($2 billion), plus
• electrification of lines to Melton (via Caroline Springs, and including track
duplication), Sunbury and Cranbourne East, and duplication of single-track sections
on the Cranbourne, Hurstbridge, Epping, Lilydale, Belgrave and Altona lines ($1
billion), plus
• doubling the size of the train fleet ($2 billion).
This is not the first time Melbourne has faced the choice between massive investment
in expanding inner-city rail capacity, and extending the rail system to new regions of
Melbourne that have grown up since 1930. Almost 40 years ago, another transport
study released plans for the underground City Loop, plus suburban rail extensions.
The loop was built, but the extensions were not, because by the time the underground
opened, there was no money left for anything else, as the loop had cost the equivalent
of $5 billion in today’s money.
Perceptive critics of the City Loop pointed this out at the time, noting that the existing
rail infrastructure could handle much higher passenger volumes if operated
efficiently. Spending all the available funds on capacity enhancements, rather than
3
This report focuses on the central city rail system, and does not examine capacity issues on the
suburban rail system, other than those that relate to the proposed Tarneit line. An earlier paper by the
author explains how the Dandenong line can accommodate more trains without a third track; see
‘Infrastructure constraints or poor service planning? Increasing service to Melbourne’s City Loop and
Dandenong Rail Corridor’, Australasian Transport Research Forum, Melbourne, 2007.
6Does Melbourne need another central city rail tunnel?
improving efficiency, was a bad investment, they said. Despite the criticisms, the City
Loop was indeed built, and vastly expanded the capacity of the central city rail
system. But patronage actually declined for many years, and even now is much lower
than the loop was intended to handle. So why are we poised to repeat the mistake?
Efficient rail operators don’t spend money on capacity enhancements when the same
result can be achieved more cheaply by other means. The Swiss Federal Railways
(SBB), possibly the world’s most efficient operator, faces much greater increases in
patronage than Melbourne has had to deal with, and has responded with a program
called PULS-90:
The SBB’s PULS 90 program has the goal of planning and operating
Switzerland’s rail network as efficiently as possible, which is defined as
satisfying customer demand with a minimum level of infrastructure
investment.4
So why isn’t Melbourne adopting this approach? We should be following the lead of
the best rail planners and managers in the world, instead of rewarding poor
performance, and saving scarce capital funds to extend the trail system to serve new
regions of Melbourne.
Size and patronage of the Melbourne rail system
Melbourne’s electrified suburban rail system is very extensive by world standards: it’s
similar in size to the London Underground and larger than the Paris Metro.
Importantly, the inner city segment of the Melbourne rail system is very extensive,
having (as discussed below) eight in-bound tracks (and 8 corresponding out-bound
tracks). Sydney’s rail system has only 6 in-bound tracks, a figure that will rise to 7
upon completion of the proposed Sydney Metro.
In contrast with its physical extent, the Melbourne rail system carries low passenger
volumes by international standards, with 179 million trips made in 2006/075: see
figure 1. Tokyo’s rail network carries more passengers in a week than Melbourne’s
does in a year. Tokyo’s system is bigger than Melbourne’s, but the Paris Metro has
less track and smaller trains, but carries around 6 times as many passengers as
Melbourne’s. Even Toronto’s subway and Montreal’s Metro – which between them
are barely half the size of the Melbourne system – carry 317 and 274 million
passengers per annum. Importantly, neither the Toronto nor the Montreal system are
regarded as being at capacity, and are both currently being extended.
One instructive comparison is between the Melbourne rail system and the Northern
Line of London’s underground, shown in figure 2. The Northern Line carried 207
million passengers last year, compared with 179 million for the whole Melbourne
network, but is a fraction of the size, utilises smaller trains with lower passenger-
carrying capacity and has a much older signalling system (the signalling system in
Melbourne’s inner city was modernised in the late 1970s as part of the city loop
4
‘Rescheduling and Train Control: A New Framework for Traffic Control in Heavily Used Networks’,
by M. Luethi, F. Laube & G. Medossi, Paper for 86th Transportation Research Board Annual Meeting
2007, Washington DC.
5
2008/9 Victorian Budget Paper 3, p. 130.
7Does Melbourne need another central city rail tunnel?
project). Yet Transport for London believes the capacity of the Northern Line can be
substantially expanded with modern signalling and simplified operating patterns. 6
Fig. 1 Annual Rail Boardings in Selected Cities
14000
12000
10000
Passengers (millions)
8000
6000
4000
2000
0
M d
To rg
M nto
ris y
k ong
o
ew Hon oul
o
Sy l
de rid
Vi h
elb y
e
Ha na
a
un
rn
ky
Pa bwa
ic
etr
M dne
tré
bu
en
Un ad
un
ro
e
ou
ro
Y gK
To
M
S
m
on
M
Su
rg
or
on
nd
N
Lo
(Second graph: without Tokyo and Seoul)
1600
1400
Passengers (millions)
1200
1000
800
600
400
200
0
ris ay
ro
V h
er rid
ne
am a
Su g
Sy l
el ey
M d
o
T o rg
a
nn
ic
on
n
nt
tré
et
bu
Pa bw
ur
dn
ou
d
un
ie
ro
K
M
a
bo
on
M
gr
g
M
H
on
k
M
nd
or
H
Y
U
ew
on
N
nd
Lo
Sydney and Melbourne: 2006/07
Other cities: Figures from Jane’s Urban Transport Systems 2008–2009 (Webb, 2008); An International
Sourcebook of Automobile Dependence in Cities 1960–1990 (Kenworthy and Laube, 1999)
6
Northern Line information from www.tfl.gov.uk.
8Does Melbourne need another central city rail tunnel?
Fig.2 Comparison of Northern Line and Melbourne rail network
Transport for London, www.tfl.gov.uk
‘Analysis on Rail Capacity’, Public Transport Division, Department of Infrastructure, technical paper
to Eddington Report, March 2008, p.19.
How current patronage compares with what the city loop’s planners expected
Figure 3 comes from a Department of Transport report, and shows the changes in rail
patronage in Melbourne since World War II. It highlights the fact that the recent rises
in patronage followed a change in the methodology used to count passengers which
inflated the figures by comparison with the methods employed in previous years. In
particular, the current methodology counts a person who changes trains during the
course of a journey as having made two trips: in the past, this would have been
counted as a single trip. This means that current patronage is still lower that the peak
recorded in the early 1950s, when the figures are compared on a consistent basis.
More importantly, however, current patronage is dramatically lower than past rail
planners expected, and planned for (even without adjusting for the changed counting
methodology): see figure 4.
9Does Melbourne need another central city rail tunnel?
Fig.3. Rail patronage in Melbourne since 1945
Transport Demand Information Atlas for Victoria 2008, Volume 1: Melbourne, Department of
Transport, p.25.
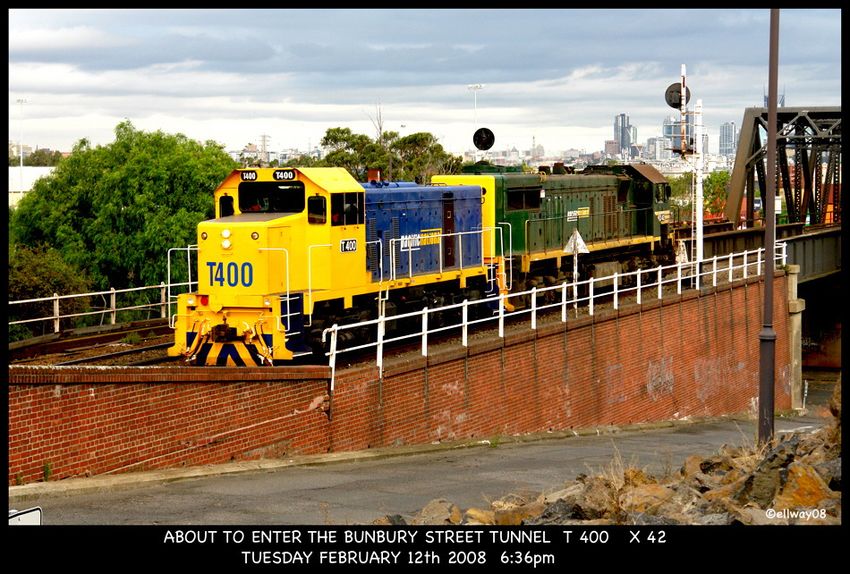
In the 1920s, rail patronage was growing rapidly, following the electrification of the
suburban system and expansion of the viaduct between Flinders Street and Spencer
Street from two to four tracks. In 1929, the Metropolitan Town Planning Commission
predicted that patronage would grow from 158 million in 1924 to 370 million in
19647, but stated:
So far as the Flinders-street station is concerned, its capacity to handle traffic
has by no means been exhausted. Automatic signalling, electric traction,
longer trains, the provision of two double tracks right through from Flinders-
street to North Melbourne, all greatly add to the passenger capacity of the
station… The present Flinders-street station is capable of handling a very large
increase in the present traffic.8
By 1929, Flinders Street Station was handling 113 suburban trains in the busiest hour
of the day, compared with only 94 in 2008 (see table 1 on page 17).9 Figure 5 shows
suburban train frequencies across the whole system in 1929. The Commission made it
clear that the rail system had the capacity to handle many more trains than this.
7
Metropolitan Town Planning Commission: First Report, 1925, pp, 12, 13.
8
p. 13.
9
5:00 to 5:59 pm. The 1929 Town Plan cites a figure of 116, at p. 130, but this includes three trains
departing at 6:00 pm. Figures calculated from 1929 and 2008 timetables; 2008 busiest hour is trains
arriving between 8:00 and 8:59 am.
10Does Melbourne need another central city rail tunnel?
Fig.4. Past projections of patronage increase compared with actual figures
Past projections of rail patronage increases
400
1964; 370
350
300 1985; 300
Boardings in millions
250
200
150
100
50
0
6
6
6
24
/4
/7
/0
19
45
75
05
19
19
20
Transport Demand Information Atlas for Victoria (2008); Plan of General Development, Melbourne
(1929); Melbourne Transportation Study (1969)
In its 1929 Plan of General Development, the Commission endorsed the Victorian
Railways Commissioners’ plan for a two-track underground ‘northern city railway’
(shown in figure 6), but this was intended to deal with congestion of passengers at
Flinders Street, not congestion of trains. However, this proposal (which did not
proceed, owing to the Depression) was predicated on the assumption that annual
patronage would increase to 370 million (figure 4).
The rail patronage growth predicted in the 1920s did not eventuate, because of the rise
of the car: by 1964, annual patronage was only 170 million trips, less than half the
level predicted. And the number of trains serving Flinders Street Station in the busiest
hour of the day had actually fallen, from 113 to 108.
The 1969 transport plan predicted that rail patronage would nearly double, to around
300 million, by 1985 (figure 4). Again, the predictions turned out to be incorrect:
patronage actually declined until the early 1980s, and did not begin a significant
recovery until the early 1990s. Although patronage is now higher than two decades
ago, it remains much lower than the planners of the 1960s expected, and the number
of suburban trains in the busiest hour has fallen to only 94 (table 1).
11Does Melbourne need another central city rail tunnel?
Fig.5. Suburban train frequencies, 1929
Plan of General Development, Melbourne, p.129.
.
12Does Melbourne need another central city rail tunnel?
Fig.6. Proposed Underground ‘Northern City Railway’, 1929
Plan of General Development, Melbourne, 1929, p.130.
13Does Melbourne need another central city rail tunnel?
The 1969 Transport Plan proposed a series of new suburban lines, and greatly
increased service frequencies and express running. To accommodate these additional
services, the plan proposed a four-track underground rail loop (figure 7). The loop
was intended to serve the anticipated 300 million passengers in 1985, plus ‘the
capacity for expansion beyond the design year’.10 Supplementary inner city works
complemented the loop, including a new signalling and control system, expansion of
Richmond station from 6 to 10 platforms (during the 1950s), two additional tracks to
Burnley and Footscray, and on the viaduct between Flinders Street and Southern
Cross/ Spencer Street stations.
Fig.7. Plan for City Loop, 1969
Melbourne Transportation Study, 1969, vol.3, p.38
The city loop was indeed built, largely following the 1969 plan shown above, but the
anticipated additional lines, train services and patronage never eventuated.11
10
p. 34.
11
Some third ‘express tracks’ proposed in the 1969 plan have not been built, but this is not a problem.
The 1969 plan underestimated the number of CBD workers who would come from inner suburban
areas, which at the time were regarded as ‘slums’, and overestimated outer suburban patronage. For
example, it proposed an express train from Mordialloc every 2 minutes in peak hour.
14Does Melbourne need another central city rail tunnel?
The city loop was a controversial project. Critics, notably the Shadow Transport
Minister Barry Jones, argued that it was wasteful and unnecessary. In particular, the
critics warned that the loop would use up all available capital, leaving nothing
remaining to fund the urgently needed new and extended suburban lines. The critics
were proven right: the loop was indeed built, but none of the proposed suburban
extensions were. And by the time it opened in 1981, rail patronage and service levels
were lower than they had been before work started on the loop. Patronage was so low
that the government-commissioned ‘Lonie Report’ proposed closing half a dozen
lightly-patronised suburban lines, proposals that were revived upon the election of the
Kennett government in 1992.
Although the line closure proposals of the 1980s and 1990s were eventually
withdrawn, the central problem remained. Melbourne had over-built its inner city rail
network, at enormous expense, to boost capacity in anticipation of patronage
increases that never eventuated. In doing so it had passed up the opportunity to extend
rail to new growth areas. How odd, then, that in 2008, with patronage still at much
lower levels than anticipated in the 1920s or the 1960s, it should be proposed to build
yet another, even more expensive, underground rail line through the city centre
instead of using the available inner-city capacity and extending the suburban rail
system to new growth areas.
How was the city loop planned to operate?
To understand how the loop was intended to operate, it is first necessary to understand
how the pre-existing system operated. From the 1920s, with the rail system electrified
and a four-track viaduct between Flinders and Spencer Street Stations, Flinders Street
operated mainly as a ‘through’ station. This means that the busiest lines between the
east and west were linked, with trains only pausing briefly at Flinders Street before
continuing to the other side of the city.
An example of this approach is shown in figure 8, taken from the 1929 timetable. The
Dandenong and Williamstown lines were ‘paired’ and services ran through Flinders
Street. Interestingly, it was possible then to travel from Footscray to Caulfield without
changing trains! Trains from the Upfield line (then the Fawkner line) ran through to
Kew (now closed), and the Sandringham and Broadmeadows lines were also linked.
Figure 9 shows the Broadmeadows (Essendon) to Sandringham service in the
morning peak period. It should be noted that this service utilised a single platform
(no. 8) at Flinders Street only, which means that trains were timed to arrive at this
platform at short intervals after the departure of the previous train (e.g. 8.01 arrived
only one minute after the departure of the 8.00; whilst there were only two-minute
gaps between the arrivals of the 8.21, 8.46 and 8.55 services, the preceding trains
departing at 8.19, 8.44 and 8.53). The Department of Transport claims now that at
least 3 minutes has to be allowed for this.12
12
SKM report, p. 27.
15Does Melbourne need another central city rail tunnel?
Fig.8. Dandenong to Williamstown service, 1929 timetable
1929 Suburban Lines timetable, Courtesy Public Records Office of Victoria
Fig.9. Essendon to Sandringham service, 1929 timetable
1929 Suburban Lines timetable, Courtesy Public Records Office of Victoria
In the 1920s, the Melbourne suburban train system operated at levels of efficiency
and reliability comparable with the very best rail systems in the world (at the time). A
strong culture of on-time running enabled trains to be scheduled at close intervals,
enabling efficient utilisation of infrastructure and rolling stock.
16Does Melbourne need another central city rail tunnel?
Not all trains could be operated as ‘through’ services, because there were (and still
are) more trains serving the east of Melbourne than the west. The city loop was
intended to address this problem and provide additional train ‘paths’ to allow more
services to operate. But the majority of trains were still intended to follow the
traditional model, operating as ‘through’ services between the east and west of
Melbourne:
Services would be arranged so that some of the trains on each line would run
to or from one of the loop lines and the remainder directly to or from…
Flinders Street…13
What happened after the loop opened?
By the time the city loop opened, patronage had declined to barely a third of the 300
million trips projected for 1985. Train services had also been cut back, as shown in
Table 1, which compares current service levels with past performance and the
predictions made for 1985 at the time the City Loop was planned (for explanations of
the various ‘groups’, see discussion below).
Table 1: Peak hour suburban train services to Flinders Street Station
Group/line 1929 1964 1985 2008
(actual) (actual) (predicted) (actual)
Northern 26 23 35 25
Clifton Hill 18 14 21 11
Burnley 22 23 43 29
Caulfield 17 23 58 22
Sandringham line 14 9 10 7
Total 113 108 181 94
Sources: Victorian Railways Suburban Timetable book 1929 (trains departing between 5:00 and 5:59
pm); Melbourne Transportation Plan 1969, Vol. 3, pp. 34 & 37 (1964 & 1985); Connex timetables
2008 (arrivals from 8:00 to 8:59 am).
Note: 1929 and 1964 totals include Port Melbourne and St Kilda lines; 1985 total also includes
proposed Doncaster line.
Without consciously planning to, rail managers used the surplus capacity as an
opportunity to relax the culture of efficiency and reliability established in the 1920s.
Work practices deteriorated, inefficient timetables were introduced, through-running
was abandoned and operating efficiency levels that had been achieved as long back as
13
1969 Transport Plan, vol 3, p. 34.
17Does Melbourne need another central city rail tunnel?
the 1920s gradually became unthinkably difficult. V/Line services from the LaTrobe
Valley, which had always terminated at Flinders Street to avoid clogging up the
viaduct and suburban platforms at Spencer Street, were extended into Spencer Street/
Southern Cross Station.14
In the early 1990s, financial problems led to further service cutbacks. On most lines,
this meant the partial or complete elimination of ‘direct to Flinders Street’ services,
with all or most trains operating through the loop. By this time, only a fraction of the
available capacity of the central city rail system was being utilised, but few people
were perturbed, since patronage and service levels were so low. Some platforms at
Flinders Street station were even decommissioned because they were not being used.
In the late 1990s the train system was privatised and most of the few remaining rail
planners who remembered how the system had been designed to operate left. A Public
Transport Division of the Department of Infrastructure was established to monitor the
private contracts, staffed by lawyers, accountants and others with expertise in contract
administration. Until about 2005, the main focus of this organization was dealing with
the unravelling of the 1999 privatisation, as the British firm National Express pulled
out of Victoria, and the remaining operators demanded (and won) large increases in
subsidy payments.
In this environment, nobody was working on operational or infrastructure planning
for the rail system. And by 2005, there was nobody available with the necessary skills
to do so had it been desired. The Public Transport Division focussed on expanding
bus services instead, as these were ‘easy’, and left rail planning to Connex.
Unfortunately nobody at Connex had the relevant skills either, as the firm simply
inherited the former Public Transport Corporation’s staff, minus the ‘best and
brightest’, who had left.
When the Public Transport Division finally noticed that patronage had begun to
increase, it had no idea how to respond. Lacking expertise in rail planning, it called on
ex-Vicroads road engineers in the Department of Infrastructure for advice.
Unfortunately, the skills involved in rail planning and road engineering are not
transferable, so the advice offered –– widen lines with third tracks at various points
on the suburban system, and resist all calls for new lines –– was useless. Around 18
months ago, the Public Transport Division re-hired a former PTC staffer (who had
moved interstate when the system was privatised) as a consultant to advise it on rail
issues.
This one person, working part-time, has been the department’s –– and Eddington’s ––
sole source of advice. He has simply not had the time or the assistance (i.e. from other
staff with the necessary skills) to examine the issues thoroughly. Neither Sir Rod
Eddington nor any of his study team have any expertise in rail planning15; nor was any
advice sought from outside experts.
14
The V/Line (country) platforms at Southern Cross can only be accessed from the North/West, so
trains coming from the East have to stop at the suburban platforms. For this reason, trains from
Gippsland terminated at Flinders Street for over a century until the late 1980s.
15
Staff are listed on p. 1 of the Eddington report.
18Does Melbourne need another central city rail tunnel?
So what is causing the overcrowding?
Reported rail patronage has increased by around a third over the last five years.
However, as indicated above, some of the apparent increase is a result of the change
in estimation methodology in 2005. In addition, off-peak patronage has risen faster
than peak patronage, due to measures such as discounted weekend fares. So the
increase in peak demand over the last five years is around 20-25%.
A modest increase in peak demand like this should not present problems for a rail
network that was designed to carry much higher volumes. So why has overcrowding
become so severe?
The simple answer is that there has been virtually no increase in peak period suburban
services over the last 10 years, let alone the last five. This can be seen from figure 10,
taken from a recent document produced by the Department, which shows that overall
train service levels have barely changed over the last five years.
Fig.10. Level of service provision, 2001/02–2006/07
‘Understanding and Forecasting Metropolitan Public Transport Patronage’, Department of Transport,
Public Transport Division, 2008, p.34.
The lack of change in peak hour can be illustrated by considering the Williamstown,
Werribee and Sydenham lines, three routes where patronage is growing rapidly due to
population growth plus an increased propensity for workers to be employed in the city
centre. The 1998 ‘Bayside Trains’ timetable for these lines shows that in the busiest
hour, between 8:00 and 8:59 am, 3 Williamstown, 4 Werribee and 4 Sydenham (then
St Albans) line trains arrived at Flinders Street Station. Ten years later, there are now
19Does Melbourne need another central city rail tunnel?
3 Williamstown, 5 Werribee and 5 Sydenham trains arriving in this hour: there have
been no new services on the Williamstown line and only one each on the other two.
Other lines, such as Alamein, Glen Waverley and Belgrave/Lilydale, have seen no
additional peak hour services at all over the last decade. No wonder crowding has
increased!
It may seem surprising that there has been so little increase in service, because there
have been regular announcements of additional services over the last decade.
Unfortunately, these announcements have been public relations exercises designed to
obscure the absence of real change.
For example, in April this year, ‘the biggest shake up of train services since the city
loop’ was announced, featuring an ostensible 105 new services per week.16 On closer
examination, it turns out that only five of these additional weekly services represented
a train running to the city in the busiest hour of the morning peak (the 8.22 Oakleigh
to Flinders Street), and none at all left Flinders Street in the evening peak hour (5:00
to 5:59 pm). Thirty of these 105 ‘new services’ were extra shuttle trains between
Frankston and Stony Point; ten services were already-existing trains that simply
started their runs earlier (e.g. at Frankston instead of Mordialloc); fifteen were empty
‘counter-peak’ (e.g. to the city in the afternoon) services that had been altered to pick
up passengers; the remaining 45 were ‘shoulder’ (i.e. near, but not during, the peak)
trains. In any event, more than 12,000 suburban trains run across the system every
week, so even if there had been 105 genuine new services, this would represent an
increase of less than one per cent.
So the simple explanation for overcrowding on the rail system is that peak-period
patronage has increased 20-25%, but service levels have barely changed at all,
especially in peak period. Given that the Department of Infrastructure/ Transport
released the Melbourne 2030 strategy back in 2002, which projected that patronage
would more than double by 2020, the Department’s inability to accommodate even
such a modest rise in numbers reflects poorly on its competence.
How many trains can the existing infrastructure accommodate?
It is surprising that, with the exception of works by the present author, none of the
documents produced on the capacity of the Melbourne rail system have relied on, or
even referred to, the accepted manuals that set out international best practice in urban
rail operations. The two leading urban rail capacity and operations manuals, at least in
the English-speaking world, are:
• Urban Transit: Systems and Technology (2007, John Wiley & Sons, New
Jersey), by Professor Vukan R. Vuchic of the University of Pennsylvania; and
• Transit Capacity and Quality of Service Manual (2nd edition, 2003, TRB,
Washington DC), by the US Transportation Research Board.
Both manuals give consistent advice, and this report relies on them, except where
otherwise indicated. This report also discusses a technical appendix to the Eddington
16
Connex, ‘Our Plan’: New April Services, www.connexmelbourne.com.au/ourplan
20Does Melbourne need another central city rail tunnel?
report, East West Needs Study: Transport Supply and Demand (Existing and Future),
produced by engineering consultants Sinclair Knight Merz and Maunsell and
available from the Eddington website (‘the SKM report’).17 The SKM report sets out
some useful information about current operational practices on the Melbourne rail
system, but more importantly provides the only public statement of the reasons the
Department of Transport offer in support of their claims of limited capacity in the
existing inner city system.
Capacity is generally calculated per line or track, so the first thing to establish is the
number of tracks available for suburban trains entering the city centre. The SKM
report correctly identifies 8 such tracks for in-bound trains heading for Flinders Street
Station (corresponding with another 8 for out-bound trains): see figure 11.
Fig.11. Inner city rail system, showing line groups and 8 in-bound tracks
‘Northern’ Clifton Hill
Group Group
Burnley
Group
Sandringham
Line Caulfield
Group
The 8 tracks are:
• Two tracks for the ‘Northern group’, lines through North Melbourne station from
Williamstown, Werribee, Sydenham (Watergardens), Craigieburn (Broadmeadows)
and Upfield. One track runs through the city loop, the other via Southern Cross
Station. (Figure 11 actually shows three in-bound tracks through North Melbourne,
but the third track serves the V/Line country platforms at Southern Cross.)
• A single track for the Clifton Hill group through Jolimont station, connecting to a
city loop tunnel. This serves the Epping and Hurstbridge lines.
17
available from www.doi.vic.gov.au/eastwest (‘supporting/ technical documents and reports’).
21Does Melbourne need another central city rail tunnel?
• Two tracks for the Burnley group, through Richmond station, one via the loop and
one direct to Flinders Street. These serve the Belgrave, Lilydale, Alamein and Glen
Waverley lines.
• Two tracks for the Caulfield group, through South Yarra and Richmond Stations,
one loop, one direct. These serve the Dandenong (Pakenham, Cranbourne) and
Frankston lines.
• One track serving Sandringham trains. This runs through South Yarra and
Richmond, and runs direct to Flinders Street. It does not have access to the loop.
The next step is to estimate the number of trains each of the 8 tracks can carry. Both
Vuchic and the TRB manual explain that there is a theoretical capacity determined by
the signalling system, which must then be reduced to make room for an ‘operating
margin’ to accommodate minor delays and ensure that these do not hold up following
trains. The TRB manual says that ‘conventional train control systems can support a
throughput of up to 30 trains an hour with typical train length, performance, station
dwells and operating margins’, while noting that the Moscow Metro manages 40
trains an hour with extremely tight adherence to timetables.18 The Melbourne inner
city rail system has a control system of this conventional type (called ‘fixed block’).
Interestingly, the SKM report states: ‘The signalling capability in the city and inner
suburbs… generally allows for 2 minute headways…’19 –– i.e. 30 trains per hour.
In Melbourne, 30 trains per track per hour would allow a total of 240 suburban trains
an hour, well over double the 94 currently operated in the busiest hour. Vuchic
recommends operating at around 80 per cent of theoretical capacity to maintain
reliable operations: this would give 24 trains per track per hour, or 192 per hour
across the whole system. This would still enable twice the current service level, and is
considerably higher than the 145 suburban trains per hour the Department of
Transport estimates would be possible after the proposed Caulfield-Footscray tunnel
is built.20 So Eddington and the Department of Transport are proposing to spend $8.5
billion to provide less train-carrying capacity than already exists!
Why is the available capacity not being utilised?
Sir Rod Eddington does not discuss this question at all in his report, but the SKM
report, available on the Eddington website, sets out a series of ‘reasons’ the rail
system supposedly cannot accommodate 24 trains per track per hour. Virtually all of
the reasons offered are simply examples of poor management and operational
practices that could be remedied, and which would have been in any competently
managed rail system.
SKM report that the Department of Transport have agreed to fix some of the
operational problems, but not others. This increases the potential throughput of trains,
but only modestly (see table 2 below). In particular, the Department’s revised
18
TRB, p. 5-11.
19
SKM, p. 22.
20
DoT: Analysis on Rail Capacity (Technical Report to Eddington review, available from website), p.
33.
22Does Melbourne need another central city rail tunnel?
operating procedure provides no increase in capacity at all for the Northern Group,
but these are the services with the fastest-growing patronage. The measures with the
greatest potential to increase throughput, especially on the Northern Group, are
ignored, even though some of them are actually easier to implement than the
measures the Department has agreed to put in place.
The following discussion will consider first the operational restrictions the
Department agrees can be fixed, then those it wants to leave in place. However, first
we consider the potential impacts of the various changes. These are set out in Table 2.
Table 2 shows that, under current operational practices, the inner city rail system can
handle 17 more suburban trains than are being run in the busiest hour at present,
mostly by running more ‘direct’ services, an increase of less than 20%. The lines that
are actually closest to theoretical capacity are the Burnley Group, which are already
running one train ahead of supposed capacity (what this really shows is how slack the
‘current’ practices actually are). The key pressure points, however, are the Northern
and Caulfield groups, which serve urban growth corridors and have the most rapidly
growing patronage. The Northern group can accommodate another 7 trains an hour
under current practices; Caulfield another 6 trains.
Table 2: Number of suburban trains per hour
Line Existing Potential
2008 Current DoT Best
timetable practice proposals practice
Northern group
via loop 19 20 20 24
direct 6 12 12 24
total 25 32 32 48
Clifton Hill group 11 15 20 24
(all via loop)
Burnley group
via loop 21 20 20 24
direct 8 8 16 24
total 29 28 36 48
Caulfield group
via loop 20 20 20 24
direct 2 8 13 24
total 22 28 33 48
Sandringham line 7 8 15 24
(all direct)
Grand total 94 111 136 192
Sources: Connex timetables (2008); SKM report (current practice and DoT proposals); analysis below
(best practice).
23Does Melbourne need another central city rail tunnel?
Under the Department’s revised operating regime, another 25 trains an hour can be
provided. However, there is no increase on the Northern Group, where maximum
throughput remains at 32 trains per hour. Since the Northern group has the fastest-
growing patronage, it appears that more infrastructure is required in this corridor. But
under ‘best practice’ operating conditions, Northern Group throughput increases to 48
trains an hour, an increase of nearly 100% on current levels, removing the need for
new infrastructure.
The following sections explain how this is achieved.
Operational changes proposed by the Department of Transport
The SKM report details some operational changes proposed by the Department of
Transport. It describes these as ‘base case assumptions’ and ‘operating strategies’,
noting that they were developed as part of ‘work… in relation to the proposed north-
south rail tunnel through the CBD.’21 In other words, these changes do not represent
an assessment by SKM and their team of what could be achieved under ‘best
practice’: they simply report what the Department of Transport had already decided to
do of its own accord. Apparently, neither Eddington nor the Department asked the
consultants for advice about the capacity of the rail system under ‘best practice’
operating conditions.
Removing train conflicts arising from ‘limited sectorisation’
• 5 additional trains/ hour
The first reason offered by the Department for not utilising the available capacity is
conflicts between suburban trains on different lines and between suburban trains and
V/Line trains around the entrance to the V/Line terminal at Southern Cross Station.22
The main reason for this problem is the complicated pattern of services currently
operated, which increases the number of such conflicts.
The Department proposes to ameliorate this problem by simplifying train operations,
especially between North Melbourne and the City. In particular, running Werribee
and Williamstown line trains on the ‘direct’ route via Southern Cross rather than
through the loop eliminates the current practice, in which these trains must cross a
number of other lines to reach the loop entrance (because no direct entrance to the
loop was provided from the platform at North Melbourne used by these trains). These
trains would then be ‘through-routed’ to the Caulfield Group to eliminate layover
time at Flinders Street (see below). Interestingly, this change does not actually free up
any train paths, as can be seen by comparing the Northern group figures in the second
and third columns of Table 1.
The Department proposes dealing with a similar problem for Clifton Hill group
trains23 by reversing the direction in which the City Loop operates, and this allows the
21
SKM, p. 110.
22
SKM, pp. 24-5.
23
This problem exists because the underpass enabling these trains to enter the City Loop without
crossing out-bound trains, shown in Figure 7 to the left of the words ‘to Clifton Hill’, was not built, as
an economy measure. It would cost about $50-60 million to add this underpass now, as provision was
made for it when the Clifton Hill loop was built.)
24Does Melbourne need another central city rail tunnel?
number of trains per hour to increase from 15 to 20. (This approach will
inconvenience many Clifton Hill Group passengers, so it is surprising that alternative
options were not considered – such as running some services ‘direct to Flinders
Street’.)
Removing crew changes and ‘layovers’ at Flinders Street
• 20 additional trains/ hour
Currently, train crews change over at Flinders Street station, and trains operating on
‘direct’ routes reverse at Flinders Street as well (trains that run through the loop don’t
need to reverse, because running through the loop turns them around en route). The
time allowed for these manoeuvres, plus additional time included to permit late-
running trains to catch up to schedule, is called ‘layover time’. Layovers block
platforms at Flinders Street Station, thereby limiting train throughput. 24
Scheduling crew changes and other layovers at the busiest point in the rail system is
very inefficient. In well-run rail systems, layovers occur at suburban terminals where
more space is available.
The Department proposes ‘through running’ for ‘direct’ services between east and
west, and to move most layovers to suburban terminals. Interestingly, the Department
seems unaware that this amounts to a reinstatement of the operating regime in place
from the 1920s to the 1970s, a clear illustration of the loss of ‘corporate memory’.
Removing layovers enables additional trains to run on the ‘direct to Flinders Street’
tracks serving Burnley group, Caulfield group and Sandringham line services,
allowing a total of 20 extra services across these routes (compare second and third
columns in Table 1). However, the changes do not provide any additional space on
the critical Northern group, because of conflicts with V/Line services from the
LaTrobe Valley (discussed below).25
Operational changes not considered by the Department
The Eddington report and the Department claim the proposed East-West rail tunnel
will allow the operation of an additional 40 trains per hour, over and above the total of
136 per hour achievable under the Department’s proposed operational changes. But
efficiency improvements that could be achieved right now with the existing
infrastructure would permit an even greater increase, of 56 trains per hour. The
majority of these additional trains, 31 in all, would be on the critical Northern and
Caulfield groups.
Terminate LaTrobe Valley V/Line trains at Flinders Street
• 15 additional trains/ hour – all on Northern & Caulfield groups
As Table 1 indicates, the Department of Transport’s revised operating procedures
would allow 20 trains per hour on the city loop lines serving the Northern and
Caulfield groups, but only 12 and 13 on each of the ‘direct’ lines. The SKM report
24
SKM, pp. 25-6.
25
SKM, p. 110.
25Does Melbourne need another central city rail tunnel?
explains that the difference of 15 trains an hour is due to two morning peak V/Line
services from the LaTrobe Valley. These trains take up suburban platform space at
Flinders Street and Southern Cross, and train paths on the viaduct between the two
stations. It is not possible to run these trains into the V/Line terminal at Southern
Cross, as this can only be accessed from the North/West.26
The obvious question is: why are these two V/Line trains operated in a way that
prevents the operation of 15 suburban services per hour, which can carry 12,000
passengers, on the very lines that have the fastest-growing patronage? Why are these
trains not terminated at Flinders Street station instead?
The answer provided by the Department, and quoted in the SKM report, is revealing,
because it again demonstrates the loss of corporate memory:
Southern Cross station has always been considered the start and finish point
for all V/line services.27
This statement is simply false. From the opening of the LaTrobe Valley line in the
1880s until about 20 years ago, all services operated to and from Flinders Street, not
Spencer Street/ Southern Cross. Figure 12, for example, shows the 1967 timetable,
with all trains departing from Flinders Street.
LaTrobe Valley trains used to arrive and depart from Platform 1 at Flinders Street
Station, which had waiting rooms, a cafeteria and country booking office. To reach
this platform, the trains had to cross up to 8 tracks between Flinders Street and
Richmond, as Platform 1 is on the north side, while the Dandenong/ LaTrobe Valley
tracks are on the south side. To eliminate this problem, a new terminal for country
services was built on the south side of the station, as part of the works accompanying
construction of the City Loop. This terminal, which is now Platforms 12 and 13, is
shown in green at the bottom of the 1969 loop plan reproduced above as Figure 7.
The extension of V/Line services to Southern Cross in the late 1980s was partly a
response to the unattractive facilities on Platforms 12 and 13 (the environment is even
worse now, as these platforms sit underneath Federation Square), and partly a
response to the surplus track capacity available after the City Loop opened. Despite
the unattractive environment, the vast majority of LaTrobe Valley V/Line passengers
board and alight trains at Flinders Street: most of the rest do so at Richmond
(transferring to or from City Loop services).
The two morning peak LaTrobe Valley V/Line trains between them carry a few dozen
passengers to and from Southern Cross. There is no justification for continuing this
practice when it prevents another 15 trains per hour, capable of carrying 12,000
passengers, operating on the busiest suburban lines. LaTrobe Valley services should
terminate at Flinders Street, at least in peak hour.
LaTrobe Valley passengers do, however, deserve a better terminus than the
subterranean environment of Platforms 12 and 13. The terminus should be at Platform
26
SKM Report, pp. 26, 111 (fig. 3.9) and 112 (fig. 3.11).
27
SKM report, p. 26.
26Does Melbourne need another central city rail tunnel?
10 on the south side of the station by the Yarra River (this was not available at the
time the loop was built, as it served the St Kilda and Port Melbourne lines, but these
lines were converted to light rail 20 years ago). Since Platform 10 is now used by
Sandringham trains, it will be necessary to reopen Platform 11, the last platform
before the Yarra River, which was decommissioned during the 1990s. This is
discussed in the next section.
Fig.12. Services to the LaTrobe Valley, 1967 timetable
Reopen closed platforms at Flinders Street Station
• Additional trains counted under other changes
Prior to the 1990s, Flinders Street Station had 17 Platforms: numbers 1 through 16
and ‘Platform 1 West’ at the Southern Cross Station end of Platform 1. Following the
service cutbacks of the early 1990s, five of these platforms were decommissioned (1
West, 11, 14, 15 and 16). Platform 14 (directly East of Platform 1) has recently been
reopened as a back-up for Clifton Hill Group services, and should remain open for
27Does Melbourne need another central city rail tunnel?
this purpose. Platforms 15 and 16 cannot be reopened, as they have been incorporated
into Federation Square.
Platform 11 by the Yarra River is basically intact, except that the tracks have been
removed and the overhead and signalling decommissioned. It should be reinstated, at
a cost of $3-4 million, for Sandringham train services. This will allow the adjacent
Platform 10 to be used by V/Line services from the LaTrobe Valley (and by
Sandringham services when unoccupied by V/Line trains). Platforms 12 and 13
should remain open as a back-up for peak-period Sandringham services.
Reduce turnaround times for Burnley group and Sandringham ‘direct’ trains
• 9 additional trains/ hour
Under the Department’s proposed revised operating procedures, most trains from the
South and East of Melbourne would not need to reverse at Flinders Street, as they
would either run through the loop, or continue to/from the North/ West. However,
‘direct’ trains on the Burnley group, and all trains on the Sandringham line, would
still need to do so.
The Department claims that only 16 Burnley group ‘direct’ services per hour can be
reversed at Flinders Street (see 3rd column of Table 1), even though two platforms (3
and 4) would be available.28 This amounts to one train every 7.5 minutes on each
platform. As Figure 9 shows, in 1929 this process could be accommodated in 3-4
minutes (note the 7:49 and 8:00 am departures to Sandringham from Flinders Street),
and the Victorian Railways Commissioners believed that operational changes would
‘enable the trains to be run at closer intervals during the absolute peak of traffic’.29
So why does it now take twice as long to reverse a train as it did 80 years ago? The
US TRB Capacity Manual says:
Correctly designed and operated turnbacks should not be a constraint on
capacity.30
The Manual estimates that turnback times for trains can be reduced to as little as 175
seconds (just under 3 minutes) with efficient operations – including ‘set back crewing,
where a crew from a previous train is pre-positioned at the far end of the train.’31
Table 1 allows for a turnback time of 5 minutes per train per platform, giving a
combined frequency across the two platforms serving Burnley group direct trains of
2.5 minutes, or 24 trains per hour (Table 1). This is considerably more generous than
the margin recommended in the operating manuals, or even than Melbourne practice
of the 1920s.
With up to three platforms available for reversing Sandringham trains (see discussion
above), it should be even easier to achieve a throughput of 24 trains per hour.
28
SKM report, p. 112 (figure 3.12).
29
MTPC, First Report, 1925, p. 13.
30
p. 5-15.
31
pp. 5-16, 5-17.
28Does Melbourne need another central city rail tunnel?
As the SKM report notes, projected demand in 2021 for the Burnley group and
Sandringham line is for fewer trains that the available capacity would allow, even
under the lower Department of Transport capacity estimates.32 On the Burnley group,
this means that there would be some spare capacity, while on the Sandringham line,
the spare capacity would be used to accommodate V/Line services from the La Trobe
Valley. The most efficient way of doing so, in the critical morning peak where the
number of train services operated is higher than in the evening peak, would be to add
a crossover between South Yarra and Richmond stations allowing V/Line services to
switch across to the Sandringham line before reaching Richmond station. The cost of
such a crossover, including changes to signalling, would be approximately $2 million.
Increase train throughput from 20 to 24 trains per line per hour
• Additional 32 trains/ hour
Two-minute headways, or 30 trains per hour, are regarded as easily achievable by
conventional urban rail systems. As indicated above, the signalling in and around the
City Loop was designed to accommodate this figure. But the Department of Transport
insists that 3 minutes, or 20 trains, is the limit. The difference may not sound much,
but even the difference between 3.0 and 2.5 minutes, the rather relaxed standard
proposed in this report, amounts to an additional 32 trains per hour across the 8-track
system.
Why should Melbourne be unable to achieve operating frequencies considerably more
relaxed than already managed in overseas systems, including those with cramped
stations, older signalling and more severe crowding? The SKM report sets out a series
of excuses offered by the Department of Transport: these relate mainly to ‘long dwell
times’ at stations, which are caused by poor operating practices that simply would not
be tolerated on any competently run rail system.
We will discuss these issues in turn, but first note that even the SKM report admits
that:
A comparison with other international railway operators showed that dwell
time performance could be significantly improved in the City loop…33
However, strangely, this suggestion was not followed up: neither the SKM report nor
the Eddington report considers how many additional trains could be operated if dwell
times were significantly improved.
Passengers in wheelchairs
The first excuse is passengers in wheelchairs: ‘The presence of wheelchair passengers
affects 2-3% of trains and increased the dwell time [by] up to 55 seconds.’34 One
would think from reading this that Melbourne is the only city in the world where
people in wheelchairs use trains! The US Department of Transport’s Manual says that
wheelchair passengers need not cause delays in systems with ‘high platform boarding’
(like Melbourne’s trains), because ‘the movement of wheelchairs on level services is
generally faster than walking passengers..’35
32
SKM report, p. 113, table 3-9.
33
SKM report, p. 27.
34
SKM, p. 27.
35
Manual, p. 5-37.
29You can also read