OURWINNIPEG REVIEW PHASE 1 REPORT TO THE COMMUNITY 03/14/2018 - SPEAKUPWINNIPEG
←
→
Page content transcription
If your browser does not render page correctly, please read the page content below
OU R WI N N I P EG
RE VIE W
PHASE 1 REPORT TO THE COMMUNITY
03/14/2018
CON TE N T S
   ACKNOWLEDGEMENT.................................................................. 2

   THE OURWINNIPEG REVIEW PROCESS - INTRODUCTION......... 4
     Purpose of this Report.............................................................. 4

     What is OurWinnipeg?.............................................................. 4

     Why are we reviewing OurWinnipeg?.......................................... 4

     How are we reviewing OurWinnipeg?.......................................... 5

   WHAT WE LEARNED: BACKGROUND RESEARCH......................... 6

   WHAT WE HEARD: COMMUNITY FEEDBACK............................... 8

     Why we need to hear from Winnipeggers.................................... 9

     Public engagement activities................................................... 10

     Summary of feedback............................................................. 13

   HOW WE GROW........................................................................ 14

   GETTING AROUND IN THE CITY............................................... 16

   QUALITY OF LIFE...................................................................... 18

   HEALTH & SAFETY.................................................................... 20

   CIVIC ENGAGEMENT & GOVERNANCE....................................... 22

   WHERE WE GO FROM HERE...................................................... 24

   APPENDIX A: SUMMARY OF BACKGROUND RESEARCH............ 26

   APPENDIX B: PUBLIC ENGAGEMENT......................................... 35
A C K NO WLEDGEM EN T

          2
Winnipeg is located within Treaty Number 1
Territory, the traditional lands of the Anishinabe
(Ojibway), Ininew (Cree), Oji-Cree, Dene, and
Dakota, and is the Birthplace of the Métis
Nation and the Heart of the Métis Nation
Homeland. Whether as a community of the
original inhabitants of this land or inhabitants
of this land by birth or adoption, Winnipeggers
all share the goal to make our city a better
place to live based on mutual respect, equal
opportunity, and hope. The review of the City’s
OurWinnipeg development plan acknowledges
the City’s commitment to establishing and
maintaining mutually respectful relationships
with First Nations, Métis, and Inuit governments,
organizations and individuals.

The project team would like to acknowledge
the efforts of all those who participated in the
work conducted in this phase and supported
the development of this report: members of the
community who participated in public engagement
activities, members of the Citizen Advisory
Committee for their insight and advice, and
members of the public service who contributed to
and reviewed the content of this report.

       3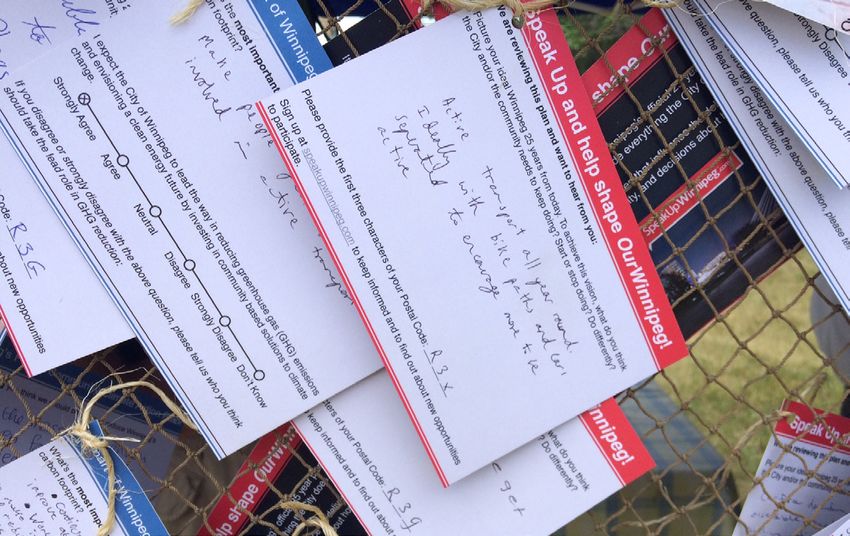
T HE OUR WI NNI P EG
RE V IE W P R O CESS
- I N TR ODUCTI O N
                              WHAT IS OURWINNIPEG?
  PURPOSE OF THIS
  REPORT                      OurWinnipeg is the City of Winnipeg’s 25-year
                              development plan. This plan is required by the
  This report marks the       Province of Manitoba’s City of Winnipeg Charter. The
  end of the first phase      Charter requires that any public work, undertaking or
  of the OurWinnipeg          development (such as the Financial Management Plan,
  review, and reports         departmental strategic plans, and by-laws) must be
  on the work done to         consistent with the City's development plan; therefore,
  date. It summarizes         OurWinnipeg is intended to guide everything the City
  issues facing our           does. It provides a vision and policies that influence
  community as                the delivery of City services, how we get around in the
  determined through          city, and decisions about how the city grows.
  our research and
  community                   OurWinnipeg was adopted by Council in 2011, along
  consultation. It also       with four supporting direction strategies. One of the
  provides a brief            supporting strategies, Complete Communities, was
  overview of what            adopted as a by-law and contains more specific policies
  these observations          related to sustainable land uses and development.
  mean for Phase 2, the       The other direction strategies are Sustainable
  next steps of the           Transportation, Sustainable Water and Waste, and A
  review process.             Sustainable Winnipeg.

WHY ARE WE REVIEWING OURWINNIPEG?

The City of Winnipeg Charter                  The City’s goal is to update Winnipeg’s
requires that a review of the City’s          development plan (and potentially other
development plan be initiated within          plans) to include a renewed vision for
five years after it was adopted (this         Winnipeg, as well as policies that
review was initiated in late 2016).           support Winnipeggers’ physical, social,
Regardless of this requirement, it is         environmental and economic priorities.
important to ensure that the plan             The updated plan will also include ideas
still aligns with the vision and needs        about how to implement the plan, and
of our growing and changing                   measures to tell us if we are reaching
population.                                   our goals.

                                          4
HOW ARE WE REVIEWING OURWINNIPEG?

The OurWinnipeg review is being conducted in three phases and is expected to take
approximately 18 months to complete.

                     We are here

         Imagine                Action           Implementation Planning Present Plan
 Set VisionPhase          Plan and Prototype
                                          Phase 2
                   1
            and Targets                                            Phase 3
                                                          Prepare Strategy           Plan Approval
                                                                                        Council       and
                                                                                                Meeting
   (July – Sept what’s     (Sept – Dec
                2017) Important        2017)
                                   Confirming the Vision (Sept
                                                          and –  Dec 2017)
 Understanding                                                 Finalizing the Plan       (Spring 2018)
                                                                                      Implementation
    and Imagining the Future        Exploring Possibilities

  2017                         2018                                    2019

                                                                                                Public
                                                    Consultation 2            Consultation 3
                      Consultation 1                                                            Hearing

                                                                                 Figure 1: Project Timeline

Phase 1: Understanding What’s Important and Imagining the Future
Phase 1 activities focused on listening to community members, and understanding
how the City can help increase the quality of life for Winnipeggers, both today and
in the future. This involved talking to people to gain an understanding of
community perspectives, values and priorities; analyzing statistical data; initiating
background studies; and identifying community trends. Phase 1 culminated with
this Phase 1 Report to the Community, which provides a summary of what we
learned from background research and what we heard from Phase 1 public
engagement.

Phase 2: Confirming the Vision and Exploring the Possibilities
Phase 2 will take what we learned in Phase 1 and use it to confirm a community vision
for Winnipeg’s future physical, social, environmental and economic development.
Existing OurWinnipeg policy will be compared with what we heard in Phase 1, to
determine which policies are still relevant to that vision, and which ones could be
changed to better address the current and future needs of Winnipeggers. This phase
will also involve input from community members.

Phase 3: Finalizing the Plan
Much of Phase 3 will be spent reflecting on and recording what was learned in
Phases 1 and 2. The aim is to update the OurWinnipeg planning package to better
reflect community vision, needs, and priorities as Winnipeg grows and changes. The
draft plan will be shared with the community to let us know if we got it right.

Following Phase 3, revisions may be made to the draft plan before the new plan is
advanced to Council for adoption.

                                                     5
WHAT WE LEAR NE D
Background Research:                                                                                  We have enough space
                                                                                                      for future housing and
                                                                                                      industrial development
                                                                   But wages are
         Since 1998, Winnipeg’s property        From 2002          10% below the                           But servicing this land
         taxes increased by 9%
                                                to 2016,           Canadian average                        is an issue
                                                grew by 14%
         Increases in other Canadian            Employment

         cities averaged 96%
                                                                             Over the last 4 years,
                                                                             the City has grown by about
              We’re short
              on cash                                                        10,000 people per year,
                                                                             due mostly to immigration

                    more                   diverse!                        We’re
             are                                                           young
We                                                                                                    In 2016, over 92,000
                                                                                                      people identified as
                                                                                                      Indigenous.
                                                                                                      That’s 12% of Winnipeg!
     In 1996, 1 in 10 were visible minorities

    Now it is 1 in 4                                    The largest age cohort
                                                        in Winnipeg is people
                                                        25-35 years old

                               In 2016, 80.1% of commuters used    By 2040, we expect 200,000 more
                               a car to get to work. 13.6% used    people & 100,000 housing starts.
                               transit, & 6.3% walked or biked.
                                                                   60% = multi-family units
                                                                   40% = single family.

                                                                      Over the past 5 years, the City spent about
                                                                      $690 per person on infrastructure
                                                                      That’s about $90 less per person than other cities

                                                              Figure 2: What We Learned: Background Research

                                                             6
The review of OurWinnipeg began by
gathering information to understand how
the community is growing and changing.
This involved compiling information about
the community’s current and projected
demographic and economic condition
to identify community characteristics, and
ultimately understand requirements
associated with accommodating the needs of
all community members.
Within this phase of the review, we have
reviewed existing data that is available
through such sources as Statistics Canada,
the City of Winnipeg Community Trends and
Performance Report and development permit
data. We have also undertaken background
research in areas where information was
dated or where gaps existed. This included
detailed study of our employment, commercial
and residential lands to better understand
future needs. The Conference Board of
Canada was also commissioned to complete a
long term Population, Housing and Economic
Forecast.

The infographic on (page 6) provides an
overview of the key findings, statistics and
trends from the background research. A more
detailed description of this information can be
found in Appendix A.

      7
WHAT WE HEAR D
Community Feedback:
                                                                                                 500+ participants
                                                                                                 20+ presentations

                                                                     30“Pop Up”
                                                                                                 workshops & meetings

                    UE
                        S                           724
  P1
     0       ISS                                    Idea                      Consultations
TO nsit
    ra
 1.T cling                                 ess
                                       ssn ities
                                                    Cards
     C y          g              e l e
  2.     alk
               in            m             un
   3. W using ng Co
                        /ho           mm                               COUNTLESS networks
           o
     4. H mple nsit
                         ti                                            and people who helped
            o              ra
      5. C pid T
              a                            Par
                                               ks                      spread the word!        Implementation

                                                                                               is KEY
       6 .  R          i c              nd
                   f f               a
                ra             ion
         7. T creat n
                R e              w
           8 .             n t o         ces
                    ow            Spa
             9. D ublic
                       P
               10.

 Different housing types and                                                                    Economic, social
 levels of affordability will allow                                                             & environmental
                                                                                                sustainability
                                                            14
 for more diverse communities                                      Community Advisory
 and allow aging in place                                                                       must guide us
                                                                   Committee members

                                 Implement the plans
                                we already have                                                2,500 visitors went to
                                                                                               SpeakUpWinnipeg.com
 Reflect the                                                                   Work
 diversity in                                                                  Better          1,000+ email addresses
 our city!                                                                     Together             on email list
                                        Support for the arts, parks,
                                        libraries, community gardens                             524 online surveys

                                                       Put in the funds for long-term
                                                       [infrastructure] improvements

                                                                              Figure 3: What We Heard: Community Feedback

                                                                          8
WHY WE NEED TO HEAR FROM
WINNIPEGGERS
OurWinnipeg policies are intended
to positively impact the lives of all
Winnipeggers, so it is important to hear
from Winnipeggers in every phase of this
review. We need to understand what is
perceived as being important to achieving
a high quality of life so that the revised
policies presented to City Council at the end
of this review reflect community values and
priorities.
9PUBLIC ENGAGEMENT ACTIVITIES
Public engagement activities have, the information hub throughout
and will continue to, aim to reach and the review, providing blogs and
involve as many Winnipeggers with as information about the review process,
many backgrounds and experiences OurWinnipeg documents and reports,
as possible through both in-person and public engagement opportunities.
and online opportunities. Content is provided in both English
and French. Having this online
The OurWinnipeg review and presence increases opportunities for
participation opportunities were participation, providing those who
promoted through an official launch may not have time or desire to attend
(September 7, 2017), which was in-person engagement events with
followed by media coverage and another option to participate.
a radio interview. The project
website was promoted at all in- As we know that there are many
person engagement events, through Winnipeggers who may not have
members of the Community Advisory access to the internet or a computer,
Committee, through the City’s Twitter in-person engagement provides
and Facebook accounts, as well opportunity for equitable access and
as through the SpeakUpWinnipeg is a more personal way of connecting.
email list, which sends updates to
over 1,000 email addresses and the In-person engagement has involved
City’s electronic Public Engagement (and will involve) presentations,
newsletter with over 5,000 email meetings, workshops, group
addresses. discussions, and “pop up
consultations”, where we attended
The project website community events where people are
(SpeakUpWinnipeg.com) has already gathering, as a way of making
been and will continue to serve as participation as easy as possible.
speakupwinnipeg.com
10In Phase 1, we used a consistent We asked these questions generally,
set of questions in all engagement and within the context of five inter-
activities to gain insight into what is related topic areas: How we Grow;
important to Winnipeggers: Getting Around in the City; Health
and Safety; Quality of Life; and
• What is your vision for Winnipeg’s Civic Engagement and Governance.
future? Whenever possible, we also asked
• To achieve that vision, what does people to consider their feedback
the City need to start doing, through the interconnected
stop doing, keep doing, or do sustainability ‘lenses’ of Social Equity,
differently? Environmental Sustainability, and
Economic Prosperity.
How we
Grow
Quality of
Life
Getting Around
in the City
Civic Engagement
and
Governance
Health and
Safety
Figure 4: OurWinnipeg Review Phase 1 Framework
For a more detailed overview of public engagement activities undertaken in support
of Phase 1 of the OurWinnipeg review process, please see Appendix B.
1112
SUMMARY OF FEEDBACK

OurWinnipeg is intended to contain policies related to the City’s overarching goals
and objectives as well as directions for implementation. When reviewing community
feedback for common topics and themes within the five inter-related topic areas,
we found that peoples' general messages (or vision) for what the City should be
like were generally consistent, but peoples' ideas about how to achieve that vision
were at times very different. Understandably, the diversity of people we heard from
approached issues from an equally diverse range of perspectives and experiences.
Phase 2 of the review will focus on considering specific ideas about how to
implement the vision.

In addition to the common themes related to the five topic areas, some input
received related more directly to the three overarching sustainability lenses
being considered for the review and are presented below as well.

Lenses

Environmental Sustainability:                Economic Prosperity:
Comments gathered relate to a desire         Comments gathered that were specific
for strong City leadership to protect        to this lens included supporting
the natural environment and natural          and investing in local businesses,
resources, reduce greenhouse gas             education and training supports
emissions, mitigate the impacts of           toward temployment, affordability,
climate change, and adapt municipal          poverty reduction and homelessness,
and community behaviours to be               fiscal responsibility, and distribution
more resilient.                              of government resources.

Social Equity:                               Within the five identified topic areas
Community comments related to                (How We Grow; Getting Around
social equity focused on access to           in the City; Quality of Life; Health
opportunity for all members of our           and Safety; Civic Engagement and
diverse community, ending racism,            Governance), we heard common
addressing the growing income gap            topics and messages, detailed on the
between the richest and poorest              following pages.
people, additional supports to
reduce barriers to participation, and
more attention to the needs of
Indigenous peoples, newcomers,
women, youth, and seniors.

                                        13
NUMBER ONE
H O W WE GR O W
Those who provided feedback on the physical growth of the City recognized that
physical growth and change provides opportunities to make existing communities
better, and makes sure new development is environmentally, economically, and
socially sustainable.
COMMON TOPICS COMMON MESSAGES
City-scale growth management, Plan-based Approach: Where and when
completing communities, downtown, the city grows should be based on a clear
information/asset management, and strategically prioritized plan.
parks and green spaces, public realm,
infill strategy, urban agriculture, Existing Communities: Maximize
new communities, transit oriented existing infrastructure and services
development, commercial uses, rail, by accommodating growth in existing
employment uses, development design, communities, including downtown,
through context sensitive infill and mixed-
heritage, and waterfronts.
use development.
New Communities: Make sure new
neighbourhoods are designed with
a range of housing and sustainable
transportation options, to meet the broad
needs of a diverse community.
Public Spaces: Provide quality public
and green spaces in all neighbourhoods.
14Winnipeg should grow in a way that
encourages more transit use and
creates more vibrant spaces. This
means continued densification in
the inner city and ‘regional mixed-
use centres and corridors,’ as well as
encouraging green field development
to be less car-oriented.
I envision neighbourhoods
where commercial and
residential areas are
integrated in such a way
that people could do most
of their daily activities by
active transportation or by
public transport.
When making
decisions about how
we grow, we need to
consider a range of
factors, including the
capacity of the road
network and piped
infrastructure.
15NUMBER TWO
G E T T ING AR O UND
I N T H E CI TY
People who provided feedback on this topic want to be able to get around the city in
convenient, affordable, safe, and accessible ways. Winnipeggers want transportation
options to support healthy lifestyles and a high quality of life, and allow all members
of the community to easily access their daily needs – employment, education,
services, goods and opportunities. There should be convenient, comfortable and safe
access to the places they want and need to reach.
COMMON TOPICS COMMON MESSAGES
Public transit, cycling, walking, rapid Transportation Options: Increase the
transit, snow clearing, road conditions, range of transportation options, such as
car sharing, construction issues, walking, cycling and public transit, to help
electric and autonomous vehicles, people access daily needs.
grade separation, carpooling, Handi-
Transportation Network Safety:
Transit, driver behaviour, parking, speed
Design and maintain the transportation
limits, regional connections, rivers as
network to be safe and accessible, paying
transportation, taxis/ridesharing, and
specific attention to winter conditions.
traffic flow/road expansion.
Road Condition and Convenience:
Enhance the physical condition of (and
traffic flow on) roads, using effective
construction methods and schedules that
are more responsive to road users and
adjacent properties.
16Transportation focused vision:
Enable a human-scaled urban
form - revitalization, invest in
road, transit, pedestrian & cycling
facilities. Ensure economic growth,
a cost effective transportation
system, attract a talented
workforce, and encourage
innovative technology.
Thinking about people with mobility
issues and how they get around the
city. City infrastructure needs to be
improved to make the city more
accessible. Winter compounds this
problem. I’m worried that I will be
house-bound for a few months.
Mobility is one of the most
important priorities for cities.
A city that is convenient to
move around in.
17NUMBER THREE
QU AL I T Y O F LI FE
Winnipeggers who shared feedback place a high value on the quality of life and
giving everyone who lives here the opportunity to reach their full potential. This
means helping to ensure basic needs are met in a supportive service and built
environment, with opportunities to build a sense of community.
COMMON TOPICS COMMON MESSAGES
Cleanliness, civic attitude and sense Affordable Housing: Increase access to
of community, festivals, events and affordable housing.
farmers markets, public art, arts and
culture, recreation, park amenities and Community Assets, Programs and
maintenance, affordable housing, animal Events: Enhance community spaces,
services and dog amenities, insect programs and social interactions to
control, urban forestry and biodiversity, maximize public benefit; ensure easy
air quality, water quality, waste access, respond to local needs and build a
management, programming, libraries sense of belonging.
and museums, and community centres, Natural Areas and Green Space:
arenas and pools. Preserve natural areas and provide access
to greenspace for recreation.
Reconciliation: Rebuild relationships
with Indigenous peoples toward a more
equitable future while understanding
our shared history and how this history
affects us all today.
Arts and Culture: Celebrate the,
heritage, arts and cultural diversity of our
community.
18Support community gardens
and community kitchens. Enable
community members coming
together to grow and cook their
harvests. Local experience of
newcomers – provides opportunity
to network and learn the ropes of
the new country, city, and systems.
A city which will be
known for its celebration
of diversity, a true
cultural/arts centre,
and for implementing
as many of the Truth
and Reconciliation
Commission’s Calls to
Action as possible.
Affordable
housing and
proper mental
health services
decrease
homelessness.
19NUMBER FOUR
H E A L TH & SAFETY
Winnipeggers who provided input referred to the importance of neighbourhood
design, relationships and services that support the physical, social, emotional and
spiritual health of all, especially for community members most likely to experience
poverty, crime and injury.
COMMON TOPICS COMMON MESSAGES
General health, police, general crime, Proactive Approach: Increase the
panhandling, smoking by-laws, safety impact of City resources by proactively
for immigrants and refugees, emergency addressing root causes and doing it right
response, “eyes on the streets”/crime the first time.
prevention through environmental design,
street patrols, downtown safety, gangs, Health Services: Ensure access to
drugs and prostitution, vacant and health services and provide emergency
derelict housing, physical safety, general response services that address the needs
safety, mental health, road safety, and of the community.
health care. Mental Health and Addictions
Supports: Support people who are
living with mental illness and addictions
to address their needs, and support
the health and safety of all community
members.
Food: Increase access to healthy, local
and affordable food.
Safety: Address the real and perceived
feelings of personal safety, injury
prevention and well-being in public
spaces and neighbourhoods so people are
comfortable to go out any time of day.
Water Quality and Waste
Management: Manage community waste
and provide access to clean water and
stewardship of water resources to protect
the environment and public health.
20Work to decrease the need
to have emergency services
(e.g. crime prevention rather
than policing, reduce racism,
crime, violence, poverty and
homelessness).
Taking care of people with Putting policies in
substance abuse issues, place that reduce
mental health issues, and waste, find more
those living in poverty, and
implement active strategies to uses for recycled
address these issues. goods.
A place where
the police service
works with
communities to
reduce crime.
21NUMBER FIVE
C I V I C E N GAGEM ENT
& G OV E R NANC E
Many of those we heard from spoke of the importance of open and transparent civic
decision-making that represents community diversity. They also value accessible
services and processes that provide all members of the community the opportunity
to participate in community life and in the decisions that impact their lives.
COMMON TOPICS COMMON MESSAGES
Education, Implementation: Ensure that planning efforts result in
political behaviour, timely and effective implementation.
transparency, open
Guided by Principles: Align City goals with principles of
data, intergovernmental environmental sustainability, social equity, and economic
relations, City revenues, prosperity.
finding efficiencies,
regional and inter- Evidence-Informed Decision Making: Make sure
municipal relations, all decisions are based on solid data and analysis, and
relationships with other outcomes are evaluated to make sure the City is on
organizations, permits, the right track, to help make better decisions in the
by-law enforcement, future.
project management Innovation: Embrace innovation to support more
and administration, sustainable practices and outcomes.
public engagement
Trust: Desire for government decision-making processes
and communications,
and political and administrative leadership to be more
grants and community
transparent, accountable, evidence-informed and
partnerships, decision- visionary.
making, voting, 311
service, and residents’ Responsive Engagement: Improve existing decision-
associations. making process and increase access and awareness
about how to participate. Listen to and meaningfully
incorporate representative community feedback into
decisions.
Coordinated Partnerships: Invest in relationship
building, community organizing, and collaboration
between community members, leaders, organizations
and the City to realize Winnipeg’s full potential.
22Stop asking citizens to participate
and then have little come from
the process. Keep updating
citizens on what has been
achieved, and tie it back to policy
priorities. Walk the talk.
Eliminate departmental
silos, work better
together. See systemic
barriers not short
sighted issues.
Implement
the plans we
already have.
23WHE RE WE GO
F ROM H ER E
What we heard and learned in Phase 1 showed us that the existing OurWinnipeg
policy generally continues to reflect the issues and values of our community.
However, there are opportunities to adjust existing policy, consider new policy,
and find ways to better achieve and implement the goals and objectives reflected
in the plan.
For the plan to achieve the community’s goals and objectives, we will need to:
• Update existing policy and craft new policy that aligns with the findings from
the first phase of the review process;
• Update the policy language to be clearer and more intentional;
• Consider relative prioritization of actions for greater impact;
• Carefully consider how and where the city grows to accommodate anticipated
population growth. As part of this we will need to consider the impacts that
growth has on quality of life, how we get around in the city, and our community’s
physical, social, economic and environmental goals; and
• Commit to measuring, evaluating and reporting on progress.
As we consider potential changes to OurWinnipeg policies as part of Phase 2 of the
review process, we will consider the specific ideas collected from Winnipeggers in
Phase 1 and seek further community input to make sure that the proposed changes
and direction reflect the community’s values and priorities.
To keep informed about the ongoing OurWinnipeg review, please subscribe
to our email list, follow the City of Winnipeg on Twitter or Facebook, or check
speakupwinnipeg.com for updates and events.
2425
AP P E NDI X A:
SUMMARY OF BACKGROUND RESEARCH

Key findings from the background research and analysis conducted to date are
summarized below:

Fueled largely by immigration, Winnipeg’s population has experienced
considerable growth and change – a trend expected to continue.
After a decade of slow population growth between 1990 and 1999, Winnipeg’s
population growth has steadily increased. Between 2010 and 2016, Winnipeg’s
population grew by more than 66,000 people, nearly double the growth
experienced during the preceding 20 year period.1 It is expected that Winnipeg
will experience population growth of more than 200,000 people over the next 20
years.2

Winnipeg has the largest proportion of Indigenous peoples of any major Canadian
city in Canada at approximately 11%.3 Based on the 2016 census, Winnipeg’s
Census Metropolitan Area (CMA) had 92,810 people identifying as Indigenous
– First Nations, Métis and Inuit.4 Approximately 50% of Winnipeg’s Indigenous
population is younger is than 25 years of age.5 Between 2006 and 2016,
Winnipeg’s Indigenous population grew by 37.1%.6

In recent years, immigration has become the largest aspect of population growth,
which is in turn influencing major trends. The merit-based Provincial Nominee
Program represents approximately 75% of annual immigration into Manitoba.
Winnipeg, in turn, receives on average 70% of these individuals.7 The majority
of immigrants to Winnipeg are highly educated – holding one or more university
degrees. While unemployment rates upon first arrival are slightly higher than the
average, they tend to be equal to or less than the total within 5 years of arrival.8
From 2010 to 2016 over 80% of immigrants arrived from 12 different countries.
The vast majority originate from the Philippines and India, although the
number of immigrants arriving from African and Middle Eastern Countries is
increasing. The remaining 20% of immigrants come from 156 different countries.9

This major growth in population from international sources, coupled with a growing
Indigenous population is changing our demography in terms of its diversity. When
the 1996 Census of Population for Winnipeg was taken, approximately 1 in 10
individuals were of visible minority.10 This is now estimated at 1 in 4.

                                         26
The significant proportion of immigrant and Indigenous population has significantly
changed the overall age distribution of our population. In the late 1990’s there were
concerns that the largest share of our population at the time, baby boomers, would
leave the workforce and be replaced by a smaller share of people of younger age;
however as a result of the younger age demographic of Winnipeg’s Indigenous and
immigrant populations, this concern has been alleviated. Indeed, the largest share
of population is now those between the ages 25 to 29 at 7.4%.11 This currently
reflects over 52,000 individuals and a tremendous opportunity to supply the local
labour demand.
Population trends translate into growing and changing demands for
housing.
Strong population growth has translated into annual housing starts of
approximately 4,000 dwelling units each year, a trend expected to continue. By
2040, nearly 100,000 new dwelling units are anticipated, with approximately 60%
of those new units being multi-family, such as apartments and townhomes, with
the remaining 40% as single-family dwellings. Baby boomers looking to downsize
from single detached homes and the growing immigrant and millennial population
all contribute to an increased demand for multi-family housing within the Winnipeg
housing market.12
Housing prices have increased significantly over the last decade. As at July 2017,
the average sold price of a residential dwelling in Winnipeg was around $305,000
which marks the first time in Winnipeg’s history the average home sold is over
$300,000 as recorded by the Multiple Listing Service (MLS).13
Despite these significant changes in housing type and prices over Winnipeg’s
history, Winnipeg remains one of the most affordable cities in Canada according to
the Royal Bank of Canada. In fact, Winnipeg’s affordability has remained close to
its average affordability since 1985. Other than cities like Calgary and Saskatoon
which have seen significant change in house prices due to recent oil price declines,
Winnipeg’s affordability has decreased the least by only 2%. This is low compared
to cities like Vancouver, Toronto, Victoria, and Canada overall, where affordability
has declined by 45%, 36%, 26% and 14% respectively.14
The rate of population growth in Winnipeg is consistently lower than the
rate of growth in the rest of the Census Metropolitan Area.
Generally, on a percentage basis, the rate of residential growth in Winnipeg
has been lower than within the rest of the CMA. However, within the past few
years, Winnipeg’s growth has exceeded the rate of growth in the CMA.15 By
27Census Canada’s definition of CMA, “to be included in the CMA, other adjacent
municipalities must have a high degree of integration with the core, as measured by
commuting flows derived from previous census place of work data”. Approximately
35,000 vehicles commute to Winnipeg daily.16
The City has a sufficient supply of greenfield land to accommodate
forecasted growth over the next 20 years, but will need to ensure these
lands are serviced in a timely manner.
“Greenfield lands” refer to areas most commonly located on the outskirts of the
city and are intended to accommodate new suburban development. Assuming the
existing development patterns continue, and Winnipeg keeps growing at its current
rate, OurWinnipeg’s designated greenfield areas represent 33 years of supply, while
8.5 years of this supply has been planned to-date.17 However, it is not enough
that the City simply maintains a sufficient land supply; it is also important that it
provides regional roads, pipes, and other infrastructure to enable development.
As a result, the City must keep track of how much serviced greenfield lands are
available and ensure that there is an adequate supply to meet anticipated demand.
Serviced lands in subdivided and rezoned greenfield areas are currently estimated
at seven years of supply.
Infill and redevelopment presents additional opportunities to accommodate
residential growth; however infrastructure capacity limitations and other
challenges create significant barriers.
OurWinnipeg identifies Transformative Areas – areas of the city that provide
the best opportunity to accommodate growth and change. Many of these
Transformative Areas are located within the built up areas of the city, such as
Major Redevelopment Sites (like Fort Rouge Yards), Regional Mixed Use Corridors
(like Portage Avenue, Main Street or Regent Avenue) and the Downtown. Many
of Winnipeg’s established neighbourhoods (like Linden Woods or Garden City)
also present opportunities to accommodate moderate growth and change over
time. Since OurWinnipeg was approved in 2011, approximately 45% of building
permits for new dwelling units has been located within these urban areas, with the
remaining 55% in greenfield areas.18
While infill and intensification provide many benefits, they can also be constrained
by existing infrastructure such as the combined sewer system and/or opposition
from existing neighbourhood residents.
Winnipeg continues to experience strong economic growth and boasts
some of the lowest business costs in North America.
Our business costs are among the lowest in North America. According to KPMG’s
annual business cost comparison, Winnipeg has lower costs than most cities in
Canada and the United States.
28From an economic growth perspective, Winnipeg’s GDP has grown by around
2.4% on average from 2012 to 2016, and is expected to maintain around 2.2%
growth over the next few years. Compared to the rest of Canada, Winnipeg has
experienced one of the fastest growth rates and it is expected to remain above the
national average.
There have been significant changes to the labour market over the recent past,
from 2002 to 2016 total employment grew by 14%.
In terms of the hourly wage rate, Manitoba remains among the lower wages in
Canada – in fact, around 10% lower than the average Canadian median wage or
approximately 15% lower than competing provinces.19
Winnipeg appears to have a significant shortfall of serviced industrial
lands.
Ensuring that Winnipeg has an adequate supply of lands that meet the needs of
service and goods producing employment land users will be important to the long
term economic well-being of the city.
The City is currently undertaking an Employment and Commercial Lands Study.
Initial findings from this study suggest that the City currently has a significant
shortfall of serviced industrial lands to accommodate forecasted growth over the
next 20 years. Over the last decade, such growth has largely been accommodated
through expansions of existing facilities and the development of partially vacant
parcels. While such intensification can be expected to accommodate a portion of
future growth, new serviced sites will also be needed.
The City will need to explore opportunities to address this shortfall which may
include the servicing of greenfield industrial areas and key redevelopment sites.
Winnipeg’s supply of vacant commercial land is more than sufficient to
accommodate future demand.
Preliminary findings from the Employment and Commercial Lands Study suggest
that the City of Winnipeg’s supply of vacant commercial lands can easily
accommodate forecasted growth over the next 20 years. This supply includes
both land currently available as well as land anticipated to be available in the near
future.
This surplus of commercial land will affect retail commercial intensification
development opportunities. In the near future, there will likely not be much
market-related incentive to develop retail commercial space in multi-level or mixed-
use formats in much of the City.
29Winnipeg has the lowest property taxes and lowest expenditures among
major Canadian jurisdictions.
Since 1998, the City of Winnipeg has increased its property tax by only 9%, due
largely to 13 years of property tax freezes. This compares with an average increase
for other comparable Canadian cities of 96%. Put differently, comparative cities
have roughly doubled their property taxes while Winnipeg has increased by 9%.20
In 2015, Winnipeg had the lowest operating expenditures per capita compared with
similar Canadian jurisdictions. After adjustments were made to more accurately
compare between cities, the operating expenditure per capita in 2015 was $1,357
for Winnipeg versus the average of the other cities, $1,681 – a difference of 24%.21
If the City of Winnipeg spent the average amount of other Canadian cities per
capita, the operating budget would be increased by approximately $233 million per
year.
Between 1999 and 2016, the relative priority of service area operating budget
allocation had shifted such that Police and Fire Paramedic Services now represent
the highest portions of the City’s tax-supported operating budget at 30% and 15%
respectively.22
Winnipeg is facing an overall budget deficit and a significant infrastructure
deficit with many unfunded capital projects.
The City of Winnipeg has to balance a multitude of competing spending priorities
with a limited availability of funding.
Many service areas are experiencing operating budget shortfalls based on
previously defined service levels. Inflation and the operational requirements
associated with new facilities (e.g. transportation, parks) contributes to an annual
increase to this deficit. The tax-supported operating budget deficit for the upcoming
fiscal period is approximately $89 million in 2018, and 10 years later, by 2027,
faces a projected deficit of $415 million.23
As the City continues to grow, the need to make sustainable, well-timed investment
decisions in infrastructure is essential to ensuring critical services continue to be
delivered to citizens. Over the past five years the City of Winnipeg has spent
an average of $689 per person on infrastructure, which is approximately $90
less per person compared to other similar Canadian jurisdictions.24 If the City of
Winnipeg spent a similar amount of funding compared to the average, the capital
expenditures would increase on average approximately $65 million per year. This
increased level of spending is still not sustainable and would not be sufficient to
address the infrastructure deficit.
Based on each department’s infrastructure needs and associated spending plans
over the next 10 years, the gap between total capital investment required and
30estimated future capital funding is an approximately $6.9 billion deficit. 58%
of that deficit relates to maintaining existing infrastructure, and 42% to new
infrastructure needs. 63% of the total deficit is attributed to transportation
infrastructure needs (roads, bridges and transit).25
A majority of Winnipeggers use motor vehicles to get around in the city.
A majority of Winnipeggers use motor vehicles rather than transit, walking, or
cycling as the primary mode of travel for work purposes and the proportion of work
trips by vehicle drivers continues to rise, although at a decreasing rate.
In 2016, 72% of commuters in the Winnipeg CMA commuted by car, truck or van
as drivers, while 7.1% commuted in cars, trucks or vans as passengers.
Approximately 13.6% used transit, 4.6% walked and 1.7% cycled. It took an
average of 36 minutes for transit commuters in the Winnipeg CMA to travel to
work, while the average trip length for car commuters was 23 minutes.26
Compared to other large Canadian CMA’s, Winnipeg experiences lower transit
ridership than Ottawa-Gatineau and Calgary (18.3% and 14.4% respectively)
but surpasses ridership in Edmonton at 11.3% and Quebec City at 11.1%. At
14.8%, the Winnipeg CMA experiences the highest rate of carpooling among large
Canadian CMAs.27 Bicycle mode share of work trips in the Winnipeg CMA has only
experienced a marginal increase over the past 10 years – from 1.6% in 2006 to 2%
in 2011 and 1.7% in 2016.28
The greatest proportion of Winnipeg’s GHG emissions come from
transportation and buildings
84.3% of Winnipeg’s GHG emissions come from buildings and vehicles. 50.5%
comes from transportation (32.1% from personal vehicles, 17.6% from commercial
vehicles and 0.8% from transit) and 33.8% comes from buildings (33.5% from
natural gas and 0.3% from electricity). Emissions from waste disposal follow closely
behind at 14.9% of total GHG emissions. The 0.9% comes from waste water.
When measuring GHGs, carbon dioxide (CO2) comprises the greatest portion of
all GHG emissions. Major Canadian municipalities showed a range of 4.8 to 13.5
tonnes of CO2 equivalent per person per year, with Winnipeg coming in at the lower
end at 7.8 tonnes of CO2 equivalent per person per year. Cities such as Winnipeg,
Vancouver and North Vancouver show low levels of greenhouse gas emissions
primarily due to the use of hydroelectricity as a major source of electricity.29
Health and safety issues in Winnipeg remain pronounced
In Winnipeg, injury is the fourth leading cause of death for all age groups. Each
year, 360 Winnipeg residents die and 5,100 are hospitalized due to injury. Falls
are the leading cause of injury-related death and the primary cause of injury-
related hospitalizations (for all age groups), with 82% of all deaths and 56% of
hospitalizations due to falls occurring in the population 75 years of age and older.30
31Fifty-four per cent of residents over 18 are overweight or obese, and 62 per
cent consume less than the daily recommended intake of fruit and vegetables.
While overall mortality rates have been decreasing and life expectancy has been
increasing within the city, residents of lower income households are more likely to
die at an earlier age. Lower income households are more likely to be diagnosed
and treated for chronic diseases, have higher mental disorder and substance
abuse prevalence, and experience higher rates of intentional and unintentional
injury rates.31
After experiencing decreased crime rates over the past decade, rates are showing
a slight increase. This trend is apparent in several other major Canadian cities. The
proportion of time spent on reactive policing has been trending upward in the past
3 years (56% in 2016).32 While the total number of fires of all types is declining
slightly over the long term, Winnipeg’s fire service responds to more incidents
than many other fire services due to the integrated service model that dispatches
paramedic-staffed fire trucks to moderate the medical incident volume assigned to
ambulance units.33
Poverty and other socio-economic issues persist in Winnipeg, despite
strong economic growth, competitive business environment, and relative
affordability
There are many structural and systemic factors that influence why people
experience poverty, social exclusion and homelessness including colonialism,
discrimination and housing affordability, as well as educational attainment, income
security, spending time in the child welfare or justice system, and health, mental
health and addictions.34 In Manitoba, women, Indigenous peoples, newcomers
and people with disabilities experience higher rates of poverty.35 The estimated
hourly living wage in Winnipeg needed to support a family of four with two parents
working full time is $14.54, while the minimum wage is $11.15.36 There is also
a significant disparity between employment among people with disabilities and
employment rates in general (56.4% of Manitobans with disabilities are employed
compared to 77.3% without disabilities).37 Though high-school graduation rates
have recently trended upward, the Indigenous community continues to experience
much lower rates than Winnipeg in general (in 2014 77.2% overall, Indigenous
47.2% and in 2016 83.1% overall, 58.4% Indigenous).38
Fifty-four percent of Manitobans live paycheque to paycheque while 47% of those
surveyed feel overwhelmed by debt.39 In March 2016, 56,342 people used a
Winnipeg Harvest food bank and the need continues to increase.40 There are
large gaps between Winnipeggers who are wealthy and those with low incomes
depending on where you live in Winnipeg.41 Using a point in time count, on October
25, 2015 there were 1,400 people experiencing homelessness in Winnipeg,42 294
of them were youth aged 15-29.43
32APPENDIX A: ENDNOTES
1. City of Winnipeg. Community Trends and Performance Report 2018, July 2017, p. 9,
www.winnipeg.ca/cao/pdfs/CommunityTrendsandPerformanceReportVolume1_2018.pdf
2. Ibid, p. 12
3. Statistics Canada, Census Population, 2011 National Household Survey
4. Statistics Canada Census Population, 2016 National Household Survey
5. Statistics Canada, Census Population, 2011 National Household Survey
6. Statistics Canada Census Population, 2016 National Household Survey
7. City of Winnipeg. Community Trends and Performance Report 2018, July 2017, p. 10,
www.winnipeg.ca/cao/pdfs/CommunityTrendsandPerformanceReportVolume1_2018.pdf
8. Statistics Canada, Census Population, 2011 National Household Survey
9. Statistics Canada, Census Population, 2011 National Household Survey
10. City of Winnipeg. Community Trends and Performance Report 2018, July 2017, p. 11, www.
winnipeg.ca/cao/pdfs/CommunityTrendsandPerformanceReportVolume1_2018.pdf
11. Ibid.
12. City of Winnipeg, Population, Housing and Economic Forecast, 2016, p. 21,
www.winnipeg.ca/finance/files/CoW-Population-Housing-and-Economic-Forecast.pdf
13. City of Winnipeg. Community Trends and Performance Report 2018, July 2017, p. 15,
www.winnipeg.ca/cao/pdfs/CommunityTrendsandPerformanceReportVolume1_2018.pdf
14. City of Winnipeg. Community Trends and Performance Report 2018, July 2017, p. 16,
www.winnipeg.ca/cao/pdfs/CommunityTrendsandPerformanceReportVolume1_2018.pdf
15. Census Canada, Table 1 Annual population estimates by sex, July 1, 2001 to 2016, Census
Subdivisions, Canada
16. Manitoba Public Insurance
17. City of Winnipeg, Permit data
18. City of Winnipeg, Permit data
19. City of Winnipeg. Community Trends and Performance Report 2018, July 2017, pp. 17-18,
www.winnipeg.ca/cao/pdfs/CommunityTrendsandPerformanceReportVolume1_2018.pdf
20. City of Winnipeg. Community Trends and Performance Report 2018, July 2017, p. 184,
www.winnipeg.ca/cao/pdfs/CommunityTrendsandPerformanceReportVolume1_2018.pdf
21. City of Winnipeg. Community Trends and Performance Report 2018, July 2017, p. 189,
www.winnipeg.ca/cao/pdfs/CommunityTrendsandPerformanceReportVolume1_2018.pdf
22. City of Winnipeg. Community Trends and Performance Report 2018, July 2017, p.188,
www.winnipeg.ca/cao/pdfs/CommunityTrendsandPerformanceReportVolume1_2018.pdf
23. City of Winnipeg. Community Trends and Performance Report 2018, July 2017, p. 189,
www.winnipeg.ca/cao/pdfs/CommunityTrendsandPerformanceReportVolume1_2018.pdf
24. City of Winnipeg. Community Trends and Performance Report 2018, July 2017, p.191,
www.winnipeg.ca/cao/pdfs/CommunityTrendsandPerformanceReportVolume1_2018.pdf
25. City of Winnipeg. The City of Winnipeg 2018 State of the Infrastructure Report
3326. Statistics Canada, 2016 Census Data
27. Ibid.
28. Statistics Canada,2006, 2011 and 2016 Census Data
29. City of Winnipeg Community 2011 GHG Inventory and Forecast,
clkapps.winnipeg.ca/DMIS/ViewPdf.asp?SectionId=450311
30. Winnipeg Regional Health Authority, Winnipeg Health Region Injury Report, 2000 – 2010,
March 2014,
www.wrha.mb.ca/community/publichealth/files/services/surveillance/InjuryReport_02.pdf
31. Winnipeg Regional Health Authority, Community Health Assessment 2014,
www.wrha.mb.ca/research/cha2014/files/CHAReport2014.pdf
32. City of Winnipeg. Community Trends and Performance Report 2018, July 2017,
www.winnipeg.ca/cao/pdfs/CommunityTrendsandPerformanceReportVolume1_2018.pdf
33. City of Winnipeg. Community Trends and Performance Report 2018, July 2017, p. 129 –
130,
www.winnipeg.ca/cao/pdfs/CommunityTrendsandPerformanceReportVolume1_2018.pdf
34. Canadian CED Network and Canadian Centre for Policy Alternatives, The view from Here
2015: Manitobans Call for a Renewed Poverty Reduction Plan,
www.policyalternatives.ca/sites/default/files/uploads/publications/Manitoba Office/2015/01/
View from here v8 low-res.pdf
35. Canadian CED Network and Canadian Centre for Policy Alternatives, The view from Here
2015: Manitobans Call for a Renewed Poverty Reduction Plan,
www.policyalternatives.ca/sites/default/files/uploads/publications/Manitoba Office/2015/01/
View from here v8 low-res.pdf
36. Fernandez, L., Hajer, J. Langridge, J. Canadian Centre for Policy Alternatives Manitoba
Office. A Family Living Wage for Manitoba 2016-17 Update, June 2017.
www.policyalternatives.ca/sites/default/files/uploads/publications/Manitoba Office/2017/06/
CCPA-MB Living Wage 2017 final.pdf
37. Winnipeg Foundation, Vital Signs, 2017,
www.winnipegvitalsigns.org/wp-content/uploads/WpgFdn-VitalSigns-2017.pdf; p.29
38. Winnipeg Foundation, Vital Signs, 2017,
www.winnipegvitalsigns.org/wp-content/uploads/WpgFdn-VitalSigns-2017.pdf; p.33
39. Winnipeg Foundation, Vital Signs, 2017,
www.winnipegvitalsigns.org/wp-content/uploads/WpgFdn-VitalSigns-2017.pdf; p. 19
40. PEG indicators, www.mypeg.ca/explorer/WellBeing/BasicNeeds/FoodBankUse/
41. PEG Indicators,
www.mypeg.ca/explorer/WellBeing/BasicNeeds/LowIncomeCutOffAfterTax/
42. United Way Winnipeg and International Institute for Sustainable Development, PEG:
Tracking Progress, Inspiring Action, www.mypeg.ca/
43. Here and Now: The Winnipeg Plan to End Youth Homelessness, p. 10,
www.hereandnowwinnipeg.ca/wp-content/uploads/2016/09/HereNow-Updated-FIN_WEB.
pdf
34A PP E ND IX B:
PUBLIC ENGAGEMENT
In-person Engagement
#of
Method Description
Participants
Pop-Ups; In the summer and fall 2017, the OurWinnipeg 724
Idea Cards Review team “popped up” at 30 different places
across the city, including neighbourhood and street
festivals, public concerts, malls, and other public
places and events. The intent was to raise awareness
of the initiative and to connect with people who may
be unable or less inclined to attend public meetings
or open houses. We encouraged people to complete
Idea Cards; postcard-sized cards with space for
participants to write their vision for Winnipeg.
When people did not feel like filling out (or were not
able to fill out) an idea card, they would tell their
vision to an OurWinnipeg review team member, who
would record it.
It took about 2-5 minutes to complete an idea card.
Some filled out more than one card, while others
included many ideas on the same card.
Workbooks Used as a physical alternative to online surveys 11
(detailed below) – workbooks contained the same
questions, presented in paper format.
Presentations, Meetings, presentations, and workshops (related to 683
Meetings and the OurWinnipeg review) with 24 different stakeholder
Workshops and citizen groups (e.g. developers, greenspace
advocates, City citizen committees, a seniors’ group,
college classroom, etc.)
Community We invited community leaders (identified through 73
Leaders’ Event news articles, referrals, previous invitation lists, sector
lists, and other recommendations) to provide input
on five topic areas. We also requested participants’
help to promote the OurWinnipeg reivew through their
networks.
Total 1,491
35Pop-Up Locations/Events Date
Winnipeg Folk Festival July 7, 2017
Winnipeg Folk Festival July 8, 2017
Winnipeg Folk Festival July 9, 2017
Fringe Fest July 26, 2017
Fringe Fest July 28, 2017
Canada Summer Games August 3, 2017
Folklorama at Assiniboine Park August 10, 2017
Rockin’ the Village at St. John's Park August 12, 2017
Downtown Transcona Farmers' Market August 24, 2017
Indigenous Concert Series, Portage Place August 25, 2017
Filipino Street Festival August 26, 2017
St. Norbert Farmers Market August 30, 2017
Storefront MB Pop-up August 30, 2017
U of W Orientation September 8, 2017
Sherbrook Street Festival September 9, 2017
ManyFest September 10, 2017
March for Peace - MERC September 20, 2017
Chalmers Neighbourhood Renewal Corp September 26, 2017
William Whyte AGM October 11, 2017
CCEDNet MB Gathering Hallway Table October 20, 2017
St. Vital Mall October 27, 2017
World Town Planning Day, Millennium Library November 8, 2017
West End BIZ AGM November 14, 2017
Seven Oaks Wellness Institute November 15, 2017
Exchange District BIZ AGM November 16, 2017
St. James Civic Centre November 20, 2017
Downtown BIZ AGM November 21, 2017
University of Manitoba - University Centre November 23, 2017
North Kildonan Community Centre Craft Sale November 25, 2017
Meet Me at the Bell Tower December 8, 2017
TOTAL # of Pop Ups 30
36#of
Meetings, Presentations and Workshops Date
Participants
Employment and Commercial Land Study workshop June 30, 2017 50
City Staff Leadership presentation September 29, 2017 120
Urban Design Advisory Committee October 10, 2017 10
Historical Building and Resources Committee October 12, 2017 6
Historical Building and Resources Committee October 12, 2017 6
Citizen Equity Committee October 16, 2017 10
Seven Oaks Seniors' Group October 16, 2017 26
Exchange District Business Improvement Zone October 17, 2017 4
CCEDNet Gathering workshop October 20, 2017 21
Red River College Community Economic 26 October, 2017 10
Development Class
Access Advisory Committee October 26, 2017 12
Winnipeg Committee for Safety October 27, 2017 11
Mayor's Age Friendly and Seniors Advisory November 17, 2017 11
Committee
Developer Information Exchange November 17, 2017 29
Planning Consultant Information Exchange November 23, 2017 9
OURS-Winnipeg and Save Our Seine Roundtable November 23, 2017 60
Discussion
Employment and Commercial Land Study Workshop November 27, 2017 22
Social Planning Council of Winnipeg Roundtable December 4, 2017 50
Discussion
City Staff Leadership workshop December 8, 2017 85
Manitoba Artist Run Centres Coalition Presentation December 13, 2017 9
Mayor's Indigenous Advisory Circle December 14, 2017 13
Francophone Network January 16, 2018 14
Chamber of Commerce January 31, 2018 15
City Staff Leadership workshop January 26, 2018 80
TOTAL # of meetings: 24 683
Feedback received from these events was compared to what we heard through
the analysis of the feedback received through Idea Cards, surveys and workbooks,
and helped us develop and refine the key messages of what we heard from all
engagement activities.
37Online Engagement
Method Description #of Participants
Website Visits The project website, SpeakUpWinnipeg. Over 3,600 sessions
com, is being used as an online hub
throughout the review process to share 2,500 visitors
information and to get Winnipeggers in-
volved. The site includes an event calen- Over 7,500 page views
dar, blog posts, and relevant documents.
Background information, surveys, and
static web pages are available in both
English and French.
Although the website launched in July,
we started tracking visits on September
20, 2017.
Online Survey Online surveys were offered on the 223
(general) SpeakUp website, as an alternative for
people to provide their answers to the
key questions being asked in this phase.
Information about the questionnaires
was shared through email networks, City
of Winnipeg social media accounts, and
word of mouth. Participation in the sur-
vey was voluntary.
Online Survey Similar to the general online survey, but Total: 292
(topic-specific) participants were asked the standard
questions about the five topic areas:
How we grow 81
Getting around in the City 109
Health and Safety 39
Quality of Life 37
Civic Engagement 26
Email List Serve Three emails were sent to stakeholder 1,004 members
organizations email addresses that were
compiled for OurWinnipeg. (October 24,
November 2, and November 27)
Emails Individual emails received and responded 20
to.
38You can also read