SECTION 2: SITUATIONAL ANALYSIS - 2.1 CITY'S PROFILE - Mogale City
←
→
Page content transcription
If your browser does not render page correctly, please read the page content below
2017-18 Revised IDP, of the 5 years 2016-2021 Integrated Development Plan

 SECTION 2: SITUATIONAL ANALYSIS

2.1 CITY’S PROFILE
2.1.1 Historical background
Mogale City is the birthplace of humankind, the City of Human Origin. It is privileged
to be the home of the 2.2 million year old skull of Mrs. Ples, found at the Sterkfontein
Caves in the Cradle of Humankind – a UNESCO World Heritage Site.

Mogale City, City of Human origin, is further emphasized by the discovery of the
Dinaledi Chamber by Dr. Lee Berger, an anthropologist, with Wits University in 2015.
Homo Naledi, an extinct species of homonin was discovered in the Rising Star Cave
System. As of 10 September 2015, 1550 specimens have been extracted from the
Rising Star Cave in the Cradle of Humankind.

Mrs. Ples was first revealed in April 1947 by Dr. Robert Broom along with students
from the University of the Witwatersrand. While the Mrs. Ples skull was small, about
the size of a chimpanzee's, it was apparent the creature stood upright. 'Mrs. Ples'
earned her nickname from the media after Dr. Broom originally identified the species
as a new one, Plesianthropus Transvaalensis, though it was later identified
as Australopithecus Africanus.
Stw 573, nicknamed “Little Foot”, is a nearly complete Australopithecus also found at
the Sterkfontein Caves between 1994 and 1998. It is due to the structure of the (four)
4 ankle bones that scientists were able to dissert that the owner was able to walk
upright.

                                                11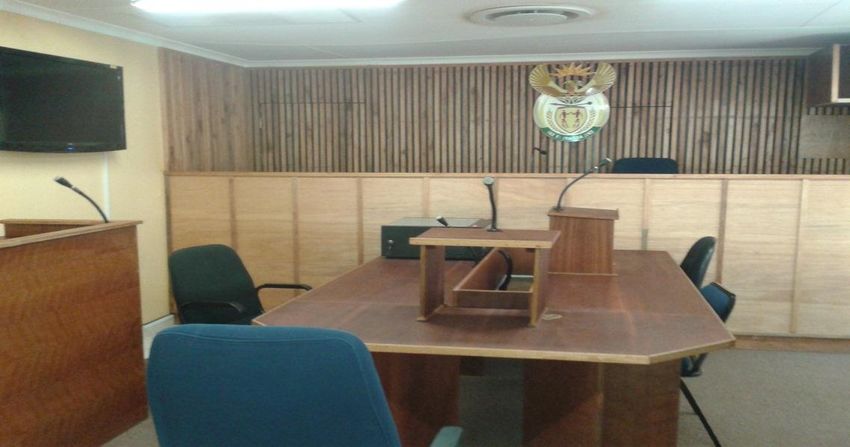
2017-18 Revised IDP, of the 5 years 2016-2021 Integrated Development Plan

Apartheid history
Krugersdorp has been the centre of the establishment of Mogale City. Krugersdorp
was founded in 1887 by Marthinus Pretorius and named after Paul Kruger.
Krugersdorp was founded as a mining town of gold, asbestos and magnesium
amongst others during the 1880s. (http//wiredspace.wits.ac.za/10539/5430.19-08-
2010). Munsieville, Black Africa Township was subsequently established, according
to the ordinance 58 of 1903 of the Krugersdorp municipality and called "the native
location". From the early 1930s the area was named after Mr. James Munsie, the
white chief sanitary inspector (medical officer) of Krugersdorp. (http//www.
Andrianfaith/place/70106/Census. 2001. Place Munsieville”) .Subsequent to the
Groups Areas Act, Kagiso, the largest township in Mogale City, was established for
some of the residences that were forcefully removed from Munsieville.

During October 1957, the executive committee of the Bantu Housing Board was
given a grant of £231150 by central government treasury for the erection of 1300
dwellings and one school for the residents of Kagiso. Low-cost houses, as well as
hostels, were all constructed according to a standardized architectural design and in
the same range of materials. The construction of housing stock was accompanied by
the building of single-sex hostels that were designed to house single-sex migrant
workers; this was typical apartheid design that emerged from the government policy
which regarded Africans as temporary residents in urban areas. In 1984, the
township was granted municipal status under the administration of the black local
authority. (V. Khumalo, Kagiso Historical Report Research),

Post- Apartheid History
Mogale City Local Municipality incorporates the previously racially divided non-white
communities of Swaneville, Munsieville, Azaadville and Kagiso with the white
communities of Krugersdorp and surrounds. In the recent past, the Municipal area
has been home to popular household names such as Arch-Bishop Emeritus
Desmond Tutu, Dr. Motlana, Bra Hugh Masekela and the former Gauteng Premier,
Ms. Nomvula Mokonyane. During the 2010 FIFA World Cup, Mogale City hosted the
Portuguese and Australian soccer teams.

                                               12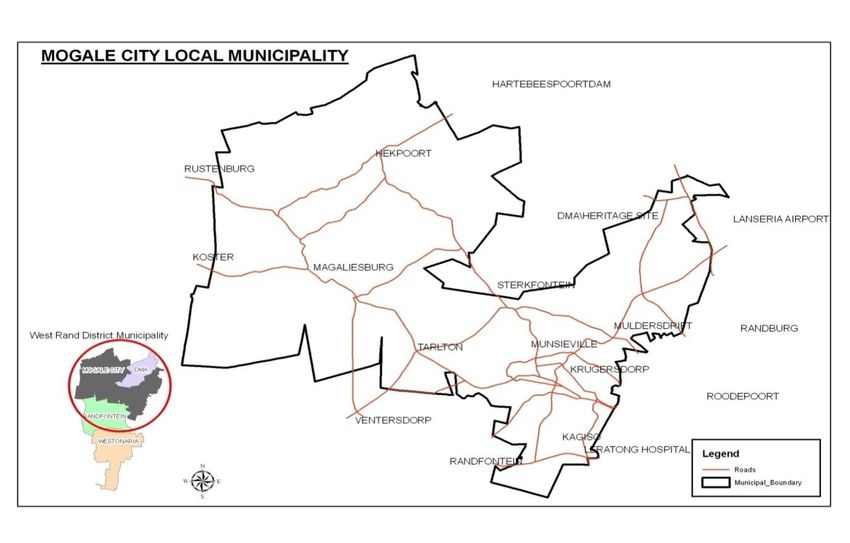
2017-18 Revised IDP, of the 5 years 2016-2021 Integrated Development Plan
2.1.2 Current Status Quo: Locality
Mogale City is situated at the western side of the Gauteng Province. It also forms
part of the broader West Rand District Municipality, which consists of three(3) local
municipalities, i.e. Randwest City, Mogale City and Merafong City.
Mogale City is made up of the following areas:
Kagiso, Rietvallei (including Azaadville)
Krugersdorp and Munsieville
Muldersdrift , Tarlton, Magaliesburg, Kromdraai and Hekpoort
Mogale City’s strongest functional urban linkage is with the City of Johannesburg.
Kagiso and Krugersdorp are primary urban complex that part form Corridor of
Freedom in Gauteng, namely, Western Corridor. The strongest east west transport
linkages between Mogale City and City of Johannesburg are along the R512 as well
as the railway line. Mogale City is linked to the City of Tshwane via the N14/R28
highway. (Local Government Handbook: 2015)
Geographic Area
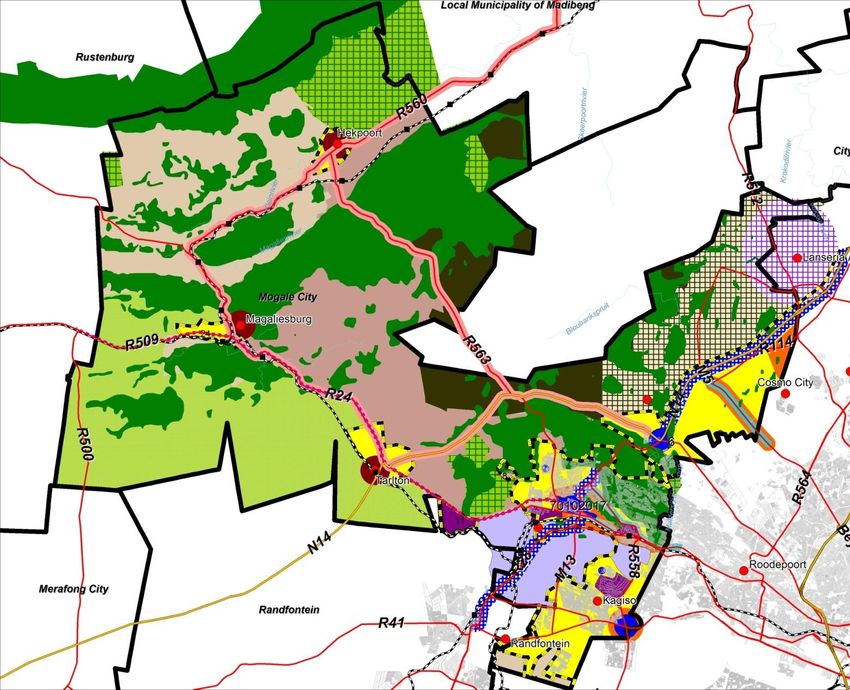
Map1, below, shows MCLM, Randfontein LM, Westonaria LM and Merafong City are
constituent local municipalities of the West Rand District Municipality. MCLM covers
an area of approximately 110 000 hectares, with Krugersdorp as the major CBD. It
is accessible from all the major centres of Gauteng and North West Province,
namely Johannesburg, Pretoria, Midrand, Hartebeespoort Dam, Randfontein, and
Soweto, to name but a few places.
13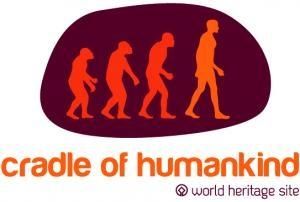
2017-18 Revised IDP, of the 5 years 2016-2021 Integrated Development Plan

Map 1 : Mogale City Local municipality and surrounds

2.2 DEMOGRAPHIC PROFILE OF THE MUNICIPALITY
Demographic statistics are essential for planning in both the country and its regions.
Of the total population of the West Rand Region, about 45.5 per cent were residing
in Mogale City in 2016, making it the most populated region in the district.

The graph below shows the population contribution of constituent Local
Municipalities of West Rand District. MCLM has the largest population estimated at
383 864 people in the West Rand Region, which has 820 995 persons. Randfontein
and Westonaria City have merged in August 2016 and became one municipality
which is now named Randwest City which has the total population of 261053
combined.

                                                       14
2017-18 Revised IDP, of the 5 years 2016-2021 Integrated Development Plan
Figure 1: West Rand District Municipalities Population Distribution
West Rand District Municipalities Population Distribution,
2016 and 2011
450000
400000
350000
Population figures
300000
250000
200000
150000
100000
50000
0
Mogale City Randwest City Merafong City
2016 383864 265887 188843
2011 362422 261053 197,520
Source: Census 2016, Statssa
Figure1 shows West Rand District Municipalities population distribution from 2011 to
2016. There has been a growth of 21 442 persons in the past 5 years, from 362 422
persons in 2011 to 383 864 persons in 2016. This indicates that Mogale City is the
most populous municipality of all WRDM local municipalities.
Figure 2, below indicates Mogale City average population change from year to year.
The population average growth increased at a decreasing rate. For instance,
between 2010 to 2013, the rate was 1.85% and between year 2013 to 2017 it is
estimated that average growth was 1.58%,a much less decreased growth rate.
Figure 2: Mogale City population growth rate
152017-18 Revised IDP, of the 5 years 2016-2021 Integrated Development Plan
Mogale City Population growth rate
2.5% 2.3%
2.0% 2.0% 2.0% 1.8%
2.0% 1.5% 1.7% 1.6% 1.5% 1.4%
% Percentages
1.5% 1.2%
1.0% 0.9%
0.5% 0.6%
0.0%
2005 2006 2007 2008 2009 2010 2011 2012 2013 2014 2015 2016 2017
Mogale City 2.3% 2.0% 1.2% 0.9% 0.6% 1.5% 2.0% 2.0% 1.8% 1.7% 1.6% 1.5% 1.4%
Source: Census 2016, Statssa
Figure 3 below indicates, the proportional population groups of Mogale City. Since
2001-2011, population of MCLM has increased across all race groups. The African
people increased by 25 percent, which is 53 886 persons, from 219 931 persons in
2001 to 273 817 persons in 2011. The coloured community has increased by 46
percent which is 962 persons, from 2090 persons in 2001 to 3052 persons in 2011.
Indian/ Asian community experienced the least increase of 21 percent, which is 1400
persons from 6459 persons in 2001 to 7859 persons in 2011. The second least
increase was in the White groups, which experience a 24 percent increase, which is
14 701 persons, from 61 240 persons in 2001 to 75 941 in 2011.
Figure 3: Mogale City proportional distribution of population groups
Mogale City Population Distribution 2001-2016
350000
300000
250000
200000
Population
150000
100000
50000
0
Black african Coloured Indian/asian White
2016 291693 3118 7834 81219
2011 273817 3052 7859 75941
2001 219931 2090 6459 61240
Source: Census 2016, Statssa
Figure 4 shows how the population structure has changed between 2011 and 2016
for Mogale City. The structure shows that Mogale City has a youth population bulge
which is similar to that of the Gauteng province and that of the country. The figure
indicates that a major proportion of the region’s population are people of working
age.
162017-18 Revised IDP, of the 5 years 2016-2021 Integrated Development Plan
Figure 4: Population Pyramid, Mogale City
75+
70-74
Females Males
65-69
60-64
55-59
50-54
45-49
40-44
35-39
30-34
25-29
20-24
15-19
10-14
05-09
00-04
25000 20000 15000 10000 5000 0 5000 10000 15000 20000 25000
2016 2016 2011 2011
Source: IHS Markit, 2017
It should be noted from the figure 4 above, the youth age population is a bulge, and
this shows a population group decline between the ages of 25-29 as well as age
group 30-34 when comparing 2011 and 2016. There were less people in 2016 of
these age groups compared to 2011. These age groups are transition to adulthood
which consist mainly of child bearing people and newly established families.
MCLM population indicates a decline from age group 30-34 years until age group
+75 years when comparing 2011 to 2016. There are less people in 2016 than 2011
in these age groups. These ages are the essential economically active population for
the City. Thus, population decline of this age group does not assist in the economic
prospects of the City.
According to the information from IHS Markit, the unemployment rate in the region
reached 39.6 per cent. This indicates that a majority of the youth in the region is
unable to find work. There were more males than females in both review years.
172017-18 Revised IDP, of the 5 years 2016-2021 Integrated Development Plan
Population Dependency
Population dependency refers to the percentage of a population that depends on
others for their well-being and survival. It is expressed by means of a dependency
ratio. In the case of the dependency ratios of children/youth or of older people, these
ratios are calculated based on the number of children (0-14 years old) and older
persons (65 years or over) who depend on the working-age population (15-64 years
1
old). They also indicate the implications for social and economic development of
changes in a population’s age structure, and point to broad trends in social support
needs.
Figure 5: Youth Dependency Ratio, 2011 - 2015
38.5% 38.1%
38.0% 37.6% 37.6%
37.5% 37.3%
37.0%
36.8%
Youth Depedency Ratio
37.0% 36.4%
36.4%
36.5%
36.1%
35.9%
36.0% 35.7%
35.5% 35.3%
35.0%
34.5%
34.0%
33.5%
2011 2012 2013 2014 2015 2016
Mogale City West Rand
Source: IHS Markit, 2017
Figure 5 expands on the pyramid and shows the proportion of the youth population
which is dependent on the working age population. The figure above indicates an
increasing trend for both the district and the local region. Since 2011-2016,
dependency ratio of child has increased by 2,8% from 35.3% to 38, 1% per 100
people. This dependency is extended when calculated as a population dependency,
which includes the age group of children and old-age people above 65 years. The
higher dependency ratio is associated with an increase in taxes for the working
population to support the non-working age population. Thus, ideally, this ratio should
be as low as possible.
1
Population Reference Bureau. (2016). Glossary of Demographic Terms. Accessed at http://www.prb.org/Publications/Lesson-
Plans/Glossary.aspx
182017-18 Revised IDP, of the 5 years 2016-2021 Integrated Development Plan
2.3 ECONOMIC DEVELOPMENT INDICATORS
Development indicators enable a region to gauge their progress on their
developmental goals and objectives. These indicators include the unemployment
rate, poverty and inequality. In measuring the inequality, the Gini co-efficient is often
used and measures the extent to which the distribution of income (or, in some cases,
consumption expenditure) among individuals or households within an economy
deviates from a perfectly equal distribution. Thus, a Gini co-efficient of 0 represents
perfect equality, while an index of 1 implies perfect inequality.
Figure 6: Gini co-efficient, 2011 - 2015
0.650
0.643 0.644
0.641
0.639 0.638
0.640
0.630
0.623
0.621
0.620
0.620 0.616 0.616
0.610
0.600
2011 2012 2013 2014 2015
Mogale City West Rand
Source: IHS Markit, 2017
Figure 6 shows the Gini co-efficient as a measure of income inequality for the
Mogale City and the West Rand. The Gini has remained fairly constant in Mogale
City across the years. Although there are instances where the Gini declined (such as
between 2013 and 2015), the declines were very minimal. The Gini decline for
Mogale City indicates that the poverty gap has widen, which implies more residents
are becoming increasingly poor. With a coefficient of 0.62 in 2015, it means that only
about 36 per cent of the population in Mogale City hold the majority of income or all
the income, whilst the remaining 64 percent share very little or no income at all.
The municipality should initiate poverty nets programmes that target the poor
households. This could include expansion of social upliftment programmes such as
free basic services, expanded public works and labour intensive job programmes.
192017-18 Revised IDP, of the 5 years 2016-2021 Integrated Development Plan
Figure 7: Share Below Food Poverty Line, 2011-2015
17%
16%
15%
14%
13%
12%
11%
10%
9%
2011 2012 2013 2014 2015
West Rand Mogale City
Source: IHS Markit, 2017
Figure 7 shows the proportion of people that lives below the food poverty line for
Mogale City and the West Rand from 2011 to 2015. Both regions show a rising
trend, with Mogale City recording higher proportions. In 2015, there were 15.7 and
15 per cent of people living below the food poverty line for Mogale City and West
Rand respectively.
Figure 8: Qualifications of People Older Than 20 Years, 2011 & 2015
2011 2015
10.5% 7.7%
10.8% 7.5%
22.4% 13.8%
No schooling
Primary
Secondary
Tertiary
59.4%
67.9%
Source: Quantec Research, 2017
202017-18 Revised IDP, of the 5 years 2016-2021 Integrated Development Plan
Figure 8 shows the share of educational achievements for people older than 20
years in Mogale City for 2011 and 2015. The share of people with secondary
education accounted for 67.9 per cent in 2015, an increase of 8.5 percentage points
compared to 2011.This was followed by a share of those with primary education at
13.8 per cent. The share of those with no schooling was at 7.5 percent in 2015 a
decline of 0.2 percentage points. The share of those with tertiary education was at
10.8 per cent in 2015, a decline of 0.3 percentage points compared to 2011.
Improvements in educational attainment help a region increase its economic
potential over time by building larger and more-skilled pools of human capital.
Table 1: Income Distribution, 2015
Annual Income Per
Number of Households Percentage of Households
Household
Less than R12 000 4 414 3.6%
R12 001 to R42 000 30 162 24.7%
R42 001 to R96 000 35 577 29.1%
R96 001 to R360 000 33 866 27.7%
R360 001 to R2 400 000 17 911 14.6%
More than R2 400 000 409 0.3%
Total 122 339 100.0%
Source: IHS Markit, 2017
The table above shows the income distribution of households in Mogale City Local
Municipality in 2015. The annual income per household that constituted the largest
number of households was the R42 001 to R96 000 range which accounted for 29.1
per cent of total households in Mogale City Local Municipality. This was followed by
the R96 001 to R360 000 range, which accounted for 27.7 per cent of the
households. The lowest percentage of households was in the highest income range
of more than R2.4 million per annum and it comprised of 0.3 percent of the
households.
212017-18 Revised IDP, of the 5 years 2016-2021 Integrated Development Plan
The section below reviews some labour indicators in the Mogale City Local
Municipality area jurisdiction.
Figure 9: Total Employment and Growth, 2011-2015
120,000 6.0%
5.0%
100,000
4.0%
80,000 3.0%
2.0%
60,000 1.0%
0.0%
40,000 -1.0%
-2.0%
20,000
-3.0%
0 -4.0%
2011 2012 2013 2014 2015 2011 2012 2013 2014 2015
Formal Employment Informal Employment Formal Informal Total
Source: IHS Global Insight, 2016
Figure 9 shows both total employment levels and growth thereof in Mogale City from
2011 to 2015. Employment levels in the municipality show a declining trend over the
review period. Formal employment declined from 91,210 in 2011 to 87,575 in 2015,
whilst informal employment decreased from 15,477 in 2011 to 15,114 in 2015.
Employment growth rate was in negative territory in 2014 and 2015. Mogale City
experienced its lowest level of employment growth in 2015, contracting by 2.3 per
cent. During the same period, GDP-R growth also contracted by 1.8 percent.
Figure 10: Employment by Sectors, 2015
Households 10,497
9,305
Community services 15,214
15,268
Finance 19,548
20,329
Transport 7,511
8,330
Trade 23,651
21,117
Construction 6,193
6,562
Electricity 671
623
Manufacturing 19,918
18,841
Mining 2,169
1,140
Agriculture 1,315
1,176
0 5,000 10,000 15,000 20,000 25,000
2011 2015
Source: IHS Markit, 2017
222017-18 Revised IDP, of the 5 years 2016-2021 Integrated Development Plan
Figure 10 shows the number of employment by sector in Mogale City in 2011 and
2015. During the review period, there was a decline in employment levels in five
sectors, except in construction, transport, community services and finance sectors.
Nevertheless, the figure confirms that wholesale & retail trade and finance sectors
are the largest employers in Mogale City. The trade sector employed a total of 21
117 000 people in 2015 and the finance sector employed 20 329 000 people. It
however, also indicates the strength of the manufacturing sector which employed 18
841 000 people in 2015. The electricity and mining sectors had the lowest level of
employment within the city.
Figure 11: Unemployment Rates, 2011-2015
50.0%
45.0% 43.0%
39.6%
40.0%
36.9%
35.4%
35.0% 33.1%
31.3%
30.0% 27.9% 28.5%
27.5%
26.2%
25.1% 24.4%
24.2%
25.0% 22.9%
21.6%
20.0%
15.0%
10.0%
5.0%
0.0%
2011 2012 2013 2014 2015
Male Female Total
Source: IHS Global Insight, 2017
232017-18 Revised IDP, of the 5 years 2016-2021 Integrated Development Plan
POVERTY ALLEVIATION
DISCOUNTED PAYMENTS OF RATES AND SERVICES
Mogale City Local Municipality introduced the Indigent Registration programme that
focuses on households that qualify to receive free basic services. The municipality
approved the indigent management policy which provides for basic services that
include six kilolitres of water, 50 kW/h of electricity, sanitation services, refuse
removal and indigent burials as per indigent burial policy.
Households who qualify as indigent are those that earn less than R2 280 per month.
Currently there are 15 808 households that are registered as indigents. Mogale City
Local Municipality continues to urge needy residents to register.
INDIGENT REGISTRATION PROGRAMME
The poverty alleviation programme provides a platform for the municipality to push
back the frontiers of poverty. In the past, there had been various programmes such
as indigent policy management wherein over 18 528 households were registered
and no more than 4 120 per annum were approved as indigent beneficiaries. The
municipality disbursed over R 2.8m to various Non-Government Organizations
(NGOs) engaged in activities that assist the urban and rural households.
INDIGENT BURIAL AND GRAVESITE
The Indigent burial programme has assisted the poor to bury their loved one in
dignity. In the past 5 years, 2011-2016, 291 households were support through
indigent burials and gravesites. MCLM assist with the burial expenses of indigent
households with either the expenses of a gravesite or with overall burial expenses,
especially in cases where the family is unable to pay any money.
FOOD GARDEN SCHEME
Food gardens are some of the ways the municipality ensures food security for poor
households. There are four community food garden schemes, with approximately 36
households participating. This allows residents to be self-sustaining and also
contributes to environmental preservation. Land is used for growth and is kept fertile.
In addition, people are allowed the opportunity to grow, sell and trade products for a
further way towards poverty alleviation.
242017-18 Revised IDP, of the 5 years 2016-2021 Integrated Development Plan
ASSISTANCE TO EVICTED FARM DWELLERS
Eviction of farm dwellers is one of the major challenges for the rural communities in
MCLM. The municipality established an Eviction Task Team that addresses any
evictions of the rural poor. In the past, 2011-2015, approximately 500 evicted and
emergency relocated households were provided safe accommodation through site
and services. Moreover, each month the municipality provides 5 000 households
with tanked water and chemical sanitation facilities.
252017-18 Revised IDP, of the 5 years 2016-2021 Integrated Development Plan
2.4 STATUS QUO ASSESSMENT, BASIC SERVICE
DELIVERY AND INFRASTRUCTURE
Basic services delivery by MCLM includes, provision of potable water,
sewerage, refuse removal, electricity and roads, which are the basic
competency of local government. Moreover, housing is also considered a basic
service delivery issue; however, housing delivery remains a provincial
competency, led by the Provincial Department of Human Settlements.
Government basic services delivery targets are largely prescribed in the United
Nations adopted Sustainable Development goals. The major goal is that all
households should have access to all basic services. MCLM progress on the
basic services is;
ACCESS TO BASIC SANITATION
Figure 12: Households with access to sanitation (toilets) facilities
Sanitation (toilets) facilities
100000
90000
80000
Household No.
70000
60000
50000
40000
30000
20000
10000
0
Flush
toilet Flush
Pit toilet Pit toilet Other (
(connect toilet
Chemical with without Bucket Dry
None ed to (with
toilet ventilatio ventilatio toilet toilets
sewerag septic
n (VIP) n facility)
e tank)
system)
2011 2302 91757 6781 3430 2755 5675 3703 971
2007 1749 74572 4896 375 2455 6596 1737 1907
Source: IHS Global Insight Regional Explorer 2009
One of the key government priorities is to deliver safe and adequate sanitation
services to all communities. The above graph indicates that the number of
households with access to the highest level of sanitation has increased. During 2011
262017-18 Revised IDP, of the 5 years 2016-2021 Integrated Development Plan
households with access to flush toilets increased by 23% which is an increase of 17
185 households, from 74 572 households in 2007 to 91 757 households in 2011.
MCLM has had a big drive of providing informal households with access to sanitation
through chemical toilets facilities. Number of households having access to chemical
toilet facilities has increased astronomically. There has been an increase of
914.67%, with an increase from 375 households in 2007 to 3 430 households with
access to chemical toilets in 2011.
The census data further indicates that households with access to pit toilets have
decreased by 116% (921 households), which is from 6596 households in 2007 to
5675 households in 2011. Although much progress on providing universal access to
sanitation has been made, there is approximately 12 000 households with sanitation
below the RDP level. The municipality would need to provide these households with
RDP stand sanitation.
ACCESS TO WATER
Figure 13: Households with access to water facilities
120000
Access to Water
Household number
100000
80000
60000
40000
20000
0
Rain Dam/poo
Piped River/str Water Water
Borehole Spring water l/stagnan Other
water eam vendor tanker
tank t water
2011 101414 10186 153 183 541 140 830 2605 1320
2007 91,230 1675 58 0 123 225 257 721
Source: 2011 Census
Figure 13 shows the number of households with access to water source. A large
number of household are on municipal supplied piped water. Households with
access to piped water has increased by 89% (10 184 households), which is from 91
230 households with access to piped water in 2007 to 101 414 households with
access to piped water in 2011.
272017-18 Revised IDP, of the 5 years 2016-2021 Integrated Development Plan
Moreover, MCLM has been on huge drive to supply informal settlements with
tankered water, which is delivered in trucks. The above graph indicates that
households with access to tanked water has increased by 1 013%, which is 2 348
new households, from 257 households in 2007 to 2605 households with access to
tankered water in 2011.
The challenge is with regards to water loss, MCLM unaccounted for water stands at
39% is the past financial years. The measures to address unaccounted for water
include, re-sealing of the water reservoirs, however, additional rigorous measures
needs to be put in place. Additional measures to control unaccounted for water
include:
New water demand management plan, and
Installation of pre-paid meters and increase water meter reading.
ELECTRICITY
ELECTRICITY SUPPLY MANAGEMENT
MCLM has made significant strides to increase access for households previously not
part of the grid. The challenge is that MCLM electricity supply is operating at near
maximum capacity. Our firm supply of electricity over the entire city stands at
160MVA from an installed capacity of 200MVA, with a 150MVA peak demand
registered over the five years. In order to increase capacity of electricity supply, a
new substation has been constructed in the area at a cost of R40 million, whilst four
substations are at different stages of upgrades.
DEMAND MANAGEMENT
The national electricity strategy urges all users to reduce the use of electricity;
therefore municipalities are required to develop electricity demand management
strategies. The ripple control relay and power factor are some of the strategies used
to reduce pressure on the grid. Moreover, Mogale City in collaboration with the
National Department of Energy has provided households in Munsieville with Solar
geysers to reduce demand on the grid.
282017-18 Revised IDP, of the 5 years 2016-2021 Integrated Development Plan
Figure 14: Households with access to energy lighting
Type of energy lighting
120000
100000
80000
Axis Title
60000
40000
20000
0
Candles
(not a Unspecifie Not
Electrcity Gas Paraffin Solar None
valid d applicable
option)
2011 100788 219 2687 13098 272 310 0 0
2007 80588 189 3035 9986 63 427
Source: Census 2011
Figure14 indicates households with access to various types of energy for lighting.
Access to electricity increased by 20 200 households, from 80 5888 households in
2007 to 100 788 households in 2011. MCLM electricity connection has almost the
universal access to all households, there are only 13 200 households that need
access to electricity. A majority of households with no access to electricity are
presumed to be staying in informal settlements, which are not proclaimed as
townships yet.
The challenge remains largely in rural areas wherein there is privately owned land,
as well as in the informal settlements such as Tudor Shaft, Orient Hills, Makhulu-
Gama and Pangoville. These are the areas that MCLM is unable to provide with
electricity as they are not proclaimed in terms of the town pla nning regulations. The
municipality has however provided illumination in informal settlements and rural
areas. MCLM is also looking into newer environmentally sustainable ways to
generate energy so as to provide all residents with this basic service deliverable.
292017-18 Revised IDP, of the 5 years 2016-2021 Integrated Development Plan
ROADS AND STORM-WATER MANAGEMENT
The total road network of Mogale City is 1,100 km and made up of 960 km of paved
roads and 140 km of gravel roads. Gravel roads are in the rural areas and with a
small number of unpaved roads in the old townships.
Road network can be broken down further into 100 km of main arterial roads and
1000km of tertiary roads. Main arterial roads are the city-to-city roads whereas
tertiary roads are roads within the built-up areas.
In the new term of Council the objectives are to continue with paving of gravel roads
in the peri-urban areas, such as Tarlton, Magaliesburg, Hekpoort and Muldersdrift.
Council will also continue with the rehabilitation and resurfacing of the main arterial
and tertiary road network. Moreover, Breaking New Grounds (BNG) housing
development, such as Chief Mogale is provided with all requisite basic services of
paved roads.
ERADICATION OF INFORMAL SETTLEMENTS
Provision of sustainable human settlements remains one of the biggest challenges of
government. There was a stepped up effort in provision of housing for the rural poor
and various projects are at different stages of development, i.e. from pre-feasibility
studies whilst others await township establishment approvals whereas other areas
have units that are ready for occupation.
The major areas of RDP housing delivery expected in the near future are:
Chief Mogale phase 2, in Kagiso
Dr. Sefularo housing development, in Hekpoort
Dr. Motlana housing development in Muldersdrift
MCLM has, however, developed a new 5 year housing development plan in order to
address this challenge. The strategic plan seeks to pursue partnerships with other
private and public entities in order to address this huge challenge.
302017-18 Revised IDP, of the 5 years 2016-2021 Integrated Development Plan
BUILDING PLAN APPROVALS
The new administration intends to expedite the approval of building plans as part of
local economic development.
LAND USE AUDIT OF ALL LAND PORTIONS IN MOGALE CITY
Council also intends to undertake an overall land audit of the land portions owned by
the municipality to consider all options to stimulate economic development.
312017-18 Revised IDP, of the 5 years 2016-2021 Integrated Development Plan
2.5 ENVIRONMENTAL ANALYSIS
REFUSE REMOVAL
MCLM focused on expansion of the refuse collection to areas previously not serviced
by the municipality.
Refuse Removal
100000
90000
No. of Households
80000
70000
60000
50000
40000
30000
20000
10000
0
Removed by Removed by
local local
authority/pri authority/pri Communal Own refuse No rubbish
Other
vate vate refuse dump dump disposal
company company
once a week less often
2011 93488 2159 3091 13720 4092 824
2007 75663 1605 2309 10837 3744 130
Source: 2011 Census and 2007 Community Survey
The above graph indicates the number of households with access to refuse removal
services. Households receiving local authority refuse removal services have
increased by 23%, which is 17 825 new households, from 75 663 households in
2007 to 93 488 households receiving refuse removal services by MCLM in 2011.
Approximately 18 000 households still do not receive refuse removal services by
MCLM. Indigent households receive free refuse removal.
REFUSE REMOVAL EXPANSION
In the past, weekly refuse removal took place only in areas of Kagiso, Rietvallei,
Munsieville, Krugersdorp CBD and surrounding suburbs only. Refuse removal was
expanded to areas that were previously not serviced by the municipality. A service
provider has taken over collection of refuse and to expand the service in the
following areas, Kagiso, Chief Mogale, Azaadville, Munsieville, Ga- Mohale,
Magaliesburg, Muldersdrift and in all rural areas of Mogale City. Through this
expansion 77 new jobs were created and seven (7) community based contractors
322017-18 Revised IDP, of the 5 years 2016-2021 Integrated Development Plan
were appointed. The expansion ensured that the number of households in the
various areas as stated below have access to refuse removal services.
Rietvallei Ext 5 850 households
Rietvallei Ext 3A 298 households
Ga-Mogale 620 households
Skip Containers 14 delivered in the rural areas
WASTE TRANSPORTER
In addition, MCLM has opened opportunities for private sector involvement in refuse
removal in the City. This is done through a controlled waste transporter’s licensing
system, which is largely for new residential areas in high income areas of MCLM.
Thus, this system has created private sector jobs and empowering emerging waste
transporters’ businesses.
ILLEGAL DUMPING CONTROL
Major challenges facing MCLM is dealing with the debilitating phenomenon of
littering and illegal dumping, which had made the city unsightly and the most pristine
areas very unwelcoming. This requires MCLM to continue emphasizing awareness
and clean-up campaigns.
ALIEN INVASIVE VEGETATION ERADICATION PROGRAMMES
Eradication of alien vegetation, especially along the water catchment systems has
been identified as one of the environmental problems. MCLM in collaboration with
the Department of Water Affairs co-ordinated four alien invasive vegetation
eradication programmes. Since 2006 more than 2000ha of land affected by alien
invasive plants like blue gum and black wattle have been cleared.
LANDFILL MANAGEMENT
Waste management, in particular management of landfill sites, is a crucial mandate
of local government. MCLM has two operational landfills, Luipaardsvlei and
Magaliesburg. The latter site is intended for rehabilitation and closure.
332017-18 Revised IDP, of the 5 years 2016-2021 Integrated Development Plan
PARKS AND CEMETERIES
MCLM Public Parks Division not only provides for recreational activities, but is also
responsible for aesthetic view of the area. Kagiso Regional Park, is an R11million
multi-year project that was finalized, in the last term. It included development of
amphitheatre, picnic spots, braai areas, ablution facilities, parking areas and
landscape gardens, phase 2 thereof is considered.
Azaadville Park has been another development, which was constructed to the tune
of R3.6m, yielding a total of 37 job opportunities. The park contains a children road
safety area, picnic spots, a maze, two ablution facilities, a multi-purpose court, a
volley ball court and various play grounds. The Park was officially handed over to the
community. Planning for Phase 2 of Azaadville Park, which includes BMX ride park,
has also been finalised.
NEW COMMUNITY PARKS
Magaliesburg, Muldersdrift and Munsieville community parks are multi-year projects
that are completed in the previous years. These parks will include development of
amphitheatre, picnic spots, braai areas, ablution facilities, parking areas and
landscape gardens.
MIG funding of R12m was secured for the expansion of the Kagiso Cemetery. An
EIA was conducted. Solar and wind energy is used at the Kagiso cemetery and is
the first cemetery in the country operating on solar energy. Harmony Gold Mines
donated 54 Ha of land for the expansion of Kagiso cemetery.
The municipality has also engaged a private developer through a competitive bidding
process to develop a Mausoleum at the Sterkfontein Cemetery. A Mausoleum By-
Law was also developed to guide the internment of deceased in the mausoleum. The
purpose of this initiative is to provide an alternative burial method and safe burial
space in the long run.
342017-18 Revised IDP, of the 5 years 2016-2021 Integrated Development Plan
2.6 SOCIAL ANALYSIS
The social programme of the City has been largely based on creating social
upliftment and social recreational activities. The achievements include increased
households that have been assisted through the indigent registration and support of
vulnerable groups, such as children, women and the disabled.
SOCIAL UPLIFTMENT
Approximately 18 000 households registered in the indigent register. This was
achieved through the mass campaigns. Mogale City has decentralized indigent
offices and is making them available in various areas of the city. The aim is to assist
all households, especially the poor community to live a better life.
GENDER, YOUTH, DISABILITY (GEYODI) PROGRAMMES
Government acknowledges that children, women and the disabled are vulnerable
groups in poverty situations and usually lack opportunities to break away from the
situation. Thus, the following programmers are in place:
LOCAL PROGRAMME OF ACTION FOR CHILDREN (LPAC) EARLY
CHILDHOOD DEVELOPMENT CENTRES
Early Childhood Development (ECD) programme is dedicated to children between 0-
6 years. The programme has targeted crèches facilities. MCLM has completed an
audit of all ECD centres to determine the status of readiness of registration, check
the qualification of care givers and assists to register them. Registered ECD centres
receive a government subsidy of approximately R15 per day per child.
ORPHANS AND VULNERABLE CHILDREN
Orphans and vulnerable children programme targets children with one or both
parents that are deceased, children that do have parental guidance and support as
well as child headed families. Mogale City has collected data on orphans and
vulnerable children from schools and non-governmental organisations. The children
in the database are linked to the Bana Pele Programme, which beneficiaries receive
school uniform, school fees exemption, and school nutrition and government social
grants.
352017-18 Revised IDP, of the 5 years 2016-2021 Integrated Development Plan
GENDER BASED PROGRAMMES
GENDER FORUM
Gender forum consists of both women and men to address social issues, such as
gender based violence. There are 30 volunteers trained to do awareness during 16
days of activism against women and children campaign.
MATERNAL HEALTH
The maternal health programme aims to assist, educate and support women in the
prevention of cervical cancer, mother to child transmission as well as teenage
pregnancy.
PROGRAMMES FOR THE ELDERLY
ELDER SUPPORT PROGRAMME
Elderly support programme aims to provide wellness activities to promote healthy
lifestyle. This is achieved through a partnership with Non-Governmental
Organisation, namely Aged in Action to do morning exercises and health talks. There
are nine active clubs that participate in the elderly support programme. Moreover,
there are quarterly screening programmes, such as for chronic diseases.
ELDERLY SPORTS PROGRAMME
Elderly sport is a seasonal programme, which is undertaken in partnership with
Gauteng Sport, Art and Recreation. The objectives of the programme are to facilitate
an active life style for the elderly.
THUSONG SERVICE CENTRES
In collaboration with the Office of the Premier, the municipality launched five
Thusong Service Centres in Kagiso, Munsieville, Hekpoort, Muldersdrift and Tarlton
to enable the communities easy access to government services. Skills development
programmes in construction and related activities are facilitated in Kagiso and
Burgershoop in partnership with the Department of Public Works and the Gauteng
Department of Communication and Information Services.
362017-18 Revised IDP, of the 5 years 2016-2021 Integrated Development Plan
LIBRARY FACILITIES
Mogale City Local Municipality has eleven community libraries, all with computer
centres which have free internet access. All libraries provide daily services of leisure
and study reference and reading material. Major library programmes include:
Readathon
Born to Read
Public Speaking
Science Olympiad
Story-telling Festival
Library Orientation
World Book Day
SPORT FACILITIES
Mogale City has sport facilities through-out the municipality area. These include the
following:
Kagiso Sport Complex
Rietvallei (Lusaka) Sport complex
Kagiso Ext. 13 Sport Complex
Muldersdrift Sport Complex
Rietvallei Sport Complex
Ga- Mogale Sport Complex
Kagiso swimming pool
Azaadville swimming pool
Krugersdorp West swimming pool
372017-18 Revised IDP, of the 5 years 2016-2021 Integrated Development Plan
WARD GAMES
Annual Mayor Soccer Tournament was organised for all youth in wards. Mogale City
assists with expenses of the tournament, winners received awards. Other costs
included soccer jerseys for all participating teams and trophies for winners.
The Mass Participation Programme activities were sustained at four sport hubs:
namely Munsieville, Kagiso, Lusaka and Muldersdrift. This programme is
undertaken in collaboration with the Provincial Department of Sport, Arts, Culture
and Recreation. Activities included soccer, netball and aerobics.
YOUTH DEVELOPMENT PROGRAMMES
Participation of youth in government programmes is regarded as an influential
means to focus on social development. The youth development programme are the
following;
ANNUAL TOWNSHIP ARTS FESTIVAL
The programme intends to engage, support and promote young people who are in
the art fraternity. All wards in the municipal area will benefit from this initiative.
TSHEPO 50 000
In line with the national programme of establishing cooperatives to create more jobs
and sustainable livelihoods, Mogale City Local Municipality through the office of the
youth liaison officer has undertaken the facilitation of establishing youth
cooperatives.
PUBLIC PRIVATE PARTNERSHIP SKILLS DEVELOPMENT PROGRAMME
Through the partnership TJEKA skills development institution, an agreement has
been reached to engage the youth in skills development that include:
Welding.
Boiler making.
Bricklaying.
Tiling, Plastering and Plumbing.
382017-18 Revised IDP, of the 5 years 2016-2021 Integrated Development Plan
It seeks to engage young people in sporting activities and thus promoting a culture of
healthy lifestyles and responsible citizenry.
YOUTH UNEMPLOYMENT AND SOCIO-ECONOMIC DEVELOPMENT
PROGRAMME
The aim of this programme is to offer young men and women training in both
technical and entrepreneurial skills. So far the following training programmes have
been rolled out:
EXECUTIVE MAYOR BURSARY SCHEME
The Office of the Executive Mayor has a bursary scheme geared to assisting youth
to study at tertiary level. The bursary scheme aims to assist deserving post matric
students to study at university, technical institutions and technikons.
LEARNERSHIP PROGRAMME
The aim of this programme is to provide learnerships in partnership with relevant
government and private institutions to the youth of Mogale City.
YOUTH BUSINESS NETWORKING SESSIONS
This initiative is aimed at pulling existing and potential young entrepreneurs together
so to share experience in so far as business management and economic
opportunities are concerned. It also serves as a platform from ward based
leadership.
YOUTH FORUMS
The leadership of the ward based youth forums is at the coal face of the
implementation of youth development programmes and the municipality has made
an undertaking to ensure that such leadership has the requisite skills to face the
convoluted day to day running of the forums. So far the youth forums were engaged
in a programme of leadership skills and will in future receive training in business
administration and other training that will be identified as relevant to their operations.
392017-18 Revised IDP, of the 5 years 2016-2021 Integrated Development Plan
YOUNG POSITIVE LIVING AMBASSADOR PROGRAMME
This programme is driven by young women and men who are infected and affected
by HIV/AIDS. The objective of the programme is to educate young people about
safe sex, positive living and caring for those who are infected.
PUBLIC SAFETY
MCLM has embarked on road safety campaigns and has conducted roadblocks
regularly to minimize road accidents and to comply with the National Road Traffic
Act. There have been several initiatives to curb land invasion and promote public
safety.
The municipality has also been involved in Social Crime Prevention programmes on
prevention of women and children abuse. In conjunction with the SAPS the
municipality has been active in the operation of the Community Policing Forums.
VISIBLE POLICING
In an effort to have police visibility, the municipality provided a fleet of vehicles.
There are approximately 30 traffic controller vehicles. MCLM has 89 men and
women to assist with safety traffic management.
Moreover, MCLM has over 65 Scholar Patrollers to assist with road safety for the
school children, in particular primary school children. Scholar patrollers are used in
the morning and afternoon to help small children to cross busy roads.
ROAD SAFETY AWARENESS
MCLM has embraced early intervention for safety awareness. The local municipality
traffic safety programme targets teenage school children in primary schools all
around the city. In the past over 8 346 children were trained in road safety. MCLM
intends to continue providing safety awareness to reduce the road fatalities.
402017-18 Revised IDP, of the 5 years 2016-2021 Integrated Development Plan
MUNICIPAL COURT
Municipal Court in the City has a jurisdiction on the municipal by-law and local traffic
offence prosecution. The court operates five days a week. This assists the
municipality to reduce the magistrate court backlog on traffic prosecutions.
Picture: Municipal Court Mogale City
Mogale City Municipal Court is the first in Gauteng and has been successful in
reducing the burden on the local magistrate court. The court has been established
after the approval of the National Prosecuting Authority. Over 100 0000 traffic related
cases, both municipal and provincial, have been handled by the court.
MOTOR VEHICLE AND DRIVER LICENSING AND REGISTRATION
Mogale City Motor Vehicle and Driver Licensing and Registration unit together with
the Gauteng Department of Transport plans to establish an office in the townships.
Kagiso is one of the first townships, identified, and Ga-Mogale is considered for the
near further. This office is for examining of applicants for driving and learner licenses
as well as for the renewal of driving licenses.
412017-18 Revised IDP, of the 5 years 2016-2021 Integrated Development Plan
2.7 INSTITUTIONAL ANALYSIS
MUNICIPAL GRADE
The Institutional arrangement of Mogale City as a medium capacity municipality,
category B, grade 4 municipality is in terms of the provision of Local Government:
Municipal Structures Act, 1998, as amended.
ORGANOGRAM
Due to change in the administration of the City, Mogale City’s new organogram has
not been finalised however the staff component is in the region of
1 700 filled posts.
EMPLOYEES WELLNESS SERVICES OFFICE
The Employee Wellness Services Office, with its objective of offering assistance to
employees, has facilitated the regular and successful hosting of
programmes/projects that are aligned with the National Calendar i.e. Wellness Day,
Women’s Day, Candle Light Memorial, Condom and STI Week and Mental Health
Day. The Office has also heeded the call to commemorate Mandela Day, 16 Days of
Activism, as well as World AIDS Day.
In addition to that, the office has also facilitated various Employee Assistance
Programmes through the following life skills programmes, i.e. Voluntary Counselling
and Testing, Drugs and Alcohol Dependency sessions, Financial Awareness
sessions, including offering various forms of counselling to employees. A majority of
employees have benefitted from the EAP interventions implemented.
OCCUPATIONAL HEALTH AND SAFETY (OHS) OFFICE
The completion of the OHS Compliance Audit was a huge step in ensuring that the
Municipality complied with the OHS Act. An OHS System has been developed and
awareness campaigns are being conducted about the implementation of the system
and compliance. The Municipality is currently 75% compliant in relation to OHS
legislation.
422017-18 Revised IDP, of the 5 years 2016-2021 Integrated Development Plan
HIV AND AIDS WORKPLAN
The impact of HIV and Aids in the workplace has been huge, in particular to general
labourers. The HIV and Aids workplan has been used to mitigate the impact, through
HIV and aids sessions held.
AUDIT COMMITTEE
MCLM has maintained an independent Financial Audit Committee which operates in
terms of the provisions of the Local Government: Municipal Systems Act, 2000 and
the Municipal Finance Management Act 56 of 2003.
In complying with the principles of good governance, the Audit Committee has an
approved Audit Committee Charter which has been regularly updated. In the conduct
of its duties, the Audit Committee has performed the following activities:
quality and integrity of the financial reporting process,
system of internal control,
organisation’s process for monitoring compliance with laws and regulations
and code of conduct,
internal and External Audit functions,
performance Management, and
risk management and governance process
Furthermore, the Audit Committee has effectively overseen and approved the
activities of the Internal Audit unit which operates independently in accordance with
an approved Internal Audit Charter and the provisions of the Municipal Finance
Management Act 56 of 2003. The internal audit unit has shared the results of their
work with the external auditors who placed reliance on their work.
PERFORMANCE MANAGEMENT
Both individual performance management of managers reporting to the Accounting
Officer and the organisational performance management system are undertaken
each year. The organizational Quarterly and Annual performance management
reports are submitted to the Performance Audit Committee.
432017-18 Revised IDP, of the 5 years 2016-2021 Integrated Development Plan
RISK MANAGEMENT
Strategic Enterprise Risk Assessment is conducted annually. The Municipality
quarterly monitors the most significant risks at an organizational and departmental
level. The risk management process is further overseen by the Risk Management
Committee team (Risk Champions) and the Audit Committee.
442017-18 Revised IDP, of the 5 years 2016-2021 Integrated Development Plan
2.8 SPATIAL DEVELOPMENT ANALYSIS
SPATIAL DEVELOPMENT
THE SPATIAL DEVELOPMENT FRAMEWORK (SDF) APPROACH IS
DESCRIBED IN TERMS OF THE FOLLOWING:
Specialise activity nodes within and beyond the core development triangle;
Optimise linkages within the core development triangle;
Link disadvantaged communities to within the core development triangle;
Mixed use, high-density development along corridors and at nodes;
Structure the IRPTN to support corridors;
Extend economic activities into PDAs;
Promote infill residential development;
Upgrading of engineering and social infrastructure in PDAs;
Maintain and upgrade residential quality in suburbs;
Formalise and protect the Municipal Open Space System;
Promote access to services through CCCs;
Implement a statutory Urban Edge;
Land reform; and
Informality
2.8.1 LOCAL ECONOMIC DEVELOPMENT
LANSERIA NODAL DEVELOPMENT
The Lanseria Airport City Economic Development Initiative commenced in 2008 with
Mogale City in partnership with the City of Joburg, Tshwane Metropolitan
Municipality, and the Gauteng Provincial Department of Economic Development. A
feasibility study was undertaken and the outcome was to develop the Lanseria
International Airport as an airport city with the objective of catalysing the provincial
economy during the global economic recession. This was followed by the
development of the Lanseria Airport Spatial Economic Development Master Plan in
2010. This further led to the development of the Lanseria Airport City Economic
Development Implementation Plan in 2013, which dealt with a number of economic
development opportunities linked to the Airport covering the City of Joburg, Tshwane
Metropolitan Municipality and MCLM
452017-18 Revised IDP, of the 5 years 2016-2021 Integrated Development Plan
The Lanseria Airport lies within the eastern part of Mogale City, along the R512. The
Airport has been identified as an economic node and an important development link
to the Cradle of Humankind. The airport is also envisaged to influence the
development of the K29 road with the development of Cosmo City. The K29 road
serves as a regional corridor between Johannesburg area and Rustenburg area and
it also connects with the Platinum toll road as spatial corridor.
The airport city is the area that directly surrounds the airport and therefore airport
related/ driven industry takes place here. The other type of industry that will occur
here is non-noise-sensitive industry, which will lie in the area that is most affected by
the noise of the aircraft.
AIRPORT RELATED INDUSTRY INCLUDES:
Freight Forwarding;
Maintenance;
Aviation related businesses;
Entertainment and commercial centres;
Conference centres;
Manufacturing industry; and
Express couriers
NON-NOISE-SENSITIVE INDUSTRY INCLUDES:
Manufacturing industry (especially time-sensitive manufacturing);
Hotels;
Golf courses; and
Storage facilities
Lanseria’s development presents a really positive opportunity for the West Rand – in
particular Mogale City. With all the new institutions to be developed, several job
opportunities will present themselves for locals. Also, more skilled labour will be
generated in Mogale City and as a result, more in-house training will be provided by
companies to ensure maximum productivity. This serves to benefit to locals that are
getting employed as they will become skilled in a wide variety of fields. A skilled
462017-18 Revised IDP, of the 5 years 2016-2021 Integrated Development Plan
workforce is paid better and this will not only drop the unemployment rate but be a
strong contributing factor to addressing socio-economic issues such as poverty.
FURTHER STUDIES, PLANS AND POLICIES
The following detailed studies, plans and policies are required to deal with specific
development challenges and opportunities in more detail:
The proposed Muldersdrift Spatial Development Framework should provide specific
guidance with regard to-
The nature and intensity of land uses;
The nature of development along the N14/R28 corridor and the transition of the
urban environment into the buffer zone;
The linkages with urban development in Johannesburg; and the phased
development of the area through an incremental development approach to prevent
leap-frog development in the area.
An Urban Open Space Framework must be compiled for the Mogale City urban
areas.
A detailed investigation into the long-term rehabilitation and development potential of
the mining land between Krugersdorp and Kagiso must be conducted. Based on the
findings of this study, a local spatial development framework must be drafted for the
area showing the application of the principles as stated in the section dealing with
mining land in the Mogale City Spatial Development Framework.
A township regeneration strategy must be formulated for Mogale City, and must inter
alia determine the most viable locations for nodal development in Kagiso and
Munsieville.
Urban design frameworks must be formulated for each of the activity nodes and
activity spines.
The extent to which low income housing is expected to grow, will put severe
constraints on the municipality’s financial sustainability. The ability to maintain
472017-18 Revised IDP, of the 5 years 2016-2021 Integrated Development Plan
service extension through infrastructure investment while maintaining a healthy
financial position over the long term will become more difficult. In order to support the
objectives of the SDF, the development of a complementary infrastructure
investment framework for the municipality is strongly recommended.
CATALYTIC PROJECTS AND CAPITAL INVESTMENT
The following catalytic projects and capital investment focus areas are seen as key
priorities for the implementation of the development and spatial restructuring
proposals of the SDF.
Investment in Kagiso to improve the quality of this area. This will include;
the creation of high quality urban activity nodes and activity streets that are
able to accommodate a range of services and facilities;
investment in parks and recreation facilities;
investment in public transport facilities and services; and
investment in the general quality of the public environment
Investment in the identified activity spines in the form of-
social housing;
public transport facilities;
upgrading of the physical and public environment; and
upgrading and maintenance of infrastructure and engineering services
Investment in the improvement of the Krugersdorp CBD public environment.
The development of Magaliesburg as a first order rural centre and a major tourism
hub. This will entail :
investment in the quality of the public environment;
48You can also read