EDINBURGH VISITOR ACCOMMODATION SECTOR - Commercial Needs Study 24th January 2019 - Edinburgh Council
←
→
Page content transcription
If your browser does not render page correctly, please read the page content below

EDINBURGH VISITOR ACCOMMODATION SECTOR
Commercial Needs Study
24 th January 2019
Client: City of Edinburgh Council          Report Title: Visitor Accommodation Commercial Needs Study

Contents

EXECUTIVE SUMMARY                                                                      1
1. INTRODUCTION                                                                        3
2. MARKET SUPPLY                                                                       6
3. MARKET PERFORMANCE                                                                  18
4. MARKET TRENDS AND ISSUES                                                            31
5. VISITOR ACCOMMODATION DEVELOPMENT SURVEY                                            37
6. MARKET PROJECTIONS                                                                  47
7. MARKET PRIORITIES                                                                   50

APPENDIX A: MARKET SUPPLY LISTS
APPENDIX B: GLOSSARY OF TERMS

Status: Final
Date: 24th January 2019

For and on behalf of GVA Grimley Limited

Date: January 2019
Client: City of Edinburgh Council                          Report Title: Visitor Accommodation Commercial Needs Study

EXECUTIVE SUMMARY

This report has examined the future commercial need for visitor accommodation in Edinburgh in order to
inform the latest local development plan; City Plan 2030, which covers the period of 2021 to 2031.

Supply growth in Edinburgh over the last 10-15 years has been primarily driven by the hotel sector
(although we have highlighted a number of new serviced apartments which have opened in the last
three years), with a 3.3% annual average growth in hotel bedroom supply (net, including closures). In
particular, there has been significant growth in budget hotel stock in the city which has made up 78% of
all new hotel bedrooms opened between 2012 and 2018.

Despite the increase in supply, the Edinburgh hotel market has performed exceptionally well, with growth
in occupancy and rates since 2013 (other areas of the visitor accommodation sector have also
witnessed occupancy growth over the last three years), driven by a combination of the city’s high
economic and tourism profile, as well as increasing passenger numbers through Edinburgh Airport and
the performance of the Edinburgh International Conference Centre.

Hotel stock is expected to continue to increase with 61 hotels and extensions (totalling 6,338 bedrooms)
identified in the planning pipeline although in our experience it is highly unlikely that all of these proposals
will go ahead as many were submitted several years ago and have not progressed due to funding and
other issues. We note no significant proposed increases in supply for the other areas of the visitor
accommodation sector.

Future demand prospects for the visitor accommodation sector to 2030 appear positive due to a number
of key factors, including several large regeneration projects (e.g. Edinburgh St James), the forecast
growth of passenger numbers at Edinburgh Airport (projected to double by 2030) and the continuing
strength of the city’s business, conference and tourism sectors.

This is matched by strong demand from brands, operators and developers in the visitor accommodation
sector for new and / or additional supply in Edinburgh. Our survey with some of the leaders in the sector
has highlighted overwhelming interest in such opportunities (largely restricted to hotel developments).

Our market model projections (based on historic annual average demand growth) forecasts that there is
capacity for 7,890 new hotel bedrooms in Edinburgh by 2030, including 2,750 under construction or
confirmed.

Date: January 2019                                                                                           Page: 1
However, our stakeholder interviews and surveys with brands, operators and developers have identified a
number of issues that may act as barriers to further visitor accommodation development. In order not to
impede the continuing growth of the sector, the key market priorities for City Plan 2030 are:

        1. Identify new locations for visitor accommodation development in the city. Our research has
             highlighted a lack of available sites in the city centre for future developments and difficulties
             in achieving required returns on investment, which has been at least in part due to high land
             values. Therefore, what is now required as part of City Plan 2030 is to identify new ‘zones’ for
             development that will drive visitor accommodation demand; these can be for sole use, or a
             mixture of commercial, industrial or leisure uses, served by public transport interchanges. They
             should not be located in largely residential areas due to potential conflicts between residents
             and tourists. Areas that may fit this profile could include the International Business Gateway,
             Leith (The Shore) or south of the city centre (University of Edinburgh campus / The Meadows,
             where there is an emerging tech corridor). It should be noted that hotels in these locations are
             more likely to be viable when they are not developed in isolation; they must only be
             developed when a critical mass of demand drivers are established;

        2. Ensure a flexible and transparent planning process. Concerns have been raised by brands,
             operators and developers about the challenges of the planning process and the perception
             of Edinburgh as a ‘difficult’ place to achieve development. Where visitor accommodation
             developments are in locations permitted for use, and meet necessary planning requirements,
             then Edinburgh Council should aim to ensure quick turnaround of decisions and flexibility
             where reasonable (i.e. when all planning criteria have been met). It is important that
             Edinburgh promotes itself as a city ‘open for business’.

Although it is outwith the ‘control’ of City Plan 2030, consideration needs to be given to encouraging visits
on shoulder months to help combat seasonality and spread demand throughout the year. This should in
turn help combat the perceived lack of value for money issue that is prevalent in peak summer months.

Finally, our stakeholder consultations highlighted a conflict between a) the reported imbalance of supply
due to budget developments and b) value for money being a perceived threat. Due to hotel
development funding and deliverability remaining challenging, as highlighted by the developer survey, it
is likely that commercially, budget hotels will continue to be delivered. However, upscale four and five-
star hotels are considered important to attract high paying visitors (including conference delegates) and
maintain a good balance of accommodation types.

Date: January 2019                                                                                     Page: 2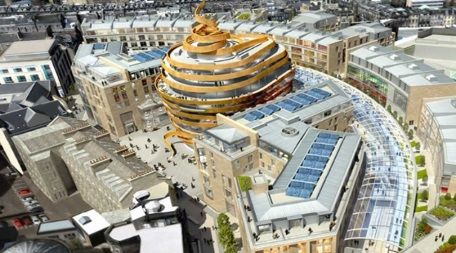
Client: City of Edinburgh Council                            Report Title: Visitor Accommodation Commercial Needs Study

1.       Introduction

         Background and Purpose

1.1      City of Edinburgh Council (‘Edinburgh Council’) has instructed a land and property commercial
         needs study to inform the preparation of the next Edinburgh Local Development Plan (LDP),
         named City Plan 2030, which is currently programmed for adoption in January 2021. This will
         replace the existing LDP which was adopted in 2016. City Plan 2030 will cover the calendar years
         of 2021-2031 inclusive.

1.2      The commercial needs study is delivered by the Council’s framework commercial property
         consultants, led by Ryden and supported by sub-consultants GVA, Cushman & Wakefield and JLL.
         It covers four key sectors of the city’s economy; office, industrial, retail and visitor
         accommodation.

1.3      This report, undertaken by GVA’s Hotel Consultancy team, provides a detailed assessment of the
         city’s visitor accommodation sector in order to provide a robust evidence base to inform the City
         Plan 2030. The report looks at Edinburgh’s current supply of visitor accommodation, how it has
         performed over the last five to ten years, how it is expected to grow (in terms of proposed
         developments in the planning pipeline), as well as identifying some of the macro and micro-
         environment trends and issues that will influence growth over the period of City Plan 2030.

1.4      Whilst the report covers all types of visitor accommodation, there is a focus on hotels and serviced
         apartments, as these are the two principal areas providing supply growth (in the form of new
         developments) in the sector.

         Current Policy

1.5      The current LDP makes no reference to any areas of the visitor accommodation sector other than
         to hotels.

1.6      Current policy relating to hotel development in Edinburgh states;

         “Hotel development will be permitted:

              a) In the City Centre where developments may be required to form part of mixed use
                  schemes, if necessary to maintain city centre diversity and vitality, especially retail vitality
                  on important shopping frontages;

              b) Within the boundaries of Edinburgh Airport, the Royal Highland Centre and the
                  International Business Gateway and

Date: January 2019                                                                                             Page: 3
c) In locations within the urban area with good public transport access to the city centre.”

        Methodology

1.7     In order to prepare an evidence base of current and emerging trends in the visitor
        accommodation sector, we have undertaken the following (research undertaken between
        September and December 2018):

             •   An overview of current levels of supply, covering visitor accommodation as a whole, but
                 providing more detail on hotels and serviced apartments;

             •   An analysis of the future supply of visitor accommodation, again with a focus on hotels
                 and serviced apartments;

             •   An overview of where supply is located, in the context of both key demand drivers and
                 key transport routes;

             •   A review of Edinburgh’s tourism, economic and hotel market performance trends over the
                 last ten years;

             •   An overview of UK-wide hotel and serviced accommodation trends and issues;

             •   Consultations     with   a   number   of   key   stakeholders    within   Edinburgh’s   visitor
                 accommodation sector in order to discuss the key trends and issues in the market;

             •   A review of planning policy, strategy documents and other relevant material pertinent to
                 the visitor accommodation sector;

             •   A survey with leading brands, developers and operators to establish appetite for and
                 nature of future developments in Edinburgh;

             •   A market model in order to inform future need for additional visitor accommodation in
                 Edinburgh;

             •   Identification of the key visitor accommodation sector priorities for City Plan 2030.

Date: January 2019                                                                                       Page: 4
Quality Control

Report Produced by:        Checked by:               Approved by:

Ian Derrick                Andrew Renouf             Richard Gaunt

Senior Consultant          Director                  Senior Director

Ian.Derrick@gva.co.uk      Andrew.Renouf@gva.co.uk   Richard.Gaunt@gva.co.uk

0131 469 6028              0131 469 6026             020 7911 2034

11.12.2018                 12.12.2018                14.12.2018

Date: January 2019                                                             Page: 5
Client: City of Edinburgh Council                          Report Title: Visitor Accommodation Commercial Needs Study

2.       VISITOR ACCOMMODATION MARKET SUPPLY

         Introduction

2.1      In this section we present an overview of current levels of visitor accommodation supply and
         pipeline in Edinburgh (within the city boundaries). Although this covers visitor accommodation as
         a whole, we provide more detail on hotel and serviced apartments, as these are the areas of the
         sector that are driving new development. We have provided an overview of hostels, guest houses
         / B&Bs, student halls (let out-with term time) and AirBNB to provide context to the wider visitor
         accommodation sector.

         Current Supply - Hotels

2.2      We have identified 167 hotels within Edinburgh providing 13,180 bedrooms. The structure of the
         market is shown in Table 2.1 below and we provide a full list in Appendix A.

Table 2.1: Structure of the Edinburgh Hotel Market

Grade*                              No. of Hotels         No. of Rooms                   % of Room Supply

5-star                                     12                  1,078                             8.2%
4-star                                     43                  4,114                            31.2%
3-star                                     52                  3,019                            22.9%
2-star                                     20                   436                              3.3%
Budget                                     40                  4,533                            34.4%
Total Supply                              167                 13,180                            100%
Source: AM:PM / Visit Scotland
* See Appendix B for grading definitions

2.3      The highest percentage of room supply is provided by budget hotels (34%); the recent growth in
         this sector is shown overleaf.

2.4      53% of hotels are independent, while the remainder are nationally or internationally branded. This
         varies by grade with the majority of budget hotels being branded and a large number of
         independents in the two/three-star space.

2.5      We illustrate the geographical distribution of the hotel market in Map 2.1.

2.6      There have been ten hotel closures since 2012. With the exception of the Thistle King James
         Edinburgh (demolished to make way for the Edinburgh St James scheme) the remainder of
         closures are of smaller hotels (less than 50 bedrooms), the vast majority of which have been
         converted to residences.

Date: January 2019                                                                                           Page: 6
Graph 2.1: Structure of the Edinburgh Hotel Market – bedrooms by grade

                                                      1,078

                          4,533
                                                                                       5-star
                                                                     4,114
                                                                                       4-star

                                                                                       3-star

                              436                                                      2-star

                                              3,019                                    Budget

Source: GVA / AM:PM Hotels Database / VisitScotland

2.7     Since 2012, 24 hotels have opened in Edinburgh, adding 3,139 bedrooms to the market; a 23.8%
        increase in supply;

2.8     Of these openings 16 have been budget hotels, adding 2,442 bedrooms. As a result, 78% of all
        new hotel bedrooms opened in Edinburgh since 2012 have been in budget hotels. As shown
        below, the majority (57%) have been in either Premier Inn or Travelodge branded hotels.

Graph 2.2: Budget Hotel Openings in Edinburgh since 2012

                        1 hotel (198 rooms)
       1 hotel (228 rooms)
                                                       7 hotels (967 rooms)        Premier Inn*
   2 hotels (348 rooms)
                                                                                   Travelodge
                                                                                   Ibis*
                                                                                   Motel One
                                                                                   Hampton
   3 hotels (523 rooms)
                                                                                   Independent
                           2 hotels (181 rooms)

Source: GVA / AM:PM Hotels Database / VisitScotland
* ‘Premier Inn’ includes Premier Inn and Hub by Premier Inn and ‘Ibis’ includes Ibis, Ibis Budget and Ibis
Styles

Date: January 2019                                                                                 Page: 7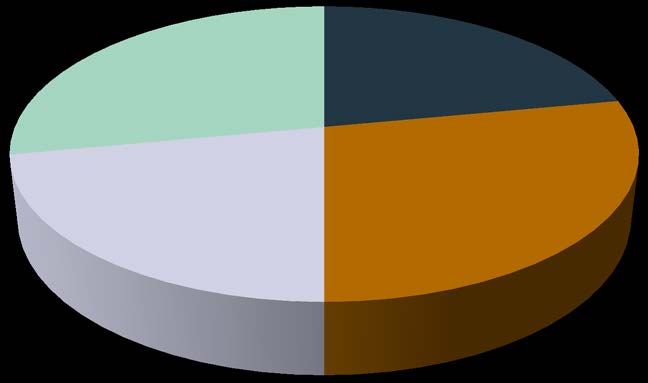
Current Supply – Serviced Apartments

2.9      Serviced apartments (which includes apart-hotels) are defined as properties offering a hotel-like
         room but typically with larger than average or multiple bedrooms, including additional working
         and kitchen amenities (AM:PM Hotels Database). We have identified 40 serviced apartments
         within Edinburgh providing 1,488 units. The structure of the market is detailed in Table 2.2 below
         and we provide a full list in Appendix A.

Table 2.2: Structure of the Edinburgh Serviced Apartment Market

                                            No. of Serviced
Grade*                                                                No. of Units        % of Room Supply
                                                 Apartments

Luxury Class                                          8                   327                   22.0%
Upper Upscale Class                                  15                   417                   28.0%
Upscale Class                                         3                   334                   22.4%
Upper Midscale Class                                 14                   410                   27.6%
Total Supply                                         40                  1,488                  100%
Source: AM:PM / VisitScotland
* STR / AM:PM grading system used in place of VisitScotland as not all serviced apartments are enrolled in
VisitScotland’s Quality Assurance Scheme. Grade is based on each serviced apartment’s average daily
rate performance within the overall market.

2.10     Serviced apartment supply in Edinburgh is fairly evenly weighted across the four categories; we
         note that there are no economy (i.e. budget) serviced apartment properties; this is not unusual as
         serviced apartments tend to be midscale, upscale or luxury offerings, providing a level of quality
         similar to a four or five-star hotel.

2.11     There have been a number of recent serviced apartment openings in the last two years,
         including:

             •   The Edinburgh Grand (2018, 50 keys);

             •   Mode Apart-hotel (2018, 82 keys);

             •   Eden Locke (2017, 72 keys);

             •   Apart-hotel Adagio Edinburgh Royal Mile (2016, 146 keys).

2.12     These properties reflect the growth in the apart-hotel concept, appealing to shorter stay visits (see
         Section 4).

2.13     We note four serviced apartment closures since 2012. All of these appear to have been
         converted to residential use.

Date: January 2019                                                                                      Page: 8
Graph 2.2: Structure of the Edinburgh Serviced Apartment Market (Number of Keys per Grade)
327
417
Luxury
Upper Upscale
Upscale
Upper Midscale
410
334
Source: GVA / AM:PM Hotels Database / VisitScotland
Current Supply – Hostels
2.14 We have identified 15 hostels within Edinburgh providing 457 bedrooms (2,327 bed spaces). We
list them in Appendix A.
2.15 Only two hostels have opened in last ten years; Bobby’s Bunkhouse (2015) and CODE Hostel
(2014).
2.16 The majority are independent, with only three branded hostels; Safestay, St Christopher’s and
Scottish Youth Hostel Association.
2.17 We note three closures since 2012. According to AM:PM, two of these properties, Brodies Hostel
and the Boutique Backpackers Hostel, plan to reopen as hotels.
Current Supply – AirBNB
2.18 Due to the nature of AirBNB (hosts can at short notice list or de-list properties), it is difficult to
provide an accurate picture of the exact number of properties in Edinburgh. In September 2017
(latest available data) Inside AirBNB identified 9,638 properties in Edinburgh that are registered
with AirBNB.
2.19 There has been significant growth in AirBNB properties in recent years. According to Inside AirBNB,
the number of listed properties in Edinburgh increased by around 50% between July 2016 and
September 2017.
Date: January 2019 Page: 92.20 We also note that several of the guest houses identified are also listed on AirBNB, highlighting an
element of cross-over amongst the various accommodation sub-sectors.
2.21 We detail the impact of the growth of AirBNB in Edinburgh in Section 4.
Current Supply – Other Accommodation
2.22 We have identified 200 guest houses / B&Bs in Edinburgh, providing around 1,300 bedrooms. We
note 28 guest house closures in the last three years (with a further nine currently listed for sale), the
vast majority of which have been converted to residential use.
2.23 We have identified 37 student halls in Edinburgh, of which we are able to confirm 35 are available
to rent during summer (nine are exclusively let during the festivals in August).
2.24 VisitScotland lists over 394 self-catering properties (although there is some cross-over with serviced
apartments) and four holiday / touring parks.
Date: January 2019 Page: 10Distribution of Supply
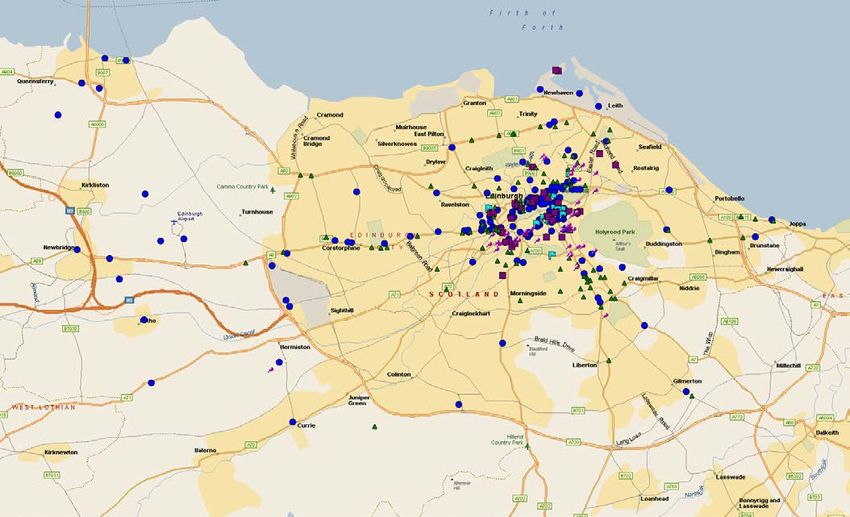
2.25 The following map shows the distribution of supply across Edinburgh (excluding self-catering
accommodation, touring parks and AirBNB).
2.26 With the exception of guest houses (which are more dispersed) supply is primarily concentrated in
the core city centre, broadly defined as stretching from Haymarket in the west, to Holyrood in the
east, and from the New Town in the north, to the Meadows in the south.
2.27 There are also clusters along key transport routes such as the A8 and A701, as well as at Edinburgh
Airport and South Queensferry.
Map 2.1: Distribution of Current Visitor Accommodation Supply in Edinburgh
Key:
• Blue Circle = Hotels
• Purple Square = Serviced Apts.
• Turquoise Flag = Hostels
• Green Triangle = Guest Houses / B&Bs
• Pink Tacks = Student Halls
Source: GVA / Microsoft MapPoint
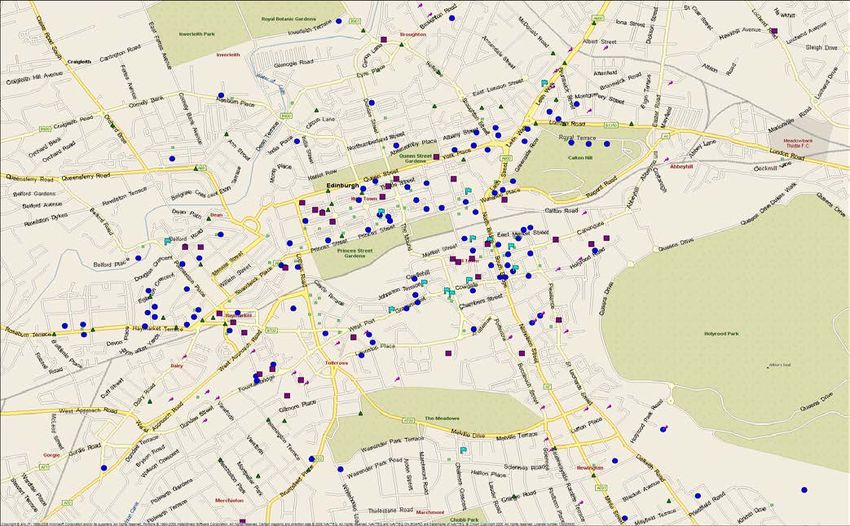
2.28 We show the city centre supply in the map overleaf. It highlights a heavy concentration of
accommodation (particularly hotels) within the Old Town and the “Golden Rectangle” of the
New Town.
Date: January 2019 Page: 11Map 2.2: Distribution of Current Visitor Accommodation Supply in Edinburgh City Centre
Key:
• Blue Circle = Hotels
• Purple Square = Serviced
Apts.
• Turquoise Flag = Hostels
• Green Triangle = Guest
Houses / B&Bs
• Pink Tacks = Student Halls
Source: GVA / Microsoft MapPoint
2.29 We summarise the current supply of all accommodation types (excluding AirBNB and student
halls) in the following table.
Table 2.3: Structure of the Edinburgh Visitor Accommodation Market – Current Supply
Type No. of Properties No. of Bedrooms / Units
Hotels 167 13,180
Serviced Apartments 40 1,488
Hostels 15 457 (2,327)
Guest Houses 200 1,300
Total 422 15,968
Source: AM:PM / VisitScotland
Visitor Accommodation Pipeline - Hotels
2.30 We have examined the potential future hotel supply increases in Edinburgh. Data sources include
AM:PM and Estates Gazette Interactive (EGi); identified schemes have been cross-checked with
the planning department at Edinburgh Council.
Date: January 2019 Page: 122.31 We have identified 61 schemes in the planning pipeline (including extensions to existing hotels);
representing a potential increase of 6,338 bedrooms. We detail the structure of the future hotel
supply in Table 2.4. We provide a full list in Appendix A.
2.32 It is highly unlikely that all of these proposals will come to fruition, particularly as a number
received planning permission several years ago, but have not progressed.
Table 2.4: Hotel Pipeline Schemes - Edinburgh
Grade Schemes Bedrooms % Schemes % Bedrooms
5-star 5 649 8% 10%
4-star 12 1,023 20% 16%
3-star 28 2,917 46% 46%
2-star 3 83 5% 1%
Budget 13 1,666 21% 26%
Total Supply 61 6,338 100% 100%
Source: AM:PM / EGi / City of Edinburgh Council
2.33 Almost half of the schemes identified are for three-star hotels (although these may evolve as
brands are confirmed for the schemes).
2.34 26% of new bedrooms proposed are for budget hotels. After a recent wave of openings, it would
appear that there are fewer such proposals due to open in Edinburgh in the near future.
2.35 Ten hotels are under construction with a further 12 (including extensions) having brand or opening
date confirmed (and therefore are likely to proceed), representing 43% of the total pipeline (2,750
bedrooms). We summarise the status of all applications in Table 2.4 and list those under
construction and confirmed in Table 2.5.
Table 2.5: Status of Edinburgh Future Hotel Supply
Status* Schemes Bedrooms % Schemes % Bedrooms
Awaiting Determination 28 2,884 46% 46%
Planning Approved 13 1,274 21% 20%
Deferred 7 261 11% 4%
In Construction 10 1,558 16% 25%
Unconfirmed 3 361 5% 6%
Total 61 6,338 100% 100%
Source: AM:PM / EGi / City of Edinburgh Council
* See Glossary in Appendix B for status definitions
Date: January 2019 Page: 13Table 2.6: Hotel Schemes in Edinburgh under Construction or Likely to Proceed Hotel Name Opening Grade Bedrooms Malmaison (St Andrews Square) 2019 4 72 Yotel Edinburgh (Queen Street) 2019 Budget 280 Fingal (The Shore) 2019 4 23 Premier Inn Princes Street (former BHS Store) 2019 Budget 133 Moxy Edinburgh Airport (Fairview Road) 2019 Budget 230 Westgate Inn (South Gyle Broadway) 2019 3 79 Carlton Edinburgh (Market Street) 2019 4 98 Hampton by Hilton Edinburgh Airport (Almond Avenue) 2019 Budget 240 VOCO by IHG (Torphichen Street) 2020 4 150 W Hotel Edinburgh (Edinburgh St James) 2021 5 253 Point A Hotel Edinburgh (Morrison Street) TBC Budget 149 Moxy Edinburgh (Fountainbridge) TBC Budget 263 Premier Inn Edinburgh East (Willowbrae Road, extension) TBC Budget 21 Premier Inn Edinburgh South Queensferry (Builyeon Road, extension) TBC Budget 20 The Scotsman Hotel (North Bridge, extension) TBC 5 11 Premier Inn Edinburgh Haymarket (Morrison Street) TBC Budget 180 Virgin Hotel Edinburgh (Victoria Street) TBC 5 225 Holiday Inn Express Edinburgh Waterfront (Ocean Drive, extension) TBC Budget 24 Hyatt Regency Edinburgh Marina (West Harbour Road) TBC 4 123 Holiday Inn Express Edinburgh City Centre (extension) TBC Budget 25 Jurys Inn Edinburgh (Jeffrey Street, extension) TBC 3 101 Premier Inn Edinburgh City Centre Princes Street (extension) TBC Budget 50 Source: AM:PM / EGi / City of Edinburgh Council Date: January 2019 Page: 14
Visitor Accommodation Pipeline – Serviced Apartments

2.36      Using the same data sources as for hotels, we have identified seven serviced apartment schemes
          in Edinburgh, representing an increase of 520 keys. The status of these applications is shown in
          Table 2.7 below and we provide a full list in Appendix A.

Table 2.7: Status of Future Serviced Apartment Supply - Edinburgh

 Status                                   Schemes         Bedrooms      % Schemes         % Bedrooms
 Awaiting Determination                       1               14            14%                 3%
 Planning Approved                            4              305            57%                59%
 In Construction                              2              201            29%                39%
 Total                                        7              520           100%               100%
Source: AM:PM / EGi / City of Edinburgh Council

2.37      The two schemes under construction are Wilde by Staycity Aparthotels at King’s Stables Road (128
          keys, due 2019) and Roomzzz Edinburgh St James (73 keys, due 2021).

          Visitor Accommodation Pipeline – Hostels

2.38      Using the same data sources as for hotels, we have identified three hostel schemes (36
          bedrooms), none of which are under construction. The status of these applications is shown in
          Table 2.8 below and we provide a full list in Appendix A.

Table 2.8: Future Hostel Supply - Edinburgh

 Status                                   Schemes         Bedrooms      % Schemes         % Bedrooms
 Awaiting Determination                       1               6             33%               17%
 Planning Approved                            2              30             67%               83%
 Total                                        3              36            100%              100%
Source: AM:PM / EGi / City of Edinburgh Council

Date: January 2019                                                                                  Page: 15
Distribution of Future Visitor Accommodation Supply
2.39 As shown in Map 2.3 below the locations of the planned hotel, serviced apartment and hostel
developments are primarily within the city centre and mirror that of the existing supply. However,
we note emerging clusters around Edinburgh Airport and Leith Walk / The Shore. It is likely that due
to the lack of available sites in the city centre (discussed further in Section 4 and 5), developers
and operators are willing to consider well-connected areas further out.
Map 2.3: Distribution of Future Visitor Accommodation Supply in Edinburgh
Key:
• Red Circle = Hotels
• Purple Square = Serviced Apts.
• Turquoise Flag = Hostels
Source: GVA / Microsoft MapPoint
Visitor Accommodation Pipeline – Others
2.40 We are also aware of 14 applications pertaining to guest houses in Edinburgh (although this
comprises a mix of change of use to and from guest houses (four proposals are for conversion to
residential use) as well as extensions). We provide a list of these applications in Appendix A.
2.41 We summarise the potential pipeline of all accommodation types (excluding AirBNB and guest
houses) in the table overleaf.
Date: January 2019 Page: 16Table 2.9: Structure of the Edinburgh Visitor Accommodation Market – Potential Pipeline
Type No. of Properties No. of Bedrooms / Units
Hotels 61 6,338
Serviced Apartments 7 250
Hostels 3 36
Total 71 6,624
Source: AM:PM / VisitScotland
Summary
2.42 It is clear from the analysis that the key sub-sector of recent growth has been the hotel market,
followed by serviced apartments. In contrast we note a contraction in the number of guest
houses / B&Bs (28 closures), the majority of which have been converted to residential use.
2.43 Within the hotel sector, the biggest growth has been in the budget sector. A third of all new hotels
opened since 2012 (78% of total additional room stock) have been in budget properties, although
we note a slowdown in the quantum of budget hotel applications in the planning pipeline.
2.44 The hotel sector is expected to expand further, with 61 hotels (or extensions to existing hotels)
identified in the planning pipeline, of which ten are under construction (1,558 additional
bedrooms). It is highly unlikely that all 61 proposals will come to fruition, particularly as a number
received planning permission several years ago and have not progressed.
Date: January 2019 Page: 173. MARKET PERFORMANCE
Introduction
3.1 In this section, we examine the recent performance of Edinburgh’s visitor accommodation sector
and look at the demand drivers that have created growth. We conclude by looking at a number
of new development and regeneration schemes that will influence growth to 2030.
Hotels and Serviced Apartments
3.2 The following graph details the average annual occupancy (left axis) of hotels in Edinburgh
between 2005 and 2017. The data is provided by STR Global, the market leader in hotel
performance benchmarking. Although the majority of participants are hotels, it includes a
number of leading serviced apartments in the Edinburgh market. Participation numbers have
fluctuated over the period 2005-17, however as of December 2017, there were 112 participating
hotels and serviced apartments in Edinburgh (54% of our identified hotel and serviced apartment
market supply).
3.3 Within the graph we also detail the annual percentage change (right axis) in supply and
occupancy over the period (see Appendix B for definition on the metrics used in this section).
Graph 3.1: Edinburgh Hotel Occupancy – 2005 to 2017
90.0% 10.0%
8.0%
85.0%
6.0%
4.0%
80.0%
2.0%
75.0% 0.0%
-2.0%
70.0%
-4.0%
-6.0%
65.0%
-8.0%
60.0% -10.0%
2005 2006 2007 2008 2009 2010 2011 2012 2013 2014 2015 2016 2017
Occupancy Occupancy Growth Supply growth
Source: STR Global 2018
Date: January 2019 Page: 183.4 Edinburgh experienced an initial three years of occupancy growth before the impact of the
economic recession was felt in 2008 and 2009. Occupancy then recovered well in the next two
years reaching 80.0% for the first time over the period.
3.5 2012 witnessed a drop in occupancy to 77.3% which can largely be attributed to the sharp
increase in supply (8.2% over 2011), as well as other factors such as poor summer weather and the
London Olympics which diverted tourism away from other major cities in the UK such as
Edinburgh.
3.6 Since 2013 Edinburgh has witnessed year on year occupancy growth, reaching a peak level of
83.7%. This is despite continuous supply growth over the period.
3.7 2017 occupancy of 83.7% is the highest across the studied period and well in excess of the
Regional UK average (76.1%).
3.8 However, in October 2018 year to date (YTD) there was a 1.4% drop in occupancy compared
with the same period in 2017. This is largely due to the increase in rooms sold (+4.1%) failing to
keep pace with the growth in new supply (+5.6%); suggesting a general slowing of demand
growth in 2018.
3.9 The following graph details Edinburgh average daily rate (ADR) and revenue per available room
(RevPAR, see Appendix B for details for the definition of terms) performance between 2005 and
2017.
Graph 3.2: Edinburgh Hotel ADR and RevPAR – 2005 to 2017
£120.00
£100.00
£80.00
£60.00
£40.00
£20.00
£0.00
2005 2006 2007 2008 2009 2010 2011 2012 2013 2014 2015 2016 2017
ADR RevPAR
Source: STR Global 2018
Date: January 2019 Page: 193.10 Edinburgh ADR has followed a similar pattern to occupancy, with initial growth before the impact
of the economic recession drove rates down. ADR stagnated for a number of years and took
longer to recover than occupancy as hoteliers found it difficult to increase rates in the wake of
the recession.
3.11 However, since 2013 ADR has increased at a higher rate of growth than occupancy. ADR in 2017
reached £103.29; the highest level over the period and 10.4% higher than in 2016.
3.12 Throughout the period Edinburgh ADR has tracked significantly above the Regional UK average
and was 43.7% higher in 2017.
3.13 The RevPAR trend mirrors that of occupancy and ADR, with a dip around the recession and 2012,
followed by continuous growth since 2013; peaking in 2017 at £86.41. The growth in RevPAR
between 2012 and 2017 was 42.7%, higher than the Regional UK average (32.2%).
3.14 Data for October 2018 YTD highlights marginal growth in ADR (+0.8%) on the same period in 2017;
probably a market “correction” following exponential growth in 2017, but also due to the growth
in market supply and slowing demand growth limiting hoteliers’ ability to increase rates. Due to
the drop in occupancy and fractional ADR growth, RevPAR in October 2018 YTD decreased by
0.6%.
3.15 Despite the strong growth in recent years, Edinburgh remains a seasonal hotel market, as
demonstrated in the following graph.
Graph 3.3: Edinburgh Occupancy and ADR by Month – 2017
£180.00 100.0%
£160.00 90.0%
£140.00 80.0%
70.0%
£120.00
60.0%
£100.00
50.0%
£80.00
40.0%
£60.00
30.0%
£40.00 20.0%
£20.00 10.0%
£0.00 0.0%
Jan Feb Mar Apr May Jun Jul Aug Sep Oct Nov Dec
2017 Monthly Occupancy 2017 Monthly ADR
Source: STR Global 2018
Date: January 2019 Page: 203.16 Occupancy remains around the 90% mark between April and September, peaking in August
during the summer festivals. Occupancy then dips in winter months, reaching its lowest point of
60.0% in January.
3.17 ADR follows a similar pattern and remains above £110.00 between May and September, peaking
at £158.15 during the summer festivals in August. As with occupancy January is the weakest
performing month with ADR dropping to less than £70.00.
Hostel, Self-Catering and Guest Houses / B&Bs
3.18 There is no source of published average rate performance data for hostels, self-catering
properties and guest houses / B&Bs, however VisitScotland produces annual occupancy statistics
for these markets which we illustrate in the following graph.
Graph 3.4: Edinburgh Hostel, Self-Catering and Guest House / B&B Occupancy – 2011 - 2017
80.0%
70.0%
60.0%
50.0%
40.0%
30.0%
20.0%
10.0%
0.0%
2011 2012 2013 2014 2015 2016 2017
Guest House Room Occupancy Self Catering Unit Occupancy Hostel Bed Occupancy
Source: VisitScotland
3.19 The graph shows there is limited correlation between the three types of accommodation.
However, all have experienced positive growth in the last three years to reach peak levels in 2017,
in line with the hotel sector. There is no 2018 YTD data available.
3.20 While growth is strong, occupancy levels remain below that of the hotel sector. These
accommodation sectors experience more pronounced seasonality than hotels as their main
market is leisure tourism (hotels benefit from corporate demand in the tourism low season that
offsets the drop in visitors to an extent).
Date: January 2019 Page: 21Demand Drivers - Introduction
3.21 In this section, we briefly look at the reason for growing demand in the Edinburgh visitor
accommodation sector in recent years.
Demand Drivers – Economy
3.22 Edinburgh has one of the largest economies in the UK and is considered one of the fastest
growing regions in Europe, due in part to a large financial services sector. It is home to a large
number of international firms and is the headquarters of major firms such as Royal Bank of
Scotland, Standard Life Aberdeen, and Scottish Widows. This in turn drives year-round hotel
demand.
3.23 The following graph highlights Edinburgh’s total gross value-added (GVA) plotted against the
RevPAR trend from Graph 3.2. It highlights a broad correlation between the GVA growth (left axis)
and the increase in hotel RevPAR performance (right axis) in Edinburgh, particularly during the last
five years. This would demonstrate that the growing strength of Edinburgh’s economy has played
a large part in increasing hotel performance as a result of high levels of corporate demand.
Graph 3.5: Edinburgh Total GVA and Hotel RevPAR – 2005-2016
£25 £90.00
£80.00
£20 £70.00
£60.00
£15
£50.00
£40.00
£10
£30.00
£5 £20.00
£10.00
£0 £0.00
2005 2006 2007 2008 2009 2010 2011 2012 2013 2014 2015 2016
Edinburgh GVA (£bn) Edinburgh RevPAR
Source: Office for National Statistics / STR Global 2018
3.24 In addition to the corporate sector, Edinburgh is one of Europe’s leading conference and events
destinations. It is the number one International Congress and Convention Association (ICCA)
Date: January 2019 Page: 22conference destination in the UK outside London and rated 32nd in the top worldwide city
rankings. (20th in Europe, ICCA 2017). The annual economic value of Edinburgh’s business tourism
is estimated to be in excess of £300m (Convention Edinburgh).
3.25 The Edinburgh International Conference Centre (EICC) is the principle conference centre for the
city and hosts over 200,000 delegates each year. Peak months include May, June, July,
September and November with a split of around 60% association business and 40% corporate.
3.26 According to research undertaken by the EICC, since opening in 1995 it has welcomed 1.3 million
delegates from more than 120 countries generating £600m of economic impact for the city
region. It is likely that the extension to the EICC, completed in 2013 and doubling its capacity, has
played a large part in the continuing strong performance growth by hotels in the city in the last
five years.
3.27 From previous discussions from the EICC, we are aware that there is often a shortage of
accommodation in the city when there is a major event at the venue and local hotels are often
unable to provide enough rooms for block bookings. We have consulted with EICC as part of this
Study and include some of our collated findings in Section 4.
3.28 Commercial growth in recent years has also been driven by burgeoning technology and software
sectors in the city, which is home to major firms such as Rockstar and Skyscanner. According to
Tech Nation’s 2018 Report, digital jobs in Edinburgh increased over three times faster than the UK
average between 2014 and 2017.
3.29 In addition to conference and corporate demand, Edinburgh’s three universities (and further
education colleges) provide a population of over 140,000 students. This creates visitor
accommodation demand in relation to visiting lecturers, students and families, conferences and
events and during graduation ceremonies.
Demand Drivers – Tourism
3.30 Edinburgh has a strong leisure tourism profile and maintains its status as the most popular tourist
destination in the UK after London. It is home to some of the UK’s leading visitor attractions, such
as the National Museum of Scotland, Edinburgh Castle and Scottish National Gallery.
3.31 Graph 3.6 overleaf charts total tourism visitor spend (left axis) over the period of 2006 to 2017
(including business tourism). Again, we measure this against hotel RevPAR performance (right
axis). Over the last five years in particular, there is a strong correlation between the growth of
visitor expenditure and hotel RevPAR.
Date: January 2019 Page: 23Graph 3.6: Edinburgh Visitor Expenditure and Hotel RevPAR – 2006-2017
£2,000 £100.00
£1,800 £90.00
£1,600 £80.00
£1,400 £70.00
£1,200 £60.00
£1,000 £50.00
£800 £40.00
£600 £30.00
£400 £20.00
£200 £10.00
£0 £0.00
2006 2007 2008 2009 2010 2011 2012 2013 2014 2015 2016 2017
Visitor Spend (£m) RevPAR
Source: Visit Britain / STR Global 2018
3.32 The following table details the purpose of trips by domestic and overseas visitors to Edinburgh in
2011 and 2016 (latest available data). It highlights that although the reason for international visits
remains broadly unchanged, there has been a strong growth in domestic holiday and business
visits at the expense of visiting friends and relatives (VFR). VFR visits are more likely to involve a
home stay, rather than within visitor accommodation, compared with holiday and business visits.
Therefore, more visitors to Edinburgh are staying within the city’s visitor accommodation stock,
rather than with friends or relatives. This further supports that the growth in leisure and business visits
to the city have contributed to the increasing occupancy of its visitor accommodation sector.
Table 3.1: Main Purpose of Trip to Edinburgh and the Lothians (2011 and 2016)
2011 2016
Reason
Domestic International Domestic International
Holiday 65% 67% 74% 68%
Business 12% 19% 18% 22%
Visiting Friends/Relatives 16% 12% 7% 10%
Other 6% 3% 2% 0%
Total Visits 2.48m 1.26m 2.22m 1.70m
Source: Visit Scotland
3.33 Other key factors relating to leisure tourism that contribute to strong visitor demand in the city
include:
Date: January 2019 Page: 24• Edinburgh’s 12 international festivals, which attract over 4.5 million people annually.
Edinburgh Festival Fringe achieved a record 2.9m ticket sales in 2018. The city’s visitor
accommodation regularly sell-out and charge premium room prices during the Festival in
August (an issue highlighted during our stakeholder consultations, see Section 4);
• The Royal Highland Showground welcomes over one million visitors annually. The venue
hosts a wide programme of events throughout the year, the largest of which is the Royal
Highland Show, attracting over 200,000 visitors each June;
• Murrayfield hosts international rugby union matches in February, March and November.
The stadium has also historically hosted American football, rugby league and football
matches as well as music concerts which drive accommodation demand.
Demand Drivers – Edinburgh Airport
3.34 Edinburgh Airport has witnessed exceptional growth in recent years with a 56% increase in
passenger numbers between 2010 and 2017. This is in part due to new direct long haul routes to
North America, the Middle East, and since 2017, to China, as well as improved infrastructure at
the airport. The growth in Edinburgh’s passenger numbers since 2010 is shown in the following
table. Later in this section we detail the forecast passenger growth for Edinburgh to 2030 and
beyond.
Graph 3.7: Edinburgh Airport Passenger Growth – 2010 to 2017
16,000
14,000
Number of Passengers (000s)
12,000
10,000
8,000
6,000
4,000
2,000
0
2010 2011 2012 2013 2014 2015 2016 2017
Source: Edinburgh Airport
Date: January 2019 Page: 253.35 The growth in long haul routes from Edinburgh Airport has changed the composition of passenger
origin. As shown in the following graph, the majority of passengers to Edinburgh Airport are now
international who are more likely to use visitor accommodation and stay in the city for longer
periods (according to VisitScotland, in 2016 the average length of stay in Edinburgh and the
Lothians by domestic visitors was 2.8 nights against an average length of stay of 5.0 by overseas
visitors).
Graph 3.8: Change in Passenger Origin to Edinburgh Airport – 2007 to 2017
2007 2012 2017
5% 6% 10%
33% 39%
49%
45%
62%
51%
Total Passengers = 9,037,200 Total Passengers = 9,194,334 Total Passengers = 13,409,295
Source: UK Civil Aviation Authority
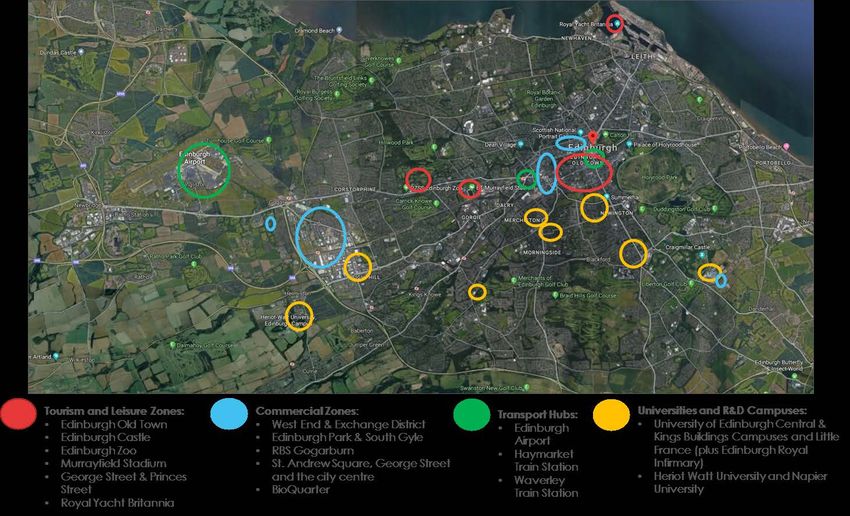
Date: January 2019 Page: 26Demand Driver Locations
3.36 Map 3.1 below illustrates the main accommodation demand driver locations in Edinburgh. It
highlights that the majority are within the city centre (comprising the majority of office stock,
Edinburgh’s Old Town, major visitor attractions and retail core), with smaller ‘zones’ to the west
and south of the city. There are limited demand drivers to the north and east of the city, which
are primarily residential areas.
3.37 There is a clear correlation between these areas and the location of existing visitor
accommodation (see Map 2.1). This is unsurprising as the majority of visitors to Edinburgh prefer to
be located close to drivers of demand; i.e. business guests want to be in commercial zones,
leisure guests wish to be in tourism and leisure zones, while either may wish to be near, or have
easy connections to transport hubs.
Map 3.1: Demand Driver Locations in n Edinburgh
Source: GVA / Google Earth
Date: January 2019 Page: 27Future Demand Drivers
3.38 The following table lists the key development and regeneration schemes in Edinburgh (either
proposed of underway) which we expect to increase visitor accommodation demand from
business and leisure tourism.
Table 3.2 Major Development and Regeneration Activity in Edinburgh
Scheme Comments
Edinburgh St James • Plans include a 253 bedroom five-star W Hotel as well as a
Roomzzz apart-hotel (73 keys);
• However, given the scale of development we would expect
Edinburgh St James to create strong levels of additional leisure
visitor accommodation demand once complete in 2021 that
will not be sufficiently captured by just these two properties.
The Haymarket • Plans include a 172 unit Stay City apart-hotel and 190 bedroom
Premier Inn;
• Again, due to the scale of the wider development we would
expect this to create additional accommodation demand that
will not be sufficiently captured by these two properties. The
proposed office developments (350,000sqft) will create strong
commercial demand;
• There is currently no timeframe for completion of the
Haymarket, but we expect that it will not be fully completed
until 2021 at the earliest.
International Business Gateway (IBG) • IBG covers 2.3m sqft of development land for a mix of
residential, retail, office and hotel uses. It is estimated that when
complete (by 2050) there will be 16,000 employees and a
significant number of residents onsite;
• The Edinburgh Tram link passes through the site (a stop will be
included in the development), providing excellent transport
connection to the city centre and Airport;
• Given the scale of potential development, there is a strong
opportunity for IBG to become a new visitor accommodation
‘zone’.
Edinburgh Airport – New Routes • Edinburgh Airport projects passenger numbers to increase to
19m by 2030, delivered by continuing to improve the
infrastructure of the Airport;
• We are also aware Edinburgh Airport is in discussions to
introduce further long haul routes that will significantly
contribute to the future demand growth for Edinburgh visitor
accommodation.
Date: January 2019 Page: 28City Region Deal • The £1.3bn Edinburgh City Region Deal has a large focus on
technology and innovation and will create five new innovation
hubs in universities across the south-east of Scotland;
• The aim is to establish Edinburgh as the “data capital of
Europe”;
• We would expect this to create strong visitor accommodation
demand over the next 11 years, particularly around the city’s
universities.
Source: GVA
3.39 The Edinburgh Economic Strategy (published June 2018) sets out a new ambition for the city’s
economy to achieve “good growth’” by continuing to be the most productive major city in the
UK while extending the benefits to all citizens.
3.40 The Strategy makes reference to the hotel sector and notes that there is “strong demand for hotel
developments within the city centre where there are perceived constraints on the availability of
space. At the same time, this focus on the city centre has delayed new developments in other
areas of the city”. This was identified as an issue during our stakeholder consultations which we
analyse further in Section 4. However, no reference is made as to suggested strategies for
resolving these constraints.
3.41 The Centres for Cities Outlook 2018 analyses the performance of and prospects for 62 UK cities.
The forecast period is to 2030 (in alignment with City Plan 2030). Edinburgh has one of the lowest
proportions of jobs in occupations likely to contract (57th of 62 cities) and conversely one of the
highest shares (4th of 62 cities) of the types of jobs likely to increase.
3.42 The Edinburgh 2030 tourism strategy is under development and will be published in 2020. The
existing tourism strategy, EDINBURGH 2020, is spearheaded by three aspirational and ambitious
growth targets that are to:
• Increase the number of visitors by one third to 2020, from 3.27m (the 2010 starting base
level) to 4.39m visitors per annum, generating an additional 4.15m visitor nights;
• Increase the average amount spent in the city by 10%, from £310.40 in 2010 to £341.44 per
visitor trip in 2020;
• Receive 50% more visits during the months of October to March and thus reduce the
current 40:60 seasonality split in visitors to 43:57 between October to March and April to
September.
Date: January 2019 Page: 293.43 The Edinburgh 2020 tourism strategy mid-term review (October 2016) highlighted the following
progress (as of end 2015):
• Increase the number of visitors by one third - up 18% to date (ahead of target);
• Increase total expenditure by 3% a year - up 21% (broadly on target);
• Increase the average spending of visitors to the city by 10% - up 3% (below target);
• Reduce seasonality across the sector - proportion of trips October to March down from
40% to 38% (below target).
Summary
3.44 Edinburgh’s visitor accommodation sector has experienced strong levels of growth in recent
years, with occupancy levels reaching peak levels in 2017.
3.45 The city’s business, conference and leisure tourism markets have all grown in recent years,
contributing to the increasing visitor accommodation performance. This has been aided by the
exceptional growth in, and profile of, passengers at Edinburgh Airport, increasing the number of
international visitors to the city, typically staying longer than domestic visitors.
3.46 Future demand growth prospects are also positive, with further Airport growth expected and a
number of commercial and leisure developments proposed that will create additional visitor
accommodation demand to 2030.
Date: January 2019 Page: 304. MARKET TRENDS AND ISSUES
Introduction
4.1 In this section we firstly highlight some of the macro-environment trends and issues within the UK
visitor accommodation sector before examining those specific to Edinburgh in more detail.
Visitor Accommodation Macro-Environment Trends and Issues
4.2 The following table lists some of the key issues and trends impacting the UK visitor
accommodation sector.
Table 4.1: Visitor Accommodation Sector Macro-Environment Trends and Issues
Trend / Issue Description
Skills Shortage • Payroll costs are increasing for hotels resulting in operators making savings elsewhere
and a lack of consistency in the product;
• The uncertainty of Brexit and its impact on the migrant labour pool (which accounts
for a large proportion of the hospitality labour market) is causing anxiety amongst
visitor accommodation operators. There are skills shortages reported within the
sector, specifically around chefs; reports suggest that chefs are turning to agency
work with higher pay. Concerns have been voiced that young chefs do not have
the skill set required to progress as they don’t stay in one role and learn the basic
skills.
Rising Costs • Business Rates have seen significant increases following the 2017 revaluation. The
total rateable value increase for hotels in Edinburgh and the Lothians was 39.1%
(caps were applied to hotel increases in 2017 and 2018 to mitigate the impact);
• National Living Wage was introduced in April 2016 for all employees over 25, this is
expected to reach £9.00 per hour by 2020;
• The Workplace Pension ensures that employers auto enrol eligible employees with
ongoing contribution increases until 2019 (to a minimum employer contribution of
3%);
• The Apprentice Levy came into effect in April 2017 impacting those businesses with
payroll over £3million;
• The uncertainty of Brexit also gives worry to further increases in costs (such as
imports). Following the Brexit vote there has been inflation in operating costs due to
the devaluation of Sterling. Cost inflation has also impacted hotel development
which we note later in this table.
Technology • Self check-in terminals are becoming increasingly popular with several brands
implementing this technology and reducing front desk staff. Whilst this offsets some
of the increasing staff costs it removes the personal touch and the possibility to
encourage guests to book direct rather than using online travel agents (OTAs);
• Mobile room cards are increasing in use with guests able to check in online and use
their mobile phone to access their bedroom. Smart TVs are becoming the norm with
guests expecting to be able to connect to their hotel TVs. Older hotels may need
significant investment to keep up with this trend;
• “Connected Technology” brands (e.g. Hub by Premier Inn) are increasingly popular
with “Millennials”
Date: January 2019 Page: 31Emerging Types of • Volume of AirBNB (and other disruptors) and apart-hotels are increasing; primary
cities are seeing the most significant increases in supply of these products;
Accommodation • Apart-hotels are becoming increasingly popular as they offer the space and facilities
of a traditional, larger serviced apartment, with the service levels of a hotel. They
appeal to both long and short-stay guests, both corporate and leisure sectors;
• Edinburgh is one of the top UK locations for such products due to the demand profile
(i.e. strong corporate and leisure tourism demand drivers).
Online Travel Agents • Growing Online Travel Agent (OTA) share – the OTAs invest heavily in technology
and marketing compared with hotel companies and are increasingly dominant; the
impact is higher operating costs (through high booking commissions).
Development Funding • Although improved since the economic recession, obtaining hotel development
funding can often remain challenging; both in terms of the appetite for lenders to be
involved and the levels of debt servicing they require meaning that securing
required levels of debt funding can be difficult;
• This is further impacted by the growing costs associated with hotel construction
which often makes it difficult to justify the development case for a quality hotel. This
has seen a growth in the rise of Premier Inn and Travelodge hotels which can be
easier to fund and deliver on an operating lease due to their “institutional grade”
covenants. Although some hotel groups are becoming more open to lease
agreements (such as Rezidor and IHG), Premier Inn and Travelodge continue to
dominate the market.
Local Authority Hotel • There is a growing trend towards local authorities in the UK intervening to help the
delivery of hotel projects; this can be as the authority acting as the developer /
Intervention owner, as a lender, or providing a lease to enable forward funding;
• There are two main reasons for this intervention. Firstly to help in “place-making” and
the role a hotel can play in regenerating an area (as well as providing economic
and employment benefits). Secondly, as central government funding declines,
hotels can provide authorities with a new revenue stream;
• Both pension funds and real estate funds are engaging with local authorities on such
developments;
• Aberdeen City Council (through an income strip lease) and Dundee City Council
(developing and owning two hotels) lead the way in hotel intervention in Scotland;
New Hotel Brands • There is an increasingly diverse product offering from the major hotel groups. There is
a question of whether they devalue the existing brands or pull market share from
competitors.
Terrorism • The attacks in 2015 and 2016 on Paris and Brussels had a long-term negative effect
on hotel performance in both cities. However, the 2017 attacks in London and
Manchester had a much more short-term impact.
Source: GVA
Edinburgh Visitor Accommodation Stakeholder Trends and Issues
4.3 In order to understand the key development trends and main issues in the Edinburgh visitor
accommodation sector we have held consultations with the following stakeholders:
• Scottish Development International;
• Edinburgh Tourism Action Group;
• Marketing Edinburgh;
• Edinburgh Airport;
• Edinburgh Hoteliers Association;
• Edinburgh Chamber of Commerce;
Date: January 2019 Page: 32• The Edinburgh Fringe Society;
• Youth Travel Edinburgh;
• VisitScotland;
• Edinburgh International Conference Centre.
4.4 From these discussions the key trends and issues in the Edinburgh visitor accommodation sector
can be grouped into six areas as follows.
Value for money /
Imbalance of
Transient Visitor Planning process
budget hotels
Levy (TVL) impact
Short-term lets Location of visitors Local impact of
(e.g. AirBNB) and lack of sites Brexit
4.5 We now outline each of these trends and issues in turn.
Value for Money / Transient Visitor Levy (TVL) Impact
4.6 The cost of accommodation in August is the key issue for the Fringe Society; it is felt that prices
across all accommodation types have risen to a point where it is becoming unaffordable for
participants (i.e. performers, producers, companies, venues and Arts Industry professionals). Given
the economic benefit of the Fringe (over £170m per annum), they argue that participants should
be offered preferential rates by accommodation providers.
4.7 In regards to the high prices in July and August one respondent commented “we are a 365 day a
year destination and there needs to be recognition that currently only 33% of visitors had been to
Edinburgh before and were keen to return. Are we missing the opportunity of a higher level of
repeat business because we are overpricing?”
4.8 The high cost of hotels in July and August (and at Hogmanay) was highlighted as a concern by a
number of stakeholders. However, there is an understanding that this is market driven and is not
deterring visitor numbers.
Date: January 2019 Page: 334.9 The lack of value for money during peak periods was highlighted as an issue; one respondent
noted that even hostels are able to charge up to £90.00 per bed per night at Hogmanay,
highlighting that value for money is an issue even with budget properties;
4.10 There are varying views on the impact of the TVL (charges levied on short term paid
accommodation) on the sector. It is generally opposed by operators, but other stakeholders view
it as having a minimal or beneficial impact. The implementation of TVL is largely viewed as
inevitable.
4.11 There is a view from operators that TVL, in line with the cost of VAT in the UK (one of the highest in
Europe) will further drive down the perceived value for money by visitors. They add that the TVL is
a ‘hotel tax’ as it doesn’t impact restaurants and other businesses that benefit from tourism.
Furthermore, tax is not paid for by day visitors. This is countered by the belief that it is the hotels
that gain the greatest benefits from tourism spend in the city.
Imbalance of Budget Hotels
4.12 There is an across-the-board acceptance that Edinburgh is well supplied for budget
accommodation and is now lacking hotels of a four and five-star grading (our future supply
research has highlighted that fewer budget hotels are now proposed in the city). VisitScotland
noted that there is a growing demand for four and five-star hotels from emerging markets. No
other supply gaps were noted across all accommodation types.
4.13 Our research of current supply has identified the large growth in budget hotels in recent years
(see Section 2). A concern was raised that the quantum of budget properties will attract ‘cheap’
visitors to the city, rather than more desirable higher spending visitors.
4.14 The quantum of new supply in the planning pipeline was not viewed as a major concern to
trading performance of existing properties due to the belief that demand will continue to
increase. However, it was mentioned by several stakeholders that the city needs to work on
creating year round demand (e.g. through marketing campaigns, increased business tourism,
calendar of year round events and Airport expansion) to provide for the additional supply.
Planning Process
4.15 Several comments were made in regards to concern over both the slow speed of the planning
process for new hotel developments, as well as the ultimate decisions that have been made.
4.16 There is apprehension that the difficulties that both the W Hotel and Rosewood (Royal High
School) proposals have experienced presents an image of Edinburgh as being a ‘difficult’ place
to achieve development.
Date: January 2019 Page: 34You can also read


