THE ECONOMIC PROSPECTS FOR THE CITY OF LEEDS - Report to: CEG
←
→
Page content transcription
If your browser does not render page correctly, please read the page content below
THE ECONOMIC
PROSPECTS FOR THE
CITY OF LEEDS

Report to:
CEG

pt23@cam.ac.uk

1
Acknowledgements
This study has been undertaken by Professor Pete Tyler (Project Director, St Catharine’s College),
Ben Gardiner (Cambridge Econometrics), Jon Stenning (Cambridge Econometrics) and Dr Adam
Brown (Cambridge Econometrics). It has been guided by Richard Crabtree, Strategic Development
Manager at CEG.

Issue
10 March 2017

                                                2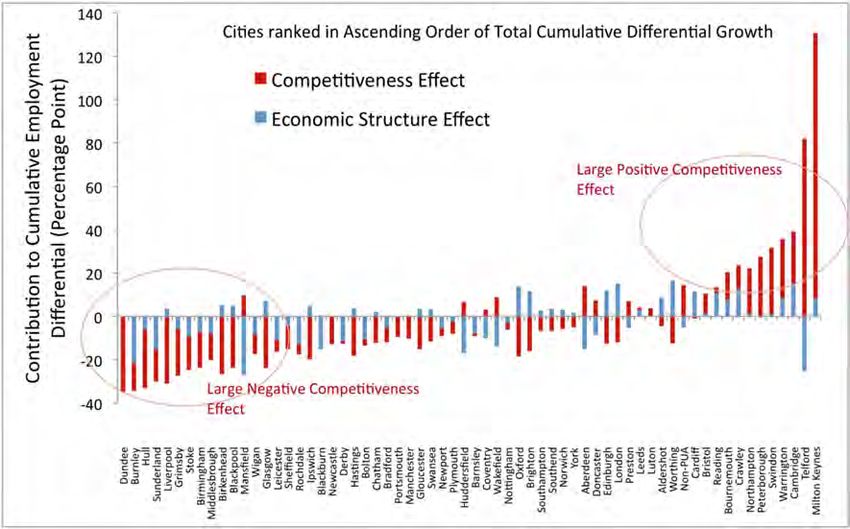
Contents
Executive Summary

1. The aims and scope of the study

2. The growth of the Leeds economy since 1990

3. The relative competitiveness of the Leeds economy

4. The potential for future growth, key constraints on growth and
 the agenda for policy

Annexes

                                       3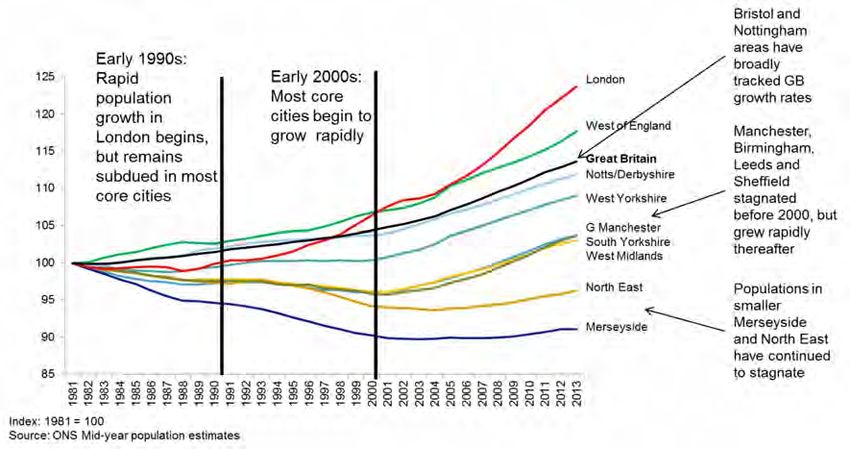
Executive Summary
The aims and scope of the study
Leeds has undergone an economic transformation in recent years, shaking off the legacy of industrial
decline and developing economic opportunities and thus jobs in new and growing sectors, most
notably in financial services. The economic future for Leeds looks brighter than it has for many years
but there is a shortage of evidence on what that future might hold and the key opportunities and
challenges that exist as Leeds moves to consolidate its position as the leading centre of economic
growth and vitality in the North of England.
To understand more about the growth of the Leeds economy this Report considers:
How the Leeds economy has performed in the period since 1990 compared to the UK;
How the pace of change has varied across different economic sectors in which the Leeds
economy tends to specialise;
How the relative competitiveness of the Leeds economy compares with that of other cities
with which it competes for investment, most notably Manchester and Birmingham, and the
possible impact of the Northern Powerhouse and HS2;
The potential for the growth in the Leeds City Region; and
The key policies/ investment initiatives that could help to unlock the growth potential and thus
underpin the growth of the Leeds economy, particularly as they relate to land use and skills.
The growth of the Leeds economy since 1990
Population growth in much of the North of England including Leeds was relatively weak
compared to the South until the turn of the century. However, since then the position has
strengthened considerably. In Leeds, Birmingham, Manchester and Sheffield there is now
quite rapid growth;
Leeds has demonstrated an ability to grow faster than other leading centres with which it is
often compared; most notably Manchester and Birmingham. However, its momentum has
varied, falling back somewhat in recent years;
The Leeds economy has undergone significant economic restructuring. It been successfully
repositioning from a past industrial base and begun to build its position as probably the
leading financial and business services centre after London. It also has seen growth in
education, health, IT services and other professional services.
4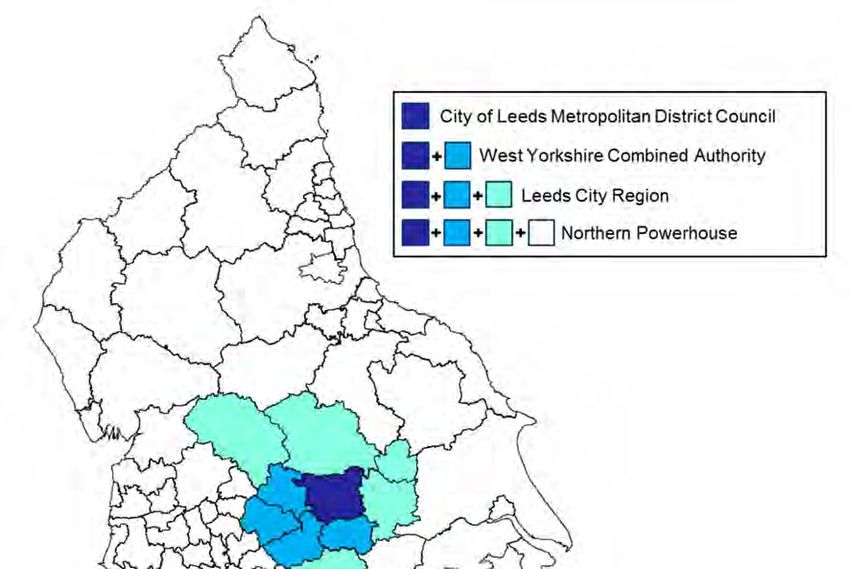
The relative competiveness of the Leeds economy
The Leeds economy is restructuring away from its traditional manufacturing sectors and
increasingly towards Knowledge Intensive Business Services (KIBSs);
It has a particularly strong competitive advantage in Business Support Services, Finance and
Insurance, but it is also well-placed in a number of other mainly service related sectors;
Whilst its overall level of productivity is below that of the United Kingdom as a whole it is
relatively high compared to other cities in the Northern Powerhouse and only slightly below
that of Manchester;
Whilst the productivity levels of some of its key sectors continue to lag behind the UK, there
is evidence for relative improvement and it is essential that Leeds does all it can to enable its
core businesses to access the labour, premises and finance they require to grow;
The importance of investing in the skill base cannot be overestimated. But it is also
necessary to invest in new transport infrastructure that will allow more commuting and
business travel into the City from the surrounding region and from other cities in the North.
Improving connectivity requires substantial investment in new road and rail infrastructure
between the east and west in addition to the current proposals for HS2;
Leeds as a city has powerful knowledge-based assets and economic activity associated with
this will become an increasing part of what Leeds does. There is substantial investment in
the regional innovation system and strong collaboration and networking between the main
knowledge-based institutions. This is a strong and rapidly growing digital economy. The
increasing concentration of KIBS in the Leeds economy reinforces the importance of a good
access to quality floor-space in Leeds that will enable businesses to benefit from close
proximity to one another.
The increasing concentration of KIBS employment in the Leeds economy reinforces the
importance of a good access to quality floor-space in Leeds that will enable businesses to
benefit from close proximity to one another.
The potential for future growth, key constraints and the agenda for
policy
On the baseline forecast the Leeds economy will grow over the period 2015-2030 at a rate
that is 69% above that which it achieved in the period 2000-2015. However, building on
forecasts made for the Northern Powerhouse, and assuming some enhanced productivity
growth, GVA could grow substantially more, by some 140% on its historic performance.
Employment growth would also be substantially improved in relation to the historic position at
26% above.
The strength of the Leeds financial sector is such that it is entirely plausible that Leeds, and in
particular its expanding City Centre area, could experience growth in office-based
employment towards the top end of our growth forecasts. This would create 47,000 extra
office jobs in the City Centre over 2015-30 and a corresponding requirement for 7.5 million sq
ft of new floorspace. On the basis of historic provision this is likely to prove challenging,
pointing to some key messages for those involved in land use planning and development;
To ensure that the projected growth in jobs can be met it is essential that there is also an
adequate supply of skilled labour. At the present time future recruitment need is greatest in
the high skilled and services sectors.
5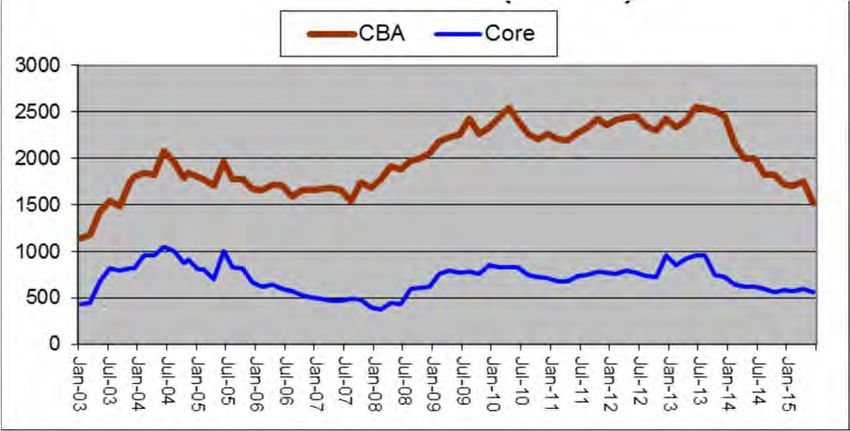
1.     The aims and scope of the study

Aims
1.1   Leeds has undergone an economic transformation in recent years shaking, off the
legacy of industrial decline and developing economic opportunities and thus jobs in new and
growing sectors, most notably in financial services. The economic future for Leeds looks
brighter than it has for many years but there is a shortage of evidence on what that
economic future might hold and the key opportunities and challenges that exist as Leeds
moves to consolidate its position as the leading centre of economic growth and vitality in the
North of England in the years ahead.

1.2   Clearly, the economic future of Leeds and that of the United Kingdom cannot be
known with certainty. The growth of Leeds and its surrounding region will depend on how
quickly the United Kingdom can grow and in turn the prospects for the global economy, and
how Leeds is able to adapt. It will also depend on the quality of the decisions taken by those
in both the public and private sectors in the environment in which the United Kingdom now
finds itself following the result of the EU membership referendum.

1.3   It is essential that businesses and the public sector in and around Leeds respond to
the new opportunities that will emerge. At the present time central government in the United
Kingdom is devolving more power to combined authorities and local government to manage
local economic development and the provision of core public services. Following the
decision to leave the European Union there is a strong chance that central government will
accelerate this process and Leeds has to be ready to respond to the opportunities and
challenges that arise.

1.4   It is possible to make informed judgements as to what might happen to the growth of
Leeds on the basis of different assumptions about the pace of national growth. The resulting
growth scenarios can be used to help develop an economic vision for Leeds to inform land
use policy in Leeds and its city region. Doing this has a number of advantages. Firstly, the
process requires us to consider how Leeds has grown relative to the UK economy in the
past and the factors that have led to differences between them. Secondly, the approach
enables the impact of different national and local policy scenarios on the growth of the city
and its region to be quantified in terms of output (GVA), employment and population.
Changes in these variables will influence the demand for commercial floorspace, housing

                                              6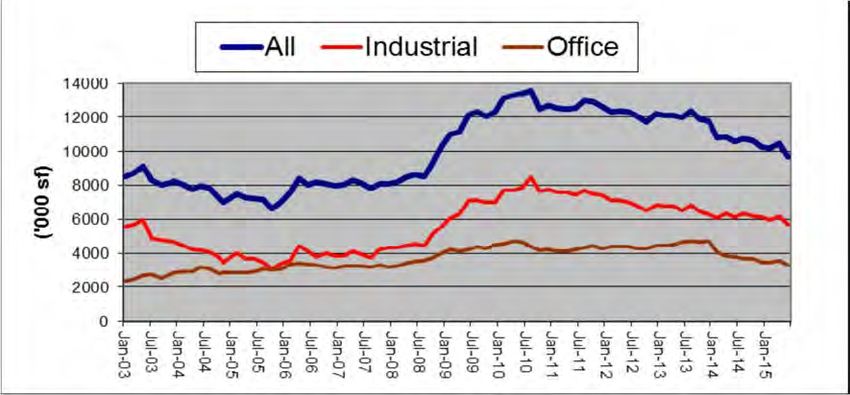
and the provision of public and private services.
1.5 To understand more about the growth of the Leeds economy this Report considers:
How the Leeds economy has performed in the period since 1990 compared to the
UK;
How the pace of change has varied across different economic sectors and the
sectors in which the Leeds economy tends to specialise;
How the relative competitiveness of the Leeds economy compares with that of other
cities with which it competes for investment, most notably Manchester and
Birmingham and the growth potential associated with the development of
interventions to unlock growth potential associated with the Northern Powerhouse,
including HS2, HS3 and other transport improvements, and skills initiatives;
The potential for the growth in the Leeds City Region; and
The key policies/ investment initiatives that could help to unlock the growth potential
and thus underpin the growth of the Leeds economy, particularly as they relate to
land use and skills.
Scope of the study
Geography
1.6 The city of Leeds can be defined in a number of different ways, based upon various
ways of considering the functional geography of the city. The narrowest definition of the city
is based upon the local authority district of Leeds, which covers the area for which the
metropolitan district council of the City of Leeds is responsible. This definition is also that
used by Centre for Cities in their Primary Urban Areas (PUA) analysis. With a similar (but not
identical) geographical footprint, the Travel to Work Area (TTWA) definition (calculated by
Newcastle University and the ONS and based upon census data that identifies those areas
where at least 50% of the working population both work and live in the same area) is only a
slight alteration. More radically different is the larger footprint covered by the West Yorkshire
Combined Authority (and which has agreed a devolution deal with the Government covering
skills, transport, housing and business support). The Combined Authority includes the
districts of Leeds, Bradford, Calderdale, Kirklees and Wakefield. A further (and even
broader) definition is that of the Leeds City Region (covering the area of operation of the
Leeds City Region Local Enterprise Partnership (LEP)), which includes all districts in the
Combined Authority plus Barnsley, Craven, Harrogate, Selby and York. The different scales
of these city definitions (in terms of area and total employment) are set out in Table 1.1 and
7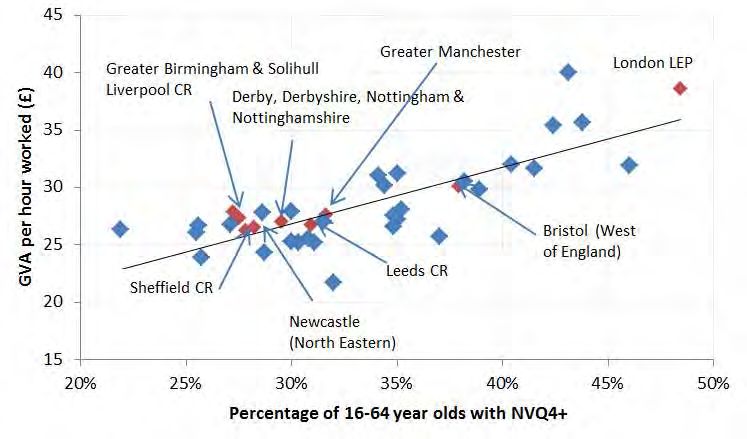
(except the TTWA) illustrated on the map below.

Table 1.1     Total employments in Leeds and associated geographies
Definition of Leeds                                                    Employment, 2015
City of Leeds Metropolitan district council / PUA                               391,700
Leeds travel-to-work area                                                       412,500
West Yorkshire Combined Authority                                             1,169,400
Leeds City Region LEP                                                         1,435,200
Northern Powerhouse                                                           7,787,100
Note:         Geography as shown on Map 1 (except TTWA).

1.7 Leeds also sits within the area of the Northern Powerhouse. The area as a whole is
too broad to be the core area for the study, but it is necessary to place Leeds in the context
of the Northern Powerhouse (alongside comparison with other cities in the UK and beyond).
To do this the analysis has concentrated on the Leeds PUA, which also reflects the area
controlled by the City Council. The similarity between this definition and the travel-to-work
area shows that the majority of those commuting into Leeds also live within this area. The
table also highlights that a significant proportion of jobs in West Yorkshire are in Leeds
district (33%).

Methodology
1.8 The research has been undertaken in two stages. The first has involved an in-depth
analysis of how employment and output has changed on a sector by sector basis in Leeds
and its surrounding region relative to the United Kingdom as a whole since 1990. The
quantitative analysis has been undertaken using CE’s district data at a 45 sector level based
on ONS data. The data has been analysed to establish those sectors in which Leeds
appears to have something of a competitive advantage.

                                               8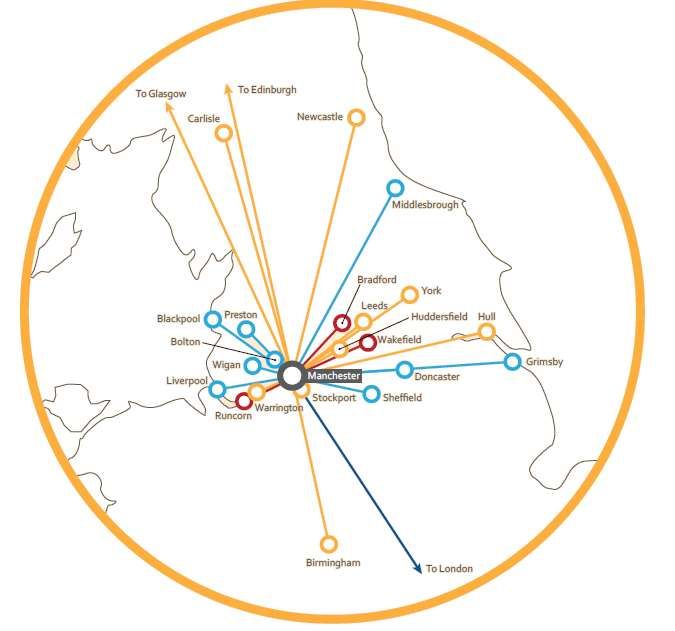
Map 1.         Leeds and associated geographies

Source:   CE

1.9 The second stage has involved forecasting what might happen to the growth of the
Leeds economy on the basis of different national assumptions. The national forecasts have
been taken from the CE national forecasting model and reflect different national and local
growth assumptions. A key objective has been to consider how the relative competitiveness
of the Leeds economy might affect its ability to attract investment. In the second stage of
analysis it has thus been possible to consider the potential for the Leeds economy if key
constraints are addressed to unlock the growth potential of the city, including the impact of
the policy initiatives associated with the Northern Powerhouse, delivery of HS2, and
associated improvements to the local and regional transport networks. This transformation
scenario is shared with the analysis underpinning the Northern Powerhouse Independent
Economic Review.

                                             9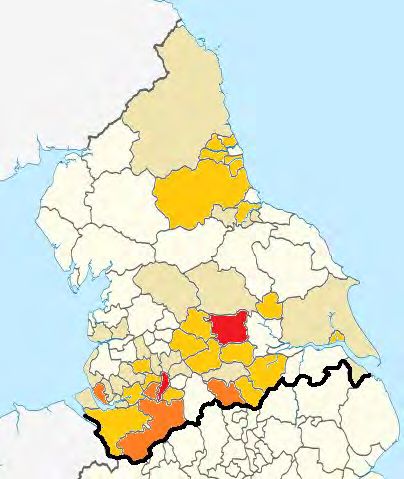
2. The growth of the Leeds economy since 1990
Population growth in much of the North of England including Leeds was relatively weak
compared to the South until the turn of the century. However, since then the position has
strengthened considerably. In Leeds, Birmingham, Manchester and Sheffield there is now
quite rapid growth;
Leeds has demonstrated an ability to grow faster than other leading centres with which it
is often compared; most notably Manchester and Birmingham. However, its momentum
has varied, falling back somewhat in recent years;
The Leeds economy has undergone significant economic restructuring. It been
successfully repositioning from a past industrial base and begun to build its position as
probably the leading financial and business services centre after London. It also has seen
growth in education, health, IT services and other professional services.
Introduction
2.1 This section examines how the Leeds economy has performed over the last twenty-
five years. It considers its growth in terms of Gross Value Added (GVA), employment,
population and GDP per head relative to the Yorkshire and Humber region as a whole and
the United Kingdom. Its performance is also considered relative to the Manchester and
Birmingham PUAs which are two cities with which it is frequently compared.
2.2 The section also assesses how the economic structure of the economy has changed,
seeking to identify those sectors which have either declined or expanded rapidly. It considers
whether the changes observed have been in line with that elsewhere.
Gross Value Added (Output)
2.3 Leeds grew relatively rapidly over the period 1971-2014. It has been in the top third of
British cities in terms of economic growth with a growth rate that has been quite close to that
of London and significantly higher than the other former industrial northern cities with which it
has traditionally been grouped (Figure 2.1). This reflects, in part, its particular strengths in
financial services but there have also been other factors that have meant it has been
performing somewhat better than many other British cities of similar size. However, analysis
presented in this Report shows that in recent years the relative growth performance of the
Leeds economy has been falling back somewhat compared to that of the United Kingdom as
a whole and in particular relative to that of Manchester, which is a city with which it is
frequently compared.
10Figure 2.1 Growth across British Cities (PUAs), 1971-2014
8.0
Average Annual Growth Rate (%pa) 7.0
6.0
5.0
4.0
3.0
2.0
1.0
0.0
-1.0
Coventry
Hastings
Cambridge
Plymouth
Glasgow
Newcastle
Rochdale
Portsmouth
Southampton
Bolton
Brighton
Bournemouth
Swindon
Telford
Chatham
Birmingham
Middlesbrough
Oxford
Luton
Edinburgh
Doncaster
Swansea
Manchester
Nottingham
Wigan
Warrington
Huddersfield
Norwich
Leeds
Wakefield
Mansfield
Worthing
Northampton
Hull
Grimsby
Bristol
Gloucester
Ipswich
Aldershot
York
Reading
Milton Keynes
Liverpool
Derby
Crawley
Dundee
Burnley
Barnsley
Southend
Cardiff
Aberdeen
Blackpool
Sheffield
Preston
Newport
Bradford
Stoke
London
Sunderland
Peterborough
Birkenhead
Blackburn
Leicester
GVA Employment
2.4 Leeds experienced particularly rapid economic growth during the 1990s and
early 2000s; growing faster in terms of GVA than both the wider Yorkshire and
Humber Region and the UK as a whole. However, in the past decade Leeds has
grown more slowly than the UK average (Figure 2.2). Figure 2.3 shows how the
Leeds economy has grown relative to that of both Birmingham and Manchester. Over
the whole of the last twenty-five years, its economy grew at a faster rate than both
Manchester and Birmingham. However, in the last decade it has tended to grow
relatively more slowly than Manchester and at about the same rate as Birmingham.
11Figure 2.2. GVA Growth of Leeds between 1990 and 2015 shown in comparison to
the UK and the Yorkshire and Humber Region
2.00
1.80
1.60
GVA (1990 = 1)
1.40
1.20
1.00
0.80
1990 1995 2000 2005 2010 2015
UK Leeds Yorkshire and Humber
Source: CE
Figure 2.3. The growth of GVA in Leeds since 1990 compared to Birmingham and
Manchester
2
1.8
1.6
GVA (1990 = 1)
1.4
1.2
1
0.8
0.6
1990 1995 2000 2005 2010 2015
Manchester Birmingham Leeds
12Employment
2.5 Figure 2.4 examines how employment has changed in Leeds. Leeds outperformed the
UK as a whole between 1990 and 2005, but then fell back relatively in the last decade. It did,
however, outperform the Yorkshire and the Humber region as a whole over the 25-year
period.
Figure 2.4. Employment Growth of Leeds between 1990 and 2015 shown in
comparison to the UK and the Yorkshire and Humber Region
1.20
1.15
Employment (1990 = 1)
1.10
1.05
1.00
0.95
0.90
1990 1995 2000 2005 2010 2015
UK Leeds Yorkshire and Humber
2.6 The growth of employment in Leeds and Manchester over the last twenty-five years
has been fairly similar; both have grown by about 18% (Figure 2.5). Birmingham’s
employment declined quite severely up until 2010 when it has tended to recover somewhat
but still ended the period with less employment than it had in 1990. Manchester’s
performance was initially relatively weak compared to Leeds but has been performing
relatively more strongly in recent years.
13Figure 2.5. The growth of employment in Leeds since 1990 compared to
Birmingham and Manchester
1.2
1.15
1.1
1.05
Employment (1990 = 1)
1
0.95
0.9
0.85
0.8
0.75
0.7
1990 1995 2000 2005 2010 2015
Manchester Birmingham Leeds
Population
2.7 Population growth in the North of England was in general flat or declining up until
2000. This was quite different to that of the South of England. However, the position has
changed somewhat since then as Figure 2.6 shows. Since the turn of the century, the
population in Leeds, Manchester, Birmingham and Sheffield has begun to grow quite rapidly.
Figure 2.7 shows the population growth in Leeds, the wider region and the United Kingdom.
Leeds and its region began to experience rapid population growth from 2000 onwards.
Figure 2.8 compares population growth in Leeds with that of Birmingham and Manchester.
Over the last 25 years population has tended to grow at a somewhat faster rate in Leeds
than both Birmingham and Manchester. In fact, population actually declined in Birmingham
and in Manchester up until 2000, when it then turned around.
14Figure 2.6. Population Growth across Sub-Regions
Figure 2.7. Population Growth of Leeds between 1990 and 2015 shown in
comparison to the UK and the Yorkshire and Humber Region.
1.2
1.15
Index Population (1990 = 1)
1.1
1.05
1
0.95
0.9
1990 1995 2000 2005 2010 2014
UK Leeds Yorkshire and Humber
Source: CE
15Figure 2.8. The growth of population in Leeds since 1991 compared to Birmingham
and Manchester
1.1
1.08
1.06
Indexed Population (1990 - 1)
1.04
1.02
1
0.98
0.96
0.94
0.92
1990 1995 2000 2005 2010 2014
Manchester Birmingham Leeds
GDP per capita
2.8 Leeds currently has a GDP/capita that is higher than the national average reflecting
more favourable growth in the early part of the 2000s (Figure 2.9). It has a GDP per capita
that is substantially above the regional Yorkshire and Humber average.
Figure 2.9. GDP/capita of Leeds between 1990 and 2015 shown in comparison to
the UK and the Yorkshire and Humber Region
27.0
25.0
23.0
GDP/capita (£000)
21.0
19.0
17.0
15.0
13.0
11.0
9.0
7.0
1990 1995 2000 2005 2010 2015
UK Leeds Yorkshire and Humber
2.9 Leeds GDP/capita improved relative to its competitors between 1990 and 2005 (Figure
162.10) and still maintains a gap of about £3000 per person. Manchester and Birmingham
were in lockstep until 2005, since when Manchester has pulled ahead by approx. £2000 per
person as Birmingham was hit harder by the recession. However, this difference is partly
explained by the tighter spatial definition applied to Leeds PUA. Both Manchester and
Birmingham PUA cover a wider area and a larger population.
Figure 2.10. The growth of GDP per capita in Leeds since 1991 compared to
Birmingham and Manchester
27
25
23
21
19
GDP/capita
17
15
13
11
9
7
1990 1995 2000 2005 2010 2014
Manchester Birmingham Leeds
Sectoral growth
2.10 Figure 2.11 provides a decomposition of the Leeds economy into 6 macro-sectors for
the years 1990 and 2015. Whereas manufacturing output has fallen, this has been
outstripped by significant growth across the service sectors. Leeds has experienced rapid
growth in output from the service sectors over the past 25 years. The reduction in
manufacturing output has been more than offset by a substantial increase in economic
activity in its Knowledge Intensive Business Services (KIBS) and other private services,
although there was also an increase in the contribution of public services, which includes the
health and university sectors.
17Figure 2.11. GVA levels in six macro-sectors in Leeds; 1990-2015
7000
6000
5000
GVA (£000 , 2010 prices)
4000
3000
2000
1000
0
Primary Manufacturing Construction and KIBS Other Private Public Services
Utilities Services
1990 2015
2.11 Figure 2.12 compares the sectoral changes in Leeds with wider national trends. The
Leeds economy has largely followed the same growth pattern of the wider UK, with falls in
the contribution of Primary Industries and Manufacturing, and growth in the Services Sector
and particularly KIBS and Public Services.
Figure 2.12. % GVA growth between 1990-2015; six macro-sectors in Leeds and UK
250.00
200.00
GVA (% change, 1990 - 2015)
150.00
100.00
50.00
0.00
-50.00
-100.00
Primary Manufacturing Construction KIBS Other Private Public Services
and Utilities Services
UK Leeds
18Figures 2.13 and 2.14 identify the top 10 more finely disaggregated sectors that have
experienced particularly strong GVA and employment growth over the period. Seven sectors
appear in both growth charts. These are:
Financial and Insurance
Education
Business Support Services
Health
IT services
Other Professional Services
Legal and Accounting.
2.12 All of these are knowledge intensive service sectors, whether privately or publicly
funded. These seven sectors have clearly been the strongest drivers of both employment
and output growth over the time period.
2.13 It is also worth noting at this point that despite its considerable % growth, Head
Offices and Management Consultancies does not appear in the top 10 due to its low starting
point.
Figure 2.13. Top 10 GVA growth sectors in Leeds by total additional output
2000.0
1800.0
1600.0
GVA (£000, 2010 prices)
1400.0
1200.0
1000.0
800.0
600.0
400.0
200.0
0.0
1990 2015
19Figure 2.14. Top 10 Sectors for Employment Growth from 1990 to 2015
60.0
50.0
Employment (1000 jobs)
40.0
30.0
20.0
10.0
0.0
1990 2015
Figures 2.15 and 2.16 show the sectors that have experienced negative GVA and
Employment growth over the period 1990 to 2015. There are five manufacturing sectors that
appear in both lists: The fall in manufacturing employment in recent years reflects wider
trends within both the Leeds City Region and the wider UK.
Metals
Printing and Recording
Wood and Paper
Textiles
Other manufacturing and Repair
2.14 Other interesting points of note are the reduction in employment in retail trade
occurring simultaneously with a significant increase in GVA. This may represent a
rationalisation of the business model of the retail industry to be less labour intensive.
20Figure 2.15. Bottom 10 GVA negative-growth sectors in Leeds; total decrease in
output
400.0
350.0
GVA (£000, 2010 prices)
300.0
250.0
200.0
150.0
100.0
50.0
0.0
1990 2015
Figure 2.16. Bottom 10 Employment GVA negative-growth sectors in Leeds by total
decrease in workers
40.0
35.0
Employment (1000 jobs)
30.0
25.0
20.0
15.0
10.0
5.0
0.0
1990 2015
Note ‘PAD’ refers to Public Administration and Defence
Leeds sectors compared with Manchester and Birmingham
2.15 Figure 2.17 shows that Birmingham has strengths in Manufacturing and Public
Services, whereas Leeds tends to specialise more in KIBS. The Manchester economy sits
between the two.
21Figure 2.17. Comparison Sectors; Manchester, Birmingham and Leeds, 2015
35
30
% of employment , 2015
25
20
15
10
5
0
Manchester Birmingham Leeds
2.16 When looking at employment growth from 1990 to 2015, we see that Primary and
Manufacturing have tended to fall, Construction, Utilities, Wholesale, Retail and transport
have remained flat and Private and Public Services have shown growth. Leeds and
Manchester have both seen significant growth in the KIBS sector. Whereas Birmingham has
lost manufacturing jobs at a rate similar to that in Leeds, it hasn’t been as successful at
replacing them with jobs in the KIBS sector.
22Figure 2.18. Changes in Sectoral Composition; Manchester, Birmingham and Leeds
25 year % change in employment
100
80
60
40
20
0
-20
-40
-60
-80
-100
Manchester Birmingham Leeds
2.17 Looking at the KIBS sectors in more detail, Leeds has a greater concentration than
the other two PUAs in IT services, Finance and Insurance, Other Professional Services, and
Business Services, which is by far the biggest KIBS sector in each city. Manchester’s
strengths appear to lie in Media, Real Estate, Legal and Accounting, and Architectural
Services. Birmingham lags behind the other two cities in all KIBS sectors.
23Figure 2.19. Comparison of Manchester, Birmingham and Leeds KIBS employment,
2015
12
10
Axis % of total employment
8
6
4
2
0
Manchester Birmingham Leeds
2.18 Over the last twenty-five years the biggest % gains in employment growth in Leeds
have been in the Head Offices and Management Consultancies and Other Professional
Services. These are clearly the two subsectors that have been driving KIBS growth in the
area. Employment in both finance and business services increased by 15% between 2009
and 2014, although over the longer time period its growth was more modest; this suggests
that the competitiveness of the sector (relative to the UK and comparator cities such as
Manchester and Birmingham) has improved in recent years.
2.19 Employment growth in Leeds has thus been concentrated in the service sectors,
which accounted for 363,000 jobs in 2015 – 88% of total employment.
Conclusions
2.20 The evidence presented in this section shows that the Leeds economy has
undergone significant economic restructuring over the last 25 years. It has transitioned from
an industrial base and is now defending its position as the second leading centre of financial
and business services next to London. It has shown an ability to out-perform other leading
centres with which it is often compared; most notably Manchester and Birmingham.
However, throughout the period its relative growth has tended to vary quite considerably. If
Leeds is to maintain its forward momentum it is essential that it continues to enhance its
economic competitiveness and it is to the determinants of this that we now turn.
243. The relative competitiveness of the Leeds
economy
The Leeds economy is restructuring its economy away from its traditional manufacturing sectors
and increasingly towards Knowledge Intensive Business Services (KIBSs);
It has a particularly strong competitive advantage in Business Support Services, Finance and
Insurance, but it is also well-placed in a number of other mainly service related sectors;
Whilst its overall level of productivity is below that of the United Kingdom as a whole it is
relatively high compared to other cities in the Northern Powerhouse and only slightly below that
of Manchester;
Whilst the productivity levels of some of its key sectors continue to lag behind the UK, there is
evidence for relative improvement and it is essential that Leeds does all it can to enable its core
businesses to access the labour, premises and finance they require to grow;
The importance of investing in the skill base cannot be overestimated. But it is also necessary
to invest in new transport infrastructure that will allow more commuting and business travel into
the City from the surrounding region and from other cities in the North. Improving connectivity
requires substantial investment in new road and rail infrastructure between the east and west in
addition to the current proposals for HS2;
Leeds as a city has powerful knowledge-based assets and economic activity associated with
this will become an increasing part of what Leeds does. There is substantial investment in the
regional innovation system and strong collaboration and networking between the main
knowledge-based institutions. This is a strong and rapidly growing digital economy. The
increasing concentration of KIBS in the Leeds economy reinforces the importance of a good
access to quality floor-space in Leeds that will enable businesses to benefit from close proximity
to one another;
The increasing concentration of KIBS employment in the Leeds economy reinforces the
importance of a good access to quality floor-space in Leeds that will enable businesses to
benefit from close proximity to one another.
25Introduction
3.1 The previous section examined the growth of the Leeds economy over the last twenty-
five years. The evidence suggests that it has been one of the relatively faster growing
Northern cities, although the pace has varied throughout the period. An analysis by sector
points to it being able to expand its presence in financial services to overcome relative
decline in its traditional manufacturing base. The sectors that have shown fast or moderate
growth (> 0.5%pa) between 1990 and 2015 in Leeds are:
Business Support Services
Education
Health
Finance and Insurance
Residential and Social
Head Offices and Management Consultancies
IT Services
Other Professional Services
Legal and Accounting
Recreational Services
Warehousing and Postal
Architecture and Related
3.2 An interesting observation, is that all of these sectors, with the possible exception of
warehousing and postal, are in the “non-routine” occupation sectors, meaning that they are
the least likely to be affected by automation in the next 20-30 years. Future growth depends
on the relative competitiveness of Leeds as a location for investment and it is to examine the
determinants of this that this section now turns.
3.3 There are a number of different ways in which competiveness can be measured. The
findings from recent research by Martin, Gardiner and Tyler (2015) are shown in Figure 3.1.
This shows employment growth in the period across the British cities relative to the nation as
a whole. The difference between the national growth and that actually recorded by the city is
broken down into two components. The economic structure effect is the contribution to the
city’s growth that can be attributed to the difference in industrial structure as between the city
and the national economy; it reflects how far the city’s share of faster and slower growing
industries and activities differs from the nation as a whole, that is how far a region or city
specializes in more and less dynamic industries. The competitiveness effect is often
assumed to indicate the extent to which locally-unique factors have caused growth or decline
in a city’s industries: that is, it is assumed to point to some local competitive or comparative
advantage (or disadvantage). For this reason it is often referred to as the regional or city
‘competitiveness’ component, though it does not identify the causes of that competitive
advantage (or disadvantage). Martin, Tyler and Gardiner found that on the basis of this
measure of competitiveness Leeds was in the top one third of British cities.
26Figure. 3.1 The role of competiveness in the growth of employment across British
Cities, 1981-2013
Source: Martin, Gardiner and Tyler (2014)
3.4 Many factors have been identified as important determinants of urban
competitiveness. A relatively recent addition has been from the Economist Intelligence Unit-
“Hot Spots 2025: the Future Competitiveness of Cities”1. The emphasis is: ‘Competitiveness
is a holistic concept. While economic size and growth matter, several other factors determine
a city’s competitiveness, including its business and regulatory environment, its institutions,
the quality of human capital, cultural aspects and the quality of environmental governance.
These cities not only help a city sustain high economic growth, but also secure its future
competitiveness’ (Economists Intelligence Unit, 2013).
3.5 On this basis in its City Competiveness Index the Economist Intelligence Unit
benchmarked the competitiveness of 120 cities using 32 different indicators for each city.
The eight, distinct, thematic categories covered are economic strength (30%), Physical
capital (10%) and financial maturity (10%), institutional character (15%) and human capital
(15%), global appeal (`10%), social and cultural character (5%) and environmental and
natural hazards (5%).
3.6 One way to understand more about the relative competitiveness of the Leeds
economy is to adopt the pyramid approach shown in Figure 3.2.
1 Hot Spots 2025: benchmarking the Future Competitiveness of Cities.
27Figure. 3.2. The Pyramid Approach to Understanding the Determinants of City
Competitiveness
Source: Martin etc. adapted from Kitson, Martin and Tyler (2004)
3.7 Figure 3.2 shows that the economy of a city can increase its GDP per capita2 by
increasing their productivity, expanding their productive labour force (as indicated by its
employment rate) and the amount of wages and profits it can generate. The growth of
productivity in particular is affected by a number of factors including innovation, investment,
human capital, economic diversity/ specialization, the degree of connectivity and quality of
life and decision making. These, in turn, are influenced by the basic attributes of the city like
its business environment, its educational base, the quality of its physical infrastructure
including the degree of flexibility in its land and property markets, its socio-culture networks
and the quality of its institutional and governance structure.
3.8 Recently, an extensive body of research has been undertaken to examine the factors
responsible for the economic performance of the cities in the Northern Powerhouse3. This
research examined the relative contribution of the growth of productivity and the employment
rate to the growth of GDP per capita in the North of England.
Table 3.1 shows that although the contribution varied by sub-period, over the whole period
1992-2013 the most important factor contributing to the growth of GVA was the growth of
productivity.
2 It is necessary to consider the contribution made by Productivity (GDP/ Employee (sectoral hours worked), Total hours
worked / employment (Work-Leisure Trade off), The Employment Rate (Employment/ Working Age Population) and
Dependency Rate (Working Age Population/ Population).
3
Northern Powerhouse Independent Economic Review. Workstream 1: Analysis of the pan-Northern Performance Gap-Final
report. March 2016. Cambridge Econometrics and SQW.
28Table 3.1. The factors that contribute to growth in GVA per capita in the North of
England – average growth rate per annum (%)
1992/2013 1992/1997 1997/2009 2009/2013
GVA per capita 1.7 2.2 2.0 0.3
Productivity 1.5 1.7 1.6 1.0
Jobs per worker 0.0 0.4 0.0 -0.7
Employment 0.2 0.3 0.1 0.4
share
WAP share 0.0 -0.1 0.2 -0.5
Source: Northern Powerhouse Independent Economic Review, March 2016
How Leeds compares with other Northern Cities in relation to the
factors contributing to the growth of GVA per capita
3.9 Table 3.2 provides a detailed exposition by sub-region in the North of how the level of
productivity, the employment rate and the dependency rate (share of working age in total
population) varied. It should be emphasized that the analysis is for the Leeds City Region
taken as a whole (the LEP area). In 2004, GVA per capita was 7% above that of the North
as a whole. Its productivity was very close to the Northern average but its employment rate
was 3% higher and its dependency rate 3% lower than the North as a whole.
Table 3.2. Sub-Regional Performance Relative to the Northern Economy in 2004
GVA per capita Labour Employment rate Working-age
productivity share
Cheshire and 119 109 107 101
Warrington
Greater Manchester 107 102 99 102
Leeds City Region 107 101 103 103
Liverpool City Region 100 113 93 98
York, North Yorkshire 97 101 106 99
and East Riding
Cumbria 95 88 103 100
Humber 94 95 100 101
Lancashire 93 92 100 100
Tees Valley 91 93 95 101
North Eastern 90 99 95 99
Sheffield City Region 87 98 98 104
3.10 Table 3.3 shows how the key components that contribute to GVA performance
compare across the sub-regions of the Northern economy by 2013. The position of the
Leeds City Region had remained much the same as in 2004. However, it is noticeable that
the relative position of Greater Manchester has improved substantially. Table 3.4 shows that
Manchester has tended to increase its size relative to its city-region somewhat more quickly
than that of Leeds over the period 2010 to 2015 (just over 6% compared to 2.2%).
29Table 3.3. Sub-Regional Performance Relative to the Northern Economy in 2013
GVA per capita Labour Employment rate Working-age
productivity share
Cheshire and 118 101 111 100
Warrington
Greater Manchester 107 105 99 106
Leeds City Region 105 101 102 104
Liverpool City Region 102 113 94 102
York, North Yorkshire 97 100 109 100
and East Riding
Cumbria 104 92 109 95
Humber 91 97 104 99
Lancashire 91 91 100 99
Tees Valley 91 95 96 103
North Eastern 91 98 99 103
Sheffield City Region 88 93 101 99
Table 3.4. The growth of Leeds and Greater Manchester in relation to their
respective sub-regional economies 2010-2015
West Yorkshire Greater Manchester Leeds LAD Manchester LAD
(% City region) (% City region)
Employment 958,000 949,000 396,000 309,000
2010 (41.3) (32.5)
Employment 1,019,000 1,008,000 430,000 349,000
2015 (42.2) (34.6)
Growth in 61,000 59,000 34,000 40,000
Employment
% Growth in 6.4% 6.2% 8.6% 12.9%
Employment
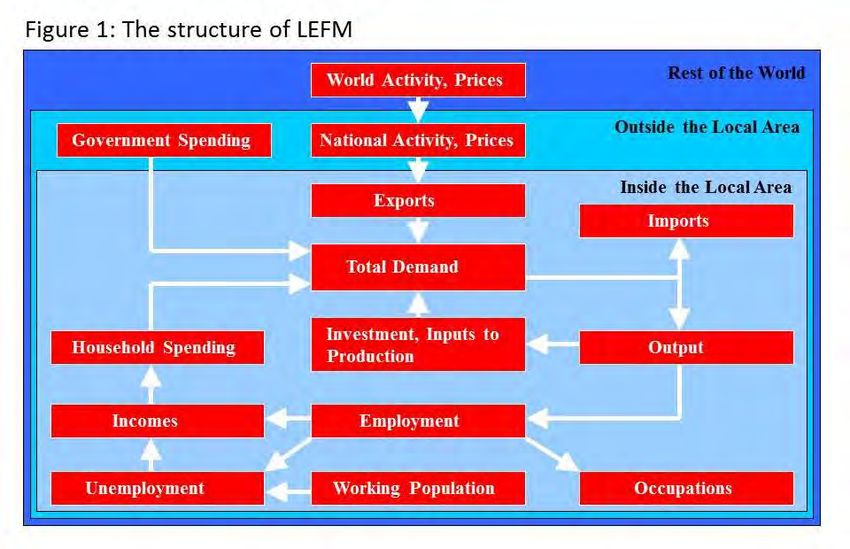
3.11 Figure 3.3 picks up on the productivity issue further and shows how the level of
productivity in Leeds City (the PUA area in this case) compares with other cities across the
UK Great Britain in 2013 compared to 1981. It is encouraging that Leeds appears to have
been increasing its relative productivity over the last 25 years and at a slightly faster rate
than Manchester.
30Figure 3.3. How Productivity Varies across Cities, 1990 and 2014
140
Slough
Improving in Relative Productivity London
130
Productivity Level in 2014 (relative to GB = 100)
Milton Keynes
Swindon
120
110
100
Leeds
90 Birmingham
Manchester
Declining in Relative Productivity
Sheffield
York
80
70
70 80 90 100 110 120 130 140
Productivity Level in 1990 (relative to GB = 100)
3.12 However, as Figure 3.4 shows, it is important to recognise that Leeds has an overall
level of productivity that is still below that of the United Kingdom as a whole. The position for
the Yorkshire and Humber region is worse.
31Figure 3.4. Productivity of Leeds compared to UK and Yorkshire and Humber, 1990
to 2015
50.0
45.0
Productivity (£000 per worker)
40.0
35.0
30.0
25.0
1990 1995 2000 2005 2010 2015
UK Leeds Yorkshire and Humber
Growth in productivity by sector
3.13 Productivity growth in the largest sectors in Leeds (Figure 3.5) has not been
particularly strong (and in many cases slower than the UK average). This reflects the fact
that many of these sectors have seen substantial (and faster than UK) growth in employment
over the past 25 years, and more moderate increases in GVA. The IT and Financial and
Insurance sectors have seen some of the fastest growth.
3.14 Outside the top twenty largest sectors, GVA per employee in Textiles is above the
national average, reflecting a sector that has managed to achieve stronger growth in GVA
than employment (and, in more recent years, a more rapid decline in employment than
output).
32Figure 3.5 % Productivity Change in Leeds’ largest 20 sectors by employment
between 1990 and 2015
160.0
140.0
Productivity % Chnage (1990 to 2015)
120.0
100.0
80.0
60.0
40.0
20.0
0.0
-20.0
-40.0
The Drivers of productivity
3.15 The main drivers of productivity highlighted by HM Treasury4 are:
sectoral specialism;
skills;
connectivity;
agglomeration
knowledge and innovation;
governance.
3.16 In the rest of this Section we provide a brief review of what is known about the
relative strength of the Leeds economy in relation to the first five of these.
Sectoral specialisation
3.17 One way to assess the degree to which a city has a relatively greater concentration
of economic activity is through location quotients. Figure 3.6 shows employment location
quotients for Leeds in 2015. A Location Quotient of greater than one signifies that that sector
represents a larger proportion of employment within the Leeds economy than the total sector
4
HM Treasury (2006). Prosperity for All in the Global Economy-world Class Skills. Final Report of the Leitch Review of Skills,
TSO, London.
33employment within the total UK economy. When a local area has a relatively greater
concentration than the national average in a specific sector it can reflect that the area has
some form of competitive advantage in the sector, particularly if the sector is experiencing
relative growth over the study period examined.
3.18 Table 3.5 adds a further dimension by showing the location quotient by sector in
2015 alongside the growth of the sector over the period 1990-2015 in Leeds compared to
the UK. It can be seen that there was particularly rapid economic growth in business support
services, education, head office and management consultancies in Leeds, which were all
sectors in which Leeds had a relatively greater concentration by 2015 compared to the UK.
3.19 The main sectors in which Leeds appears to have a relatively higher concentration
than the national average are:
Electricity and gas;
Electrical equipment;
Air transport;
Printing and recording;
Financial and insurance;
Wood and paper;
Other professional services;
Legal and accounting;
Business output services.
Table 3.5. Leeds sectoral analysis; An analysis of the sectoral composition of
employment in Leeds is shown below
Sector Leeds LAD Growth, % pa, UK Growth % Location
Employment 1990-2015 pa, 1990 2015 Quotient, 2015
2015
Business support services 48,700 2.39 0.41 1.29
Education 44,000 3.30 1.55 1.11
Retail trade 34,000 -0.44 2.54 0.84
Health 30,700 1.49 2.20 0.96
Construction 23,800 -0.42 -0.29 0.83
Financial & insurance 22,100 0.98 1.62 1.44
Residential & social 21,500 1.27 1.15 0.88
Public administration and
21,500 -0.80 -0.75 1.09
defence (PAD)
Wholesale trade 18,900 -0.84 0.11 1.10
Food & beverage services 18,900 -0.45 -0.14 0.80
Head offices & management
14,900 9.94 2.56 1.17
consultancies
IT services 14,300 1.93 0.92 1.08
Other professional services 12,600 6.20 5.81 1.32
Legal & accounting 12,500 2.24 1.71 1.30
34Sector Leeds LAD Growth, % pa, UK Growth % Location
Employment 1990-2015 pa, 1990 2015 Quotient, 2015
2015
Recreational services 10,300 2.59 1.67 1.19
Warehousing & postal 9,400 1.45 2.13 0.87
Other services 9,300 -0.90 -0.35 0.72
Architectural & related 8,500 0.89 1.58 0.97
Land transport 8,400 -0.68 2.08 0.92
Motor vehicles trade 8,100 0.10 -0.66 1.04
Note: Only the top 20 sectors (with employment > 8,000 employees) are shown.
3.20 Figure 3.7 adds a further dimension to the analysis by considering if the sectors that
are relatively specialised in the Leeds economy have been increasing their relative share
over the period 1971-2014. It appears that the sectors in which Leeds has been increasing
its relative degree of specialism are Business Support Services, Education, Health, Finance
and Insurance and the Residential and Social sector. This suggests that the City has
strength across a wide range of office-based activities.
3.21 The analysis is extended further to add an analysis of how the Manchester economy
has performed to enable comparison (Figure 3.8). It is interesting to note that Manchester
like Leeds has been increasing its degree of specialisation in Business Support Services,
education, health and the Residential and Social sector.
35Figure 3.6 Leeds LAD Location Quotient (Employment)
0.00 0.50 1.00 1.50 2.00 2.50 3.00
Electricity & gas
Electrical equipment
Air transport
Printing & recording
Financial & insurance
Wood & paper
Other professional servi
Legal & accounting
Business support service
Recreational services
Machinery, etc
Head offices & manag co
Chemicals, etc
Education
Wholesale trade
PAD
IT services
Coke & petroleum
Other manuf. & repair
Motor vehicles trade
Architectural & related
Arts
Real estate
Health
Land transport
Textiles etc
Metals
Residential & social
Warehousing & postal
Retail trade
Construction
Food & beverage services
Water, sewerage & waste
Non-metallic
Other services
Accomodation
Food, drink & tobacco
Pharmaceuticals
Media
Agriculture etc
Mining & quarrying
Computers, etc
Motor vehicles, etc
Water transport
Other trans. equipment
2015 1990
36Figure 3.7. Sectoral concentration of employment in the Leeds economy in relation
to growth over the period 1971-2014.
Leeds: Employment Change x Share
8
Business Support Services
Education
6
Change in Employment Share (pp), 1971-2014
Finance & Health
4
Insurance
2 Residential & Social
0
0 2 4 6 Retail 8 10 12
-2
-4 Wholesale
-6
-8
-10
-12
Employment Share (2014)
Figure 3.8. Sectoral concentration of employment in the Manchester economy in
relation to growth over the period 1971-2014.
Manchester: Employment Change x Share
8
Business Support Services
6
Change in Employment Share (pp), 1971-2014
Health
4
Education
Residential & Social
2
Construction
0
0 2 4 6 8 10
Retail
-2
PAD
-4
-6
-8
-10
-12
Employment Share (2014)
373.22 It is clear from the evidence that the Leeds economy is increasing its relative
presence in KIBS and its ability to do this reflects its relative strength in this key area of
economic activity. Because of the importance of this sector in the Leeds economy an
analysis was undertaken to assess how productivity in this sector in Leeds compared with
other British cities with which it is competing for investment. Figure 3.9 shows that
productivity in this sector in Leeds has been increasing since 1990. Moreover, Leeds has a
higher level of productivity than cities like Manchester, Sheffield and Birmingham and
appears to be moving away from them to some degree.
Figure 3.9. Changes in Productivity in the Knowledge Intensive Business Services
sector across British Cities 1990-2014.
London
KIBS Productivity Level in 2014 (relative to GB = 100)
140
Improving in Relative Productivity
130
Slough
120
Milton Keynes
110
100
Swindon
90
Leeds
Birmingham
80 Manchester
York Declining in Relative Productivity
Sheffield
70
60
60 80 100 120 140
KIBS Productivity Level in 1990 (relative to GB = 100)
Skills
3.23 The ability of the Leeds economy to increase its productivity and grow is strongly
influenced by its ability to obtain skilled labour. Figure 3.10 shows the relationship between
skills (as proxied by the percentage of the areas workforce with NVQ4+) and the level of
productivity (as proxied by GVA per hour worked) for English Local Enterprise Partnerships.
There is a fairly positive relationship between the two variables as would be expected. Leeds
is bunched close to Manchester in its relative position and better placed than cities like
Sheffield and Liverpool. However, most Northern cities have a skill deficit compared to their
38Southern counterparts. The cities with the highest levels of productivity have the highest
proportion of better skilled workers and it is thus essential that Leeds seeks to increase the
level of skills in its workforce as it moves forward.
Figure 3.10. The relationship between GVA per hour worked and levels of skill in
English Local Enterprise Partnership areas.
Source: BIS (2015).
Agglomeration
3.24 In recent years there has been much attention given to the role of agglomeration as a
factor that enhances the economic competitiveness of cities. The argument is that the
spatial concentration of people and firms in cities leads to positive externalities that
provide increasing returns and thus falling average costs to the businesses located
there. Three main sources of the types of externalities are identified. These are ‘’input
externalities’ whereby there is a concentration of companies that produce specialised
services and products, lower transport costs and procurement economies. The second
embrace labour market externalities that arise from the geographic concentration of
workers with specialised skills of relevance to an industry. The third relate to knowledge
externalities that reflect the benefits of close proximity in sharing and exchanging
knowledge of relevance to an industry’. (BIS. 2009) 5.The benefits of agglomeration are
particularly strong for the financial services sector. Some idea of the relative size of the
potential agglomeration benefits available to Leeds compared to other cities in the North
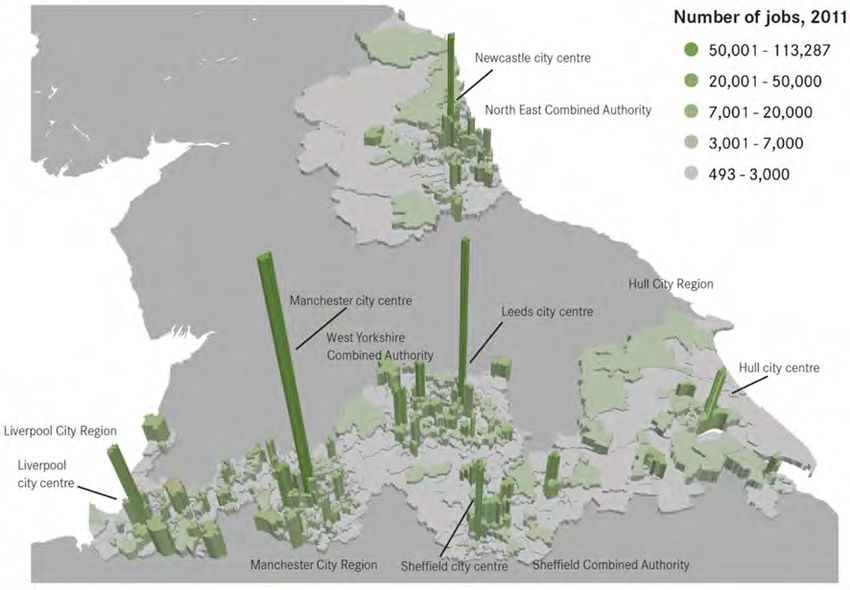
of England can be gauged by considering Figure 3.11. This shows that Leeds City has
the second highest concentration of jobs in the North next to Manchester. Figure 3.12
5 BIS Occasional Paper No 1. Research to improve the assessment of additionality. October 2009.
39shows that private business services sector (KIBS, Real Estate and Business Support
Services) tends to dominate the demand for city centre office space and it is highly
concentrated in two centres in Manchester and Leeds having over 100,000 employees.
This reinforces the increasing agglomeration benefits to KIBS employers of locating in
Leeds City Centre.
3.25 Leeds is thus well positioned to continue to exploit its substantial agglomeration
benefits as they relate to the KIBS that are becoming an increasing part of its economic
landscape. It is thus very important for Leeds that it ensures that there is a strong supply
of high quality of offices in and around its centre core.6
Figure 3.11. Distribution of jobs across and within the cities of the North of England
(Source: Centre for Cities, 2015)
6Recent research undertaken by the Centre for Cities shows that jobs growth, and particularly in
KIBS, is concentrating in Leeds City Centre ( http://www.centreforcities.org/publication/leeds-city-
centre/ ).
40Figure 3.12. The concentration of the private business services sector (KIBS, Real
Estate and Business Support Services) in the North of England.
Total Employment
The importance of connectivity
3.26 In recent years HM Treasury has been highlighting the need to increase the degree
of connectivity between northern cities. They argue that better connectivity would be good
for the labour market in the North since it would allow KIBS employers in cities like Leeds to
realise the benefits of agglomeration whilst enabling some part of their workforce to
commute from their homes elsewhere in the city-region. Businesses in the North could
obtain labour from a wider labour pool, in the way that businesses in London are able to do
because of very good rail infrastructure to surrounding cities in the South East of England. At
the present time connectivity is relatively poor and there are very weak levels of commuting
flow between cities in the North. HM Treasury comments: ‘it is currently quicker to travel the
283 miles from London to Paris by train than it is to travel less than half that distance
between the two Northern cities of Liverpool and Hull’7. The British Treasury stated that
increased connectivity would enable more trade to occur and enable businesses to interact
and collaborate more effectively. Figure 3.13 shows recent evidence assembled by HS2
that illustrates just how disadvantaged the cities are on the basis of rail connections. There is
much evidence to reinforce the view that the motorway system is also heavily compromised
and for Leeds a key area remains the need for it to increase its relative connectivity to the
East, West and North of England. HS2 clearly offers major opportunities with respect to the
7 HM Treasury (2015). Fixing the Foundations: Creating a More Prosperous Nation. Cm 9098.
41South of England although even here there is an urgent need for more research and insight
into how even investment in this major infrastructure project can be developed so as to
maximise the economic benefits for Leeds and other northern cities.
Figure 3.13. East West and North South Connectivity in the United Kingdom.
Source: Rebalancing Britain, HS2, 2014
Enhancing the knowledge and innovation system
3.27 An increasingly important factor in the growth of cities is their ability to develop their
knowledge-based assets including their universities and major research institutions. Leeds
and the other major cities in the North have extensive knowledge-based assets. Recognising
the significant benefits that arise from collaboration and interaction across their regional
innovation system the universities have formed the N8 Research Partnership which is a
‘collaboration of the eight most research intensive universities in the North of England:
Durham, Lancaster, Leeds, Liverpool, Manchester, Newcastle, Sheffield and York. Working
with industry, N8 aims to maximise the impact of this research base by identifying and
coordinating powerful research collaborations across the North of England and beyond’
(http://www.n8research.org.uk/). The N8 universities have an extensive combined research
capability and argue that they ‘represent a significant cluster of research power among the
130 universities in the UK’. Their website shows that they have almost 15,000 academic
staff–12% of UK total, over 38,000 postgraduate students–11% of UK total (taught and
research) and a total research income in 2010/11 of £747m–17% of UK total. They received
42almost £500m of Government research funding-18% of UK total, £72m of UK industrial
research funding–16% of UK total and £120m from overseas research partners. All eight
universities are in the top 1% of institutions in the world.
3.28 The importance to Leeds of developing its knowledge based assets and the
enterprise associated with it cannot be overemphasised. If it is to be successful in this
respect then it will have to re-orientate its land uses, resource bases and institutions
accordingly (Tyler, 2015). Recent support by HM Government to technology incubators in
Leeds is reflective of the investment that has to be attracted.
3.29 It should also be mentioned that Leeds has performed well in recent years in
developing its presence in the digital economy as the growth of the Leeds Digital Festival
illustrates. In 2016 over 6,000 people attended 56 events across 28 venues featuring over
175 speakers; over 10,000 attendees are expected in 2017. The local authority in
partnership with business, universities and education providers has developed a Leeds
Digital Skills Action Plan8.
Conclusion
3.30 The Leeds economy has been restructuring its economy away from its traditional
manufacturing sectors and increasingly towards KIBS. It has a particular strong competitive
advantage in Business Support Services, Finance and Insurance where it is now probably
the second leading centre of such activity in England. However, it is also well-placed in a
number of other mainly service-related sectors like tourism, retail and leisure. Continued
growth in these sectors will provide jobs for those who may have lower skill levels than KIBS
workers and may be having difficulties in finding employment elsewhere in Leeds.
3.31 The ability of the Leeds economy to continue to attract new investment in KIBS
sectors depends increasingly on the strength of its offer compared to cities like Manchester
and Birmingham with which it competes for this type of activity. Whilst its overall productivity
levels are behind that of the United Kingdom it is relatively high compared to other cities in
the Northern Powerhouse and only slightly below that of Manchester.
3.32 Whilst the productivity levels of some of its key sectors continue to lag behind the
UK, there is evidence for relative improvement and it is essential that Leeds does all it can to
enable its core businesses to access the labour, premises and finance they require to grow.
3.33 The importance of investing in the skill base cannot be overestimated. But it is also
necessary to invest in new transport infrastructure that will allow more commuting into the
City from the surrounding region and from other cities in the North. Improving connectivity
requires substantial investment in new road and rail infrastructure between the east and
west in addition to the south as envisaged in the current proposals for HS2.
8 see: http://www.leeds.gov.uk/docs/The%20Leeds%20Digital%20Skills%20Action%20Plan.pdf
43You can also read