The Impact of Industrial Robots on EU Employment and Wages: A Local Labour Market Approach - Bruegel
←
→
Page content transcription
If your browser does not render page correctly, please read the page content below
WORKING PAPER | ISSUE 02 | 18 APRIL 2018
 The Impact of Industrial
 Robots on EU Employment
 and Wages: A Local Labour
 Market Approach
 FRANCESCO CHIACCHIO, GEORGIOS PETROPOULOS, DAVID PICHLER

 We study the impact of industrial robots on employment and wages in six
 European Union countries, that make up 85.5 percent of the EU industrial
 robots market. In theory, robots can directly displace workers from
 performing specific tasks (displacement effect). But they can also expand
 labour demand through the efficiencies they bring to industrial production
 (productivity effect). We adopt the local labour market equilibrium
 approach developed by Acemoglu and Restrepo (2017) to assess which of
 the two labour market effects dominates. We find that one additional robot
 per thousand workers reduces the employment rate by 0.16-0.20 percentage
 points. Thus a significant displacement effect dominates. We find that the
 displacement effect is particularly evident for workers of middle education
 and for young cohorts. Our estimates, however, do not point to robust
 and significant results on the impact of robots on wage growth, even after
 accounting for possible offsetting effects across different populations and
 sectoral groups.

 Georgios Petropoulos (georgios.petropoulos@bruegel.org) is Research Fellow at Bruegel,
 Francesco Chiacchio(francesco.chiacchio@bruegel.org) is a Research assistant at Bruegel,
 David Pichler (david.pichler@bruegel.org) is a Research assistant at Bruegel. The authors
 are grateful to Nicolas Moës for the numerous very useful and insightful discussions on this
 paper.
The Impact of Industrial Robots on EU
Employment and Wages: A Local Labour
Market Approach

Francesco Chiacchio Georgios Petropoulos David Pichler
Bruegel Bruegel Bruegel

Abstract
We study the impact of industrial robots on employment and wages in six European Union countries, which make
up 85.5 percent of the EU industrial robots market. In theory, robots can directly displace workers from performing
specific tasks (displacement effect). But they can also expand labour demand through the efficiencies they bring
to industrial production (productivity effect). We adopt the local labour market equilibrium approach developed
by Acemoglu and Restrepo (2017) to assess which of the two labour market effects dominates. We find that one
additional robot per thousand workers reduces the employment rate by 0.16-0.20 percentage points. Thus a
significant displacement effect dominates. We find that the displacement effect is particularly evident for workers
of middle education and for young cohorts, while men are more affected than women. Our estimates, however, do
not point to robust and significant results on the impact of robots on wage growth, even after accounting for
possible offsetting effects across different populations and sectoral groups.

 1
1 Introduction

Since the start of the Industrial Revolution more than 200 years ago, technological development has substantially
reshaped the way we live and work. Ground-breaking innovations allow easy communication and travel within
and between countries, use less energy to do the housework and provide instant access to any kind of
information. However, machines and software can significantly outperform workers in many tasks, leaving
workers at risk of substitution.

Technological development, and in particular, digitalisation has major implications for labour markets. The
assessment of the impact of digitalisation on employment is very important for deriving specific policy
recommendations that can lead to the efficient functioning of the labour market for the benefit of workers,
employers and society as a whole.

There are many different kinds of technologies with the potential to influence the future of employment in
different ways. Progress in information and communications technology (ICT), for example, is expected to affect
a different group of workers than autonomous vehicles. Another prominent example is the rise of robots, which
has ignited lively debates about taxes on machines replacing workers and unconditional income. The
combination of improved capabilities and falling production costs (see the discussion in Section 2), gave rise
notably to industrial robots as illustrated by the statistics collected by the International Federation of Robotics
(IFR) and presented by Petropoulos (2017) 1.

As noted by Acemoglu and Restrepo (henceforth AR, 2017), technological innovations can affect employment in
two main ways:

 • By directly displacing workers from tasks they were previously performing (displacement effect).

 • By increasing the demand for labour in industries or jobs that arise or develop as a result of technological
 progress (productivity effect).

Therefore, in order to analyse holistically the impact of artificial intelligence systems on our industrial production,
the real question then becomes: which of the two effects – displacement or productivity – dominate in the
artificial intelligence (AI) era 2?

This paper adopts the local labour market equilibrium approach developed by AR for the US market and uses it in
the context of the EU labour market. We assess the impact of one automated technology – industrial robots – on
employment and wages in six EU countries: Finland, France, Germany, Italy, Spain and Sweden, which account
for 85.5 percent of the EU robots market in 2007. By adopting this approach, we can exploit exogenous changes
at the local level and control for detailed demographic variables and study the impact of robots on sector and
occupational-level variables. Our choice not to include more recent years than 2007 in the analysis at the current
stage is motivated by data limitations 3 but it allows a more direct comparison of our results with the AR study
which also sets 2007 as the final year in their sample; in addition, the post-2007 crisis period makes the
assessment of the impact of robots on employment and wages challenging.

We find that one additional robot per thousand workers reduces the employment rate by 0.16-0.20 percentage
points. Hence, the significant displacement effect dominates. Studying additional dimensions of the impact of
robots, we find that the displacement effect is particularly prominent for workers of middle education, for young
cohorts and for men. Our estimates, however, do not point to robust and significant results for wage growth, even
after accounting for possible offsetting effects across different population or sectoral groups.

1 Available at: http://bruegel.org/2017/12/the-growing-presence-of-robots-in-eu-industries/.
2 AI refers to intelligence exhibited by machines. Hence, the AI era refers to that period in time in which machines equipped
with deep learning techniques that are based on neural network architecture will be able to perform tasks that require some
form of intelligence, in an automatic way and without requiring human intervention.
3 The industry classification in our post-2007 data changes. That requires to find a consistent industry categories matching

mechanism which minimizes the noise in the sample. We leave this for future research.

 2
Very broadly we could say that there are three approaches to assessing the impact of automation on employment.
A first approach is to travel back in time to previous industrial revolutions and investigate the impact of
technological breakthroughs on labour and associated industries: the introduction of automobiles in daily life led
to a decline in horse-related jobs, for example. However, new industries emerged resulting in a positive impact on
employment. It was not only that the automobile industry itself grew rapidly, increasing the available jobs in the
sector. Jobs were also created in different sectors because of the growing number of vehicles on the roads. For
example, new jobs were created in the motel and fast-food industries that arose to serve motorists and truck
drivers.

In general, past industrial revolutions suggest that in the short run the displacement effect might dominate. But
in the longer run, when markets and society become fully adapted to major automation shocks, the productivity
effect can dominate and lead to a positive impact on employment.

But how reliable is this approach in the case of AI? The McKinsey Global Institute (2015) estimates that, compared
to the Industrial Revolution of the late eighteenth and early nineteenth centuries, AI’s disruption of society is
happening ten times faster and at 300 times the scale. That means roughly 3000 times the impact. This
observation suggests that past examples of major technological advancements might not be able to capture the
dynamic markets forces of automation.

A second approach would be to assess the risk to occupations and tasks that will be automated in the next
decades because of AI systems. Literature that follows this approach has focused on the question of how feasible
it is to automate existing jobs given current and presumed technological advances. Frey and Osborne (2013,
2017) more predominantly sparked a debate by claiming that 47 percent of US occupations are at risk of being
automated “over some unspecified number of years, maybe a decade or two”. Bowles (2014) redid these
calculations for the European labour market, and found that on average, 54 percent of EU jobs are at risk of
computerisation. By contrast, Arntz, Gregory and Zierahn (2016, 2017) argued that a major limitation of Frey and
Osborne is that they focused on deriving predictions for occupations under threatened from automation rather
than tasks. Their criticism is that in this way, Frey and Osborne overestimated the automation risks. By using
information on task-content of jobs at the individual level they conclude that only 9 percent of US jobs are
potentially automatable.
These studies can be viewed as feasibility tests of the potential impact of AI; they focus on the potential
displacement effect of automation. Even more challenging is to try to also assess the impact of the productivity
effect. For this we need to consider that new machines might even expand employment in affected industries.
Bessen (2017), for example, finds empirically that computer technology is associated with job growth, which is
particularly observable in non-manufacturing industries. At the same time, we should also not ignore potential
sector spillover effects. As AR illustrate in their theoretical model, the labour market impacts of new technologies
depend not only on where they hit but also on the adjustment in other parts of the economy. For example, other
sectors and occupations might expand to absorb the labour freed from the tasks that are now performed by
machines.

Assessing the significance of these effects would require adoption of an equilibrium approach because what is
technologically feasible does not necessarily correspond to the equilibrium impact of automation on
employment and wages. For example, in this way, we can take into account that firms’ market strategies and
investment decisions are endogenous to technology shocks. Even if the presumed technological advances
materialise, there is no guarantee that firms would choose to automate; that would depend on the costs of
substituting machines for labour and how much wages would change in response to this threat. That brings us to
the third approach of assessing the impact of AI on employment which is also used by this paper.

 3
Related Literature

Recent studies that adopt this third approach focus on one automated technology: the industrial robots and their
impact. This is because of the existence of good quality data on the penetration of industrial robots in the main
industries in major economies in the world.

Graetz and Michaels (2017) were first to use the industrial robots’ database. They estimated that in the 17
countries of the sample, the increased use of robots per hour worked from 1993-2007 raised the annual growth
of labour productivity by about 0.37 percentage points. By considering an industry-country panel specification,
they found that robots appear to reduce the share of hours worked by low-skilled workers relative to middle-
skilled and high-skilled workers; they do not polarise the labour market, but appear to hurt the relative position of
low-skilled workers rather than middle-skilled ones. Nevertheless, the use of robots per hour worked appears to
boost total factor productivity and average wages.

In a more recent study, AR using data in the post-1990 era found that one additional robot per thousand workers
reduces the US employment-to-population ratio by 0.37 percent and wages by 0.25-0.5 percent on average. The
novel element of their study was that they adopted a more regional approach than the industry-country panel
approach of Graetz and Michaels. As the labour force competes with robots for production, they exploit the
heterogeneity in both local labour distributions across industries and national change in the use robots to refine
their results. They can therefore estimate the impact of industrial robots’ penetration on local labour markets. As
we show below, following a similar approach for the EU, the negative impact of robots on employment rate is more
modest, while we do not find robust significant impact on wages.

Dauth et al (2017) adopted this local empirical exercise for Germany but they did not find any negative significant
impact of robots on employment. While industrial robots have a negative impact on employment in the German
manufacturing sector, there is a positive and significant spillover effect as employment in the non-manufacturing
sectors increases and, overall, counterbalances the negative effect.

Our paper is also related to studies that refer to job polarisation. Autor, Levy and Murnane (2003) stressed that
technology can replace human labour in routine tasks, whether manual or cognitive, but (as yet) cannot replace
human labour in non-routine tasks. Goos and Manning (2007) argue that the impact of technology leads to rising
relative demand in well-paid skilled jobs, which typically require non-routine cognitive skills, and rising relative
demand in low-paid least-skilled jobs, which typically require non-routine manual skills. At the same time,
demand for ‘middling’ jobs, which have typically required routine manual and cognitive skills, will fall. The authors
call this process job polarisation. Acemoglu and Autor (2011) found similar results for the US, while Darvas and
Wolff (2016) reported similar developments for a selection of EU countries: Germany, Spain, France, Italy, Sweden
and the UK. Moreover, Goos, Manning and Salamons (2014) found evidence that supports the theory of routine-
biased technological change, which claims that new technological innovation shifts demand away from workers
who perform routine tasks.

 4
2 Industrial Robots and Labour Markets-Main Trends

According to International Federation of Robotics (IFR) (2016), an industrial robot is “an automatically controlled,
reprogrammable, multipurpose manipulator programmable in three or more axes, which can be either fixed in
place or mobile for use in industrial automation applications”. While our coffee machine, or the elevator at our
home building does not fall under this definition, fully autonomous machines that do not need a human operator
and that can be programmed to perform several manual tasks such as welding, painting, assembling, handling
materials or packing are classified as industrial robots.
In the global context, the use of industrial robots is particularly prevalent in Europe where, on average, every
thousand workers were exposed to 0.6 industrial robots in 1995 and 1.9 in 2016. By comparison, in the US the
exposure to robots per thousand workers was 0.4 and 1.6 respectively (Figure 1). The growth in the number of
robots per thousand workers is particularly high for China, where it exceeds the respective growth rates in the EU
and US after 2009.

 Figure 1: Robot density
 (robots per 1000 workers)
 2

 1.5

 1

 0.5

 0
 1993 1995 1997 1999 2001 2003 2005 2007 2009 2011 2013 2015
 US China EU28 Asia
 Source: Calculations based on IFR and EU-KLEMS

According to the IFR database, 99 percent of all robots installed in core European countries are in the
manufacturing sector. Notably the automotive sector has automatised a large share of its production and
accounted for 52 percent of all installed industrial robots in 2007 4. While even more industrial robots were
installed between 2007 and 2015, Figure 2 shows there was a significant increase in the penetration of robots in
the industries of advanced European economies in the 1990s and early 2000s. The smaller increase between
2007 and 2015 might be due to the drop in demand during the financial crisis and/or fewer opportunities for firms
to further automate.
Furthermore, the significant differences between countries in terms of penetration of robots reveal the
heterogeneity of the economic structure in our sample. While Germany, because of its strong automobile
industry, employed around 4.5 industrial robots per 1000 workers in 2007, the exposure of the French labour
force was about half that rate at that year. The difference was even more prominent in 2015, mainly because a
slowdown in robotisation in the French markets.
 Figure 2: Number of industrial robots, by sector Figure 3: Robot density by country

4 See Petropoulos (2017) for an illustration.

 5
(units) (robots per 1000 workers)
 180000 1995 2007 2015 5 1995 2007 2015

 4
 120000

 3
 60000
 2

 0
 1

 0

 Note: Displayed sectors are a subcategory of manufacturing while “Other sectors” also includes non-manufacturing sectors. Data for Sweden, Finland,
 Denmark, Germany, Spain, France, Italy, UK. Calculations for robots per 1000 are based on employment in the total economy in the respective year.
 Source: IFR , EU-KLEMS.

Two major factors that reinforce the rise of industrial robots are their increased competence and efficiency and
the falling prices per output produced. Working from the survey and industrial robot models analysed in IFR
(2016), Figure 4 shows the increase in robots’ average quality (or efficiency) index (defined as robots’
production-cost mark-up) between 1990 and 2005, with the robots’ quality in 1990 normalised to one. Industrial
robots introduced in the markets of our country sample in 2007 were approximately three times more efficient
than the robots introduced in 1990.

 Figure 4: Quality of robots Figure 5: Robot prices
 (ratio) (1990 = 100)

 3 100

 90

 80
 2.5
 70 Robot prices,
 not quality adjusted
 60
 2 50

 40

 30
 1.5
 20
 Robot prices, quality adjusted
 10
 1 0
 1990 1992 1994 1996 1998 2000 2002 2004 2006 1990 1992 1994 1996 1998 2000 2002 2004 2006
 Average sample World Average sample World

 Note: Quality index computed as non-quality-adjusted prices over Note: Price indexes for 2006 and 2007 have been predicted using previous
 quality-adjusted prices. Price indexes for 2006 and 2007 have been data. Sample includes: Germany, Finland, France, Italy, Spain, and Sweden. For
 predicted using previous data. Sample includes: Germany, Finland, Finland and Spain, global prices are used.
 France, Italy, Spain, and Sweden. For Finland and Spain, global prices
 are used.
 Source: Calculations based on IFR (2006) Source: IFR (2006).

Furthermore, Figure 5 shows that robots’ price index (based on 1990 US$ conversion rate) dropped by more than
50 percent between 1990 and 2007 on average both for the EU countries under study and the world in general.
Controlling for the increased quality, the respective drop in the price index becomes greater than 80 percent.

 6
As discussed in the previous section, two main forces are at play when new innovations are adopted in the
economy. Technological advances might directly lead to the replacement of labour in tasks where workers are
more costly or less efficient. Secondly, the improved productivity of firms in a sector might lead to the expansion
of that sector, but can have potential positive spillovers onto other parts of the economy. Figure 6 depicts the
trend of falling employment in manufacturing that has been observed in most advanced economies. However,
technological change is only one potential explanation for this development. Global factors, such as competition
with low-cost countries such as China and the internationalisation of global value chains, have contributed to this
structural change (see for example Veugelers, 2017).
On the other hand, although employment in manufacturing is decreasing relative to the rest of the economy,
manufacturing companies managed to significantly boost the productivity of their workers (see Figure 7).
Between 1995 and 2007, the manufacturing sector recorded the biggest gains in gross value added, which
excludes intermediate consumption, and further improved its productivity throughout the crisis years. This might
indicate that the introduction of new technologies allowed the European manufacturing sector to successfully
compete against other global players.
 Figure 6: Employment shares by sector Figure 7: Gross value added per employed person
 (percentage shares) by sector
 (1000 euros per worker)

 100 1995 2007 2015 90
 1995 2007 2015
 80

 75 70
 60
 50
 50
 40
 30
 25 20
 10
 0 0
 Agriculture, Construction Services Manufacturing Agriculture, Construction Services Manufacturing
 forestry and forestry and
 fishery fishery

 Note: Based on Euro Area-12 countries: Austria, Belgium, Finland, France, Note: Based on Euro Area-12 countries: Austria, Belgium, Finland,
 Germany, Greece, Ireland, Italy, Luxembourg, the Netherlands, Portugal and France, Germany, Greece, Ireland, Italy, Luxembourg, the Netherlands,
 Spain. Portugal and Spain.
 Source: AMECO Source: AMECO

Turning to employment at the occupational level, Figure 8a shows that the technological development and global
factors were complementary to specific occupational groups but might have reduced economic activity in others.
Occupational groups are ordered (descending) conditional on the skill level that is required for the given
occupation (ILO, 2012). Based on this, we can see that employment decreased for middle-skill occupations (with
the exception of service workers) and increased for both low and high skill jobs. This phenomenon is often referred
to job polarisation – as described in the literature section. In particular, employment grew strongest for
technicians and associate professionals, whereas workers in skilled agriculture, clerks, craft and trade workers,
plant and machine operators and assemblers saw a reduction in employment between 2007 and 1995. In
manufacturing, where most robots are installed, two major trends can be observed: first, a great reduction of craft
and trade workers and of plant and machine operators (especially between 2007 and 2015), and second, a
significant increase in professionals and technicians.

 Figure 8a: Employment rate, by occupational group in Figure 8b: Employment rate, by occupational group in
 the total economy the manufacturing sector

 7
(percentages) (percentages)

 12 1995 2007 2015
 4 1995 2007 2015

 10
 3
 8

 6 2

 4
 1
 2

 0 0

 Note: Based on same six EU countries as in our analysis; employment rate Note: Based on same six EU countries as in our analysis; employment rate
 based on population older than 15 years. based on population older than 15 years.
 Source: Own calculations based on Eurostat LFS microdata. Source: Own calculations based on Eurostat LFS microdata.

While we find a clear pattern of employment polarisation, the picture is less clear for wages. While Figure 9
generally shows a U-shaped relationship between nominal gross hourly wages and skill level, changes in the
wage level do not clearly indicate a further deepening of that pattern. While there is only mild wage growth for
workers in skilled agriculture, other middle-skilled occupations saw a significant income gain relative to other
groups. Interestingly, plant and machine operators/assemblers, who are believed to be heavily affected by
technological change, are among those workers who on average had the highest wage growth.
Figure 9: Nominal gross hourly wages in euro, by occupational group
 20
 1995 2007

 15

 10

 5

 0

Note: Based on same six EU countries as in our analysis; sample includes population older than 15 years.
Source: Own calculations based on Eurostat LFS microdata.

 8
3 Empirical Methodology

The empirical specification is based on the theoretical model of AR. We start this session by briefly summarising
their model before defining the empirical specification.

3.1 Background theoretical model
Consider regions and industries in the economy. Each industry produces output by combining a continuum
of tasks ∈[0,S]. Industrial robots are modelled as performing tasks previously performed by labour. In each
industry : i) tasks ∈ [0, ] are automated and can be performed by robots; ii) tasks > have not been
automated and therefore, the the use of robots in their production is impossible. It is assumed that it is profitable
for firms to use robots in all tasks that are technologically automated 5.
Let the productivity of robots for every task be normalised to 1 and the productivity of labour be constant and
equal to > 0. Then, the production function for task in industry in region can be written as:
 ( ) + ( ), if ≤
 ( ) = �
 ( ), if > ,
where ( ) denotes labour used in the production of task in industry in region and ( ) is the number
of robots used in the production of task .

The output of industry in region , , is then derived by combining tasks in fixed proportions such that:
 = min { ( )},
 ∈[0, ]

where is the productivity of industry in region .

Each region r has consumption preferences. The aggregate consumption of the output of the industries in each
region is given by:

 −1 −1
 = �� � ,
 ∈

where > 0 is the elasticity of substitution across goods and is the share parameter that underlines the
importance of the industry in the aggregate consumption.
Hence, the supply of robots and labour in each region is specified 6 by:
 = ; and

 = � � ,

where denotes the total number of robots, is the total amount of labour, is the price of robots, and
is the wage rate in region . Coefficients ≥ 0 and ≥ 0 refer to the elasticity of labour and robots supply,
respectively.

5 See Acemoglu and Restrepo (2016) for the general case where this assumption may not hold.
6 For the derivation of these supply conditions, it is assumed that each region can consume only its own production of each

good so that for all ∈ and ∈ , = . AR cover also the case where trade between regions is allowed. While allowing
trade complicates the theoretical exposition as it is required to define specific trade mechanisms and conditions that are in
place, it leads to similar empirical specification and therefore its presentation is omitted here.

 9
These supply equations, together with market clearing conditions for labour and robots are taken into account when firms maximise their profits. Solving for the partial equilibrium, the demand for labour in region is given by: = � (1 − ) − , ∈ where is the price of the output of industry in region . By log differentiating we get = − � − � + . 1 − ∈ ∈ The first term is the displacement effect. Holding prices and output constant, robots displace workers as robots are more efficient in the production process. The second term captures the market expansion and subsequent increase in labour demand due to the fact that automation lowers costs of production (productivity effect I). The third term also incorporates the positive industry-level spillover effects (productivity effect II). As production costs drop and output expands, demand for labour increases in all industries. The empirical specification is based on the general equilibrium predictions form employment and wages which consider the impact of changes in prices and quantities of robots and labour on changes in aggregate prices and output. Solving the model, we conclude to the following main equations that define how industrial robots affect employment and wages: 1 + 1 + = − � + �1 − � � (1) 1 + 1 − 1 + 1 − ∈ ∈ = − � + (1 + ) �1 − � � (2) 1 − 1 − ∈ ∈ where and refer to the share of labour in industry and in region and the share of labour in total output in region , respectively. 3.2 The empirical specification In our empirical analysis, we considered 116 regions which we further disaggregated by gender, age and education to derive the employment rate and wage for each demographic group. With 18 demographic groups (three education and age categories), this resulted in 2,088 possible observations. The use of demographic cells is particularly important for the wage specification since this allows us to isolate the changes in wages which are simply due to changes in the composition of the labour force. For example, an increase in the number of highly educated workers would increase the average wage level mechanically. For employment, we also use the demographic cell structure as our baseline, but we show that our results are robust to a regional structure. According to the equilibrium approach, in which labour force and robots are competitors, aggregate changes in employment and wages depend on average robots’ adoption, measured by the change in a measure of exposure to robots, across NUTS2 regions. This measure is defined as the sum over industries of the penetration of robots in each industry times the baseline employment share of that industry in the labour market (see Section 4 below for a formal definition). 10
Following equation (1), the change in employment rate is estimated using the following equation:

 ∆ ,1995−2007 = 1 + 2 ∆ ,1995−2007 + (3)

where r labels NUTS2 regions and g the demographic group. Similarly, wage growth from equation (2) is estimated
as follows:

 ∆ ,1995−2007 = 1 + 2 ∆ ,1995−2007 + (4)

These baseline regressions are then augmented with a dummy equal to one for regions in Germany, France,
Finland and Sweden, to account for geographical factors that might explain differences between countries in
employment rates and wage developments (results are robust to the use of individual country dummies). In
addition, we also control for demographic factors possibly affecting labour markets (namely: total population,
share of working age population, and share of employed people that completed high school). All characteristics
that we add in equations (2) and (3) are taken in their 1995 level, as in AR, to treat endogeneity issues related to
mechanical correlation and mean reversion, and focus on structural asymmetries across regions.

To control for potential sectoral trends, we further include the share of employment in manufacturing, whereas to
account for other potential competing changing factors in local labour markets we include measures of exposure
to Chinese and United States imports defined above, as well as the baseline extent of routine jobs and offshoring.
This would allow us to separate the impact of automation from that of trade patterns and structural changes in the
economy. Finally, we add growth of ICT capital as a control, to check whether the estimated impact of robots’
adoption is in reality driven by investment in IT, which in turn would be concurrent with automation.

The proposed specification is estimated using Ordinary Least Squares (OLS), clustering standard errors at the
country level to adjust for common group effects. However, the number of countries in our sample is very limited,
which questions the validity of a clustering approach; also given the unbalanced nature of our clusters, there is a
high risk of over-rejecting the null hypotheses (clustering relies on asymptotic theory, and having few clusters
leads to a poor approximation of critical values), thus obtaining confidence intervals that are too narrow and
estimating significant relationships that are not true, as well as ‘overfitting’, ie estimating residuals too close to
zero compared to population errors (Cameron and Miller, 2015).

To correct for these problems, we implement a “wild cluster bootstrapping” procedure developed by Cameron,
Gelbach and Miller (CGM, 2008) 7. In general, bootstrapping methods resample with replacement a data set, and
estimate the parameter of interest, for a number of iterations, each time saving results. At the end, they inspect
the estimated distribution of the parameter, which approximates the true one.

CGM address specifically the few clusters problem and modify the standard resampling with replacement system
by sampling on clusters and multiplying residuals by weights drawn randomly, for each iteration. We use Webb
(2014) uniform 6-point distribution to obtain weights, to be sure to be able to perform 1000 reliable replications 8.
CGM show through Monte Carlo simulations that the above procedure behaves efficiently. Thus, it can allow us to
obtain consistent results about the significance of the estimated coefficients.

However, there are two major threats to the validity of our empirical strategy: (i) potential unobserved trends,
which might affect both robot exposure and labour market outcomes in a region, and (ii) the possibility that
changes in employment and wage levels also affect the take up of robots. For example, we cannot rule out, a priori,
that in areas with rising wages and slowing demographics the incentive to change the input mix and adopt more
robots might be higher in the first place. Therefore, we identify two different sets of instruments for robot exposure.

7 Results are robust to the use of 2-way clustering at both country and NUTS1 macro-regions.
8 In Webb’s simulations, this method outperforms the two-point Rademacher method with less than ten clusters.

 11
Figure 10: Robot density in sample, Denmark, and the UK (robots per 1000 workers)

 4

 3

 2

 1

 0
 1993 1996 1999 2002 2005 2008 2011 2014
 Density sample
 Adjusted density UK and Denmark
 Source: IFR.

One aims to catch the trend in sectoral adoption of robots in similar advanced economies (as in AR), namely: The
United Kingdom and Denmark 9. This strategy allows us to at least estimate effects from general trends, even if
there is still a residual potential source of endogeneity arising from common shocks that affectautomation both
in the UK and Denmark, as well as countries in our sample, which are not captured by our geographical dummies.
As Figure 9 shows, trends in our sample robot density follow closely that of 3.6 times the UK and Denmark,
especially before 2008 10.

The other instrument we use is the country-specific intensity of Employment Protection Legislation (for all
standard contracts, EPL), as collected by the OECD, in its baseline 1990 level or its change between 1985 and
2007 11. Since it is rather complicated to find an exogenous policy shock, strongly correlated with automation,
which is common to all countries of our sample, we revert to this harmonised measure of the labour rigidity policy
stance in each country. Legislation should be in principle only indirectly correlated with (contemporaneous)
market outcomes, and in particular through its specific target, while correlated with adoption of robots, because
it affects incentives to change the input mix. However, a lingering issue remains, related to the direction of the
EPL effect on robot exposure. On one hand, higher rigidity might increase the cost of labour, thus creating
incentives to adopt more robots; on the other, if displacement is more difficult, firms might not be able to adopt
more robots. Nonetheless, under-identification and weak instruments tests strongly support our choice of
instruments, while Hansen J statistics (obtained by partialling out the other regressors) does reject the null
hypothesis of their validity. Finally, to obtain consistent estimates of p-values and standard errors in the IV/2SLS
specifications, we make use of the procedure of Davidson and MacKinnon (DM, 2010), called “wild restricted
efficient bootstrap” (WRE), which extends the wild bootstrap of CGM (2008) to instrumental variables estimators,
in order to assess asymptotic validity of our results. WRE takes into account potential heteroskedasticity of
unknown form, and uses efficient estimates of the reduced form. Simulations in DM (2010) show that it performs
very well, especially with weak instruments. We also utilise the Anderson-Rubin statistics to test the significance
of our coefficients.

9 Results are robust to exposures computed with different combinations of the two countries.
10 The multiplying factor have been chosen to minimise the sum of absolute deviations of sectoral robot densities between

1995 and 2007. Results are robust to variations.
11 Results are broadly robust to different levels and changes.

 12
4 Data and descriptive statistics

In order to analyse the structural impact of robots on regional labour markets, following AR, both the regional and
time aspect of the data structure are crucial. In Europe, territorial units are classified as NUTS regions. To use the
most granular possible macroeconomic perspective that allows us to cover periods from the 1990s – when
developments in robotisation took off – we base our analysis on NUTS2 regions, which divides the EU into 270
territories. Information about robotisation in the European economy is available from the IFR which records the
number of robots sold by global suppliers. Detailed information on employment and wage developments are
derived from micro-data based on the European Community Household Panel (ECHP) and the European Union
Statistics on Income and Living Conditions (EU-SILC). Because of data limitations, our analysis includes six EU
countries (Finland, France, Germany, Italy, Spain and Sweden) and therefore, 116 NUTS2 regions for which we
collect data between 1995 and 2007.

4.1 Exposure to robots

IFR data is based on yearly surveys and covers around 90 per cent of all robots sold globally from 1994 to 2014.
The annual data series has a country-industry 12 structure. Around 30 percent of robots could not be classified
into one of the 18 industries. To fully reflect the evolution of industrial robotisation, unclassified robots are
allocated proportionally to the distribution of classified units. In our analysis, we use a narrow definition of
industrial robots that excludes the so-called ‘dedicated industrial robots’, which are automatically controlled
machines that are designed to perform only a single task.
Given the regional structure of the analysis, the variation of the exposure to robots (number of industrial robots
per 1000 workers) should be identified at the NUTS2 level. We do so by following the approaches of Dauth et al
(2017) and AR, who assume that the distribution of robots within an industry is uniform across all regions within
a country conditional on employment shares in each region-industry. In practice, the regional exposure of robots
in industry j is proportional to the regional employment in that industry 13. To analyse the structural impact of
robots, we are interested in the change of exposure between 1995 and 2007 based on the employment
distribution in 1995. Therefore, the change in number of robots per 1000 workers is defined as follows:

 ,1995 ,2007 ,1995
 ∆ ,1995−2007 = � ×� − � (5)
 ,1995 ,1990 ,1990
 ∈

where J is the full set of industries, , is the number of industrial robots in a given country and industry j
in year t, and , the number of employed individuals in region r and industry j.

4.2 Labour market data
Harmonised labour market data for Europe is usually collected and compiled by the national statistics institutes
and collectively published by Eurostat. Because of the lack of comprehensible regional employment data before
1999, we derived the dependent and other control variables from the micro-data sets LFS as well as ECHP and EU-
SILC for employment and wages respectively 14.

12 Fifteen manufacturing sectors: agriculture, forestry, fishing; mining and quarrying; food and beverages; textiles; wood and

furniture; paper; plastic and chemical products; glass, ceramics, stone, mineral products; basic metals; metal products (non-
automotive); industrial machinery; electrical/electronics; automotive; other vehicles; other manufacturing branches; three
non-manufacturing industries: electricity, gas, water supply; construction; other non-manufacturing branches.
13 Region-industry employment shares are calculated based on Eurostat structural business statistics (SBS).
14 ECHP starts in 1994 but is discontinued in 2001; EU-SILC data is available since 2004.

 13
Employment
In our analysis, we focused on the impact of robots on the regional employment rate, which we define as the
number of individuals who were employed according to the International Labour Organisation definition 15. The
variable is derived from aggregating individual responses in the LFS which provides information about
demographic and labour market characteristics. The limitations of using this database are twofold. First of all,
because of anonymisation standards, the data granularity varies across countries. In particular, Germany only
reports country and NUTS1 level information in 1995 and 2007 respectively 16. Second, NUTS classifications were
subject to changes between 1995 and 2007 and therefore, for some Italian and Finnish regions, employment
rates were adjusted accordingly.
Wages
Similar to employment, we derived the wage variable by aggregating individual information of employed and self-
employed workers based on ECHP in 1995 and EU-SILC in 2007 17. The main dependent variable, gross nominal
hourly wages, was computed based on monthly and annual gross wages from ECHP and EU-SILC respectively.
This raises concerns about measurement error additional to the reporting bias, which is common to survey-based
derived income statistics. Therefore, we derived an additional wage rate from the micro data to test for robust
results. Furthermore, because of anonymisation, wages are reported mainly at NUTS1 level and cannot be further
disaggregated in a comprehensive manner.

4.3 Control variables
Exposure to information and communication technology (ICT) capital
The ongoing ICT revolution might have facilitated the use of advanced equipment which carries out tasks
previously performed by workers, or at least enables more efficient completion of tasks. As with robots, this might
have led to the replacement of specific workers, but might also be complementary to an individual’s productivity,
resulting in an ambiguous effect on employment and wages.
To control for the significant increase in ICT equipment and its impact on specific occupations, we use data on
the stock of computer hardware and telecommunication equipment, which is available from EU-KLEMS at the
country-industry level. In order to derive the exposure of workers to ICT capital at the regional level, we used the
same approach as for the exposure to robots and allocated the country-industry specific capital stock in a given
year based on region-industry 1995 employment shares. As a result, the change in the real stock in ICT fixed
capital (in million 2010 euros 18) per 1000 workers is defined as follows:

 ,1995 ,2007 ,1995
 ∆ ,1995−2007 = � ×� − � (6)
 ,1995 ,1990 ,1990
 ∈

Exposure to Chinese and US imports
Along with technological change, global competition has been found to be a significant driver of labour force
dynamics in the last decades. In a recent paper, Malgouyres (2017), for example, finds that around 13 percent of
the reduction in French manufacturing employment can be attributed to Chinese competition. To control for this
factor, we calculated the exposure to US and Chinese imports based on bilateral country/industry data from the

15 Employed persons comprise persons who are older than 15 years and worked for at least one hour during the reference
week or who were not at work during the reference week but had a job or business from which they were temporarily absent.
This includes employees, self-employed and family workers.
16 We interpolate German regional employment rate in 1995 using LFS 1995 country level data, but regional variation from

Eurostat regional statistics in 1999. Similarly, 2007 regional employment rates are computed based on 2007 Eurostat
regional variation.
17 If data is unavailable in a given year, we take the closest year possible; ECHP: Finland 1996, Sweden 1997; EU-SILC:

Germany 2006.
18 Swedish kronas have been converted using the 2010 ECB reference exchange rate.

 14
UN Comtrade database. The calculations follow the definition of the “value share measure of import penetration”
in Bloom, Draca and Van Reenen (2016) as the share of Chinese/US imports of total Chinese/US imports. We
derive the exposure to imports from competing countries in a given region analogous to the exposure to robots
and allocate imports based on region-industry employment shares – see equation (5).
Routinisation and offshoring index
The demand for industrial robots certainly depends on the economic structure of a region, especially the
susceptibility of certain occupations to replacement either by machines or workers in other countries through
offshoring. Therefore, we developed a regional routinisation and offshoring index derived from ECHP occupation
data and occupation specific indicators derived by Goos, Manning and Salomons (2014, p.2512). The
routinisation indicator quantifies the degree of routine tasks within an occupation and the ‘offshorability’ indicator
is based on actual offshoring events registered by European companies – both indices are normalised to have a
zero mean and unit standard deviation. Based on these indicators and the occupational distribution in each region
we derive the (weighted) regional indices.
Other controls
To factor regional demographic characteristics, we included the population sizes, working age populations and
the share of medium and highly educated people in our regression analysis, with data derived from the LFS
database. Furthermore, the regional share of workers in the manufacturing sector factors in the general decline in
employment in the industry sector in Europe such as automotive, textiles or metal processing.

4.4 Data description
Table 1 presents descriptive statistics for the variables used in our analysis. In 1995, on average 45 percent of
the population older than 15 was employed. The employment rate increased significantly until 2007 with the
nominator increasing more than the denominator. As shown in Figure 8, employment notably decreased for craft
and trade workers and skilled agriculture workers, with the former category significantly affected by global factors
and technological developments such as use of industrial robots. Therefore, the two sectors most affected by
reduced employment are manufacturing and agriculture. In contrast, employment rates increased strongest for
professionals and technicians.
The average nominal gross hourly wage for the six countries in our sample increased from €9.25 to €12.11
between 1995 and 2007. As outlined in section 2, wages increased significantly for high-skilled professions, but
wage gains for medium and low-skilled workers do not point towards a further deepening of wage polarisation in
the countries of study.
While the number of robots per thousand workers was relatively low in 1995 (1.6), it increased significantly until
2007 when, on average, 4.2 industrial robots were installed per thousand workers. This shows that although
industrial robots were already in use in 1995, our analysis covers the period during which industries underwent
major transformations because of the installation of industrial robots. It is worth noting that our sample constantly
has a share above 85 percent for the total number in the EU28. Figure 11 shows that this share was particularly
high in the 1990s but started decreasing afterwards as other European countries began to introduce robots in
their production chains.

 Figure 11: Number of robots (units)

 15
350000

 300000

 250000

 200000

 150000

 100000

 50000

 0
 1993 1995 1997 1999 2001 2003 2005 2007
 EU28 Sample
 Source: IFR.

Furthermore, the evolution of ICT capital follows a similar trend to robots: in 1995, 1000 workers were using a
stock of computer hardware worth €1.35 million; by 2007 this number had more than doubled (Figure A1 in Annex
1). It is worth noting that the diffusion of technology seems to be greatly heterogenous as the variation of this
change is substantial in different regions. In Figure A2 in Annex 1, it can also be seen that the ICT capital-labour
ration is also heterogenous across sectors and is strongest in non-manufacturing sectors.
Additionally, we can observe that the economic structure of the NUTS2 regions in our sample is very diverse. This
can be seen by the high deviation from the mean in the routinisation and offshoring index. Furthermore, we can
identify big variations in regional education. In 1995 on average 52 percent of the population older than 15 had
at least upper secondary education, but with a standard deviation of 0.2, the differences between regions are
substantial.

 Table 1: Descriptive statistics

 Standard Change Change
 # Obs. Mean deviation Min Max (mean) (SD)

 Dependent variables
 Employment rate 1) 111 0.480 0.080 0.319 0.686 0.046 0.048
 Employment rate (15-64) 111 0.583 0.091 0.382 0.768 0.077 0.053
 Gross nominal hourly wages 1780 9.469 4.900 0.054 35.707 3.647 4.601
 Gross nominal weekly wages 1780 349.955 183.948 2.143 1328.583 98.059 157.321

 Variables of interest
 Industrial robots per 1000 workers 113 1.562 1.502 0.000 7.236 3.252 2.828
 IT capital per 1000 workers 2) 92 1.346 0.372 0.402 2.224 1.770 1.603

 Control variables
 Population (in million) 107 2.227 1.829 0.025 10.900
 working age population (share) 104 0.817 0.048 0.679 0.894
 Medium and high education (share) 111 0.517 0.193 0.198 0.746
 Manufacturing employment (share) 108 0.209 0.072 0.043 0.365
 Routinization Index 101 0.189 0.134 -0.077 0.512
 Offshoring Index 101 0.058 0.084 -0.126 0.294
 ∆ exposure to Chinese imports 92 0.00009 0.00007 0.00000 0.00041
 ∆ exposure to US imports 92 -0.00005 0.00009 -0.00066 0.00008

 Note: values are presented at 1995 level; changes between 1995 and 2007, wage data based on demographic cell structure
 1) employed individuals divided by population older than 15 2) in milllion Euros

 16
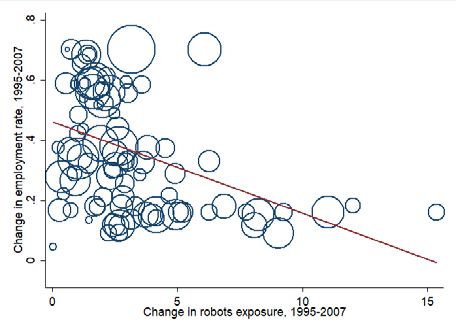
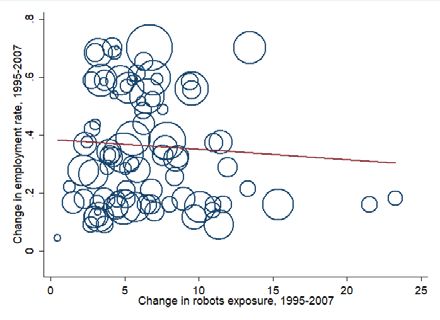
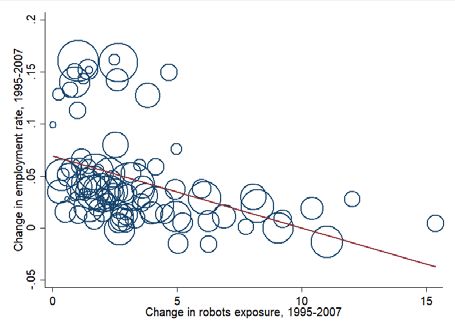
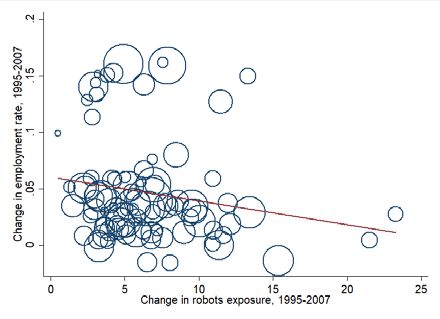
5 Results

Figure 12 and Figure 13 point to a general negative correlation between changes in exposure to robots and the
employment rate, while the relationship appears to be again negative but weaker in the case of wages. This seems
to hold for the whole economy and a subsample of its ‘Industry’ subcomponents (namely, the mining,
manufacturing and utilities sectors).
 Figure 12a: Change in exposure to robots and in Figure 12b: Change in exposure to robots and in
 employment rate – Total economy employment rate – Industry
 (Change in percentage points) (Change in percentage points)

 Source: Calculations based on IFR, Eurostat, EU Klems. Source: Estimation based on sample as described in Section 2.4.
 Note: Circles represent relative size (working age population) of each of the Note: Circles represent relative size (working age population) each of the
 NUTS2 regions considered. NUTS2 regions considered.

 Figure 13a: Change in exposure to robots and in log Figure 13b: Change in exposure to robots and in log
 hourly wages – Total economy hourly wages – Industry
 (Change in percentage points) (Change in percentage points)

 Source: Calculations based on IFR, Eurostat, EU Klems. Source: Estimation based on sample as described in Section 2.4.
 Note: Circles represent relative size (working age population) of each of the Note: Circles represent relative size (working age population) of each of
 NUTS2 regions considered. the NUTS2 regions considered.

While correlations provide suggestive evidence, it is necessary to follow a formal estimation approach as
described in our empirical specification, in order to identify the impact of the change in exposure to robots on the
employment rate and on wages.

 17
5.1 Employment

Table 2 presents the estimated impact of exposure to robots on the employment rate, for regional demographic
groups. The baseline results (columns 1-6) refer to specification (3), augmented with the controls as discussed
in section 3, while the IV results refer to 2 stages least squares (2SLS) where the instruments described above
are used (columns 7-8). In the baseline specifications, we see that the negative significant coefficient of
exposure to robots is rather consistent across the different specifications. The impact of one additional robot per
thousand workers reduces employment rate by 0.16-0.31 percentage points. When instrumenting exposure to
robots in the full specification, its impact on employment remains significantly negative. One additional robot per
thousand workers reduces employment rate by 0.16-0.20 percentage points. Hence, there is a statistically
significant displacement effect from the robotisation of industries in our sample, which exceeds the associated
productivity effects.

When comparing this result to the analysis of AR, we can infer that the impact of robots on employment is more
negative in the US than in Europe. While AR find that one additional robot reduces the employment-to-population
ratio by about 0.37 percentage points (with lowest bound 0.18), our results are located at the lower bound of (or
are even lower than) this suggested range. While this finding suggests that further research on the reasons of this
difference between EU and US is welcome, one potential explanation could be that in the more liberalised labour
market in the US makes it easier for firms to fire workers and therefore staff turnover might be higher after a new
robot is installed. In Europe, however, employers might keep workers who conduct different tasks. Furthermore,
more active labour market policies in Europe could cushion the impact of industrial robots by reducing the risk
that people slip into inactivity or long-term unemployment.

Interestingly, the change in exposure to ICT capital has a significant positive impact on the employment rate,
suggesting that different technologies have different impacts on employment (see Table 3). This positive and
significant impact is particularly evident for the IV specifications. ICT growth and developments in software
industries and machine learning techniques have increased opportunities for online transactions, greatly
expanding the e-commerce market19.

Focusing on the full specification, Table A1 in Annex 3 present the results for the different regions of our sample,
without the use of demographic groups (columns 1-2) and restricting the exposure of robots to three industry
sectors (mining, manufacturing and utilities, columns 3-4). Table A2 estimates the impact of the change in robot
exposure for different cohorts of the labour force (the employment rate of those between 15 and 64 years old,
columns 1-2), and for growth in employment (columns 3-4). Finally, Table A3 shows results when using country
dummies instead of the north variable, and with a different set of instruments. This series of robustness checks
confirm the importance of automation in explaining part of the labour market outcomes between 1995 and 2007.
In particular, it appears that the impact on Industry is less than on the whole economy, similarly to the
employment rate of people between 15 and 64 years, while we do not find significant results for the growth of
employment alone.

19 Available evidence reported by Duch-Brown and Martens (2016) suggest that the e-commerce market in the EU grows at

rate of 22 percent.

 18
Table 2 : Impact on employment for Total Economy
 (1) (2) (3) (4) (5) (6) (7) (8)
 Employment Employment Employment Employment Employment Employment Employment rate Employment rate
 rate rate rate rate rate rate

Change in exposure to robots (1995-2007) -0.0045 -0.0031*** -0.0016*** -0.0016*** -0.0027*** -0.0026*** -0.0016*** -0.0020*
 (0.0039) (0.0010) (0.0005) (0.0005) (0.0009) -0.0007 [-0.0018, -0.0011] [-0.0104, -0.0002]
North dummy V V V V V V V
Demographics V V V V V V
Broad manufacturing share V V V V V
Routinization, offshoring, import exposure V V V V
Change in exposure to IT capital (1995-2007) V V V

 UK and DK robot UK and DK robot exposure,
Instruments - - - - - -
 exposure, EPL in 1990 ∆EPL 1985-2007
Observations 1,382 1,382 1,308 1,292 1,129 1,129 1,129 1,129
R-squared 0.1819 0.2334 0.3389 0.3461 0.3551 0.2008 0.1999 0.2005
Wild cluster bootstrapped standard errors in parentheses; WRE 90% confidence intervals in square brackets. Data in demografic cells.
*** p
We tested this claim by dividing the educational level of workers into three categories: (i) L, which corresponds to
lower secondary education; (ii) M, which includes individuals who obtained at least upper secondary education;
and (iii) H, which denotes tertiary education.
We find results that are in line with the routinisation hypothesis. Estimations based on 2SLS show that this
negative impact for medium-educated people is robust (Figure 14b). In terms of the employment structure, one
can observe that regions with high exposure to robots are associated with a smaller increase in the share of highly
educated people (Figure A3 in Annex 2). This is an interesting observation that might be worth further
investigation, especially for regions where the economic structure has been affected by global competition and
technological change. The non-significant impact on low-educated workers may be because they carry out
different tasks (often manual and cognitive) which are not easily replaceable by industrial robots. Furthermore,
on average, the cost of low-skilled workers is lower compared to their more educated counterparts and therefore,
they might be less likely to be substituted by capital.

 Figure 14a: Employment effects of exposure to robots Figure 14b: Employment effects of exposure to
 by age group robots by education group
 (Change in employment rate from 1 more robot per 1000 (Change in employment rate from 1 more robot per 1000
 workers in the economy, in p.p.) workers in the economy, in p.p.)

 1.00 0.75

 0.50
 0.50
 0.25

 0.00 0.00

 -0.25
 -0.50
 -0.50
 -1.00
 -0.75

 -1.50 -1.00
 15-24 25-54 >54 L M H

 Note: Estimates based on full specification and 2SLS; WRE 90% confidence Note: Estimates based on full specification and 2SLS; WRE 90%
 intervals confidence intervals.

We find a negative and statistically significant impact of robots on the employment rate in our 2SLS
regression, using the exposure of robots in industry (i.e., in the mining, manufacturing, and utilities
sectors; Table A1 in Annex 3). Figure 15a plots the predicted change in employment rate, following the
observed average sample change in robot exposure in the total economy and industry (3.25 and 6.44,
respectively), which ranges between -0.57 and -0.37 (for total economy), and between -1.35 and -0.51
(for industry) percentage points. However, our 2SLS estimations point to no significant impact at a 90
percent confidence level in various other sectors except wholesale and retail (Figure 15b). So, we do not
find a negative impact of robots on employment rate in manufacturing sector as reported by AR and
Dauth et al (2017). In addition, we also do not find the positive impact on the other sectors that is
reported by Dauth et al (2017) which led them to conclude that robots do not have a significant impact
on the aggregate employment.

However, robots may have counterbalancing effects for employment within a sector. In particular,
sectors are composed by workers employed in different occupations, which in turn are affected
differently by automation. By using our main set of IVs in Figure 16 we find a significant negative impact

 20
You can also read