The U.S. household furniture industry: Status and opportunities
←
→
Page content transcription
If your browser does not render page correctly, please read the page content below
The U.S. household furniture
industry: Status and opportunities
Urs Buehlmann
Al Schuler'
Abstract
Over the past two decades, large sections of the domestic residential upholstered and non upholstered furniture industry have
relocated manufacturing operations to offshore countries with lower production costs. As a consequence, the U.S. market share
of imported, nonupholstered wood household furniture has risen from 19 percent in 1992 to 64 percent in 2008 and imported,
upholstered household furniture rose from 5 to 28 percent over the same period. While the U.S. furniture industry has struggled
over the last two decades, current economic developments may provide the industry with an opportunity to alter its' fortunes as
circumstantial evidence exist that some of the competitive advantages of offshore producers are weakening. For example,
production costs in offshore manufacturing locations and transportation costs are increasing, the value of the U.S. Dollar
is diminishing against trade partners' currencies, and the public perception on trade is growing less favorable. Also, some
observers indicate that mass customized and green furniture will offer advantages for domestic furniture manufacturers.
The authors argue that these ongoing changes in the global economy may have created an opportunity for domestic manu-
facturers to strengthen their competitive position and regain some of the losses incurred over the past two decades.
Globally, the United States remains the largest, single shown in Figure 1 have continued into 2009. Annualized
uniform market with no restrictions on interstate commerce single-family housing starts in May 2009 fell to 401.000.
in the world. Despite recent rhetoric of domestic protec- a 41 percent drop compared to May 2008 (NAHB 2009).
tionism (Herbst 2009), global trade rules (WTO 2008) have Housing is a critical industry segment to the U.S. economy
removed significant trade barriers over the past several de- and to the forest products industry in particular since housing
cades. Also, comparative cost advantages and, until recently, accounts for 20 percent of U.S. economic activity (4 9/o to 5%
favorable exchange rates, have made the United States the directly and an estimated 15% indirectly; Joint Center for
leading net importer of goods and services for the last 37 Housing Studies 2002) and approximately 70 percent of
years. In 2006, the United States' trade deficit reached a structural lumber and panel product sales (Schuler and Adair
record $753 billion (U.S. Census Bureau 2009a) while the 2003). The interdependence between housing activity and
U.S. currency has reached historical lows. Last year. the furniture sales is less clear-cut; however, there is general
U.S. Dollar reached parity to the Swiss Franc for the first agreement that household furniture sales are derived primar-
time ever and fell below €1.56 (NZZ 2008). The U.S. Dollar ily from new housing and remodeling activity (Majumdar
depreciation combined with a general sense that a sizeable, 2004, AP 2007). Interestingly, in the current economic cycle,
sustainable recovery of the U.S. Dollar will not happen soon furniture markets slowed before the peak of the housing
is expected to lead to adjustments in global trade patterns market in 2006, putting further pressure on the remaining
(Economist 2008). In fact, prior to the global economic slow- domestic household furniture manufacturers (Scheffer and
down, U.S. exports in January 2008 were up almost 17 percent Payne 2008).
over exports a year earlier (Aeppel and Slater 2008).
While U.S. manufacturers are gaining some breathing room
The authors are, respectively. Associate Professor, Dept. of
from the currency adjustments, the imploding U.S. housing Wood Sci. and Forest Products, Virginia Tech, Blacksburg, Vir-
market and the financial market turmoil presents formidable ginia (buehlmann@:gmai l.coni); and Research Forester, USDA
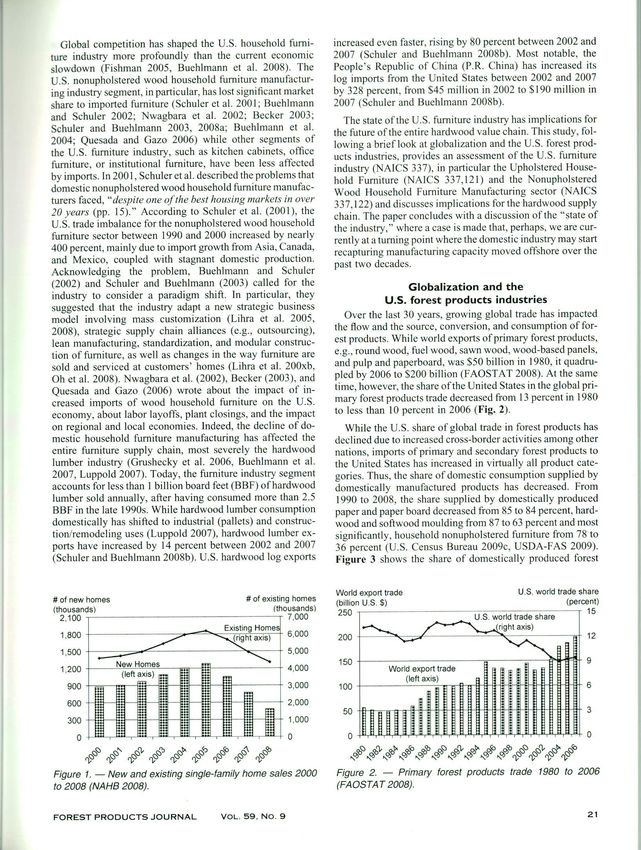
challenges to the nation's economy (Greenspan 2008). As Forest Scrv., Princeton. West Virginia (aschulertfs.fed.us ). This
shown in Figure 1, new single-family housing sales in paper was received for publication in April 2009. Article No.
2008 fell to 485,000 from their peak in 2005 (1,283,000. 10614.
Forest Products Society Member.
—62%) and existing home sales fell from 6,180,000 in ©Forcst Products Society 2009.
2005 to 4,350,000 in 2008 (-30%, NAHB 2009). The trends Forest Prod. J. 59(9):20 -28.
20 SEPTEMBER 2009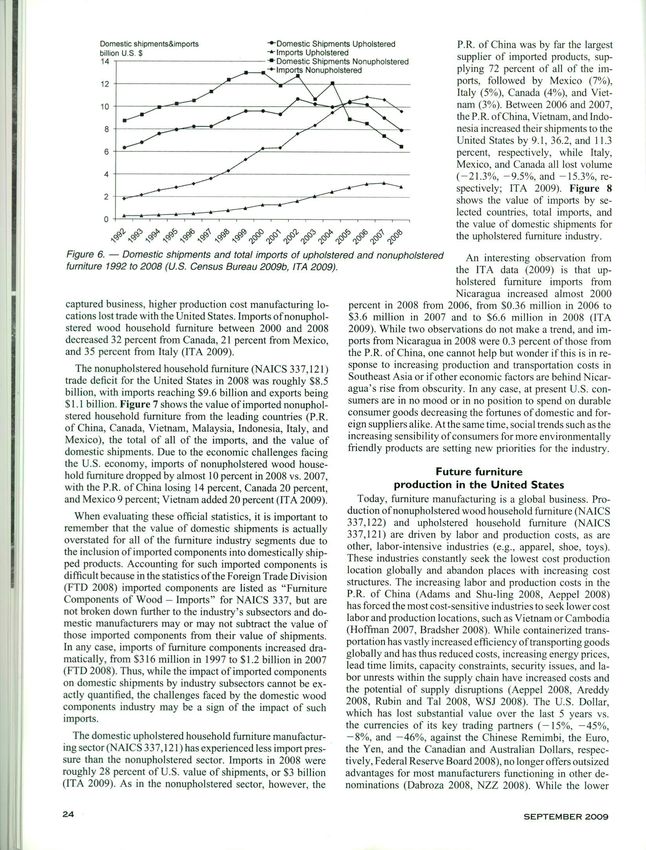
Global competition has shaped the U.S. household furni-            increased even faster, rising by 80 percent between 2002 and
ture industry more profoundly than the current economic              2007 (Schuler and Buehlmann 2008b). Most notable, the
slowdown (Fishman 2005, Buehlmann et al. 2008). The                  People's Republic of China (P.R. China) has increased its
U.S. nonupholstered wood household furniture manufactur-             log imports from the United States between 2002 and 2007
ing industry segment, in particular, has lost significant market     by 328 percent, from $45 million in 2002 to $190 million in
share to imported furniture (Schuler et al. 2001; Buehlmann          2007 (Schuler and Buehlrnann 2008b).
and Schuler 2002; Nwagbara et al. 2002 Becker 2003;                    The state of the U.S. furniture industry has implications for
Schuler and Buehlniann 2003, 2008a; Buehlmann et at.                 the future of the entire hardwood value chain. This study, fol-
2004; Quesada and Gazo 2006) while other segments of                 lowing a brief look at globalization and the U.S. forest prod-
the U.S. furniture industry, such as kitchen cabinets, office        ucts industries, provides an assessment of the U.S. furniture
furniture, or institutional furniture, have been less affected       industry (NAICS 337), in particular the Upholstered House-
by imports. In 2001, Schuler et al. described the problems that      hold Furniture (NAICS 337,121) and the Nonuphoistered
domestic nonupholstered wood household furniture manufac-            Wood Household Furniture Manufacturing sector (NAICS
turers faced. "despite one ofthe best housing markets in over        337,122) and discusses implications for the hardwood supply
20 years (pp. 15)." According to Schuler et al. (2001), the          chain. The paper concludes with a discussion of the "state of
U.S. trade imbalance for the nonupholstered wood household           the industry." where a case is made that, perhaps, we are cur-
furniture sector between 1990 and 2000 increased by nearly           rently at a turning point where the domestic industry may start
400 percent, mainly due to import growth from Asia, Canada,          recapturing manufacturing capacity moved offshore over the
and Mexico, coupled with stagnant domestic production.               past two decades.
Acknowledging the problem, Buehlmann and Schuler
(2002) and Schuler and Buehlmann (2003) called for the                                Globalization and the
industry to consider a paradigm shift. In particular, they                       U.S. forest products industries
suggested that the industry adapt a new strategic business
model involving mass customization (Lihra et al. 2005,                 Over the last 30 years, growing global trade has impacted
2008), strategic supply chain alliances (e.g., outsourcing),         the flow and the source, conversion, and consumption of for-
lean manufacturing, standardization, and modular construc-           est products. While world exports of primary forest products.
tion of furniture, as well as changes in the way furniture are       e.g., round wood, fuel wood, sawn wood, wood-based panels,
sold and serviced at customers' homes (Lihra et al. 200xh.           and pulp and paperboard, was $50 billion in 1980, it quadru-
Oh et al. 2008). Nwagbara et al. (2002), Becker (2003), and          pled by 2006 to S200 billion (FAOSTAT 2008). At the same
Quesada and Gazo (2006) wrote about the impact of in-                time, however, the share of the United States in the global pri-
creased imports of wood household furniture on the U.S.              mary forest products trade decreased from 13 percent in 1980
economy, about labor layoffs, plant closings, and the impact         to less than 10 percent in 2006 (Fig. 2).
on regional and local economies. Indeed, the decline of do-             While the U.S. share of global trade in forest products has
mestic household furniture manufacturing has affected the            declined due to increased cross-border activities among other
entire furniture supply chain, most severely the hardwood            nations, imports of primary and secondary forest products to
lumber industry (Grushecky et al. 2006, Buehlmann et al.             the United States has increased in virtually all product cate-
2007, Luppold 2007). Today, the furniture industry segment           gories. Thus, the share of domestic consumption supplied by
accounts for less than 1 billion board feet (BBF) of hardwood        domestically manufactured products has decreased. From
lumber sold annually, after having consumed more than 2.5             1990 to 2008, the share supplied by domestically produced
BBF in the late 1990s. While hardwood lumber consumption             paper and paper board decreased from 85 to 84 percent, hard-
domestically has shifted to industrial (pallets) and construc-       wood and softwood moulding from 87 to 63 percent and most
tion/remodeling uses (Luppold 2007), hardwood lumber ex-             significantly, household nonupholstered furniture from 78 to
ports have increased by 14 percent between 2002 and 2007             36 percent (U.S. Census Bureau 2009c, USDA-FAS 2009).
(Schuler and Buehlmann 2008b). U.S. hardwood log exports             Figure 3 shows the share of domestically produced forest

                                                                     World export trade                   U.S. world trade share
# of new homes                                 # of existing homes   (billion U.S. $)                                   (percent)
(thousands)                                            (thousands)    250 r- ....-__.._ ....                              T 15
  2,100                                                     7,000            I               U.S. world trade share        I
                                                                                        -.-.       (ri9htaxls)4 12
  1,800                                                   6,000       200
  1,500                                                   5,000
                                                                      150
  1,200                                                   4,000                  World export trade
                                                                            (left axis)
    900                                                   3,000       100
    600                                                   2,000
                                                                       50
    300                                                   1,000

Figure 1. - New and existing single-family home sales 2000           Figure 2. - Primary forest products trade 1980 to 2006
to 2008 (NAHB 2008).                                                 (FAOSTAT 2008).

FOREST PRODUCTS JOURNAL                  VOL. 59. NO.9                                                                            21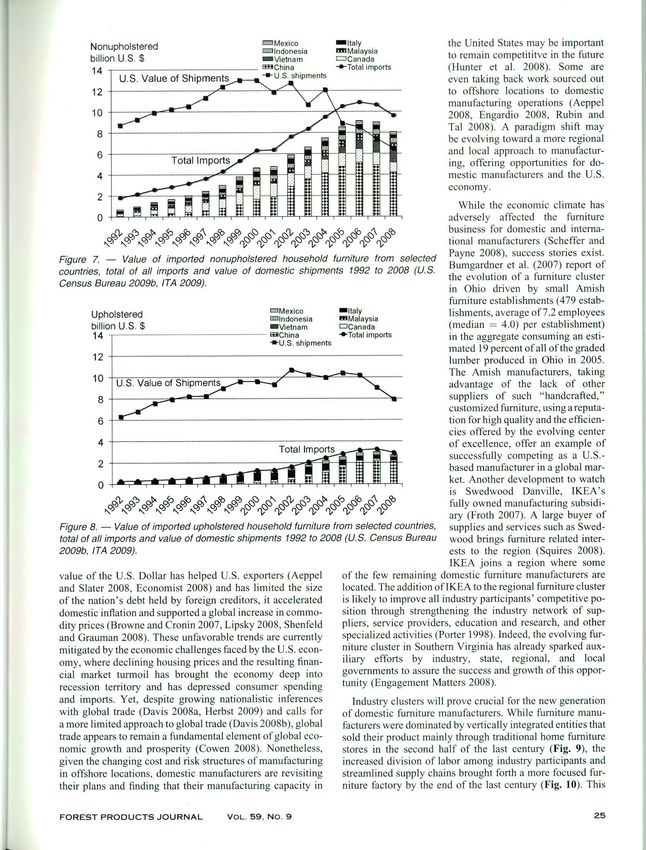
products for 1990 and 2008 (data for flooring and mouldings        goods as a way to grow their economies and to produce
     are for 1990 and 2006).                                            needed by-products for their industries (wood composites,
        The demise of U.S. household furniture manufacturing has        paper, energy, and others). Figure 4 shows U.S. hardwood
     greatly affected the hardwood lumber industry. While furni-        log and lumber exports to major trade partners from 1992 to
     ture manufacturing was by far the largest single user of graded    2007.
     hardwood lumber until 1997, it had fallen behind kitchen cab-        Vietnam, which entered into a formal trade relationship
     inets, flooring, millwork, and exports by 2005 (Luppold 2007,     with the United States in December 2001 (CIA 2008), seems
     Huber 2008). Graded hardwood lumber production in the             to bring a new dimension to the future of global furniture
     United States fell from 7.5 BBF in 1999 to 6.4 BBF in             manufacturing and trade. While furniture imports to the
     2007 (-15%) and is below 3 BBF at the present time. In            United States from Vietnam were only $1 million in 2002,
     the past, individual firms could rely on domestic sectors such    they have reached $779 million in 2006, an astounding
     as kitchen cabinet, millwork, or flooring to replace some of      800 percent increase in 5 years (Schuler and Buehlmann
    the decreasing hardwood lumber demand by the furniture             2008a). Entire furniture manufacturing facilities dedicated
     sector (Grushecky et al. 2006, Buehlmann et al. 2007). Today,     to the U.S. market have been moved to Vietnam (Stickley,
    however, these sectors are struggling and exports have also        Inc. 2005) and industry experts talk of Vietnam as the "next
    decreased.                                                         China" (Hoffman 2007). This shift is supported by increasing
       Exports of hardwood lumber and logs from the United             labor costs in the P.R. of China (Adams and Shu-ling 2008)
     States have increased dramatically over the past decades. Ex-     and a currency exchange rate that becomes less favorable for
    ports of graded hardwood lumber increased by a thousand per-       Chinese exporters (Dabroza 2008). But, even though Vietnam
    cent between 1963 and 2005 and hit 1.3 BBF or 19 percent of        offers opportunities for U.S. wood products manufacturers,
    total graded hardwood lumber consumed in 2005 (Luppold             the country's size will limit its ability to replace the P.R.
    2007). As the quantity of hardwood material exported in-           of China as a manufacturing powerhouse since Vietnam's la-
    creased, the countries of landing shifted according to the         bor pool is less than one-tenth the size of the Chinese
    market success of national wood products (furniture) manu-         (Bradsher 2008). Even so, as the following discussion shows,
    facturers. While the P.R. of China ranked only 31st in hard-       the comparative advantages offered by these Southeast-Asian
    wood lumber imports from the United States in 1995 ($5.9           nations have had a profound impact on the U.S. household
    million), it ranked second in 2007 ($222.2 million; USDA-          furniture industry.
    FAS 2009). Taiwan, moving its economy away from wood
    products (furniture) manufacturing, dropped from being the                        Current furniture and related
    number 5 importer of U.S. hardwood lumber in 1995                       product manufacturing in the United States
    ($70.5 million) to number 20 in 2007 ($15.2 million). Viet-            While the nonupholstered wood household furniture sector
    nam, which did not import U.S. hardwood lumber in 1995,             (NAICS 337,122) has been most severely impacted by the
    was ranked number 8 in 2007 ($65.2 million). U.S. hardwood          surge of imported furniture over the past decades (imports
    log exports to countries such as the P.R. of China and Vietnam     rising from 19% in 1992 to 64% marketshare in 2008; U.S.
    have seen even more pronounced growth. The P.R. of China           Census Bureau 2009c, ITA 2009), other members of the fur-
    imported $190 million worth of hardwood logs from the              niture and related product manufacturing (NAICS 337) sector
    United States in 2007, up from $45 million in 2002                 have been better able to maintain their competitive position
    (+326%; USDA-FAS 2009), Vietnam imported $28 million               (Schuler and Buehlmann 2003). From 1992 to 2008, imports
    in 2007, up 490 percent from 2002 ($4.7 million; USDA-FAS          of upholstered household furniture (NAICS 337,121) grew
    2009). This data supports observations that these growing          from 5 to 28 percent, office furniture (NAICS 337,211) from
    nations try to increase the value-added content of exported        6 to 21 percent, and wood kitchen cabinet and countertop
                                                                       (NAICS 337,110) from 2 to 4 percent, respectively. Figure
                                                                       5 shows the increase of market share of imported furniture to
    100%                                                               the United States from 1992 to 2008.
                                                                          While there have been few scientific studies to explain the
     80%                                                               difference in performance of these similar, yet different, in-
                                                                       dustries, it is generally believed that the U.S. nonupholstered
     60%
                                                                       wood household furniture industry (NAICS 337,122) is the
     40%                                                               most conservative and, in many aspects, the least innovative
                                                                       of all of the industries involved in the furniture and related
     20%                                                               manufacturing sector (NAICS 337). But, other factors includ-
                                                                       ing domestic competition (determining margins and thus level
      0%                                                               of investments in plant, people and products), complexity of
                                                                       product and production, transportation costs, and wholesale
                                                           \           and retail structures have also contributed to the varying losses
                                                                       of market share of U.S. furniture manufacturing sectors.
            ,                                                             In 2006, U.S. furniture and related products manufacturers
                   so
                                                                       (NAICS 337) shipped $81 billion worth of products from their
    Figure 3. - Share of domestic markets supplied by domestic         domestic manufacturing plants, up from $64 billions in 1997
    production, 1990 and 2008. (Data for flooring and mouldings        (+26%, U.S. Census Bureau 2009b). In 2005, there were
    are for 1990 to 2006; shipments U.S. Census Bureau 2009c,          20,722 U.S. establishments recorded under the NAICS 337
    imports and exports USDA -FA 5 2009).                              manufacturing sector, about the same number as in 1997

    22                                                                                                            SEPTEMBER 2009

j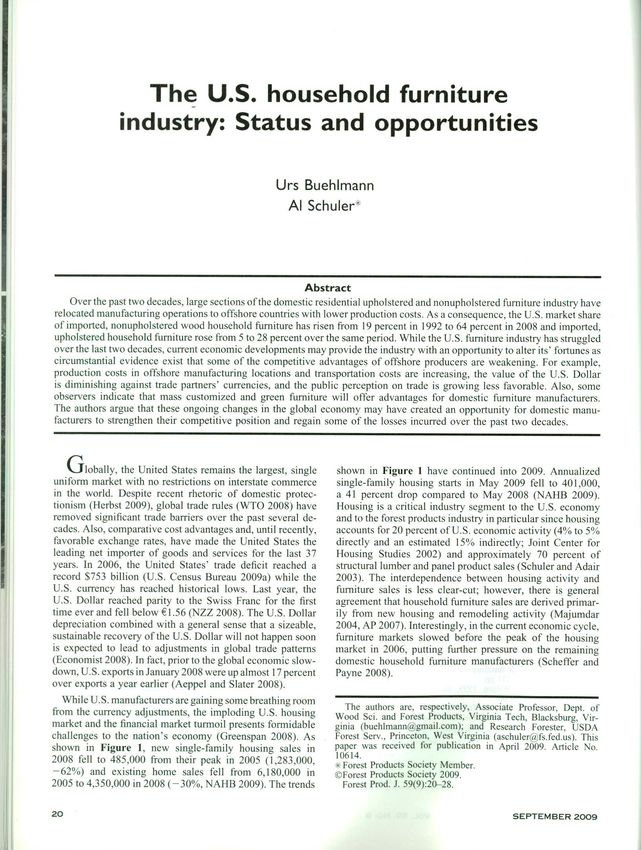
U.S. hw log&Iumber exports      VIETNAM      IMTAIWAN       10SPAIN                            Upholstered and
        (million U.S $)                3MEXICO       MITALY         DHONG KONG                     nonupholstered wood
        2500
                                                                                                     household furniture
                                                                                                         manufacturing
        2000                                                                                        in the United States
                                                                                                Both, the U.S. Upholstered (NAICS
         1500                                                                                 337,121) and the Nonupholstered
                                                                                              (NAICS 337,122) Wood Household
         1000                                                                                 Furniture Manufacturing industry
                                                                                              sectors have recently seen a surge
                                                                                              in imported products taking over
          500                                                                                 market share (Fig. 6) The Uphol-
                                                                                              stered Household sector, however,
                                                                                              has been able to limit the success
                       1992           1997             2002            2007                   of imported products more ef-
 Figure 4. - Hardwood log and lumber exports from the United States to various countries fectively than did the Nonuphol-
                                                                                              stered Wood Household Furniture
 1992 to 2007 (USDA -FA S 2009).
                                                                                              Manufacturing sector. Imports of
                                                                                              Nonupholstered Wood Household
        Import market share                      --Nonupholstered  Upholstered                Furniture surged from 19 percent
        (percent)                                                                             of furniture shipped domestically
         70
                                                                                              in 1992 to 64 percent in 2008 while
         60                                                                                   the domestic Upholstered House-
                                                                                              hold Furniture manufacturers saw
         50                                                                                   the  share of imports rising from
                                                                                              5 percent in 1992 to 28 percent in
        40                                                                                    2008 (U.S. Census Bureau 2009c,
                                                                                              ITA 2009). While different theories
         30                                                                                   exist to explain this asymmetric de-
                                                                                              velopment, a primary reason can be
         20                                                                                   seen in the way these pieces are
                                                                                              sold. Nonupholstered wood house-
         10                                                                                   hold furniture is mostly sold as a
                                                                                              mass-produced product with a set
                                                                                              of options, all of which are held in
                                                                       Q A                    stock by the manufacturer, whole-
                                                                    IV e 10
                                                                                              saler, or retailer. Upholstered house-
 Figure 5. - U. S. market share of imports 1992 to 2008 (U. S. Census Bureau 2009c, ITA hold furniture, conversely, typically
2009 [consumption = shipments + imports - exports; import share - imports! allows customers to select the type
consumption]). These market share computations are conservative since some                    and color of the fabric used, espe-
imported components and OEM furniture is included in domestic shipments. This cially for upholstered items in the
 observation applies to all numbers regarding the value of domestic shipments upper price categories. Thus, such
 throughout this manuscript.                                                                  furniture cannot bet, roduced ahead
                                                                                              but essentially are mass customized
(20,738). The number of employees for the sector decreased         pieces that are assembled from prefabricated stock, after the
from 603,668 to 520,129 (-14%) between 1997 and 2006.              customer has placed an order (Lihra et al. 2008). Thus, lead-
While most furniture sectors lost employees between 1997           time becomes critical and since speedy air transport of the
and 2006 (nonupholstered wood household furniture —44%;            product from an offshore location to the United States is too
upholstered wood household furniture - 12%; office furni-          expensive, domestic manufacturers are in a more favorable
ture including fixtures —22%), the wood kitchen cabinet            position to defend their business.
and countertop manufacturing sector added almost 50,000               Today, nonuphoistered wood household furniture manu-
jobs (+46%) and employed 145,013 individuals in 2006.              facturing (NAICS 337,122) is a global business that is con-
The strong development of the wood kitchen cabinet and             tinuously moving to the lowest production cost location.
countertop manufacturing sector until 2007 is based on a mul-      While the P.R. of China conducted less than $70 million of
titude of factors, including the increasing importance of the      business in nonupholstered wood household furniture with
kitchen in today's household, strong housing markets until         the United States in 1992, the volume had grown to almost
2006, innovative products and services, and considerable cap-      $4.5 billion in 2008, or to 44 percent of all imported nonuphol-
ital spending by the industry. As with all sectors related to      stered furniture (ITA 2009). Vietnam is another "success"
residential construction, however, the wood kitchen cabinet        story regarding furniture exports, having grown its business
and countertop-manufacturing sector is currently suffering         to export furniture to the United States from $1 million in
a severe recession because of its dependency on new and            1998 to more than $1 billion in 2008 (ITA 2009). While
remodeled housing construction activities.                         low production-cost regions, such as Southeast Asia, have

FOREST PRODUCTS JOURNAL                 VOL. 59, NO. 9                                                                           23
Domestic shipments&imports --Domestic Shipments Upholstered P.R. of China was by far the largest
billion U.S. $ -*-Imports Upholstered
14 supplier of imported products, sup-
plying 72 percent of all of the im-
12 ports, followed by Mexico (7%),
Italy (5%), Canada (4%). and Viet-
10 nam (3%). Between 2006 and 2007,
the P.R. of China, Vietnam, and Indo-
nesia increased their shipments to the
United States by 9.1, 36.2, and 11.3
percent, respectively, while Italy,
Mexico, and Canada all lost volume
(-2 1.3%, —9.5%, and - 15.3%, re-
spectively; ITA 2009). Figure 8
shows the value of imports by se-
lected countries, total imports, and
the value of domestic shipments for
the upholstered furniture industry.
Figure 6. - Domestic shipments and total imports of upholstered and nonuphoistered An interesting observation from
furniture 1992 to 2008 (U.S. Census Bureau 2009b, ITA 2009). the ITA data (2009) is that up-
holstered furniture imports from
Nicaragua increased almost 2000
captured business, higher production cost manufacturing lo- percent in 2008 from 2006, from 80.36 million in 2006 to
cations lost trade with the United States. Imports ofnonuphol- $3.6 million in 2007 and to $6.6 million in 2008 (ITA
stered wood household furniture between 2000 and 2008 2009). While two observations do not make a trend, and im-
decreased 32 percent from Canada, 21 percent from Mexico, ports from Nicaragua in 2008 were 0.3 percent of those from
and 35 percent from Italy (ITA 2009). the P.R. of China, one cannot help but wonder if this is in re-
The nonuphoistered household furniture (NAICS 337,121) sponse to increasing production and transportation costs in
trade deficit for the United States in 2008 was roughly $8.5 Southeast Asia or if other economic factors are behind Nicar-
billion, with imports reaching $9.6 billion and exports being agua's rise from obscurity. In any ease, at present U.S. Con-
$1 . I billion. Figure 7 shows the value of imported nonuphol- sumers are in no mood or in no position to spend on durable
stered household furniture from the leading countries (P.R. consumer goods decreasing the fortunes of domestic and for-
of China, Canada, Vietnam, Malaysia, Indonesia, Italy, and eign suppliers alike. At the same time, social trends such as the
Mexico), the total of all of the imports, and the value of increasing sensibility of consumers for more environmentally
domestic shipments. Due to the economic challenges facing friendly products are setting new priorities for the industry.
the U.S. economy, imports of nonupholstered wood house-
hold furniture dropped by almost 10 percent in 2008 vs. 2007, Future furniture
with the P.R. of China losing 14 percent, Canada 20 percent, production in the United States
and Mexico 9 percent; Vietnam added 20 percent (ITA 2009). Today, furniture manufacturing is a global business. Pro-
duction ofnonupholstered wood household furniture (N AICS
When evaluating these official statistics, it is important to
337,122) and upholstered household furniture (NAICS
remember that the value of domestic shipments is actually
337,121) are driven by labor and production costs, as are
overstated for all of the furniture industry segments due to
other, labor-intensive industries (e.g., apparel, shoe, toys).
the inclusion of imported components into domestically ship-
These industries constantly seek the lowest cost production
ped products. Accounting for such imported components is
location globally and abandon places with increasing cost
difficult because in the statistics of the Foreign Trade Division
structures. The increasing labor and production costs in the
(FTD 2008) imported components are listed as "Furniture
Components of Wood - Imports" for NAICS 337, but are P.R. of China (Adams and Shu-ling 2008, Aeppel 2008)
has forced the most cost-sensitive industries to seek lower cost
not broken down further to the industry's subsectors and do-
labor and production locations, such as Vietnam or Cambodia
mestic manufacturers may or may not subtract the value of
(Hoffman 2007, Bradsher 2008). While containerized trans-
those imported components from their value of shipments.
portation has vastly increased efficiency oftransporting goods
In any case, imports of furniture components increased dra-
globally and has thus reduced costs, increasing energy prices,
matically, from $316 million in 1997 to $1.2 billion in 2007
lead time limits, capacity constraints, security issues, and la-
(FTD 2008). Thus, while the impact of imported components
bor unrests within the supply chain have increased costs and
on domestic shipments by industry subsectors cannot be ex-
the potential of supply disruptions (Aeppel 2008, Areddy
actly quantified, the challenges faced by the domestic wood
2008, Rubin and Tal 2008, WSJ 2008). The U.S. Dollar,
components industry may be a sign of the impact of such
imports. which has lost substantial value over the last 5 years vs.
the currencies of its key trading partners (- 15%, —45%,
The domestic upholstered household furniture manufactur- —8%, and —46%, against the Chinese Remimbi, the Euro,
ing sector (NAICS 337,121) has experienced less import pres- the Yen, and the Canadian and Australian Dollars, respec-
sure than the nonupholstered sector. Imports in 2008 were tively, Federal Reserve Board 2008), no longer offers outsized
roughly 28 percent of U.S. value of shipments, or $3 billion advantages for most manufacturers functioning in other de-
(ITA 2009). As in the nonuphoistered sector, however, the nominations (Dabroza 2008, NZZ 2008). While the lower
24 SEPTEMBER 2009Nonuphoistered PmqMexico=Italy the United States may be important
luilhindonesia EmMalaysia
billion U S. $ Vietnam =Canada to remain competititve in the future
E!(hin Tot,I imnnrts (Hunter et al. 2008). Some are
14
even taking back work sourced out
12 to offshore locations to domestic
manufacturing operations (Aeppel
10 2008. Engardio 2008, Rubin and
Tal 2008). A paradigm shift may
he evolving toward a more regional
and local approach to manufactur-
ing, offering opportunities for do-
mestic manufacturers and the U.S.
economy.
While the economic climate has
adversely affected the furniture
b D E
1'b b' < r0 business for domestic and interna-
N N N N N N N N 63 61 tional manufacturers (Schcffer and
Payne 2008 1 , success stories exist.
Figure 7. - Value of imported nonuphoistered household furniture from selected
Bumgardner et al. (2007) report of
countries, total of all imports and value of domestic shipments 1992 to 2008 (U.S.
the evolution of a furniture cluster
Census Bureau 2009b, 1TA 2009). in Ohio driven by small Amish
furniture establishments (479 estab-
Upholstered Mexico ItaIy lishments, average of 7.2 employees
Effiflindonesia Malaysia
billion U.S. $ Vietnarn Canada (median = 4.0) per establishment)
14 in the aggregate consuming an esti-
mated 19 percent of all of the graded
12 lumber produced in Ohio in 2005.
The Amish manufacturers, taking
10 advantage of the lack of other
8 suppliers of such "handcrafted,"
customized furniture, using a reputa-
6 tion for high quality and the efficien-
cies offered by the evolving center
4 of excellence, offer an example of
successfully competing as a U.S.-
based manufacturer in a global mar-
ket. Another development to watch
is Swedwood Danville, IKEA's
D b '\ N fl,b c 'D fully owned manufacturing subsidi-
ary (Froth 2007). A large buyer of
Figure 8. - Value of imported upholstered household furniture from selected countries, supplies and services such as Swed-
total of all imports and value of domestic shipments 1992 to 2008 (U.S. Census Bureau wood brings furniture related inter-
2009b, ITA 2009). ests to the region (Squires 2008).
IKEA joins a region where some
value of the U.S. Dollar has helped U.S. exporters (Aeppel of the few remaining domestic furniture manufacturers are
and Slater 2008, Economist 2008) and has limited the size Located. The addition of IKEA to the regional furniture cluster
of the nation's debt held by foreign creditors, it accelerated is likely to improve all industry participants' competitive po-
domestic inflation and supported a global increase in commo- sition through strengthening the industry network of sup-
dity prices (Browne and Cronin 2007. Lipsky 2008, Shenfeld pliers, service providers, education and research, and other
and Grauman 2008). These unfavorable trends are currently specialized activities (Porter 1998). Indeed, the evolving fur-
mitigated by the economic challenges faced by the U.S. econ- niture cluster in Southern Virginia has already sparked aux-
omy, where declining housing prices and the resulting finan- iliary efforts by industry, state, regional, and local
cial market turmoil has brought the economy deep into governments to assure the success and growth of this oppor-
recession territory and has depressed consumer spending tunity (Engagement Matters 2008).
and imports. Yet, despite growing nationalistic inferences Industry clusters will prove crucial for the new generation
with global trade (Davis 2008a, Herbst 2009) and calls for of domestic furniture manufacturers. While furniture manu-
a more limited approach to global trade (Davis 2008b), global facturers were dominated by vertically integrated entities that
trade appears to remain a fundamental element of global eco- sold their product mainly through traditional home furniture
nomic growth and prosperity (Cowen 2008). Nonetheless, stores in the second half of the last century (Fig. 9), the
given the changing cost and risk structures of manufacturing increased division of labor among industry participants and
in offshore locations, domestic manufacturers are revisiting streamlined supply chains brought forth a more focused fur-
their plans and finding that their manufacturing capacity in niture factory by the end of the last century (Fig. 10). This
FOREST PRODUCTS JOURNAL VOL. 59. NO. 9 25TYPICAL U.S. in the increasingly complex busi-
SUPPLIERS FURNITURE COMPANY RETAILERS
ness of distributing and selling the
Lumber Yard &Kilns company's product (Fig. 11). To
that end the successful furniture
Panels Rough Mill manufacturer of the future will have
close links to the final customer to
Veneer Panel cut-up learn about customer preferences, to
provide excellent service, and, po-
Coatings Machining Cony. Retailer tentially, to offer mass customized
solutions.
Au:. Materials Assembly
In the future, furniture manufac-
Finishing
turers will outsource more work to
Warehouse
specialized entities, allowing them-
selves to focus on managing an effi-
cient supply chain, building and
Figure 9. - Value chain of domestic furniture manufacturers in the middle of last century improving efficient assembly and
(Ca. 1950 to 1990). distribution operations and, most
importantly, putting more resources
TYPICAL U.S. into their report with customers.
SUPPLIERS FURNITURE COMPANY RE1 AILERS With the increase in sales channel di-
versity, retailing and marketing will
Yard &Kilns require more resources and smart
choices. Diversity in household fur-
Rough Mill niture retailing is increasing and
some sales have shifted from con-
I
Panel cut-up ventional household furniture re-
tailers to mass merchants such as
Machining Retailer . Wal-Mart or Target, to household
Assembly
stores such as Federated Department
lerchants
Stores or JC Penney, or manufac-
Finishing turer-owned stores such as Ashley,
La-Z-Boy, IKEA or Ethan Allen
Warehouse (Sloan 2007, Ratnasingam et al.
2008). Additionally, new retail op-
Figure 10. - Current value chain of domestic furniture manufacturers (ca. 1990 to 2010). portunities are becoming available
with the advent of mass customized
production (Lihra et al. 2008). While
TYPICAL U.S. mass customization will require
SUPPLIERS FURNITURE COMPANY RETAILERS significant changes in the furniture
manufacturing process, managing
Fin. Components Assembly SpecialIty RetailerIi the customer relationship may turn
out to be the more challenging en-
Finished Panels Finishing Cony, Retailer Ii deavor (Lihra et al. 200xa). Success-
s. ful furniture manufacturers thus
Sub Assemblies Offshore Products Mass Merchant
may become similar to successful
Equipment Warehouse
car manufacturers, where success
B2C Retailer
is heavily dependent on marketing
Services Outsourcing Captiv oRetailer
• and guaranteeing quality products
tailored to the consumers' taste at
Au: Materials IT a reasonable and competitive price.
-- Manufacturers will also have to re-
Direct I32C Sales
Logistics Sales spond to customers who are becom-
ing more sensitive to environmental
Figure 11. - Future value chain of domestic furniture manufacturers (Ca. 2010-future) issues, thus opening opportunities
in the green product categories
(Schlegelmilch et al. 1996, Vlosky
more focused factory specialized on a narrower set of tasks et at. 1999, Veisten 2007). Export markets show promise
such as furniture design, supply chain management, compo- as well, as newly affluent citizens in developing countries
nent assembly, and furniture finishing, as well as retailing. such as the P.R. of China, India, Russia, and other countries
Indications exist that the future domestic furniture manufac- around the globe have selected American furniture as one of
turer will continue to increase its reliance on the supply chain their status symbols (Scelfo 2007). U.S. manufacturers also
as more tasks are outsourced, while becoming more engaged should keep in mind that, in developed countries, where
26 SEPTEMBER 2009the tertiary economic sector (e.g., the service sector) employs Literature cited
more than 75 percent of its workforce, value-added services Adams, J. and K. Shu-ling. 2008. Judgment day. Far East. Econ. Rev.
have to be part of a successful product offering. Successful 171(2):32 35.
Aeppel, T. 2008. Stung by soaring transport costs, factories bring jobs
manufacturers will figure out how to serve their customers home again. Wall St. J., June 13, 2008. pp. Al and A9.
with special services starting with selling, designing, engi- and J. Slater. 2008. Surging exports lighten the gloom:
neering, delivering, maintaining, upgrading, and disposing Longer-term effect is unclear as dollar lends a big boost. Wall St. J.,
of their product (Schuler and Buehlmann 2003). March 24, 2008. pp. A2.
Areddy, J.T. 2008. China's export machine threatened by rising costs.
Current economic developments (rising energy and trans- Wall St. J., June 30, 2008. pp. Al and A9.
portation price; labor and production, cost increases in off- Associated Press (AP). 2007. Housing market's next victim? Furniture
sales. Consumers worried about selling, mortgages are deferring pur-
shore countries; exchange rate fluctuations; supply chain
chases. MSNBC Business/U.S. Business October 7, 2007. www.
risks and concerns about reliable product availability; mass msnbe.msn.com/id/21182357/ Accessed April 6, 2008.
customization; green and carbon neutral products; growing Becker, D. 2003. The fight to furnish; about 7,000 North Carolina
export markets; emergence of the service economy; among furniture workers have lost their jobs in the past three years as
others) have rearranged the equation for profitable furniture U.S. furniture companies are left with few options amid the continu-
ing influx of Chinese imports. Greensboro News and Record - Se-
manufacturing. Manufacturers that are left with no domestic
ries: Special report: Made in China, a two-day series focusing on the
capacity may now be at a disadvantage compared to those that impact of global competition in the triad. March I, 2003. Greens-
kept at least part of their capacity at home. Whatever the sit- boro, North Carolina. pp. Al.
uation of particular manufacturers, none will succeed without Bradsher, K. 2008. Investors seek Asian options to costly China. New
good leadership, a clear vision, and sound strategic planning. York Times (online), June 18, 2008. www.nytimes.com/2008/06/l8/-
business/worldbusiness/18invest.html . Accessed June 16, 2008.
Browne, F. and D. Cronin. 2007. Commodity prices, money and in-
Conclusions flation. Working Pap. Series No. 738. European Central Bank. 35 pp.
The current economic recession is putting a heavy burden Buehlrnann, U. and A. Schuler. 2002. Benchmarking the wood house-
on all sectors of the U.S. economy, including the U.S. furni- hold furniture industry in a global market. Wood Digest, November
2002. pp. 52-57.
ture industries (NAICS 337). Offshore competition of domes- and D. Merz. 2004. Reinventing the U.S.
tic manufacturers, however, has an even more profound furniture industry - Facts and ideas. In: Proc. of the keynote pre-
impact on the success of the domestic industries. While in sentation at the Annual Meeting of the Forest Products Soc. - In-
the wood nonupholstered household furniture industry seg- dustry Day. Forest Products Soc., Madison, Wisconsin.
ment (NAICS 337,122), foreign competitors held 64 percent __________ M. Bumgardner, A. Schuler, and M. Barford. 2007. As-
sessing the impacts of global competition on the Appalachian hard-
of the U.S. market in 2008, only 28 percent, 21 percent, and wood industry. Forest Prod. J. 57(3):89-93.
4 percent of the upholstered household furniture (NAICS and J. Crissey. 2008. Manag-
337,12 1), the office furniture (NAICS 337,211), and the wood ing the downturn. Modern Woodworking. March 25, 2008. Randall-
kitchen cabinet and countertop (NAICS 337,1 10) market Reilly Publishing. pp. 40-49.
Bumgardner, M., R. Romig, and W. Luppold. 2007. Wood use by
volumes were supplied by foreign outlets, respectively. This
Ohio's Amish. Forest Prod. J. 57(12):6-12.
variable performance of different industry segments is attrib- Central Intelligence Agency (CIA). 2008. The CIA World Factbook-
utable to numerous underlying reasons, some self-created by Vietnam. https://www.cia.gov/library/publications/the-world-factboOkl
the industry, others external. geos/vm.html. Accessed April 28, 2008. CIA, Washington D.C.
Cowen, T. 2008. The global show must go on. New York Times (on-
Signs exist that the U.S. furniture industry may have oppor- line). June 8, 2008. www.nytimes.com/2008/06/08/business/08view .
tunities to slow, stop, or even overturn its recent decline. Off- html?ref=business. Accessed June 8, 2008.
shore manufacturers, by far the most successful locations to Dabroza, D. 2008. Yuan hits milestone against dollar. New York Times
capture market share over the last 10 years, are struggling with (online). April 10, 2008. www.nytimes.com/2008/04/10/business/
Ocnd-yuan.html?ref=business. Accessed April Il,
numerous issues which are likely to increase their cost of pro-
2008.
duction. Currency developments are also working against Davis, B. 2008a. Global ties under stress as nations grab power. Wall
those regions, as are worries about transportation costs and St. J., April 28, 2008. CCLI(99):A1 and A16.
product safety. Domestically, the United States has seen an __________ 2008b. U.S. News: Obama may find it hard to govern as
increased interest in environmentally sustainable, carbon neu- free trader; Democrats pledges to activists limit room to maneuver.
Wall St. J., CCLI(l 16):A3.
tral, green product demand. Local production also finds re- Economist. 2008. The dollar-The fear of falling. Economist (online).
newed interest as it serves both the increased interest in June 21, 2008. www.economist.comlflriance/displaystory.cfln?story_id=r
green, certified products and increased expectations of cus- 11599161 Accessed June 21, 2008.
tomers with respect to the customization of the product they Engagement Matters. 2008. Wood Science Department enters partner-
are willing to buy. An argument can be made that opportuni- ship to create seamless pathway for learning - Engagement at the
regional level. Engagement Matters-Virginia Cooperative Exten-
ties exist for the U.S. furniture manufacturing industry to sion) 2(1):6-7.
recreate what was once a proud part of the industrial landscape Engardio, P. 2008. Can the U.S. bring jobs back from China? Bus.
in the United States. Week (online). June 19, 2008. www.businessweek.com/rnagazine/
content/0826/b4090038429655.htm Accessed June 30, 2008.
Federal Reserve Board. 2008. Statistics: Releases and historical data. The
Acknowledgments
Federal Reserve Board at the Dept. of Commerce. www. federal reserve.
The authors thank Gavin Wherry, Graduate Student at Vir- gov/releases . Accessed June 30, 2008.
ginia Tech for his valuable support in gathering data. The au- Fishman, T.C. 2005. China, Inc. How the rise of the next superpower
thors also thank two anonymous reviewers for their helpful challenges America and the world. Scribner, New York. 342 pp.
Food and Agri. Organization of the United Nations (FAOSTAT). 2008.
comments. This research was supported by the USDA Forest Production. http://faostat.fao.org/DesktopDefault.aspx'?PagelD=381&
Service's Northern Research Station Forest Sciences Labora- lang=en. Accessed June 21, 2008.
tory in Princeton, West Virginia, Virginia Tech, and Virginia Froth, K.D. 2007. Guns, germs and RTA furniture. Furniture Design &
Cooperative Extension, Blacksburg, Virginia. Mfg. January 2007. pp. 8.
FOREST PRODUCTS JOURNAL VOL. 59, NO. 9 27Foreign Trade Div. (FTD). 2008. Furniture components of wood Quesada, H.J. and R. Gazo. 2006. Mass layoffs and plant closures in
Imports. Inter. Trade Administration, Bureau of the Census, U.S. the U.S. wood products and furniture manufacturing industries. For-
Dept. of Commerce. www.census.gov/foreign-trade/reference/products/ est Prod. J. 56(I0):101-106.
index.html. Accessed June 2008. Ratnasingam, J., U. Buehlmann, and A. Schuler. 2008. The Malaysian
Greenspan, A. 2008. We will never have a perfect model of risk. and United States Furniture Sectors - Growth Potential and Strate-
Financ. Times. (online). March 16, 2008. www.ft.com/cms/s/0/ gies. Universiti Putra Malaysia Press, Serdang. Selangor, Malaysia
edbdbcf6-f360-1 Idc-b6bc-0000779fd2ac.html Accessed March 30, (in press).
2008. Rubin, J. and B. Tal. 2008. Will soaring transport costs reverse glob-
Grushecky, S.T., U. Buehlmann, A. Schuler, W. Luppold, and E. Cesa. alization? StrategEcon, CIBC World Markets. May 27, 2008. pp.
2006. Decline in the U.S. furniture industry: A case study of the 4-7.
impacts to the hardwood lumber supply chain. Wood and Fiber Scelfo, J. 2007. High Point hears cheers from abroad. New York Times
Sci. 38(2):365-376. (online), October II, 2007. www.nytimes.com/2007/l0/I1/gardenI
Herbst, M. 2009. Jobs and protectionism in the stimulus package. Bus. II HighPoint.html?pagewanted= I &n=Top/Reference/Tinies%20
Week (online). February 16, 2009. www.businessweek.com/bwdailyi Top ics/People/O/O' Brien,%20Thomas%20( 1nterior%20Designer).
dnflashlcontent/feb2009/db200902 1 6_920561 .htm?chan=top+ news_ Accessed June 23, 2008.
top + news+ index + - + temp_top+ story. Accessed April 14, 2009. Scheffer J.R. and D.I. Payne. 2008. Annual report pursuant to section
Hoffman, W. 2007. China's advantage slipping. Traffic World (Newark, 13 OR 15(D) of the Securities Exchange Act of 1934 for the fiscal
New Jersey), December 3, 2007. p. 1. year ended December 31, 2007. Form 10-K. February 4, 2008.
Huber, T. 2008. Hard times hit U.S. hardwood lumber industry - United States Securities and Exchange Commission, Washington,
Changing consumer tastes, construction downturns have slashed de- DC.
mand. Associated Press (AP) - MSNBC Business News. April 6, Schlegelmilch, B.B., G.M. Bohlen, and A. Diamantopoulus. 1996. The
2008. www.msnbc.msn.com1idJ23959105/. Accessed April 28, 2008. link between green purchasing decisions and measures of environ-
Hunter, S.L., A. Schuler, G. Li, and Z. Wan. 2008. The real costs of mental consciousness. Eur. J. Mark. 30(5):35-55.
outsourcing from low-wage countries: An empirical study of the Schuler, A. and C. Adair. 2003. Demographics, the housing market and
Mississippi wood furniture industry. Forest and Wildlife Res. Center, demand for building materials. Forest Prod. J. 53(5):8-17.
Res. Bulletin FP, Mississippi State Univ. 16 pp. -and U. Buehlmann. 2003. Benchmarking the wood house-
Inter. Trade Administration (ITA). 2009. Consumer goods industries. hold furniture industry: A basis for identifying competitive business
www.ita.doc.gov/tdlocg/index.htm . Accessed Jan. 2008-July, 2009. strategies for today's global economy. Gen. Tech. Rept. GTR-NE-
U.S. Dept. of Commerce. 304. USDA Forest Serv. 18 pp.
Joint Center for Housing Studies. 2002. The state of the nation's hous- __________ and . 2008a. Globalization and hardwood
ing - 2002. The Joint Center for Housing Studies of Harvard Univ., markets: The future offers opportunities and challenges. Presented
Cambridge, Massachusetts. 43 pp. at the Kentucky Woodlots-Capture the Value Conf., February 2008,
Lihra, T., U. Buehlmann, and R. Beauregard. 2005. Mass customiza- Somerset, Kentucky.
tion of wood furniture: Current situation and potential. Presented at and . 2008b. Globalization and hardwood
the 2005 World Congress on Mass Customisation and Personaliza - markets - The future offers opportunities and challenges. Northeast
tion. Hongkong, P.R. China, September 2005. utilization and marketing council meeting and training session, June
-1 ___________. 2008. Mass customization 2-5, 2008, Blacksburg, Virginia.
of wood furniture as a competitive strategy. Inter. J. of Mass Custom- __________ R. Taylor, and P. Araman. 2001. Competitiveness of U.S.
ization 2(3/4):200-215. wood furniture manufacturers: Lessons learned from the softwood
and . 200xa. Opportunities and moulding industry. Forest Prod. J. 51(7/8):14-20.
challenges of furniture manufacturers implementing mass custom- Shenfeld, A. and M. Grauman. 2008. Inflation: Rising up in 2009.
ization. In: Advances in Mass Customization and Personaliza- StrateEcon, CIBC World Markets, May 27, 2008. pp. 8-1I.
tion, Tseng, M. and F. Piller, Vol. 3, Part x. World Scientific Sloan, C. 2007. Retail giants: Wal-Mart still No. I but Ashley closing
Press, Singapore (in press). in. Furniture Today. August 20, 2007. 31(49).
and R. Graf. 200xb. Consumer preferences Squires, P.C. 2008. More good news for Danville. Virginia Business,
for differentiated household furniture. Inter. J. of Operations and February 14, 2008. www.virginiabusiness.com/index.php/news/article/
Production Management. (in review). more-good-news-for-danville/273/. Accessed February 14, 2008.
Lipsky, J. 2008. Commodity prices and global inflation. Council of Stickley, Inc. 2005. Vietnam Expansion. L. and J.G. Stickley News.
Foreign Relations, Inter. Monetary Fund (IMF). May 8, 2008. May 18, 2005. www.stickley.com/NewsAndEvents.cftn'?SubPgName-
www.imf.org/extemal/np/speeches/2008/050808.htm . Accessed June SfickleyNews . Accessed April 28, 2008.
16, 2008. U.S. Census Bureau. 2009a. U.S. Trade in Goods and Services. U.S.
Luppold, W. 2007. The interaction of hardwood lumber market and Census Bureau, Foreign Trade Div., U.S. Dept. of Commerce.
hardwood forests. Presented at the Remaining Competitive in Hard- www.census.gov/foreign-trade/statistics/historicaI/gandst Accessed
wood Lumber Production Conf., Wood Education and Resource April 14, 2009.
Center (WERC), Princeton, West Virginia, March 21-23, 2007. __________ 2009b. NAICS 337: Furniture and related product
Majumdar, R. 2004. The effect of changes in housing wealth on retail manufacturing. U.S. Census Bureau, Foreign Trade Div., U.S. Dept.
sales. Wharton Res. Scholars J., Univ. of Pennsylvania. Philadelphia. of Commerce. www.census.gov/epcd/ec97/def/337.HTM . Accessed
27 pp. Jan. 2009-July 2009.
National Assoc. of Homebuilders (NAHB). 2009. Housing Economics. 2009c. Annual Survey of Manufacturers. U.S. Census
www.nahb.org . NAHB, Washington, DC. Accessed April 2009. Bureau. http://factfinder.census.gov/servletJDatasetMainpageservlet?
Neue Zurcher Zeitung (NZZ). 2008. Der Dollar erreicht Parität zum program=EAS&submenuld=&jangen&ts. Accessed Jan. 2008-
Franken - Sorge um die amerikanische Wirtschaft lastet auf der July 2009.
Währung. Neue Zurcher Zeitung (online), March 14, 2008. www.nzz. USDA Foreign Agricultural Service (USDA-FAS). 2009. U.S. Trade
chlnachrichten/wirtschaft/boersenundrnaerkte/derdollarerreicht exports - FAS commodity aggregations. www.fas.usda.gov/ustrade/
paritaet....zum....frankenl.688872.html. Accessed March 24, 2008. USTExFAS.asp?QI=. Accessed Jan. 2008-July 2009.
Nwagbara, U., U. Buehlmann, and A. Schuler. 2002. Impact of glob- Veisten, K. 2007. Willingness to pay for eco-labelled wood furniture:
alization on North Carolina industries: The case of the furniture in- Choice-based conjoint analysis versus open-ended contingent valua-
dustry. Res. report. NC Dept. of Commerce, Policy, Res., and tion. J. For. Econ. 12:29-48.
Strategic Planning Div., and North Carolina State Univ., Raleigh, Vlosky, R.P., L.K. Ozanne, and R.J. Fontenot. 1999. A conceptual
North Carolina. 45 pp. model of U.S. consumer willingness to pay for environmentally cer-
Oh, H., S-Y. Yoon, and C-R. Shyu. 2008. How can virtual reality re- tified wood products. J. of Consumer Marketing 16(2):I2-14.
shape furniture retailing? Clothing and Textiles Res. J. 26(2):143-163. Wall St. J. (WSJ). 2008. California- Port employees skip work, halting
Porter, M.E. 1998. On Competition. The Harvard Business Review cargo traffic. May 2, 2008. CCLI(103):A2.
book series. Harvard Business School Publishing, Boston, Massachu- World Trade Organization (WTO). 2008. What is the WTO? www.
setts. 311 pp. wto.org/ . Accessed April 5, 2008.
28 SEPTEMBER 2009You can also read