Improving Health Care in Washington State
←
→
Page content transcription
If your browser does not render page correctly, please read the page content below

Powered by:

2016 COMMUNITY CHECKUP REPORT

Improving Health Care
in Washington State
www.WACommunityCheckup.org

 Community Checkup report:    More about the Alliance:   More about Healthier Washington:                 1
 www.WACommunityCheckup.org   www.WAHealthAlliance.org   www.hca.wa.gov/hw/

2

Powered by:

CONTENTS

Executive letter                                                       4

Introduction                                                           5

Achieving Excellence in Washington                                     9

Areas of Focus: Well-Child Visits and Diabetes                        13

New Area of Focus: Behavioral Health                                  19

Other Key Findings                                                   27

Health Care Spending                                                  41

Medical Group Summary Charts                                         49

About the Community Checkup                                          59

 Community Checkup report:    More about the Alliance:   More about Healthier Washington:                 3
 www.WACommunityCheckup.org   www.WAHealthAlliance.org   www.hca.wa.gov/hw/

Dear Community Member,                                                                   The Alliance is grateful to our data suppliers for providing the data needed to
                                                                                         produce results for the Community Checkup. We would also like to acknowledge
Washington State is midway through a bold and ambitious initiative to transform
                                                                                         the many organizations that also provided results for the Common Measure Set:
health care in the state. The Healthier Washington initiative, funded by a grant from
                                                                                         the Washington State Hospital Association, CMS/Hospital Compare, the
the federal government, has as its goal making Washington a place where the
                                                                                         Washington State Department of Health, the Washington State Department of
Triple Aim—better health, better care and lower cost—is an everyday part of our
                                                                                         Social and Health Services, the Washington State Health Care Authority, the
health care system.
                                                                                         state’s health plans and the National Committee for Quality Assurance. The release
A major part of that effort is knowing where there’s room for improvement and            of this report is a testament to the power of collaboration that we are fortunate to
where there are successes to be shared. That’s why the Community Checkup plays           have in our state.
an important role in advancing the work of Healthier Washington. Performance
measurement and reporting are essential tools to help us reach our shared goal of
Washington being in the top ten percent of performance nationally.                       Sincerely,
This is the tenth version of the Community Checkup, and the second time that we
have reported results for the Washington State Common Measure Set for Health
Care Quality and Cost. This report includes significant advances, including
reporting for all primary care medical groups and clinics of four or more providers
in the entire state. The report also includes new measures for the Common Measure
Set, including behavioral health measures, that expand how we track important
                                                                                         Nancy A. Giunto,
elements of health.
                                                                                         Executive Director
The results show us that Washington still has a ways to go to achieve the high-          Washington Health Alliance
quality, high-value health care that we want all our citizens to receive. But just
knowing our state’s performance isn’t sufficient. To transform the health care system,
we need to move from data to action.
Recognizing the importance of laying out a path others can follow, the Health Care
Authority (HCA) has decided to act as a first mover in the market. As part of the
State’s Healthier Washington initiative, Washington aims to drive 80 percent of
                                                                                         Dorothy F. Teeter,
state-financed health care and 50 percent of the commercial market to value-
                                                                                         Administrator
based payment by 2020. HCA has incorporated metrics related to 19 of the
                                                                                         Washington State Health Care Authority
measures in the Common Measure Set into contracts for its Accountable Care
Networks and is also including an additional 33 metrics from the common measure
set in 2017 Medicaid and PEBB purchasing contracts. Of those 33, a subset will be
tied to incentive payments in each contract. The decision to do so highlights how
results from the Common Measure Set are being used to drive change in the market
and offers an opportunity for health plans and other purchasers to follow HCA’s
lead in using the Common Measure Set in contracting.

4
Powered by:

Introduction

Community Checkup report:    More about the Alliance:   More about Healthier Washington:                 5
www.WACommunityCheckup.org   www.WAHealthAlliance.org   www.hca.wa.gov/hw/

This version of the Community Checkup report is the tenth that the Washington
Health Alliance has published since 2008.                                                  WHAT’S NEW IN THIS REPORT
With the tenth Community Checkup report, it’s worth reflecting on the importance
                                                                                           • For the first time, results are now available for primary care
of transparency—and its limitations. We have always known that transparency by
itself would not lead to significant improvement. We understand the role                     medical groups and clinics of four or more providers for the
transparency plays in health care transformation: it’s absolutely necessary, but it’s        entire state, a big step forward for Washington state
not sufficient on its own. Making data available that is comparable, relevant and
                                                                                             transparency efforts.
understandable and that comes from a trusted source is vitally important, but it is
just the start of the cycle for transformation. Using information to identify              • Results reflect the full expansion of Medicaid enrollment,
opportunities and to motivate action is a critical next step.
                                                                                             which began in 2013.
Ongoing reporting through the Community Checkup is a valuable tool in this
process of transformation and helps us, collectively, to understand over time              • Results are included for new measures on behavioral health,
whether efforts to improve are working. We also know that health care is far too             including mental health service penetration and substance
complex for any one organization, or even any one stakeholder group (e.g.,
providers) to transform care on its own. Transformation requires all of us working           use disorder service penetration.
together, across organizations and stakeholder groups, to drive change in an
aligned and supportive manner. This is why convening continues to be such a
critical component of the Alliance’s mission.
The chart on the following page highlights the series of steps necessary to move
from data to action. A database is just a collection of data points unless there is the
infrastructure and trust to ensure that it is accessed and used to its fullest capacity.
Moving data to information means making data comparable, relevant and
understandable. It also requires that the information come from a trusted source.          Health care is far too complex for any one
The next step is moving to action. Action includes such things as benefit design and       organization, or even any one stakeholder group
changing practice patterns among providers. This is a crucial step, the one in which
information drives changes in our health care system. The Alliance adds value to           (e.g., providers) to transform care on its own.
this step of the process by convening various stakeholders to share ideas, learn           Transformation requires all of us working together,
from one another and align efforts for value-based action.
                                                                                           across organizations and stakeholder groups, to drive
It’s only when all of these steps come together that we are able to achieve the
outcomes that we seek. By working to bring all of these elements of the continuum          change in an aligned and supportive manner.
together, the Alliance is focused on helping Washington to achieve the Triple Aim:
better care, better health and lower costs.

6
Powered by:

Steps Required to Achieve the Triple Aim

                DATA                            INFORMATION                                    ACTION          OUTCOMES

     • Complete                              • Trusted Source                        • Purchasing          • Top 10%
     • Accurate                              • Comparable                            • Benefit Design      • Better Health
     • Valid Measures                        • Relevant                              • Changing Practice   • Better Care
                                                                                       Patterns
                                             • Understandable                                              • Less Waste
                                                                                     • Behavior Change
                                                                                                           • Lower Cost

 Community Checkup report:    More about the Alliance:      More about Healthier Washington:                                 7
 www.WACommunityCheckup.org   www.WAHealthAlliance.org      www.hca.wa.gov/hw/
Yet, despite the best efforts of the Alliance and its hundreds of stakeholders, the        1. Supporting multi-sector engagement. To build a healthier Washington,
significant quality improvements that we envisioned when the first Community                  the State is empowering people to come together at the local level. This
Checkup report was released in 2008 remain elusive. To their credit, individual               includes connecting health care providers who are working to address an
medical groups and providers have undertaken major efforts to improve their                   individual’s physical and mental health needs with community-based resources
performance. Health plans have taken steps to redesign provider payment to link it            that provide support-like assistance with housing, employment or the activities
to quality. Plans and purchasers have made some headway to create different                   of daily living. Making these critical connections will help Washington address
benefit designs. Yet there are still plenty of opportunities for improvement.                 the social and economic issues that can play an important role in an
                                                                                              individual’s health.
Variation is as much a theme in this report as it was in the 2008 report. Despite the
spotlight that the Community Checkup has placed on it, variation in the quality of         2. Integrating care and social support. Strengthening the connections
health care is endemic. Even for tests and treatments supported by overwhelming               across the health care sector and communities is one step to transforming care.
evidence, there remains a remarkable range among the frequency with which they                Another step is through investment in knowledge, training and tools to help
are likely to be provided. This variation can be among facilities (medical groups,            providers deliver effective care where people are, when they need it. The state
clinics, hospitals) or geographies (counties or Accountable Communities of Health).           will promote change to improve coordination of care, connect providers to
This continuing pattern of significant variation underscores how important it is that         community resources and shift to paying for value rather than volume.
we continue to measure, analyze and report results to target opportunities for
                                                                                           3. Paying for value. The state is testing new ways to pay for health care to
improvement. It also underscores how challenging it is for all of us—providers,
                                                                                              lower costs, improve the care people receive and ensure that health care
purchasers, health plans and consumers—to significantly move the needle through
                                                                                              dollars are spent wisely. This includes rewarding providers for the quality of
concerted changes in clinical decision making and in incentivizing quality.
                                                                                              care people receive rather than the number of procedures or patient visits they
                                                                                              receive. To do this effectively, the state is developing methods of collecting and
HEALTHIER WASHINGTON IS                                                                       sharing information so that the state, health plans, providers and citizens can
                                                                                              see how the system is really performing—and work toward improvements
MOVING THE MARKET TO VALUE                                                                    based on this information. The Common Measure Set is foundational to
                                                                                              understanding and measuring value.
This report is the second time that the Alliance has reported results for the Washington
State Common Measure Set for Health Care Quality and Cost. In 2016, the Common
Measure Set includes 55 measures that enable a common way of tracking important
elements of health and how well the health care system is performing. This year’s
results include four new measures: mental health services for children and adults,
substance use disorder services for children and adults, medication management for
                                                                                              Variation in the quality of health care is endemic.
people with asthma and statin therapy for patients with cardiovascular disease.               Even for tests and treatments supported by
The Common Measure Set is an important element in the state’s Healthier                       overwhelming evidence, there remains a remarkable
Washington initiative, an innovative and ambitious effort to improve health care in
our state. Funded by a State Innovation Model (SIM) grant from the Centers for
                                                                                              range among the frequency with which they are
Medicare & Medicaid, Healthier Washington is employing three overarching                      likely to be provided.
strategies to achieve its transformational goals:

8
Powered by:

Achieving Excellence
in Washington

Community Checkup report:    More about the Alliance:   More about Healthier Washington:                 9
www.WACommunityCheckup.org   www.WAHealthAlliance.org   www.hca.wa.gov/hw/
The Alliance community has collectively agreed upon a goal that Washington state       below the 50th percentile; 12 measures for Medicaid enrollees actually fall
providers will be in the top ten percent of performance nationally. That is why we     below the 25th percentile. As unfortunate as these results may be, the Alliance’s
compare measure results to the national 90th percentile whenever such a                hope is that they can be used to identify those areas where specific and
benchmark is available, for example, from the National Committee for Quality           aggressive interventions are needed to improve performance and with it the
Assurance (NCQA).                                                                      health of Washingtonians.
On all but a handful of measures in the Community Checkup report, Washington           Everyone has a role to play in multiplying efforts to achieve more rapid change
state falls short of this measure of excellence. To their credit, on many measures     and improvement in achieving the Triple Aim. By aligning efforts to move the health
individual medical groups and clinics do exceed top national performance, both         care system from its current focus on volume to a focus on value, all stakeholders—
within the Medicaid and the commercially insured populations. These providers          health plans, purchasers, providers and consumers—can collectively assert the
show us that excellence is achievable and that everyone can benefit from               leverage necessary to move the market, something no single organization or
incorporating best practices.                                                          stakeholder group can accomplish on its own.
Outstanding performance is just one benchmark for performance. We also need to         Fortunately, there is momentum in our state in that direction, thanks to the Healthier
know what the state’s performance means relative to other national benchmarks. To      Washington initiative and the Washington State Health Care Authority’s Value-
that end, the Alliance also notes how performance compares to a series of other        Based Road Map 2017–2021, both of which lay out specific plans to move the
percentile brackets.                                                                   market to value.
The results are illuminating and also disappointing. Out of 22 measures not specific   Following are tables that show the state’s performance against national
to health plans that have a national benchmark, only one is above the national         benchmarks established by the NCQA, a nonprofit that has developed quality
90th percentile for the commercially insured population and none for the Medicaid      standards and performance measures that are widely recognized.
population. Almost 40 percent of all measures for the commercially insured fall

     On all but a handful of measures in the Community Checkup report, Washington state
     falls short of excellence. To their credit, on many measures individual medical groups
     and clinics do exceed top national performance.

10
Powered by:
Figure 1: Washington State Performance for Commercially Insured as Compared to NCQA National Benchmarks
National 90th
National Benchmarks Measure State Average
Percentile
Above National 90th Percentile Eye exam for people with diabetes 75% 70%
Avoiding antibiotics for adults with acute bronchitis 34% 38%
Between National 75th and Avoiding X-ray, MRI and CT scan for low-back pain 80% 83%
90th Percentile Staying on antidepressant medication (6 months) 56% 60%
Staying on antidepressant medication (12 weeks) 72% 75%
Access to primary care (ages 12–19 years) 90% 95%
Access to primary care (ages 45–64) 96% 97%
Access to primary care (ages 65+) 98% 99%
Between National 50th and Blood sugar (HbA1c) testing for people with diabetes 90% 94%
75th Percentile Breast cancer screening 75% 80%
Colon cancer screening 63% 72%
Kidney disease screening for people with diabetes 86% 90%
Medication safety: monitoring patients on high-blood pressure medications 82% 86%
Access to primary care (ages 2–6 years) 89% 96%
Access to primary care (ages 7–11 years) 90% 97%
Access to primary care (ages 12–24 months) 98% 99%
Access to primary care (ages 20–44) 92% 95%
Between National 25th and
Appropriate testing for children with sore throat 77% 92%
50th Percentile
Cervical cancer screening 75% 82%
Chlamydia screening 39% 60%
Spirometry testing to assess and diagnose COPD 40% 52%
Well-child visits (ages 3–6 years) 73% 87%
National 90th percentile is based upon national benchmarks computed by the National Committee for Quality Assurance (NCQA). This reflects the top 10 percent of performance across the nation.
The source for this benchmark data contained in this publication is Quality Compass® 2015 and is used with the permission of the National Committee for Quality Assurance (“NCQA”). Any analysis, interpretation, or
conclusion based on these data is solely that of the authors, and NCQA specifically disclaims responsibility for any such analysis, interpretation, or conclusion. Quality Compass is a registered trademark of NCQA.
Community Checkup report: More about the Alliance: More about Healthier Washington: 11
www.WACommunityCheckup.org www.WAHealthAlliance.org www.hca.wa.gov/hw/Figure 2: Washington State Performance for Medicaid Insured as Compared to NCQA National Benchmarks
National 90th
National Benchmarks Measure State Average
Percentile
Between National 75th and Staying on antidepressant medication (6 months) 42% 48%
90th Percentile Staying on antidepressant medication (12 weeks) 58% 63%
Avoiding antibiotics for adults with acute bronchitis 30% 40%
Between National 50th and
Avoiding X-ray, MRI and CT scan for low-back pain 77% 83%
75th Percentile
Eye exam for people with diabetes 63% 68%
Access to primary care (ages 65+) 84% 92%
Between National 25th and Appropriate testing for children with sore throat 66% 85%
50th Percentile Cervical cancer screening 55% 73%
Chlamydia screening 51% 69%
Access to primary care (ages 2–6 years) 75% 93%
Access to primary care (ages 7–11 years) 86% 96%
Access to primary care (ages 12–19 years) 86% 95%
Access to primary care (ages 12–24 months) 89% 98%
Access to primary care (ages 20–44) 71% 87%
Access to primary care (ages 45–64) 75% 92%
Below National 25th Percentile
Blood sugar (HbA1c) testing for people with diabetes 63% 92%
Breast cancer screening 27% 71%
Kidney disease screening for people with diabetes 71% 88%
Medication safety: monitoring patients on high-blood pressure medications 82% 92%
Spirometry testing to assess and diagnose COPD 22% 41%
Well-child visits (ages 3–6 years) 58% 84%
National 90th percentile is based upon national benchmarks computed by the National Committee for Quality Assurance (NCQA). This reflects the top 10 percent of performance across the nation.
The source for this benchmark data contained in this publication is Quality Compass® 2015 and is used with the permission of the National Committee for Quality Assurance (“NCQA”). Any analysis, interpretation, or
conclusion based on these data is solely that of the authors, and NCQA specifically disclaims responsibility for any such analysis, interpretation, or conclusion. Quality Compass is a registered trademark of NCQA.
12Powered by: Areas of Focus: Well-Child Visits and Diabetes Community Checkup report: More about the Alliance: More about Healthier Washington: 13 www.WACommunityCheckup.org www.WAHealthAlliance.org www.hca.wa.gov/hw/
TESTING THE THEORY OF CHANGE                                                                            incarceration of a parent. As ACEs increase, so does the risk for poor outcomes
                                                                                                        later in life such as unemployment, lowered educational attainment, chronic
The state is nearly halfway through the four-year grant supporting Healthier                            disease (e.g., diabetes, asthma and cardiovascular disease), mental health and
Washington and has decided that now is the time to test whether component parts                         substance use disorders and violence victimization or perpetration.
of the system, when focused and used wisely together, can accelerate change and
achieve the initiative’s aims. To that end, the state has identified the focus areas of                 For many in primary care, screening for and tackling the issue of ACEs is
well-child visits and diabetes to test the Healthier Washington theory of change                        understandably a daunting task, particularly for those that do not have behavioral
over the next year. These two focus areas align with community priorities, are being                    health resources closely linked to their practice. Even so, while not the only time or
measured and tied to financial incentives in state-financed programs and have the                       place to screen for ACEs, the well-child visit is an important opportunity to identify
potential to improve health and quality of life across Washington. Testing Healthier                    children who have experienced trauma or who are affected by traumatic events
Washington’s theory of change using these two areas of focus will simplify                              experienced by their parents, with the goal of getting families linked to appropriate
evaluating and understanding connections among different aspects of the Healthier                       community-based resources that can help. After all, “a huge chunk of the billions
Washington initiative.                                                                                  upon billions of dollars that Americans spend on health care, emergency services,
                                                                                                        social services, and criminal justice boils down to what happens—or doesn’t
                                                                                                        happen—to children in families and communities.”1
WELL-CHILD VISITS KEY TO A HEALTHY START
                                                                                                        Unfortunately, Washington state has some work to do in order to achieve
Childhood is a time of rapid growth and change, including brain and body                                excellence on the well-child visit measure. For both the commercially insured and
development. Patterns of nutrition and physical activity can be set that can and do                     Medicaid populations, the statewide average is between the national 25th and
have life-long effects in terms of health. During well-child visits, the primary care                   50th percentiles, well below the state’s goal of being in the top ten percent of
provider reviews the basics such as height and weight, sleep patterns, oral health,                     performance nationally.
family and social relationships and age-appropriate safety precautions, making
sure that both parent and child (when a little older) are attuned to things that make
a big difference. The well-child visit is a key time to deliver evidence-based and
age-appropriate vaccines to prevent childhood disease. In addition, the primary
care provider can detect possible developmental delays or disabilities, early
treatment of which can lessen future impact on both the child and family.                                   KEY FINDINGS
The well-child visit is also when primary care providers should screen children to                          • Approximately one in four children (27 percent) who are commercially
identify those at risk for Adverse Childhood Experiences (ACEs). ACEs are                                     insured failed to get a well-child visit in the measurement period.
traumatic events that have a negative and lasting effect on health and well-being.
These experiences range from physical, emotional or sexual abuse, to parental                               • More than four out of ten children (42 percent) enrolled in Medicaid
divorce, to substance abuse, mental illness or violence within the family unit or the                         failed to have a well-child visit.
                                                                                                            • Variation is pronounced among medical groups as well as counties.

1. Stevens, Jane E. To prevent childhood trauma, pediatricians screen children and their parents…and sometimes, just parents…for childhood trauma. ACES Too High, https://acestoohigh.com/2014/07/29/
   to-prevent-childhood-trauma-pediatricians-screen-children-and-their-parentsand-sometimes-just-parents/. Published July, 2014.

14
Powered by:
Figure 3: Variation among Medical Groups for Well-Child Visits for Medicaid Insured
NCQA 90TH PERCENTILE STATE AVERAGE MEDICAL GROUP RATE
100%
90%
84%
80%
70% 67%
60% 58%
50%
41%
40%
30%
20%
10%
Adolescent well-care visits Well-child visits (ages 3–6 years)
Community Checkup report: More about the Alliance: More about Healthier Washington: 15
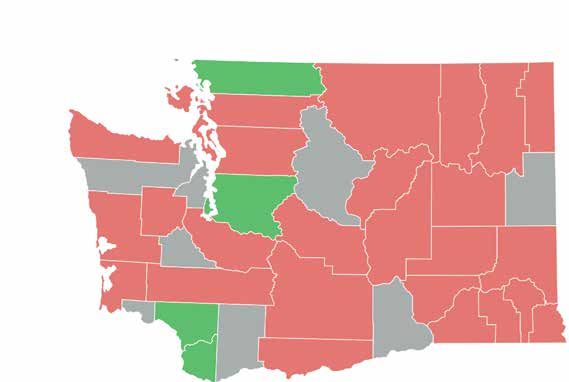
www.WACommunityCheckup.org www.WAHealthAlliance.org www.hca.wa.gov/hw/Figure 4: Variation among Counties for Well-Child Visits for Medicaid Insured
STATE AVERAGE: 58%
BETTER AVERAGE WORSE UNRATED
Whatcom
San Juan 59% Pend
Okanogan Oreille
42% Skagit
46% Ferry Stevens 59%
Island 61% 52% 49%
Clallam 58%
Snohomish
58% 61% Chelan
Jefferson 52%
62% Douglas
Kitsap 55% Lincoln Spokane
58% King 62%
52%
Grays Mason 56%
Harbor 59%
Kittitas Grant
52%
Thurston Pierce 54% 38% Adams Whitman
64% 62% 64% 60%
Pacific Lewis
44% Franklin Garfield
61% Yakima 58%
Wahkiakum 59%
Cowlitz Benton Walla Columbia
Walla
64% Skamania 57% 55% Asotin
66% 59%
67% Klickitat
Clark
41% 52%
Figure 5: Variation among Accountable Communities of Health for Well-Child Visits for Medicaid Insured
90TH PERCENTILE STATE AVERAGE BETTER AVERAGE WORSE
Better Health Together 61%
Cascade Pacific Action Alliance 61%
Greater Columbia 58%
King 56%
58% 84%
North Central 45%
North Sound 60%
Olympic 58%
Pierce 62%
SW WA Regional Health Alliance 42%
0% 20% 40% 60% 80% 100%
16Powered by:
AN OPPORTUNITY FOR
IMPROVING DIABETES CARE KEY FINDINGS
According to the most recent data from the Centers for Disease Control (2014), • Eye exams for people with diabetes is above the national 90th percentile
approximately 8.2 percent of adults in Washington were told by a doctor they had for commercially insured patients. This is one of the few results this year
any type of diabetes. This is just slightly under the national age-adjusted rate of 8.4 that achieves our goal. We applaud the more than a dozen medical
percent. The prevalence of diabetes in Washington has been steadily growing, groups that surpassed the national benchmark for this measure.
approximately doubling in the past 20 years. The risk of diabetes increases with • There is wide and significant variation for quality of care for the Medicaid
age. Diabetes is more prevalent among males and among those with less than a population.
high school education. There are also disparities according to race and ethnicity,
with diabetes more prevalent among Hispanics, American Indians and Alaska • More than a third of people with diabetes do not have their blood sugar
Natives and Black adults than among White and Asian adults. under control.
Diabetes is a chronic condition characterized by high blood glucose (sugar)
resulting from the body’s inability to use glucose for energy. In Type 1 diabetes As the chart on the next page with medical group results shows, there remains
(only about 5–10 percent of all diabetes) the pancreas does not make insulin. In remarkable variation for these measures. This is particularly concerning, since these
Type 2 diabetes (90–95 percent of all diabetes) the pancreas does not make measures represent evidence-based standards of care that most, if not all, patients
enough insulin or the body is unable to use insulin correctly. Insulin is a hormone with diabetes should receive. For example, there is as much as an 18 percentage
that allows the body to use sugar (glucose) from carbohydrates in food for energy point difference between the highest performing and lowest performing medical
or to store glucose for future use. The right amount of insulin helps to keep blood groups when it comes to HbA1c (blood glucose) testing for commercially insured
sugar levels from getting too high or too low. patients. The range difference is almost three times as wide for the Medicaid
population on the same measure.
The long-term effects from having diabetes, particularly diabetes that is not
well-controlled, are well known. Diabetes increases risk for many serious health Of particular note is the number of patients whose diabetes is poorly controlled. In
problems, including high blood pressure, vision problems including blindness, this year’s report, we are able to provide results for this measure at the health plan
kidney disease, nerve damage, amputation and stroke. These conditions are huge level only; the measure reflects the percentage of members with diabetes enrolled
drivers of health care costs, and individuals with diabetes can really feel the effect in each health plan whose most recent HbA1c level was greater than 9 percent, a
of this through high-deductible health plans, co-pays and other out-of-pocket level considered “poor control.” Controlling blood sugar is critical for avoiding
expenses. The American Diabetes Association released research in 2013 estimating both short-term and long-term health problems. Results for the commercial health
the total costs of diagnosed diabetes at $245 billion, up approximately 41 percent plans in Washington range from a low of 23 percent to a high of 67 percent; the
from 2007 when the estimate was $174 billion. The largest drivers of direct costs national 90th percentile is 21 percent (lower is better). Results for Medicaid
are hospital stays and prescription medications to treat complications from managed care organizations in Washington range from a low of 36 percent to a
diabetes. But there are also significant indirect costs associated with work high of 65 percent; the national 90th percentile is 30 percent.
absenteeism, lost productivity at work, inability to work and early mortality. Such numbers underscore the importance of Healthier Washington’s focus on
This year’s results point to areas where there is room for improvement in care for diabetes. Without an improvement in how well managed their blood sugar is and
diabetes and, in one case, a sign of good news. how regularly we test for kidney disease and vision problems, thousands of
Washingtonians face a future with an increased risk of complications,
accompanied by greater financial burdens that come with them and the potential
for lower quality of life.
Community Checkup report: More about the Alliance: More about Healthier Washington: 17
www.WACommunityCheckup.org www.WAHealthAlliance.org www.hca.wa.gov/hw/Figure 6: Variation among Medical Groups for Diabetes Care for Commercially Insured
NCQA 90TH PERCENTILE STATE AVERAGE MEDICAL GROUP RATE
100%
94%
90% 90%
90%
86%
80%
75%
70%
70%
60%
50%
40%
30%
20%
10%
Blood sugar (HbA1c) testing Eye exam for people with diabetes Kidney disease screening for
for people with diabetes people with diabetes
18Powered by: New Area of Focus: Behavioral Health Community Checkup report: More about the Alliance: More about Healthier Washington: 19 www.WACommunityCheckup.org www.WAHealthAlliance.org www.hca.wa.gov/hw/
BEHAVIORAL HEALTH GETS A CLOSER LOOK                                                                           These measures have been implemented in the Washington state Medicaid
                                                                                                               environment for some time, where they were deployed to help support the
Another significant focus area for Healthier Washington is improving behavioral                                movement towards increasingly integrated delivery of physical and behavioral
health care and more effectively integrating behavioral and physical health. In                                health care. As is the case with many measures, including NCQA HEDIS measures,
2016, two new measures were added to the Common Measure Set to try and get a                                   we expect that the metrics will be revised over time based on input from plans,
better understanding of behavioral health in our state. The Mental Health Services                             providers and other key stakeholders. In particular, there is an expectation that the
and Substance Use Disorder Services measures were developed by the                                             metrics will continue to evolve to more comprehensively capture services provided
Washington State Department of Social and Health Services’ Research and Data                                   to manage behavioral health conditions in a primary care setting.
Analysis Division (RDA). They are designed to measure access to services to treat or
manage behavioral health conditions.                                                                           Mental health services for children and adults
The measures use a two-year window to identify need for mental health or                                       For the first time in 2016, we have results for the mental health service penetration
substance use disorder treatment services, and then measure the proportion of                                  measure (Mental Health Services for Children and Adults) for the commercially
those in need who received qualifying services in the measurement year.2 The                                   insured population in Washington. Results for both commercial and Medicaid
measures have been shown in several studies (including some in peer-reviewed                                   health plans are reported in 2016, along with results by county and Accountable
journals) to have a strong relationship to patient outcomes. That is, patients who                             Community of Health.
receive treatment after a need has been identified have better outcomes along
many domains (e.g., health service utilization, cost, disease progression, mortality,
criminal justice involvement, employment, housing stability) compared to people                                    KEY FINDINGS
who do not receive treatment after having a need identified.
                                                                                                                   • Mental health service penetration is better overall within the Medicaid
These are important measures to include in the Common Measure Set for                                                insured population for both children and adults.
several reasons.
                                                                                                                   • Only one-third of commercially insured children and adults received
• Behavioral health risk factors are a key driver of health care utilization across                                  mental health services following a diagnosed need for mental health
  physical and behavioral health settings.                                                                           services. Among the Medicaid insured, approximately two-thirds of
• Behavioral health conditions are key risk factors affecting patient experiences                                    children and one-half of adults received mental health services following
  and quality of life across many functional domains.                                                                a diagnosed need.

• Behavioral health services have been historically underfunded in relation to                                     • There is significant variation among counties for both the commercially
  physical health care—recognition of this circumstance helped lead to behavioral                                    and Medicaid insured populations, which may be a reflection of different
  health parity requirements under the Affordable Care Act.                                                          levels of access to services across different parts of the state.

2. The two-year window to identify need is motivated by the tendency for behavioral health conditions to be under-identified in insurance claims data. Given that there can be significant variation across health plans
   and other reporting units in the proportion of enrolled populations with behavioral health needs, using a need-based denominator provides a form of case-mix adjustment to achieve fairer comparisons of access
   across reporting organizations.

20
Powered by:
Figure 7: Mental Health Services for Children, Ages 6–17
RESULTS FOR HEALTH PLANS RESULTS FOR COUNTIES
Medicaid Managed Care Washington Counties, Washington Counties,
Commercial Health Plans
Organizations Commercially Insured Medicaid Insured
State Average = 35% State Average = 63% State Average = 35% State Average = 63%
Lowest Highest Lowest Highest Lowest Highest Lowest Highest
performance performance performance performance performance performance performance performance
15% 68% 56% 64% 11% 55% 53% 71%
Figure 8: Mental Health Services for Adults, Ages 18–64
RESULTS FOR HEALTH PLANS RESULTS FOR COUNTIES
Medicaid Managed Care Washington Counties, Washington Counties,
Commercial Health Plans
Organizations Commercially Insured Medicaid Insured
State Average = 29% State Average = 46% State Average = 29% State Average = 46%
Lowest Highest Lowest Highest Lowest Highest Lowest Highest
performance performance performance performance performance performance performance performance
16% 53% 42% 48% 15% 44% 35% 52%
Community Checkup report: More about the Alliance: More about Healthier Washington: 21
www.WACommunityCheckup.org www.WAHealthAlliance.org www.hca.wa.gov/hw/Figure 9: Variation among Counties for Mental Health Services for Commercially Insured Adults, Ages 18–64
STATE AVERAGE: 29%
BETTER AVERAGE WORSE UNRATED
Whatcom
San Juan 31% Pend
24% Okanogan Oreille
Skagit 22% Ferry Stevens 19%
Island 27% 18% 21%
27%
Clallam Snohomish
21% 27% Chelan
Jefferson 28%
26% Douglas
Kitsap 25% Lincoln Spokane
30% King 29%
19%
Grays Mason 30%
Harbor 27%
22% Kittitas Grant
Thurston Pierce 23% 22% Adams
27% Whitman
28% 17% 23%
Pacific Lewis
21% 24% Franklin Garfield
Yakima 26%
Wahkiakum 25% 15%
Cowlitz Benton Walla Columbia
27% Walla
39% Skamania 30% 16% Asotin
27% 20%
31% Klickitat
Clark
44% 19%
Figure 10: Variation among Accountable Communities of Health for Mental Health Services for Commercially Insured Adults, Ages 18–64
STATE AVERAGE BETTER AVERAGE WORSE
Better Health Together 28%
29%
Cascade Pacific Action Alliance 28%
Greater Columbia 26%
King 30%
North Central 24%
North Sound 28%
Olympic 27%
Pierce 27%
SW WA Regional Health Alliance 44%
0% 20% 40% 60% 80% 100%
22Powered by:
Figure 11: Variation among Counties for Mental Health Services for Medicaid Insured Adults, Ages 18–64
STATE AVERAGE: 46%
BETTER AVERAGE WORSE UNRATED
Whatcom
San Juan 51% Pend
43% Okanogan Oreille
Skagit 46% Ferry Stevens 40%
Island 47% 48% 43%
46%
Clallam Snohomish
47% 46% Chelan
Jefferson 48%
49% Douglas
Kitsap 48% Lincoln Spokane
48% King 46%
36%
Grays Mason 51%
Harbor 41%
44% Kittitas Grant
Thurston Pierce 47% 41% Adams
43% Whitman
45% 35% 48%
Pacific Lewis
45% 45% Franklin Garfield
Yakima 41%
Wahkiakum 40% 44%
Cowlitz Benton Walla Columbia
49% Walla
49% Skamania 50% 35% Asotin
52% 46%
51% Klickitat
Clark
41% 46%
Figure 12: Variation among Accountable Communities of Health for Mental Health Services for Medicaid Insured Adults, Ages 18–64
STATE AVERAGE BETTER AVERAGE WORSE
Better Health Together 45%
46%
Cascade Pacific Action Alliance 45%
Greater Columbia 45%
King 51%
North Central 45%
North Sound 47%
Olympic 48%
Pierce 43%
SW WA Regional Health Alliance 42%
0% 20% 40% 60% 80% 100%
Community Checkup report: More about the Alliance: More about Healthier Washington: 23
www.WACommunityCheckup.org www.WAHealthAlliance.org www.hca.wa.gov/hw/Substance use disorder services for children and adults The measure for Substance Use Disorder Service Penetration (Substance Use Disorder Services for Children and Adults) only includes the Medicaid population in 2016 and results are available at the county and Accountable Communities of Health levels. Results for both children and adults highlight the gap between the need for services and services delivered. On average across the state, only 28 percent of adult Medicaid enrollees received substance use disorder services following a diagnosed need for substance use disorder. For children the rate was 36 percent. Even in the best performing counties, about one of three children and six of ten adults do not get the follow-up treatment they should. Given the opioid epidemic in the state and the toll that it has taken, these numbers underscore the need for a concerted effort to improve access to substance use disorder treatment services. 24
Powered by:

Figure 13: Variation among Counties for Substance Use Disorder Services for Medicaid Insured Adults, Ages 18–64

STATE AVERAGE: 28%
                                                   BETTER            AVERAGE          WORSE            UNRATED

                                              Whatcom
                         San Juan              38%                                                          Pend
                           38%                                            Okanogan                         Oreille
                                               Skagit                       26%            Ferry     Stevens 28%
                                Island          37%                                        32%         26%
                                 25%
                    Clallam                  Snohomish
                     40%                        31%             Chelan
                    Jefferson                                    28%
                      28%                                                  Douglas
                               Kitsap                                       24%            Lincoln       Spokane
                                27%      King                                                              26%
                                                                                            24%
                   Grays Mason           32%
                   Harbor 30%
                    32%                                        Kittitas       Grant
                           Thurston Pierce                      30%           20%         Adams
                                      22%                                                               Whitman
                             26%                                                           17%           21%
                     Pacific         Lewis
                      31%             20%                                           Franklin       Garfield
                                                               Yakima                 27%
                    Wahkiakum                                   29%
                              Cowlitz                                        Benton      Walla Columbia
                      25%                                                                Walla
                               28% Skamania                                   26%                20% Asotin
                                                                                          19%            23%
                                      32%                 Klickitat
                                Clark
                                 29%                        24%

Figure 14: Variation among Accountable Communities of Health for Substance Use Disorder Services for Medicaid Insured Adults, Ages 18–64

                                                                                                                     STATE AVERAGE   BETTER        AVERAGE   WORSE

 Better Health Together                            26%
                                                                                          28%
 Cascade Pacific Action Alliance                   27%
 Greater Columbia                                  26%
 King                                              32%
 North Central                                     24%
 North Sound                                       33%
 Olympic                                           31%
 Pierce                                            22%
 SW WA Regional Health Alliance                    29%
                                                 0%                         20%                        40%                    60%                 80%           100%

 Community Checkup report:          More about the Alliance:               More about Healthier Washington:                                                          25
 www.WACommunityCheckup.org         www.WAHealthAlliance.org               www.hca.wa.gov/hw/
Figure 15: Variation among Counties for Substance Use Disorder Services for Medicaid Insured Children, Ages 6–17
STATE AVERAGE: 36%
BETTER AVERAGE WORSE UNRATED
Whatcom
San Juan 52% Pend
Okanogan Oreille
Skagit 46% Ferry Stevens
Island 49% 28%
37%
Clallam Snohomish
61% 40% Chelan
Jefferson 30% Douglas
Kitsap 42% Lincoln Spokane
40% King 32%
Grays Mason 37%
Harbor 44%
52% Kittitas Grant
Thurston Pierce 36% 25% Adams
32% Whitman
43% 21%
Pacific Lewis
47% 44% Franklin Garfield
Yakima 29%
Wahkiakum 24%
Cowlitz Benton Walla Columbia
Walla Asotin
49% Skamania 32%
30%
Clark Klickitat
40% 34%
Figure 16: Variation among Accountable Communities of Health for Substance Use Disorder Services for Medicaid Insured Children, Ages 6–17
STATE AVERAGE BETTER AVERAGE WORSE
Better Health Together 31%
36%
Cascade Pacific Action Alliance 46%
Greater Columbia 27%
King 37%
North Central 34%
North Sound 44%
Olympic 47%
Pierce 32%
SW WA Regional Health Alliance 41%
0% 20% 40% 60% 80% 100%
26Powered by: Other Key Findings Community Checkup report: More about the Alliance: More about Healthier Washington: 27 www.WACommunityCheckup.org www.WAHealthAlliance.org www.hca.wa.gov/hw/
MANAGING MEDICATIONS ARE AN IMPORTANT
PART OF HEALTH CARE QUALITY                                                                                  KEY FINDINGS

Taking medications as directed (medication adherence) is part of many treatment                              • There is wide variation among medical groups for both the commercially
plans and an important step toward a healthier life. Not taking medication as                                  insured and those insured by Medicaid for all three measures.
directed for such conditions as asthma and depression can have a real impact on a                            • Two thirds of commercially insured patients and six out of ten Medicaid
person’s health. Studies show that as many as half of people with a chronic                                    patients with asthma were dispensed appropriate medications that they
condition don’t take their medication as prescribed. Providers should be monitoring                            remained on for at least 50 percent of the measurement year.
how well medication is working for their patients to ensure that they are getting the
maximum benefit from the medication they prescribe.                                                          • The state falls short of the 90th percentile for the commercially insured and
                                                                                                               Medicaid populations on both antidepressant measures.
According to the Washington State Department of Health:
• More than 600,000 people in Washington have asthma
                                                                                                          The results in the Community Checkup show that there is plenty of room for
• 120,000 of these people are children
                                                                                                          improvement when it comes to effectively managing medications to treat asthma
• More than 5,000 people with asthma are hospitalized each year                                           and depression. Only a handful of medical groups perform at or above the
                                                                                                          national 90th percentile for the two measures that have a benchmark. Meanwhile,
• Nearly 100 die each year from asthma
                                                                                                          the range of variation is significant among medical groups, with 15 percentage
When asthma is not properly controlled, it can lead to serious breathing trouble,                         points or more commonly separating high and low performers. Considering how
fatigue, confusion, visits to the hospital and, as noted above, even death.                               widespread both asthma and depression are in Washington, better overall
Successful management of asthma is possible through regular use of medications                            performance on these measures would mean improved health and quality of life for
that provide long-term control of the condition. In this report, we measure how often                     potentially thousands of patients.
people (ages 5–85) with persistent asthma remained on their prescribed asthma
medication at least 50 percent of the time.
Major depression is one of the most common mental disorders in the United States.
In 2015, an estimated 16.1 million adults ages 18 and older in the United States
had at least one major depressive episode in the past year. This number
represented 6.7 percent of all U.S. adults.3 People who are depressed can be
treated with medicines called antidepressants. Making sure that patients get the
right antidepressant medicine and that they continue to take it correctly is an
important part of effective care for depression. In this report, we measure how often
people (ages 18 and older) who were treated with antidepressant medication
stayed on the medication for at least 12 weeks and then six months or more, both
time periods being clinically important.

3. National Institute of Mental Health. https://www.nimh.nih.gov/health/statistics/prevalence/major-depression-among-adults.shtml.

28
Powered by:
Figure 17: Variation among Medical Groups for Medication Management for Commercially Insured
NCQA 90TH PERCENTILE STATE AVERAGE MEDICAL GROUP RATE
100%
90%
80%
75%
72%
70% 67%
60%
60%
56%
50%
40%
30%
20%
10%
Managing medications for Staying on antidepressant Staying on antidepressant
people with asthma medication (6 months) medication (12 weeks)
Community Checkup report: More about the Alliance: More about Healthier Washington: 29
www.WACommunityCheckup.org www.WAHealthAlliance.org www.hca.wa.gov/hw/CARDIOVASCULAR DISEASE CARE SHOWS ROOM Another important measure is Taking Cholesterol Medications as Directed. This
measure looks at the percentage of patients adhering to prescribed cholesterol
FOR IMPROVEMENT medications by considering the number of days the patient had access to at
Cardiovascular disease, commonly called “heart disease,” is the term for least one statin based on the prescription fill date and the days of supply. For
diseases affecting the heart and blood vessels and your heart’s ability to work. the commercially insured population, the state average is 76 percent, with some
The most common cause of heart disease is coronary artery disease, or the medical group results as low as 56 percent and others as high as 86 percent.
narrowing or blockage of the coronary arteries, which supply blood to the heart Again, results for the population insured through Medicaid are somewhat
itself. It’s the major reason people have heart attacks. Cholesterol testing and lower. The state average is 57 percent, with a range for medical group results
certain medications, such as statins, which lower cholesterol levels, have been from 48 to 64 percent.
proven to help in managing heart disease. In this year’s Community Checkup, we Managing blood pressure is another very important part of treating
include a new measure, Statin Therapy for Patients with Cardiovascular Disease. cardiovascular disease. When blood pressure remains high, it puts extra strain on
This measure looks at how often adults who were identified as having the heart and arteries. Over time, this strain can cause arteries to become thicker
cardiovascular disease were prescribed a statin medication. For the commercially and less flexible or to become weaker, eventually causing health problems such
insured population, the state average is 82 percent, with some medical group as heart attack and stroke.
results as low as 64 percent and others as high as 88 percent. Results for the
population insured through Medicaid are markedly different. The state average is In this year’s report, we include three measures related to blood pressure control.
only 20 percent with some medical group results as low as 8 percent and others The first two measures have results for medical groups and clinics; these include (1)
as high as 27 percent. Taking Hypertension (High Blood Pressure) Medications as Directed, and (2)
Monitoring Patients on High Blood Pressure Medications. These results are shown
on the next page along with the measures related to lowering cholesterol.
In this year’s Community Checkup, we include
a new measure, Statin Therapy for Patients with
Cardiovascular Disease. This measure looks at
how often adults who were identified as having
cardiovascular disease were prescribed a
statin medication.
30Powered by:
Figure 18: Variation among Medical Groups for Cardiovascular Disease Care for Commercially Insured
NCQA 90TH PERCENTILE STATE AVERAGE MEDICAL GROUP RATE
100%
92%
90%
86%
82% 82%
80% 79%
76%
70%
60%
50%
40%
30%
20%
10%
Cholesterol-lowering Medication safety: Statin therapy for Taking Taking hypertension
medication generic monitoring patients patients with cholesterol-lowering medications as directed
prescriptions on high-blood cardiovascular disease medications as directed
pressure medications
Community Checkup report: More about the Alliance: More about Healthier Washington: 31
www.WACommunityCheckup.org www.WAHealthAlliance.org www.hca.wa.gov/hw/Results for an additional measures, Controlling High Blood Pressure and
Monitoring Patients on High-Blood Pressure Medications, are available at the BASED ON RESULTS REPORTED BY THE HEALTH PLANS:
health plan level only. The first measure looks at the percentage of adults who had
a diagnosis of hypertension and whose blood pressure was adequately controlled • More than four out of ten Medicaid patients in Washington with
(blood pressure lower than 140/90). The second measure looks at patients who hypertension and nearly as many commercially insured patients do not
are on high-blood pressure medications and were monitored at least once during have their blood pressure adequately under control.
the measurement period. • Nearly two out of ten commercially insured patients on high-blood
Unfortunately, many patients with high-blood pressure do not have their blood pressure medications did not receive the proper monitoring.
pressure well controlled, putting them at risk for potentially serious complications.
The results for both commercially and Medicaid health plans fall well short of the
national 90th percentile, indicating an opportunity for improvement. Performance
for monitoring patients on high-blood pressure medications is better, but still lags
behind the national 90th percentile for the commercially insured.
Figure 19: Medicaid Health Plan Results for Blood Pressure Control for People with Cardiovascular Disease
STATE AVERAGE: 53% NCQA 90TH PERCENTILE RATE
Community Health Plan of Washington 59%
Molina Healthcare of Washington 57%
Amerigroup Washington 53%
UnitedHealthcare Community Plan 49%
0% 20% 40% 60% 80% 100%
Figure 20: Medicaid Health Plan Results for Medication Safety: Monitoring Patients on High-Blood Pressure Medication
STATE AVERAGE: N/A NCQA 90TH PERCENTILE RATE
Molina Healthcare of Washington 87%
Amerigroup Washington 86%
0% 20% 40% 60% 80% 100%
32Powered by:
Figure 21: Commercial Health Plan Results for Blood Pressure Control for People with Cardiovascular Disease
STATE AVERAGE: 57% NCQA 90TH PERCENTILE RATE
Kaiser Permanente NW 84%
Group Health Cooperative 75%
Group Health Options 61%
Asuris Northwest Health 54%
Cigna 52%
LifeWise Health Plan of Washington 52%
Regence BlueShield 52%
UnitedHealthcare 52%
Aetna 43%
Premera Blue Cross 33%
0% 20% 40% 60% 80% 100%
Figure 22: Commercial Health Plan Results for Medication Safety: Monitoring Patients on High-Blood Pressure Medication
STATE AVERAGE: 81% NCQA 90TH PERCENTILE RATE
Kaiser Permanente NW 86%
Group Health Cooperative 84%
Group Health Options 82%
Asuris Northwest Health 80%
Cigna 81%
Regence BlueShield 80%
UnitedHealthcare 81%
Aetna 81%
0% 20% 40% 60% 80% 100%
Community Checkup report: More about the Alliance: More about Healthier Washington: 33
www.WACommunityCheckup.org www.WAHealthAlliance.org www.hca.wa.gov/hw/VACCINATION RATES STILL REMAIN LOW IN PARTS
OF THE STATE KEY FINDINGS
In this year’s report, results for the rate of immunization are available for counties • Only one-third of children have received their recommended vaccinations
and groupings of counties called Accountable Communities of Health. by age two.
Vaccines are among the most proven, effective prevention strategies in health care. • Four out of ten adolescents have not received their recommended
They reduce the risk of infection by working with the body’s natural defenses to help vaccinations by age 13.
it safely develop immunity to disease. The diseases that vaccines prevent can be • Vaccination rates for children and adolescents show wide variation
dangerous, or even deadly. But Washington is seeing the re-introduction of among counties.
diseases, such as measles, formerly considered under control.
By the age of two, children should receive vaccines for diphtheria, tetanus,
pertussis, polio, measles, mumps, rubella, hepatitis A and B, chicken pox, Despite the value of vaccinations in preventing disease, vaccination rates in
rotavirus, pneumococcal and influenza. In this year’s report, we’re seeing that Washington for children and adolescents are much lower than they should be. The
only 33 percent of children statewide received these recommended vaccines, overwhelming majority of young children have not had all the vaccinations that
with some counties as low as 6 percent and others as high as 43 percent. By they should have by their second birthday. Vaccination rates for adolescents are
the age of 13, adolescents should receive vaccines for meningococcal, human considerably better, but many are still at risk for diseases such as meningitis, which
papillomavirus and a booster for tetanus, diphtheria and pertussis. Overall, strikes this age group particularly hard. Moreover, depending on where they live,
60 percent of adolescents statewide received these recommended vaccines, adolescents may be much less likely to receive the recommended vaccinations due
with some counties as low as 10 percent and others as high as 74 percent. An to wide geographic variation.
annual vaccine for influenza is recommended for everyone age six months
and older, and adults over the age of 65 should receive a one-time vaccine
for pneumococcal disease. The statewide average rate of immunization for flu
and pneumonia is 21 and 73 percent, respectively.
Vaccinations are not only about preventing childhood diseases. They can also
prevent cancer. Human papillomavirus (HPV) is the leading cause of cervical and
anal cancers. Vaccinating adolescent girls and boys before they become sexually
active can break the link and prevent diseases from occurring. Yet, in Washington,
only 17 percent of boys and 22 percent of girls (age 13) received the HPV vaccine
during the measurement year.
Despite the value of vaccinations in preventing
disease, vaccination rates in Washington for children
and adolescents are much lower than they should be.
34Powered by:
Figure 23: Variation among Counties for Childhood Immunization Status by Age 2
STATE AVERAGE: 33%
BETTER AVERAGE WORSE UNRATED
Whatcom
San Juan 23% Pend
Okanogan Oreille
Skagit 30% Ferry Stevens
Island 19% 8%
17%
Clallam Snohomish
14% 37% Chelan
Jefferson 37%
23% Douglas
Kitsap 38% Lincoln Spokane
27% King 20%
19%
Grays Mason 43%
Harbor 19%
26% Kittitas Grant
Thurston Pierce 18% 37% Adams
26% Whitman
31% 40% 26%
Pacific Lewis
15% 30% Franklin Garfield
Yakima 35%
Wahkiakum 43%
Cowlitz Benton Walla Columbia
Walla Asotin
27% Skamania 35%
23% 6%
Clark Klickitat
27%
Figure 24: Variation among Accountable Communities of Health for Childhood Immunization Status by Age 2
STATE AVERAGE BETTER AVERAGE WORSE
Better Health Together 21%
33%
Cascade Pacific Action Alliance 28%
Greater Columbia 35%
King 43%
North Central 36%
North Sound 31%
Olympic 25%
Pierce 26%
SW WA Regional Health Alliance 27%
0% 20% 40% 60% 80% 100%
Community Checkup report: More about the Alliance: More about Healthier Washington: 35
www.WACommunityCheckup.org www.WAHealthAlliance.org www.hca.wa.gov/hw/Figure 25: Variation among Counties for Childhood Immunization Status by Age 13
STATE AVERAGE: 60%
BETTER AVERAGE WORSE UNRATED
Whatcom
San Juan 63% Pend
30% Okanogan Oreille
Skagit 56% Ferry Stevens 10%
Island 46% 34% 31%
36%
Clallam Snohomish
45% 63% Chelan
Jefferson 74%
52% Douglas
Kitsap 74% Lincoln Spokane
60% King 49%
54%
Grays Mason 67%
Harbor 45%
62% Kittitas Grant
Thurston Pierce 54% 72% Adams
59% Whitman
61% 71% 46%
Pacific Lewis
38% 62% Franklin Garfield
Yakima 68%
Wahkiakum 73%
Cowlitz Benton Walla Columbia
67% Walla
60% Skamania 64% 63% Asotin
61% 36%
28% Klickitat
Clark
53% 18%
Figure 26: Variation among Accountable Communities of Health for Childhood Immunization Status by Age 13
STATE AVERAGE BETTER AVERAGE WORSE
Better Health Together 48%
60%
Cascade Pacific Action Alliance 59%
Greater Columbia 65%
King 67%
North Central 71%
North Sound 59%
Olympic 57%
Pierce 59%
SW WA Regional Health Alliance 53%
0% 20% 40% 60% 80% 100%
36You can also read