Health Matters Framing the full story of health - ASMS
←
→
Page content transcription
If your browser does not render page correctly, please read the page content below

Health Matters Framing the full story of health

Cartoons: Sharon Murdoch

Introduction
A senior doctor once said to me that health is created in the places people live and in the ways they live. This
presents a very different lens on what constitutes good health. It forces us to recognise that good health starts
in our homes, in our schools, and in our workplaces. It also starts with the air we breathe, the water we drink
and the opportunities we are offered.

Our members – senior doctors and dentists working in the public health system – spend most of their working
lives caring for people. We know they are regularly treating preventable illness and disease which have their
roots in social factors such as poverty, racism, poor housing, unhealthy food and environments.

Reducing demand for health care in New Zealand also means targeting inequity. To do this, we need greater
investment in areas which, at first glance, may not appear to be linked to health at all.

In this document, we piece together well-recognised social determinants of health. We look at a range
of existing data, and show how New Zealand could do much, much more to improve people’s health and
wellbeing.

If we really started walking the talk about investing in health we would have:

• plentiful social housing
• a living wage as the minimum income for all
• joined up access to education, social support, and health care
• free primary health care.

Some of the solutions we propose require:

• removing barriers to health care in the community and hospitals, such as user charges
• a much stronger commitment from government to addressing the well-known determinants of ill health,
  such as poverty and poor housing
• establishing a separate Minister and Ministry for Public Wellbeing.

We know there are workforce shortages across the system. We know that we need more medical and dental
specialists. These shortages mean many New Zealanders miss out on timely care. Some are missing out
altogether. A comprehensive workforce strategy and recruitment and retention action plan is urgently needed.

We see Health Matters as a pocket guide for the incoming government – and the next one – and the next.
Because investing in health is a long-term project and cannot be crammed into three-year election cycles.

Long term investment in the social determinants of health will reap rewards for us all.

He waka eke noa… let’s invest in each other.

Sarah Dalton
ASMS Executive Director

                                                                                          HEALTH MATTERS OCTOBER 2020   1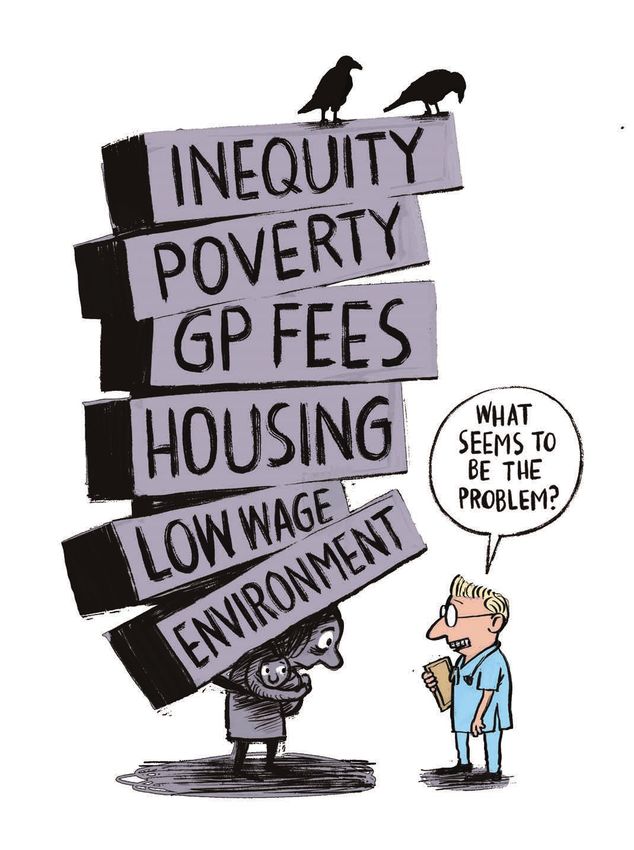
At a glance
        The health system as it stands perpetuates unequal outcomes and is not accessible to a growing number of
        New Zealanders. Addressing unmet need is critical for achieving health equity.

        This Health Matters publication proposes ways to address these through:

        • removing barriers to health care in the community and hospitals, such as user charges.
        • a much stronger commitment from government to address the well-known determinants of ill health,
          many of which lie outside the health system.

        Removing barriers to health care
        • Any aspirations towards health equity will fail while we continue to impose user charges for primary care,
          which have the effect of excluding those with the highest health needs. Reform is also needed to address
          the uneven distribution of general practitioners (GPs) in the country.
        • Workforce shortages across the system, including medical specialists, mean many New Zealanders miss out
          on timely care or miss out altogether. A comprehensive workforce strategy and recruitment and retention
          action plan is needed urgently.

        Addressing the determinants of health
        • Environment: ‘One Health’ approaches are needed to address the failure to predict and halt the
          emergence of Covid-19, and the growing global health threat of antimicrobial resistance, along with the
          threats posed by pollution and climate change.
        • Cultural alienation and institutional racism: Despite many years of government intentions to address
          health inequities for Māori and Pasifika, compared with Europeans, stark inequities remain. The Health and
          Disability System Review’s proposals to address inequities for Māori are seen by some as lacking teeth. The
          Review made no recommendations specific to Pasifika needs. It is clear that the health system continues to
          operate in breach of Treaty of Waitangi obligations.
        • Poverty: Up to a third of child hospital admissions are potentially avoidable. That is close to 70,000 child
          hospitalisations per year, mostly from poorer families.
        • Education: This year’s UNICEF ‘report card’ on child wellbeing ranked New Zealand’s education indicators
          a middling 20th out of 41 OECD countries. Poor education is associated with poor health due to income,
          resources, unhealthy behaviours, deprived neighbourhood, and other socioeconomic factors. Cold, damp
          school buildings also contribute to child ill-health.
        • Employment: The main factor determining adequate income is participation in paid employment.
          Minimum wage rates are inadequate to cover basic necessities. There is growing support for a ‘Living
          Wage’.
        • Unhealthy living: Tobacco, alcohol, and unhealthy foods such as soft drinks and processed foods contribute
          to about one third of premature death and disability, with wide inequities by ethnicity and levels of
          disadvantage.
        The Health and Disability System Review recommendations will not achieve health equity (a key part of its
        brief) because action is required across the whole of government and non-government sectors, which was
        beyond the scope of the Review.

2   HEALTH MATTERS OCTOBER 2020
A social and economic case for investment
There is strong evidence that historical prescriptions for austerity have tended to exacerbate economic
crises. Improved government investments in health and social services, on the other hand, can create
economic growth in the short-term (and therefore play an important part in economic recovery) in addition to
long-term benefits.

    Key recommendations
    • Remove barriers to health care services
    • Adopt a ‘Health in All Policy’ approach
    • Establish a Minister and standalone Ministry for Public Wellbeing
    • Adopt ‘proportionate universalism’ to achieve health equity
    • Fund policies to match wellbeing goals

                                                                                    HEALTH MATTERS OCTOBER 2020   3
Health starts with equity

        Māori
        Despite improvements in some health outcomes for Māori, stark disparities between Māori and non-Māori
        populations remain. This raises questions about the effectiveness of health-related policies to date.

        Currently, official statistics show that compared with the Pākehā population, Māori in general will be poorer,
        more likely to be living in deprived neighbourhoods, less likely to own their own home, and more likely to be
        living in over-crowded conditions. Further, Māori will experience higher levels of discrimination, are more likely
        to leave school with less than NCEA Level 1 qualification, are more likely to be unemployed, more likely to be
        convicted of a criminal offence, are more likely to go to prison than Pākehā for the same types of crime, are
        more likely to smoke, experience alcohol-related harm, and face greater barriers to health care.1, 2, 3, 4

        These factors all have a significant impact on health outcomes for Māori. Further, they contribute to:

        • Māori life expectancy being more than seven years lower than that for non-Māori
        • Mortality rates being higher for Māori than for non-Māori at nearly all ages
        • Māori health status remaining unequal with non-Māori across almost all chronic and infectious diseases as
          well as injuries, including suicide.5, 6

        This health inequity is characteristic for indigenous peoples in colonised countries, even when socioeconomic
        factors are considered. Underlying causes include the loss of land, language, and identity. While colonisation
        is often considered to be a historical event, the wider ramifications of colonisation are passed to current
        generations. For Māori, as with other indigenous peoples, the effects of colonisation are expressed as
        systematic social, political, historical, economic, and environmental determinants of health, accumulated
        during a lifetime.7

        Within the health system itself, studies have consistently demonstrated that doctors treat Māori differently
        from non-Māori, to the detriment of Māori. This bias results in the failure of Māori to receive cardiac
        revascularisation procedures even when clinical need is much greater, as well as evidence of poorer outcomes
        following stroke, obstetric intervention, higher rates of heart failure and asthma.8

        “Whilst moral injury of doctors is a legitimate workplace concern, we must not forget the infinitely worse
        moral injury, indignity and hopelessness that parents experience every time they see their children suffer from
        illnesses caused by relentless poverty and entrenched systemic disadvantage.” – Paediatrician

        In primary care, GP consultation times have been found to be shorter for Māori, and Māori patients are
        referred less often for further investigations than non-Māori.9

        A six-year study on 89,000 New Zealand public hospital patients found Māori were more likely to be
        readmitted or to die within a month of leaving hospital than Pākehā. After adjusting for age and sex, the odds
        of readmission or death were 19% higher for Māori.10

        Initiatives that have been designed to improve the health of Māori include the establishment of Māori
        health care providers, cultural competence training, community-led programmes, and a health literacy focus.

4   HEALTH MATTERS OCTOBER 2020
However, according to some observers these health initiatives are often constrained by systemic inertia
    and an apparent ambivalence towards addressing the underlying causes of Māori health inequities.11 These
    underlying causes include income and poverty, employment and occupation, educational attainment, housing
    and discrimination. Health-damaging behaviour is likely to occur among those who are not financially or
    psychologically secure or live in deprived neighbourhoods.12

    The Health and Disability System Review has proposed a Māori Health Authority to be responsible for
    monitoring and reporting on Māori health outcomes, managing Māori workforce initiatives, controlling Māori-
    specific innovation funds and advising on how to redress inequities in the system. The details of how it would
    work are yet to come. The proposal has been criticised, including from members of the Review panel, for
    lacking teeth.13

                               300      Māori   Pacific   Non Māori, Non-Pacific

                               250
Rates per 100,000 population

                               200

                               150

                               100

                               50

                                0
                                     2009        2010           2011                2012                 2013                 2014                 2015                2016
                                                                                               Years

     FIGURE 1: AMENABLE MORTALITY RATES PER 100,000 POPULATION, AGES 0-74, 2009-2016
    Rates per 100,000 age standardised to WHO world standard population
    Source: Ministry of Health 2019

    1.  Ministry of Social Development. The Social Report 2016 - Te pūrongo oranga tangata, MSD, June 2016.
    2.  Treasury. Statistical Analysis of Ethnic Wage Gaps in New Zealand, Analytical Paper 18/03, September 2018.
    3.  Ministry of Justice. Data Tables 2010-2019.
    4.  Controller & Auditor-General. Summary of our Education for Māori Reports, October 2016.
    5.  Ministry of Health. 2019. Wai 2575 Māori Health Trends Report. Wellington: Ministry of Health.
    6.  Statistic NZ. Ngā Tūtohu Aotearoa – Indicators Aotearoa New Zealand, 2020.
    7.  Hobbs M, Ahuriri-Driscoll A, et al. Reducing health inequity for Māori people in New Zealand (corresp.) The Lancet Vol 394 November 2, 2019.
    8.  ASMS. Path to Patient Centred Care, Health Dialogue Issue 15 March 2018, pp26-31.
    9.  Ibid.
    10. Rumball-Smith J, Sarfati D, Hider P, Blakely T. ‘Ethnic disparities in the quality of hospital care in New Zealand, as measured by 30-day rate of unplanned readmission/
        death’. Int J Qual Health Care. 2013 Jul; 25(3): 248–54.
    11. Hobbs et al (2019).
    12. ASMS (2018).
    13. Health and Disability System Review. 2020. Health and Disability System Review – Final Report – Pūrongo Whakamutunga. Wellington: HDSR.

                                                                                                                                             HEALTH MATTERS OCTOBER 2020           5
Health starts with equity
Pasifika
Compared to all other ethnic groups in New Zealand, Pasifika have significant and persistent disparities in health
outcomes. Pasifika are more likely to live in neighbourhoods of high deprivation, have the lowest household
incomes, higher unemployment rates, the lowest rates of home ownership, and the highest rates of household
crowding.1, 2, 3
These disparities in health and poor health service outcomes for Pasifika have persisted for more than two
decades. The rate of potentially avoidable deaths is twice as high in Pasifika (47.3%) compared to non-Māori,
non-Pasifika (23.2%). Rates of hospitalisation for Pasifika children are higher than all other ethnic groups for
acute and chronic respiratory and infectious diseases and serious skin infections. The rate of hospitalisation for
rheumatic fever is 50 times higher in Pasifika children than Pākehā children.4
There have been no significant improvements in rates of avoidable hospital admissions for Pasifika children
over the last 10 years. Rates for Pasifika adults have improved slightly but remain well above non-Māori, non-
Pasifika rates (Fig 2).
Pasifika also report high rates of unmet need for primary health care - 36% of Pasifika adults compared with
30% of Pākehā adults. Most of this unmet need is related to costs to see a GP.5
The Health and Disability System Review’s final report acknowledges many of these health inequities yet offers
no recommendations specific to Pasifika to address them. This failure has been considered its “most important
omission”.6
10,000 Other Māori Pacific
9,000
Standardised ASH rate per 100,000 population
8,000
7,000
6,000
5,000
4,000
3,000
2,000
1,000
0
2015-16 2016-17 2017-18 2018-19 2019-20
Years
FIGURE 2: STANDARDISED AMBULATORY SENSITIVE HOSPITALISATION (ASH) RATES, 45-64 AGE GROUPS,
2015-JUNE 2020
Source: National Service Framework Library 2020
1. Pacific Perspectives. Health System Review – Pacific Report, Pacific Perspectives Ltd, July 2019.
2. Health and Disability System Review. 2020. Health and Disability System Review – Final Report – Pūrongo Whakamutunga. Wellington: HDSR.
3. Duncanson M, Richardson G, Child Poverty Monitor, NZ Child & Youth Epidemiology Service, University of Otago 2019.
4. Pacific Perspective (2019)
5. Ministry of Health. New Zealand Health Survey 2018/19.
6. Tukuitonga C. Health review leaves Pasifika out in the cold, Newsroom 22 June 2020
6 HEALTH MATTERS OCTOBER 2020Health starts with addressing poverty
Up to a third of child hospital admissions in New Zealand are potentially avoidable.1 That is close to 70,000
child hospitalisations per year, mostly from poorer families. If all those hospitalisations were reduced to equal
those of the least deprived quintile, in 2018/19 avoidable hospitalisations would have been reduced by nearly
40%. While there have been some improvements since 2014/15, the most recent three years have seen
virtually no progress (Fig 3).2
The New Zealand Health Survey 2018/19 shows that of the children in the poorest deprivation quintile:3
• Nearly one in four do not eat breakfast every day
• One in eight eat a fast-food meal three or more times a week
• Nearly one in five consume fizzy drinks three or more times a week
• Nearly one in five have had teeth removed due to decay
• 45% are reported as being overweight or obese
Hospitalisation rates for respiratory conditions for children living in areas with the highest deprivation
levels are three times as high as the hospitalisation rates for children living in areas with the lowest
deprivation levels.
In 2015/16, 22% of children ages 0-15 lived in households reporting that food ran out often or sometimes.4
In 2018 there were an estimated quarter of a million children (23%) living in households with disposable
equivalised income less than 50% of the median after housing costs.
”I have seen diseases in New Zealand children which I have never seen before in my home country like
rheumatic fever and bronchiectasis which are directly linked to poverty.” – Paediatrician
There were approximately 148,000 children (13%) living in households that were unable to afford six or more
essentials for a decent standard of living.5
An estimated 65,000 children (6%) were living in households experiencing severe material hardship with a lack
of nine or more essentials for a decent standard of living.6
The Government has established child poverty reduction targets for each primary measure of child poverty.
Significant acceleration in child poverty reduction is necessary for the Government to meet these targets.7
The Government also launched a Child and Youth Wellbeing Strategy in 2019 taking a ‘proportionate
universalism’ approach to achieving equity, which recognises that all children and young people need support
regardless of their circumstances, but that some need more support than others. (Fig 4).8
Proportionate universalism is recommended by ASMS as an approach to achieving health equity for the whole
population.
HEALTH MATTERS OCTOBER 2020 7120
2014/15 2015/16 2016/17 2017/18 2018/19
100
Rates per 1,000 children
80
60
40
20
0
Q1 Q2 Q3 Q4 Q5
FIGURE 3: STANDARDISED POTENTIALLY AVOIDABLE HOSPITALISATION RATES PER 1,000 CHILDREN AGED 0-15
BY DEPRIVATION QUINTILES (2014/15 - 2018/19)
Source: Child Poverty Related Indicators Report, July 2020
90
80 HOW ‘PROPORTIONATE UNIVERSALISM’ AIMS TO
ACHIEVE HEALTH EQUITY (INDICATIVE)
Hospitalisations per 1,000 children
70
60
50
40
30
20
10
0
Q1 Q2 Q3 Q4 Q5
FIGURE 4: STANDARDISED POTENTIALLY AVOIDABLE HOSPITALISATION RATES PER 1,000 CHILDREN
DEPRIVATION QUINTILES 2018/19
Source: Child Poverty Related Indicators Report, July 2020
1. Hobbs M, Tomintz M, et al. Investigating the rates and spatial distribution of childhood ambulatory sensitive hospitalisations in New Zealand. GeoHealth Laboratory: A
report commissioned by the Ministry of Health, October 2018
2. Ardern J. Child Poverty Related Indicators Report, Department of the Prime Minister and Cabinet, July 2020
3. Ministry of Health. New Zealand Health Survey 2018/19.
4. Ardern J. Child Poverty Related Indicators Report, Department of the Prime Minister and Cabinet, July 2020.
5. Duncanson M, Richardson G, et al. Child Poverty Monitor, New Zealand Child and Youth Epidemiology Service, University of Otago, 2019.
6. Ministry of Health. Health and Independence Report 2018: Ministry of Health, June 2020.
7. Duncanson M, Richardson G, et al. Child Poverty Monitor, New Zealand Child and Youth Epidemiology Service, University of Otago, 2019.
8. Child and Youth Wellbeing Strategy 2019, Department of the Prime Minister and Cabinet, Aug 2019.
8 HEALTH MATTERS OCTOBER 2020Health starts in our environment
The World Health Organisation (WHO) defines environment, as it relates to health, as “all the physical,
chemical, and biological factors external to a person, and all the related behaviours”.1 Environmental health
consists of preventing or controlling disease, injury, and disability related to the interactions between people
and their environment.
Maintaining a healthy environment is central to increasing quality of life and years of healthy life.
Environmental factors are diverse and far reaching. They include:
• exposure to hazardous substances in the air, water, soil, and food
• natural and technological disasters
• climate change
• occupational hazards
• the built environment
Poor environmental quality has its greatest impact on people whose health status is already at risk. Therefore,
environmental health must address the societal and environmental factors that increase the likelihood of
exposure and disease.2
The adverse health effects of many environmental issues, particularly those associated with the growing
threat posed by climate change, emphasise the critical need for whole-of-government policy approaches.
Alongside the health impacts of climate change, recent experiences with Covid-19 and growing concern with
antimicrobial resistance highlight the need to be better prepared for future global health crises and reinforce
the critical importance of improving collaboration and effective resourcing.
“Health and wellbeing are not created in doctors’ offices or in hospitals. I am an intensive care doctor, but
I know that for most people who end up with me they do so because of an embedded series of failures
beforehand.” – ICU Specialist
One specific approach which promotes interdisciplinary collaboration on environmental health issues is ‘One
Health’. Adopted by many major health agencies including the WHO, the focus of One Health is a whole of
ecosystem approach to health. In recent times, this joined up approach continues to garner support in light
of failures to predict and halt the emergence of Covid-19.3 Three areas of work have been highlighted as
requiring a One Health approach:
• food safety
• the control of zoonoses (diseases that can spread between animals and humans)
• combatting antibiotic resistance
In the New Zealand context, the threat of growing antibiotic resistance continues to be a significant area of
concern. In heavily redacted government documents released to the New Zealand Herald in 2019, officials
advised Ministers that:
“[antibiotic resistance] is a ‘One Health’ issue which requires a coordinated response across the human health,
animal health, food and agricultural sectors. If we do not successfully address this threat now, there are likely
HEALTH MATTERS OCTOBER 2020 9to be wide-ranging impacts for New Zealand. The ability to treat infections in humans, animals and in the
wider agriculture sectors will affect all New Zealanders, but the most vulnerable will be Māori and Pacific
peoples, children, the health-impaired and the elderly.”4, 5
Attempts to develop and promote One Health approaches in New Zealand operate from a network of medical
and veterinary researchers known as One Health Aotearoa. They face challenges that “demand new ways of
collaboration across boundaries and knowledges”.6
One Health Aotearoa’s priorities are antimicrobial resistance, freshwater quality, and emerging infectious
diseases. They say that climate change and ecosystem disruption is a cross cutting theme to which the three
projects need to respond.
An ‘action plan’ to improve infection control and public education concerning antimicrobial resistance in New
Zealand was launched in 2017 but by 2018 was already being scaled back due to lack of funding.
The action plan is funded from within existing budgets of the Ministry of Health and Ministry for Primary
Industries. No increases in funding to address the shortfall are indicated in either the 2019 or 2020 Budgets.
1. World Health Organisation. Preventing disease through healthy environments. Geneva, Switzerland: WHO; 2006, p22
2. The Office of Disease Prevention and Health Prevention. https://health.gov/about-odphp
3. Garine-Wichatitsky Binot M, et al. Will the COVID-19 crisis trigger a One Health coming-of-age? The Lancet Vol 4, e377-8, September 2020.
4. Jones N. Exclusive: Kiwi war on superbugs downsized NZ Herald, 5 July 2019.
5. Ministry of Health and Ministry for Primary Industries. Aide-memoir to the Ministers of Health and Primary Industries: New Zealand’s Antimicrobial Resistance Action
Plan: Progress and priority for delivering over the next four years, 19 October 2018
6. Harrison S, Baker M, et al. One Health Aotearoa: a transdisciplinary initiative to improve human, animal and environmental health in New Zealand, One Health Outlook
(2020) 2:4.
10 HEALTH MATTERS OCTOBER 2020Health starts with education
Education is a fundamental social determinant of health. Reducing health disparities and improving population
health can only be accomplished through a comprehensive understanding of the health benefits conferred by
education.1
Poor education is associated with poor health due to income, resources, unhealthy behaviours, deprived
neighbourhoods, and other socioeconomic factors. In turn, poor health is associated with educational setbacks
and interference with schooling through learning disabilities, absenteeism, or cognitive disorders.2, 3
Breaking this circle of disadvantage requires cross-sector national policies that recognise the dual role of
education — as a driver of opportunity as well as a reproducer of inequality.4
The health benefits of education are at the grass roots level - enabling people to develop a broad range of
skills and traits that predispose them towards improved health outcomes. People with more education are
likely to have better health literacy, live longer, experience better health outcomes, practice health promoting
behaviours, and obtain timely health check-ups.5, 6
Countries that adopt policies for the improvement of education also reap the benefits of healthy behaviours
such as reduced rates of smoking and obesity.
Unhealthy school buildings
Cabinet papers released in 2018 show a third of school buildings in New Zealand did not meet optimum
standards for health and hygiene. A similar number fell short of Ministry of Education standards for lighting,
temperature and acoustics.7 Later that year the Education Minister Chris Hipkins was reported as saying that
due to years of under-investment at least $200 million worth of school buildings were not fit for purpose and
would have to be knocked down.8 He said the government wanted to bring all school buildings up to scratch by
2030 and that would cost about $1 billion a year for the following 10 years. As recently as September 2020, a
New Zealand Herald report highlighted the health hazards of damp and mouldy schools raising questions as to
how such conditions had been allowed to develop.9
This year’s UNICEF ‘report card’ on child wellbeing ranked New Zealand’s education indicators a middling 20th
out of 41 OECD countries.10
1. Raghupathi, V., Raghupathi, W. The influence of education on health: an empirical assessment of OECD countries for the period 1995–2015. Arch Public Health 78,
20 (2020).
2. Ibid.
3. Hahn RA, Truman BI. Education Improves Public Health and Promotes Health Equity. Int J Health Serv. 2015;45(4):657–78.
4. Zajacova A, Lawrence E. The Relationship Between Education and Health: Reducing Disparities Through a Contextual Approach, Annu. Rev. Public Health 2018.39:
273-289
5. Luy M, Zannella M, et al. The impact of increasing education levels on rising life expectancy: a decomposition analysis for Italy, Denmark, and the USA, Genus, (2019)
75:11
6. AMA. Health in the Context of Education – 2014. Australian Medical Association, 6 May 2014. https://ama.com.au/position-statement/health-context-education-2014
7. Gerritsen J. Third of school buildings fall short on health and hygiene, Radio NZ, 9 July 2018.
8. NZ Herald. $200m in school buildings unusable, will have to be demolished, NZ Herald, 10 April 2018.
9. Fallon V. ‘Would the PM send Neve here?’: The sodden horror of a decile 1 school, Stuff, 5 September 2020.
10. UNICEF Innocenti, ‘Worlds of Influence: Understanding what shapes child well-being in rich countries’, Innocenti Report Card 16, UNICEF Office of Research – Innocenti,
Florence, 2020
HEALTH MATTERS OCTOBER 2020 1112 HEALTH MATTERS OCTOBER 2020
Health starts in our homes
The quality and affordability of housing are key contributors to health and wellbeing. New Zealand has the
least affordable metropolitan housing among six comparable countries.1 An average house costs six to eight
times more than the average household income. Three times an average household income is considered
affordable.2 Housing costs continue to rise faster than incomes and keep families trapped in cycles of poverty
with insufficient income to meet other basic needs.3, 4

Housing unaffordability means more people rent. Rental dwellings are more likely to be cold, damp, mouldy,
and in greater need of repair.5

An estimated 600,000 New Zealand homes are poorly insulated, and many are inadequately heated.6 Table 1
shows the number of housing-related hospitalisations experienced each year in New Zealand. Statistics also
show poor housing conditions including overcrowding and associated disease transmission contribute to a
further 116,000 injuries, some of which will require hospital admission.7

“No matter how good I am as a paediatrician, no matter how good our nurses are, no matter how good the
inpatient care in hospital can be, I am discharging three in every four kids back to cold and damp homes. Which
is the main reason they ended up in hospital in the first place.” – Paediatrician

Around 6,000 children are admitted each year for housing-sensitive hospitalisations. These children are nearly
four times more likely to be re-hospitalised and 10 times more likely to die in the following 10 years than other
children.8 Various initiatives have been introduced to address the lack of housing and poor housing standards.
The general consensus from housing commentators is that more and better housing is needed, along with
greater, more sustainable funding to improve current poor standards.

TABLE 1: ESTIMATED ANNUAL HOUSING-RELATED HOSPITALISATIONS

     Cause                                                                                                                           Number            Bed nights
     Attributed to household crowding (est. 10% of population)                                                                            1,005                3,612
     Attributed to damp/mouldy homes                                                                                                      6,276              36,649
     Attributed to cold homes                                                                                                                625               1,834
     Total                                                                                                                                7,906              42,095

Source: Motu Economic and Public Policy Research and the University of Otago, 2019

1.    UK, USA, Australia, Canada, Ireland, New Zealand (Hong Kong and Singapore were also surveyed)
2.    Demographia. 16th Annual Demographia International Housing Affordability Survey: 2020.
3.    Riggs L, Howden-Chapman P, et al. New Zealand’s Burden of Disease from Housing, Motu Economic and Public Policy Research; University of Otago, Wellington School of
      Medicine, Department of Public Health, March 2019.
4.    Ministry of Social Development (MSD). The Social Report 2016, Te pūrongo oranga tangata, MSD, June 2016.
5.    Riggs et al (2019)
6.    Telfar-Barnard L, Bennett J, et al. Evidence base for a housing warrant of fitness, SAGE Open Medicine Volume 7: 1–7, 2019.
7.    Riggs et al (2019)
8.    Walls J. Housing Minister Phil Twyford unveils new standards for all NZ rental homes, NZ Herald, 24 February 2019.

                                                                                                                                 HEALTH MATTERS OCTOBER 2020                13
14 HEALTH MATTERS OCTOBER 2020
Health starts with our lifestyle
Unhealthy commodities – tobacco, alcohol, and unhealthy foods such as soft drinks and processed foods
that are high in salt, fat, and sugar – are leading risk factors for chronic non-communicable diseases. These
commodities contribute about one third of the overall preventable health loss (through premature death
and disability) in New Zealand, with wide inequities by ethnicity and levels of disadvantage. The following
references the work of Health Coalition Aotearoa.1

Smoking
The number of New Zealanders who smoke has dropped significantly over the past 20 years. However, tobacco
use continues to take a catastrophic toll on New Zealanders, resulting in considerable suffering, debilitating
diseases, and premature death. While overall smoking rates are reducing in New Zealand, large disparities
remain. New Zealand is not on track to achieve the Government’s target of 2025 Smokefree Aotearoa, set at
less than 5% smoking prevalence.

Alcohol
At least 5% of premature death and disability in New Zealand is attributable to alcohol. Alcohol also reduces
wellbeing through its social effects. New Zealand is not on track to achieve a WHO target of a 10% relative
reduction in the harmful use of alcohol.

Unhealthy food
Unhealthy diet and high BMI (overweight or obese) are the largest preventable risk factors in New Zealand.
Jointly they account for 17.5% of premature death and disability. New Zealand is not on track to meet the
WHO targets of no increase in adult obesity and diabetes from 2010 levels.

Further, the consumption of sugary drinks is associated
with dental caries, as well as weight gain and obesity.
Dental caries is a continuing and significant health problem                                                        Tobacco
                                                                                                                      9%
in New Zealand.                                                                                         High BMI
                                                                                                        (obesity)
                                                                                                           9%
                                                                                                     Unhealthy
                                                                                                       diet
                                                                                                        9%                             Other
                                                                                                     Alcohol                            68%
                                                                                                       5%

                                                                                                    FIGURE 5: PREVENTABLE PREMATURE
                                                                                                    DEATH AND DISABILITY IN NEW ZEALAND

1.   Health Coalition Aotearoa. https://www.healthcoalition.org.nz/
2.   New Zealand Dental Association. https://www.nzda.org.nz/public/our-initiatives/sugary-drinks

                                                                                                                        HEALTH MATTERS OCTOBER 2020   15
Health starts with employment
Participation in paid employment is an important determinant of health. In addition to providing income,
employment enhances social status and improves self-esteem, provides social contact and a way of
participating in community life, and increases opportunities for regular activity, which all help to enhance
individual health and wellbeing.1
However, being able to enjoy these benefits depends on an income which is sustainable. New Zealand’s
wages are low among comparable countries (Fig 6). Many workers are on minimum wage rates which is
currently $18.90 an hour before tax. Some social researchers have assessed this as inadequate to cover basic
necessities, sparking the ‘Living Wage Movement’. The current minimum ‘Living Wage’ is $22.10 an hour,
which some employers have committed to paying.2, 3, 4
While well-paid employment is important for good health, some workplaces expose workers to health risks
such as injury – an issue that is not improving (Fig 7).
16 HEALTH MATTERS OCTOBER 202070,000
60,000
50,000
40,000
PPP US$
30,000
20,000
10,000
0
New Zealand
Canada
France
Sweden
United
Kingdom
Germany
Norway
Australia
Netherlands
United
States
Switzerland
FIGURE 6: AVERAGE ANNUAL WAGE IN 11 COUNTRIES, 2019 (PURCHASING POWER PARITY5 USD)
Source: OECD Statistics 2020
14.0
12.0
10.0
Injuries/1000 FTEs
8.0
6.0
4.0
2.0
0
2010 2011 2012 2013 2014 2015 2016 2017 2018
FIGURE 7: CLAIMS FOR WORK-RELATED INJURIES RESULTING IN MORE THAN A WEEK AWAY FROM WORK
Source: ACC 2020
1. National Health Committee. The Social, Cultural and Economic Determinants of Health in New Zealand: Action to Improve Health. A Report from the National Advisory
Committee on Health and Disability (National Health Committee), June 1998.
2. King P, Waldegrave C. Report of an investigation into defining a living wage for New Zealand, Family Centre Social Policy Research Unit, commissioned for The Living
Wage Campaign, December, Living Wage Aotearoa New Zealand, 2012.
3. Waldegrave C, King P, Urbanová, M. Report of the Measurement Review for a New Zealand Living Wage, Living Wage Movement Aotearoa, 2018.
4. Waldegrave, C. Living Wage Rate Update 2020/21.
5. Purchasing Power Parity equalises the purchasing power of different currencies, taking into account the relative cost of living and inflation rates in different countries.
HEALTH MATTERS OCTOBER 2020 17Health starts with access to primary care
Barriers to primary care result in barriers to hospital care. While free access to GPs for under-14s has improved
primary care access for children, many adults continue to miss out, especially those with greatest need (Figs 8
& 9).1 Those with the greatest need - the poorest, Māori and Pasifika - have higher primary care-preventable
hospitalisation rates than other groups.2
Despite countries such as the UK providing free GP services, the recent Health and Disability System Review
has not recommended removing fees, saying that occurs only “in an ideal world”.3 The Review states “service
fees are just one of many barriers to access and removing co-payments would not guarantee equitable access
to services...” and “extending the reduction of co-payments would disproportionately benefit higher-income
households.” This is contrary to the indications in Figures 8 & 9.4
There are compelling health reasons why GP fees must be removed. Other cost barriers (such as prescription
charges and dental fees) also require attention, and a solution necessarily involves the social welfare and
other sectors.5
Reform is also needed to address the uneven distribution of GPs. Under the current small-business model for
primary care, Nelson-Marlborough for example, has almost twice the number of GPs per capita as Manawatū
and the West Coast.6
“Health care access problems we see include availability of affordable after-hours primary care, access to
prescription medications and limited hospital outpatient clinic capacity.” – Emergency medicine specialist
25 25
20 20
Percentage
Percentage
15 15
10 10
5 5
0 0
European/
Quintile 1
Quintile 2
Quintile 3
Quintile 4
Quintile 5
Other
Pacific
Māori
Asian
FIGURE 8: ADULTS REPORTING UNMET NEED FOR FIGURE 9: ADULTS REPORTING UNMET NEED FOR
GP SERVICE DUE TO COST GP SERVICES DUE TO COST, BY ETHNICITY
Source: NZ Health Survey 2018/19
1. Ministry of Health. New Zealand Health Survey 2018/19.
2. Craig E, Anderson P, et al. Measuring potentially avoidable and ambulatory care sensitive hospitalisations in New Zealand children using a newly developed tool. NZMJ 30
October 2015, Vol 128 No 1424
3. Gould R, Atmore C, et al. The ‘elephants in the room’ for New Zealand’s health system in its 80th anniversary year: general practice charges and ownership models, NZMJ
1 February 2019, Vol 132 No 1489
4. Health and Disability System Review. 2020. Health and Disability System Review – Final Report – Pūrongo Whakamutunga. Wellington: HDSR. p122
5. Loh L, Trevallyan S, et al. The case for a systematic policy approach to free primary health care for vulnerable groups in New Zealand, NZMJ 30 October 2015, Vol 128 No 1424.
6. MCNZ. The New Zealand Medical Workforce in 2016. (Data for 2017 and 2018 is more limited due to reduced response rates to the MCNZ Medical Workforce Surveys.)
18 HEALTH MATTERS OCTOBER 2020Health starts with access to hospital care
Hospitals have a crucial role to play in reducing health inequities. The burden associated with avoidable
mortality means the health system in its own right can be considered a determinant of health.1
Access to hospital care in New Zealand compares poorly against international health systems.2
Of 11 comparable countries, New Zealand ranks:
• 7th for emergency department waiting times
• 9th for waiting times for elective surgery
• 10th= for access to specialist tests (e.g. CT, MRI scans)
• 9th for waiting times for a specialist appointment
• 11th for waiting times treatment after diagnosis (Fig 10)
Pre-Covid, it was estimated that 448,000 New Zealanders had unmet need for hospital care.3 An estimated
additional 180,000 hospital procedures were reported to have been delayed due to the Covid lock-down.4 The
causes of unmet need include, among many other things:
Under-investment in the public health system spanning many years.
Insufficient hospital beds: The numbers of acute beds and psychiatric beds per capita are among the lowest in
OECD countries, leading to bed occupancy rates that are often well above accepted safety levels.5 The number
of intensive care beds per population is also well behind comparable countries.6
An estimated 24% shortfall of DHB-employed senior doctors, based on assessments by clinical heads of
departments.7
NZ
UK
Sweden
Australia
Canada
Norway
Germany
France
Netherlands
US
Switzerland
0 5 10 15 20 25 30 35
Percentage of survey respondents
FIGURE 10: PERCENTAGE OF DOCTORS SURVEYED REPORTING LONG HOSPITAL TREATMENT WAIT TIMES
BY COUNTRY
Source: Commonwealth Fund 2017
1. Walsh M, Grey C. The contribution of avoidable mortality to the life expectancy gap in Māori and Pacific populations in New Zealand—a decomposition analysis NZMJ 29
March 2019, Vol 132 No 1492
2. Schneider E, Sarnak D, et al. Mirror, Mirror 2017: International Comparison Reflects Flaws and Opportunities for Better US Health Care, Commonwealth Fund, July 2017.
3. ASMS. Hospitals on the Edge, pp12-13, November 2019
4. Witton B. Backlog of people still waiting for diagnosis because of Covid-19 delays, Stuff, 5 September 2020.
5. OECD Health Data 2020.
6. Neilson M. Coronavirus: New Zealand’s intensive-care capacity well behind other nations, NZ Herald, 18 March 2020.
7. ASMS. Surveys of clinical leaders on Senior Medical Officer (SMO) staffing needs. https://www.asms.org.nz/publications/researchbrief/
HEALTH MATTERS OCTOBER 2020 19Health starts with social and economic investment
For many years it was widely believed that people’s health was largely driven by their country’s wealth.
What is now suggested is the opposite, health and social equity are drivers of wealth. The OECD says New
Zealand’s stark rich-poor divide, for example, had taken over a third off the country’s economic growth rate
between 1990 and 2010, due in part to under-investment in human capital, including education and skills
development.1, 2, 3, 4
Health, education, and social sectors contribute to wealth by creating a healthier, better educated, and
therefore more productive labour force. They also create jobs, many of which are largely recession-proof,
the needs for health care and education, for example, do not fall off simply because an economy is ailing.5, 6
Furthermore, analysis of spending by government sector indicates considerable economic gains from
government spending in areas such as health, education, and the environment. A study based on 25 European
countries estimated that every government dollar spent on health services generated more than four dollars
in the domestic economy, largely through the creation of jobs and income. Spending on education and the
environment saw eight-fold returns on investment, while spending on social protection generated nearly three
dollars for every government dollar.7
“I well remember a child who needed frequent, 3 week-long admissions for bronchiectasis, but whose parents
and whanau never came to see him during these times. After they were given a fridge, and got regular food
parcels, they started visiting lots whenever he was in hospital. And it dawned on me just how crippling their
hunger must have been to have stopped them coming previously.” – Paediatrician
These results corroborate existing evidence that suggest austerity measures have tended to exacerbate
economic crises. Improved government investments can create economic growth in the short-term and
therefore play an important part in economic recovery in addition to creating long-term benefits.8
Eliminating health inequities is a core public health principle providing not only benefits to wellbeing but also
the broader economic benefits to society. But it means the long-term under-investment in health and the
social determinants of health must be reversed.
A good point of comparison for the Government’s vision for New Zealanders’ equality and wellbeing outlined
in its “Wellbeing Budgets”, are Denmark, Norway, and Sweden. In 2018 all three countries were ranked in the
top seven in the United Nations Development Programme’s inequality-adjusted human development index.
New Zealand was ranked 18th.
Their health and social care workforces, as a proportion of their total workforces, are 40% to 90% greater
than New Zealand’s (Fig 11). Their government health spending as a proportion of GDP averaged 8.9% in 2018
compared with New Zealand’s 7.4%. New Zealand Government health spending in 2018 would have needed to
be $4.4 billion higher to have matched the Scandinavian average. Their levels of government social spending
are also markedly higher (Fig 12).
20 HEALTH MATTERS OCTOBER 202025 Denmark Norway Sweden New Zealand
20
% of total employment
15
10
5
0
2013 2014 2015 2016 2017 2018
FIGURE 11: HEALTH AND SOCIAL EMPLOYMENT AS A PERCENTAGE OF TOTAL EMPLOYMENT FOR
SCANDINAVIAN COUNTRIES AND NEW ZEALAND, 1980 TO 2018.
Source: OECD 2020
35 Denmark Norway Sweden New Zealand
30
25
20
% of GDP
15
10
5
0
1980 1985 1990 1995 2000 2005 2010 2015 2016 2017 2018
FIGURE 12: PUBLIC SOCIAL EXPENDITURE TRENDS FOR SCANDINAVIAN COUNTRIES AND NEW ZEALAND,
1980 TO 2018
Source: OECD 2020
1. Cingano F. Trends in Income Inequality and its Impact on Economic Growth, OECD Social, Employment and Migration Working Papers No. 163: 2014. 4
2. Conference Board of Canada. Health Care in Canada: An Economic Growth Engine, Canadian Alliance for Sustainable Health Care, January 2013.
3. Bloom D, Canning D. Epidemics and Economics, Programme on Global Demography of Aging, Working Paper No. 9: 2006, Harvard School of Public Health.
4. Monterubbianesi P, Grandes M, et al. New evidence of the health status and economic growth relationship, January 2016 Panoeconomicus 64(00):20-20
5. Ibid
6. WHO. Healthy, prosperous lives for all: the European Health Equity Status Report. Copenhagen: WHO Regional Office for Europe; 2019.
7. Reeves A, Basu S,et al. Does investment in the health sector promote or inhibit economic growth? Globalization and Health 2013, 9:43.
8. ASMS. Reality check: The myth of unsustainable health funding and what Treasury figures actually show, Health Dialogue, Issue 9, August 2014.
HEALTH MATTERS OCTOBER 2020 2122 HEALTH MATTERS OCTOBER 2020
Recommendations

• Remove barriers to health care services
  This requires building the capacity of the system to meet increasing health needs. In primary care, it also
  requires the elimination of user charges and new funding arrangements for primary care practitioners to
  compensate for the loss of income.

• Adopt a ‘Health in All Policy’ approach
  In addition to health promotion and other health focused activities in government, we encourage the
  adoption of a more encompassing approach to health such as the WHO’s Health in All Policy (HiAP). This
  approach aims to have good health as an outcome of all policies. This requires multisectoral action with
  a focus on achieving health equity. It encourages consideration of the policy’s impact on people’s health
  regardless of the primary aim of the policy in question.

  This shift in emphasis requires strong working relationships between government health policymakers,
  politicians, and other policy makers, including those working in other government and non-government
  organisations. It further recognises, while other sectors can serve the goals of health, health can also
  determine the goals of other sectors.

  According to the WHO: “HiAP is unlikely to thrive if there is no institutional or organisational presence in
  favour of it within the government”1. There must be a critical mass of people with time, funding, and skills
  to engage with the health sector, but also to strive beyond health, to build knowledge and evidence base
  for policy development and effective multisectoral action.

• Establish a Minister and standalone Ministry for Public Wellbeing
  The public health community has long been arguing for a single independent body to oversee population
  health measures in New Zealand. There is a need for comprehensive partnerships and whole-of-
  government action to be driven through Cabinet. A Minister for Public Wellbeing supported by a Ministry
  is vital. It would provide technical, economic, legal and policy resources to develop and implement public
  health policy, while facilitating a much stronger integrated approach to policymaking and implementation,
  including ‘Health in All Policy’ approaches.

  The critical need for strong cross-government action to address the social determinants of health is
  acknowledged by the Health and Disability System Review. Unlike our proposal for a single Ministry of
  Public Health, it proposes that responsibilities for the social determinants of health are spread across all
  parts of the system, led by the Ministry of Health. This current fragmented approach does not appear to be
  working and similar approaches have not worked in other jurisdictions.

  There are precedents for a whole-of-government public health strategy. Sweden, for example, regarded as
  one of the world’s leaders on public health (pre-Covid) had a clear focus on wider determinants of health
  15 years ago. A key feature was a Minister for Public Health whose role was to coordinate policies and
  actions with other Ministers and oversee an inter-sectoral National Steering Group for implementing the
  policies, including the directors-general of all the relevant government agencies.2, 3, 4

                                                                                     HEALTH MATTERS OCTOBER 2020   23
• Adopt ‘proportionate universalism’ to achieve health equity
Proportionate universalism is a term which encompasses universal health care with a scale and intensity
that is proportionate to the level of need across a population. This is a different approach to solely targeting
the least disadvantaged groups. It aims to improve the health of the whole population while simultaneously
improving the health of the most disadvantaged, faster.5
Targeting sections of the population, whether by age, ethnicity, or deprivation level, can be problematic as
it can miss those with high health needs outside of the target groups. The same risk applies when health
care is rationed according to clinical ‘thresholds’ which more often reflect funding pressures. Further,
targeting may address the consequences of inequities rather than their causes.
Proportionate universalism, strongly supported by the Prime Minister in the 2019 Child and Youth
Wellbeing Strategy, implies a need for action across the whole of society, focusing on those social factors
that determine health outcomes.6
By contrast, ‘universal’ health systems, based on the philosophy of equal access, do not provide universal
benefits. Universal policies in practice tend to favour those who are already in advantaged positions while
failing to improve the circumstances of those living in disadvantaged conditions.
• Fund policies to match wellbeing goals
As outlined in this publication, the evidence and lessons from the past reveal fiscal policies, based on
developing population wellbeing, offer the best chance to build a better social and economic future.
Policies based on austerity measures, by contrast, exacerbate economic crises and result in worsening
health and social inequities.
We recommend that future policies which have bearing on long term social and health outcomes are
prioritised and adequately funded with cross party support. Health needs to be viewed as a long game and
the social determinants of health recognised and prioritised accordingly. We encourage a whole of health
approach with priority-setting and investment which goes further than political cycles or the makeup of the
elected government of the day.
1. World Health Organisation. Helsinki Statement on Health in All Policies: Framework for country action, WHO 2014.
2. Persson-Göransson E. Public health policy of Sweden – building a strategy based on wider determinants of health; presentation to the 6th Global Conference of Health
Promotion, Ministry of Health and Social Affairs, Sweden, August 2005.
3. Raphael D. The state’s role in promoting population health: Public health concerns in Canada, USA, UK, and Sweden, Health Policy 78 (2006) 39–55.
4. Corbett S. Ministry for the Public’s Health: an imperative for disease prevention in the 21st century? MJA, Vol 183 No 5, 5 September 2005.
5. Marmot M. Fair Society, Healthy Lives: The Marmot Review: Strategic review of health inequalities in England post-2010. London: The Marmot Review.
6. Office of the Minister for Child Poverty Reduction and Office of the Minister for Children. Child Wellbeing Strategy – Scope and Public Engagement Process: Proposal for
the Cabinet Social Wellbeing Committee, 6 August 2018.
24 HEALTH MATTERS OCTOBER 2020You can also read