State and trends in the diversity, abundance and distribution of birds in Upper Hutt City - May 2018
←
→
Page content transcription
If your browser does not render page correctly, please read the page content below
State and trends in the diversity, abundance and
distribution of birds in Upper Hutt City

May 2018

                                               1
State and trends in the diversity, abundance and distribution of birds in Upper Hutt City.

Nikki McArthur1, Jonathan Walter2 and Samantha Ray1

1                                                        2
Wildlife Management International Ltd                     C/- Greater Wellington Regional Council
PO Box 607                                                Shed 39
Blenheim 7240                                             2 Fryatt Quay
New Zealand                                               Pipitea
www.wmil.co.nz                                            Wellington 6011

This report was prepared by Wildlife Management International Limited for Greater Wellington
Regional Council in fulfilment of the Contract for Services dated 20th October 2017.

30th May 2018

Citation:
This report should be cited as:

McArthur, N.; Walter, J. and Ray, S. 2018. State and trends in the diversity, abundance and
distribution of birds in Upper Hutt City. Client report prepared for Greater Wellington
Regional Council. Wildlife Management International Ltd, Blenheim.

All photographs in this report are copyright © WMIL unless otherwise credited, in which case the
person or organization credited is the copyright holder.

Cover Image: Whitehead (Mohoua albicilla). Photo credit: Jared Le Roy/New Zealand Birds Online
(http://nzbirdsonline.org.nz/).
EXECUTIVE SUMMARY

Five-minute bird counts have been carried out at 45 bird count stations situated in native forest
habitat in six selected Upper Hutt City parks and reserves each year between 2011 and 2017. The aim
of these surveys is to monitor trends in the diversity, abundance and distribution of native forest birds
in Upper Hutt City’s reserve network, to provide a measure of local biodiversity management
outcomes.
Between 26 and 37 bird species were detected during these bird counts each year, with approximately
half of these species being native species and half being introduced and naturalised species. There
has been little change in the number of native forest bird species detected in Upper Hutt reserves
between 2011 and 2017, suggesting that the environmental management of these reserves is
succeeding in maintaining native species diversity. However, both rifleman and kakariki (red-crowned
parakeet) are only present in very small numbers in one or two of the reserves surveyed, so may not
be present in sufficient numbers to maintain viable populations in the long term. Both Keith George
Memorial Park and Wi Tako Reserve once again emerge as important reserves in Upper Hutt City, as
each supports populations of the majority of native forest bird species detected during these counts.
During the 2016 counts, riflemen were detected for the first time in Keith George Memorial Park, and
this is possibly the first time that this species has been recorded in this reserve for over 90 years.
By combining five-minute bird count data from this survey with bird distribution data collected by
local citizen scientists we have been able to map the distribution of birds in Upper Hutt City in much
greater detail than previously. This mapping has revealed that the north-eastern portion of Keith
George Memorial Park and the southern portion of Wi Tako Reserve both support higher numbers of
tomtits, fantails, whiteheads and bellbirds than remaining portions of both reserves. This suggests
that the north-eastern and southern portions of these two reserves provide particularly high quality
habitat for these native species, likely due to the presence of mature stands of both black and hard
beech.
We recommend that these bird counts be continued on an annual basis to provide a consistent,
repeatable measure of trends in bird diversity, abundance and distribution in Upper Hutt City. We
also recommend that Upper Hut City Council considers investing additional resources towards further
encouraging local ‘citizen scientists’ to report bird observations from suburban areas and other parks
and reserves around the city using online biodiversity reporting tools. Furthermore, we recommend
that artificial rifleman nest boxes should be installed in both Keith George Memorial Park and Wi Tako
Reserve to improve the nesting success of the small, relict population present in each reserve, and
that consideration be given to carrying out supplementary riflemen translocations to improve the
viability of these two populations.

Keywords: Upper Hutt City, five-minute bird count, bird abundance, Wi Tako Reserve, Keith George
Memorial Park, citizen science, eBird, NatureWatch.

                                                                                                        i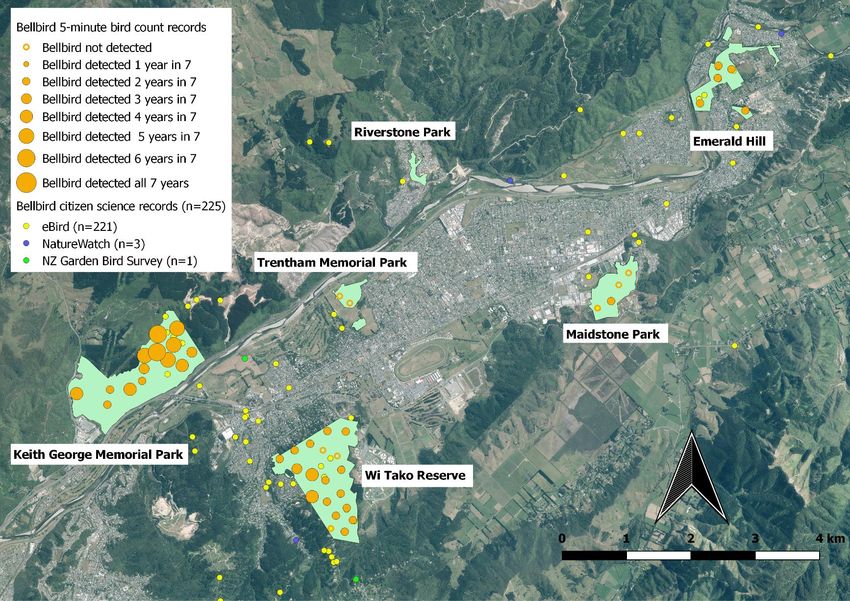
ii
1.        INTRODUCTION

Annual bird monitoring is carried out in a number of parks and reserves in Upper Hutt City to monitor
trends in the diversity, abundance and distribution of native birds in these reserves. Bird monitoring
in Upper Hutt began in 2005 when five-minute bird count stations were established in Keith George
Memorial Park as part of Greater Wellington Regional Council’s Key Native Ecosystem programme
(Stephens et al, 2007). In 2006 and 2007, bird count stations were installed in a further six parks and
reserves around Upper Hutt to provide a more detailed picture of city-wide trends in bird distribution
and abundance (Figure 1.1).
The results of the first six years of bird counts have been reported in Stephens et al, (2007); Fea &
Moylan (2008) and Govella et al, (2011). These authors reported that native bird diversity and
abundance tended to be greater in the larger reserves with better habitat connectivity to surrounding
areas of native or exotic forest habitat. Fantail (Rhipidura fuliginosa), tui (Prosthemadera
novaeseelandiae), grey warbler (Gerygone igata) and silvereye (Zosterops lateralis) were the five most
frequently encountered native bird species. Keith George Memorial Park emerged as a particularly
important site for native birds in Upper Hutt because it was the only reserve sampled that supported
large populations of both whitehead (Mohoua albicilla) and tomtit (Petroica macrocephala).
In 2011 this bird monitoring programme was replaced with a new survey designed to monitor changes
in the apparent abundance of native forest birds across the entire network of selected reserves, rather
than attempt to compare indices of abundance between individual reserves (McArthur et al, 2012).
Tui were chosen as a key focal species for this new survey design due to their conspicuousness and
popularity with the general public. Based on a power analysis of the pre-2011 data, a sample size of
90 five-minute bird counts was selected to ensure sufficient statistical power to detect a 25% or more
change in the relative abundance of tui from one year to the next.
These counts have now been carried out each year since 2011, and have showed that there has been
little change in the diversity of native bird species over this time. This indicates that the current level
of biodiversity management that these reserves are receiving is succeeding in maintaining native bird
species diversity. That said, these surveys have shown that both rifleman (Acanthisitta chloris) and
kakariki (Cyanoramphus sp.) are detected only occasionally during these surveys, so may not be
present in sufficient numbers to maintain viable populations in the long term (McArthur et al, 2015b).
Larger and better connected reserves such as Wi Tako Reserve and Keith George Memorial Park
support the greatest diversity of native forest bird species (McArthur et al, 2012; 2013b; 2015b, 2016).
Silvereye, grey warbler and tui have been three of the most commonly encountered native bird
species recorded in Upper Hutt reserves each year since 2011, although there was a significant
fluctuations in the abundance of both silvereye and tui between years. Fantail encounter rates were
extremely low in 2011, probably as a result of heavy mortality suffered during two unusually heavy
snowfall events that occurred during winter 2011. Since 2011 however, fantail encounter rates have
undergone an 11-fold increase, suggesting that local fantail populations have recovered quickly from
this severe weather event. Encounter rates for tomtits have fluctuated considerably between years,
and this may be evidence that local tomtit populations are responding to local mammalian predator
control efforts. Kakariki, bellbird (Anthornis melanura) and rifleman were all detected in Wi Tako
Reserve for the first time in 2011, but this may have been a consequence of the improved search effort
and coverage that was built into the new survey design, rather than evidence that recent re-
colonisation events have occurred (McArthur et al, 2012; 2013b; 2015b, 2016).
The incorporation of ‘citizen science’ bird distribution data into this survey for the first time in 2015
revealed new spatial patterns in bird distribution. Both the north-eastern portion of Keith George
Memorial Park and the southern portion of Wi Tako reserve both support higher numbers of tomtits,

                                                                                                         1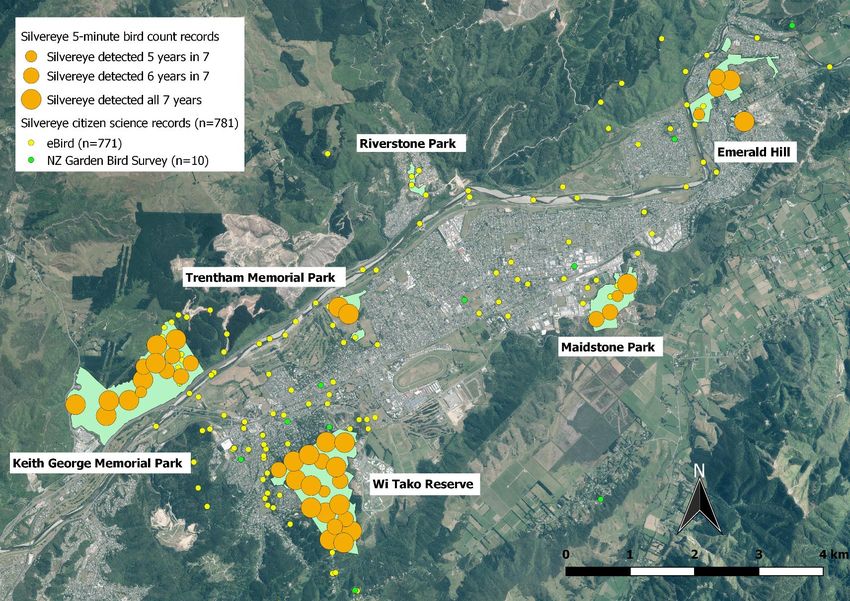
fantails, whiteheads and bellbirds than remaining portions of both reserves. This suggests that the
north-east and southern portions of these two reserves provide particularly high-quality habitat for
these native species, likely due to the presence of mature stands of both black and hard beech
(McArthur et al, 2015b).
These bird counts were repeated again in 2017 and this report provides a summary of the results of
these more recent bird counts. In addition, this report also incorporates additional ‘citizen science’
bird distribution data collected over the past 12 months to provide updated information on the
distribution of native birds in adjacent urban and suburban habitats in the city. Thanks to the
availability of online biodiversity reporting tools such as the New Zealand eBird and NatureWatch
databases and citizen science projects such as the Great Kereru Count and New Zealand Garden Bird
Survey, there is a growing interest among Upper Hutt City residents in collecting and sharing high-
quality bird observations from around the city. These observations have the potential to complement
the existing Upper Hutt City five-minute bird count dataset by providing distribution data from
habitats not currently being sampled as part of this monitoring programme.

                                                                                                    2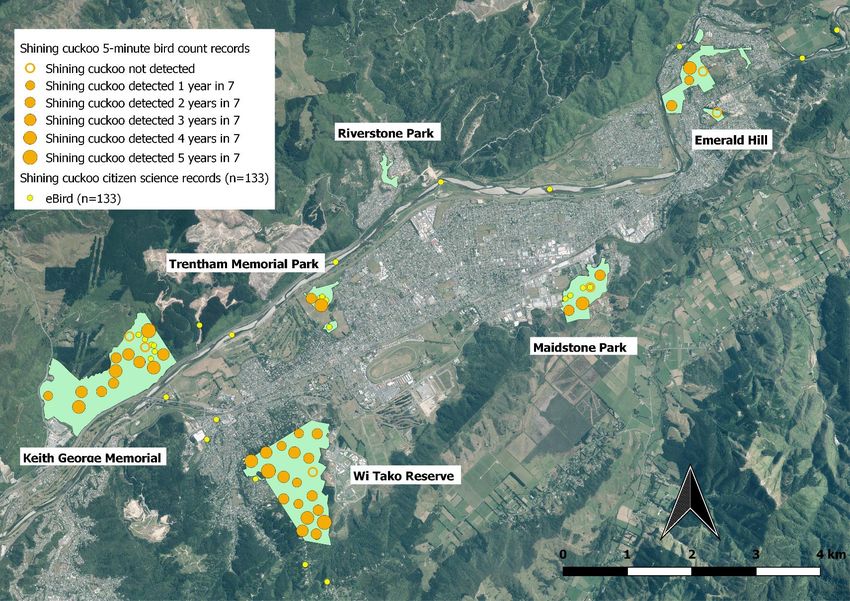
Figure 1.1: Location of parks and reserves sampled as part of the Upper Hutt bird monitoring
programme, 2007-2017.

                                                                                          3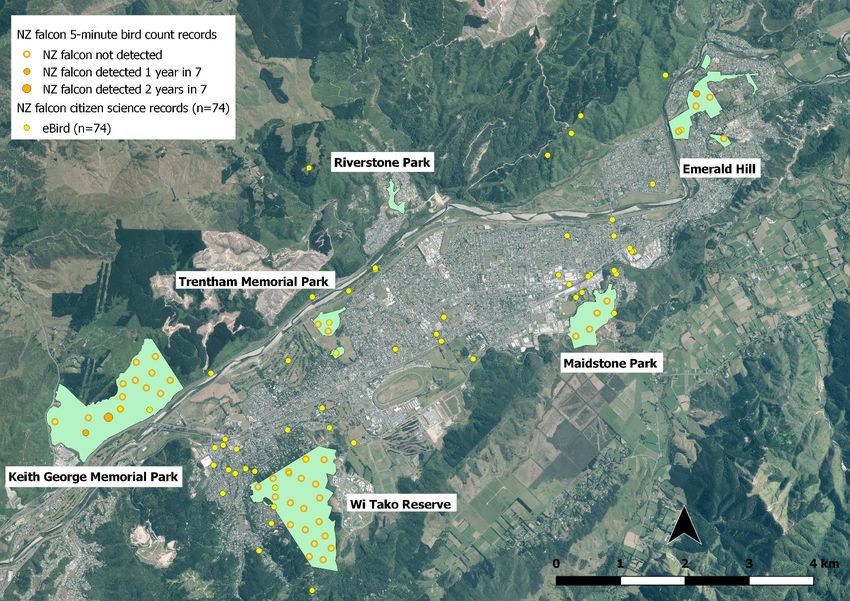
2.       METHODS

2.1      Five-minute bird count data collection
Forty-five bird count stations were established at randomly-selected locations in six of seven selected
Upper Hutt City parks and reserves in November 2011 and have been surveyed annually between 2011
and 2017 (Figure 2.1). Bird count stations were established at a minimum distance of 200 metres from
one another and no less than 50 metres from the nearest forest edge. Each station was marked with
a blue triangle affixed to a living tree. Due to the random placement of count stations, no station fell
within the boundary of Riverstone Park, the smallest of the seven reserves selected for sampling. As
a consequence, no abundance data is collected at this site. Instead, a 20-minute walk-through survey
has been carried out each year to collect data on species diversity and distribution in this park.
Two five-minute bird counts were carried out at each station each year, with each count being carried
out on a different day. All counts were carried out in November or early December each year and
counts were made only on fine, calm days between 1.5 hours after sunrise and 1.5 hours before sunset
(approximately 7.30 am to 6.30 pm). At each station, an observer spent five minutes recording the
number of individuals of all species seen or heard from the count station (i.e. an unbounded count as
per Dawson & Bull, 1975 and Hartley & Greene, 2012). Care was taken to avoid recording the same
bird twice during a count. Two experienced observers were employed to conduct the count each year,
with each observer surveying each bird count station once.
Bird conspicuousness can vary in response to a number of variables such as time of year, weather,
time of day and change in observer (Bibby et al, 2000). Because of this, every effort was made to
standardise or sample the range of variation in each of these factors so that we could be fairly
confident that any changes in the mean number of birds counted per station from one year to the
next would more likely reflect changes in bird abundance rather than conspicuousness. Precautions
taken include carrying out these counts during the same months each year and in similar weather
conditions. Counts were carried out throughout the day, so sampled any variation in bird
conspicuousness that occurred during the day.
Observer-related variation can have a substantial impact on five-minute bird count results, and can
sometimes either mask or be mistaken for true changes in bird abundance or conspicuousness from
one survey to the next (McArthur et al, 2013a). For this reason, we’ve endeavoured to minimise the
number of observers used to collect this five-minute bird count data, with only five changes being
made so far during the seven year duration of this project. In all but one case, when one observer has
been replaced with another, the second observer has remained the same across both years. This
provides us with some ability to differentiate observer-related changes in bird encounter rates from
those caused by true changes in bird conspicuousness or abundance from one year to the next.

                                                                                                      4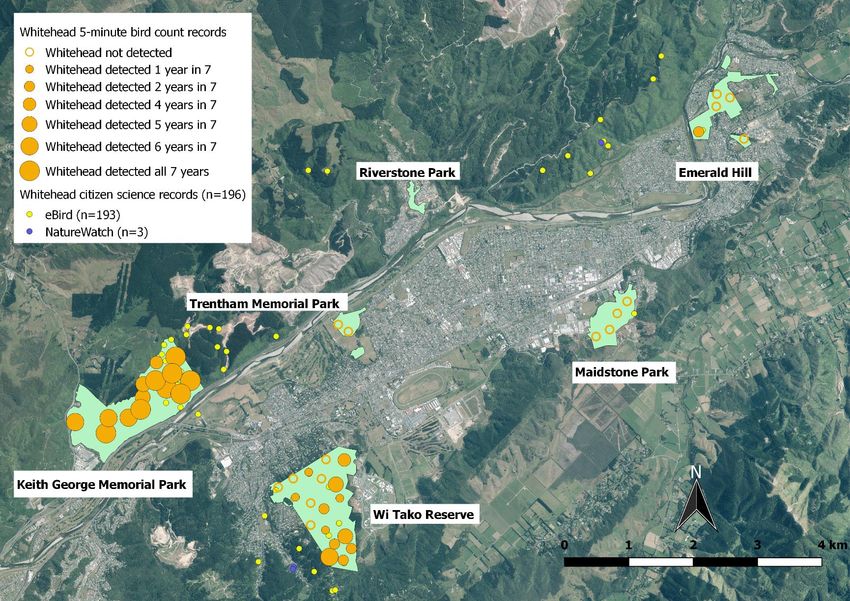
Figure 2.1: Locations of bird count stations surveyed in Upper Hutt parks and reserves between 2011
and 2017 (Note: the single count station in Cloustonville Park is not shown).

2.2     Five-minute bird count data analysis
The Upper Hutt City five-minute bird count data were entered into a Microsoft Excel spreadsheet and
then used to calculate the mean number of each native forest bird species detected per five-minute
bird count each year, in order to examine temporal patterns in bird encounter rates (Dawson & Bull,
1975).     For the purposes of this analysis, we defined a “native forest bird” as any native species
capable of maintaining a functional population entirely within native forest habitat, and therefore
likely to be a resident rather than transitory species in this habitat.
Because these raw data consist of relatively low counts which are naturally truncated at zero, the data
is too skewed to conform to a normal distribution, a key assumption for many parametric tests for
statistical significance. To deal with this, we first added a value of 1.0 to the number of species and
individuals recorded during each count in order to remove zero values from the dataset, then applied
an a priori square root transformation to the data to ensure that they were approximately normally
distributed and with approximately equal sample variances before we proceeded with any further
analyses. Once we were satisfied that our transformed data met these assumptions, we used one-
way analyses of variance (ANOVA) to test for statistically-significant differences in mean bird
encounter rates between years (Fowler & Cohen, 1995). Performing these statistical tests is important
because a statistically significant result indicates that any difference between the two or more means
being compared is very unlikely to have occurred due to chance sampling error, so instead is assumed
to represent a real difference in the abundance and/or conspicuousness of native forest birds between
years.
                                                                                                     5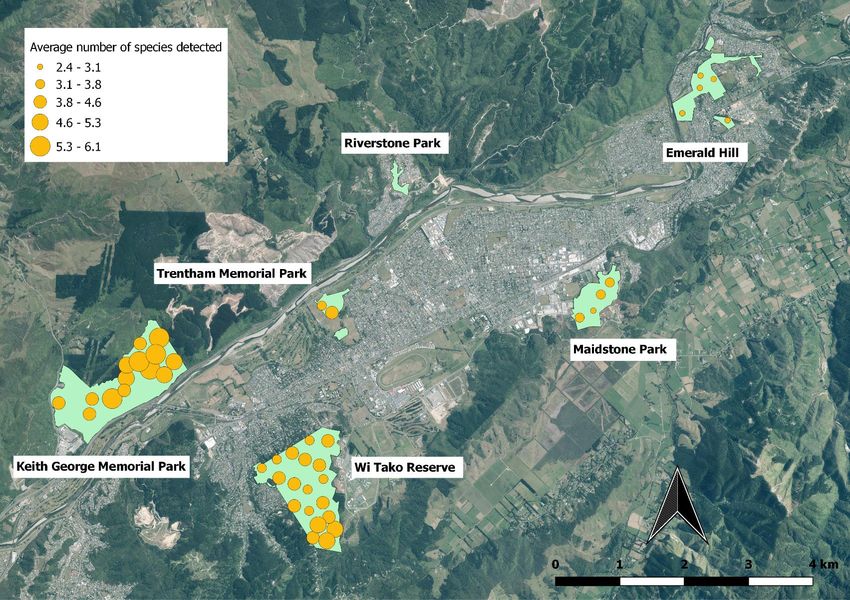
Patterns in the distribution of native birds in Upper Hutt City reserves were examined by mapping the
relative frequency at which each native forest bird species was detected at each bird count station
using QGIS version 2.18.17. Although this technique does not explicitly take into account relative
differences in abundance (less common species present within sight or earshot of a bird count station
are less likely to be detected) or variation in detection probabilities between species (less conspicuous
species will also be less likely to be detected), it should be sufficient to detect relatively large changes
in species’ distributions (Mackenzie et al, 2006).

2.3     Citizen science data analysis
As a result of the increasing popularity of citizen science, there is a steadily growing pool of bird
observation data available online which can be combined with our more systematic five-minute bird
count data to help detect changes in bird distribution in Upper Hutt City over time. Since 2011,
residents and visitors to the Wellington region have contributed over 180,000 bird observations to
online databases and citizen science projects such as the New Zealand eBird database, NatureWatch,
the NZ Garden Bird Survey and the Great Kereru Count.
The New Zealand eBird database is the largest source of such citizen science data. The 164,564 bird
observation records submitted to the eBird database for the Wellington region since 2011 accounts
for around 91% of citizen science bird data available for the region. The New Zealand eBird database
(http://ebird.org/content/newzealand/) is run by the Cornell Lab of Ornithology in partnership with
Birds New Zealand. It provides a facility for recreational birdwatchers to permanently record their
bird observations in a standard format and in one centralised location and makes these observations
available to researchers, conservation managers and environmental policy-makers (Scofield et al,
2012). Globally, the eBird database is now the largest and fastest growing biodiversity database in
the world, with over 410,000 unique users having so far contributed over 500 million bird records
describing the distribution of 98% of the world’s bird species (Sullivan et al, 2014;
http://ebird.org/content/ebird/news/millions0417/, accessed 30/06/2017).
Within the eBird database, automated data filters and an expert review process ensure that these
data are of high quality and accuracy (Sullivan et al, 2014). We used eBird’s “download data” tool to
access the February 2018 release of the eBird Basic Dataset (EBD) and to build custom datasets
containing citizen science records of all native forest bird species recorded in Upper Hutt City between
2011 and 2018. We formatted these datasets using Microsoft Excel, including removing any
extraneous data fields and converting latitude/longitude coordinates to NZTM coordinates. We then
saved these files as .csv files so that they could be imported into QGIS and converted into shapefiles.
Once in QGIS, we visually inspected these eBird records to locate and remove any records containing
obvious location errors (e.g. records placed offshore, or for which location descriptions didn’t match
the coordinates provided) before adding these records to the distribution maps created from the five-
minute bird count data.
The NatureWatch NZ database is the second-largest online source of citizen science bird data for the
Wellington region. NatureWatch is a database that allows citizen scientists to submit, share and store
natural history observations online, and unlike eBird it is designed to accept records for almost any
taxon of plant or animal rather than just birds. Naturewatch NZ (http://naturewatch.org.nz/) is run
by a charitable trust called the New Zealand Bio-recording Network Trust, and was established using
funding from the New Zealand Government’s Terrestrial Freshwater Biodiversity Information System
Fund. The 15,405 bird observation records submitted to NatureWatch for the Wellington region since
2011 account for around 8% of citizen science bird data available for the region. Within this dataset,
9060 records (58%) are bird observations submitted directly to NatureWatch. A further 4389 records
(28%) are bird observations collected by people participating in Landcare Research’s New Zealand

                                                                                                          6
Garden Bird Survey1, which have subsequently been uploaded to NatureWatch. An additional 1956
records (13%) are kereru observations submitted by people participating in the Kereru Discovery
Project’s Great Kereru Count2, which have likewise been uploaded to NatureWatch.
Within the NatureWatch database, a community peer-review process is used to validate records, with
records tagged as either “research grade” or “casual grade” depending on whether or not original
species identifications have been verified by another NatureWatch user. Because most bird
observations submitted to NatureWatch aren’t accompanied by photographs, the majority of records
are “casual grade” records. We used the search tool on the NatureWatch website to download all
bird observations recorded in Upper Hutt City between 2011 and 2017. We formatted this dataset
using Microsoft Excel, then saved the resulting file as a .csv file so that it could be imported into QGIS
and converted to a shapefile. We then displayed the data on a map and visually inspected them and
removed records with obvious location errors. NatureWatch automatically obscures the locations of
taxa that have been given a conservation status of “Near Threatened” or higher on the IUCN Red List
of threatened species (http://naturewatch.org.nz/pages/help#obscured; accessed 30/06/2017). As a
result, any records for these taxa are assigned a random set of coordinates that are within a ca. 20x
20 km cell containing the true coordinates. Because the locations of these observations are obscured
in this way, several hundred observations for a number of threatened or ‘At Risk’ bird taxa had to be
discarded due to inaccurate location data, as there is no clear guidance on the NatureWatch website
regarding how researchers can go about accessing the original, true locations of these records.
A key difference between these citizen science datasets and the five-minute bird count data is that
the temporal and spatial distribution of search effort spent by citizen scientists varies unpredictably
from year to year, whereas this search effort is standardised during these five-minute bird counts.
Nonetheless, accurate bird observations submitted by citizen scientists have the potential to
complement distribution data derived from our five-minute bird count dataset by providing
information describing the presence of native forest birds at locations and in habitats not sampled by
these five-minute bird counts.
3. RESULTS
3.1 Species diversity
The total number of bird species detected during these five minute bird counts has varied little
between 2011 and 2017, with between 26 and 37 bird species detected each year (Figure 3.1).
Between 0% and 10% of these species detected each year are native species ranked as either
Nationally Threatened or ‘At Risk’ under the New Zealand Threat Classification System and a further
45% to 54% are native species ranked as Not Threatened (Robertson et al, 2013; 2017). Between 41%
and 46% of species detected are listed as Introduced and Naturalised (see Appendix).
1 http://www.landcareresearch.co.nz/science/plants-animals-fungi/animals/birds/garden-bird-surveys; accessed 30/06/2017
2 https://kererudiscovery.org.nz/great-kereru-count-2016/; accessed 30/06/2017
740
Total number of bird species detected
35
30
Introduced and
Naturalised
25
20 Native, Not
Threatened
15
Native, Nationally
10 Threatened or 'At Risk'
5
0
2011 2012 2013 2014 2015 2016 2017
Year
Figure 3.1: Total number of bird species detected during five-minute bird counts carried out in
Upper Hutt City parks and reserves, 2011-2017.
Fifteen of the native bird species detected between 2011 and 2017 were species that are typically
found in native forest habitat and it is these species for which trends in relative abundance and
distribution have been reported below. The remaining native species recorded were either open-
country or coastal species such as Australasian harrier (Circus approximans) and paradise shelduck
(Tadorna variegata), and are not included in any further analyses. Complete lists of all of the bird
species detected in each of the reserves sampled can be found in the Appendix at the end of this
report.
Between 2011 and 2017 the mean number of native forest bird species detected per bird count station
in Upper Hutt City reserves has varied significantly between individual years (F6,609 = 2.70, p = 0.01;
one-way ANOVA). However, there has only been a very slight overall upward trend over this time
period (Figure 3.2).
87.0
Mean number of bird species detected
6.0
5.0
4.0
3.0
2.0
1.0
0.0
2011 2012 2013 2014 2015 2016 2017
Year
Figure 3.2: Mean number of native forest bird species recorded per five-minute bird count station
in Upper Hutt City between 2011 and 2017 (error bars represent 95% confidence limits).
Mean species richness also varied spatially across Upper Hutt City. The mean number of native forest
bird species detected per bird count station is highest in the eastern portion of Keith George Memorial
Park and in the southern portion of Wi Tako reserve. Given its small size and degree of isolation, mean
species richness also appears to be particularly high in Trentham Memorial Park. In contrast, species
richness is lower in reserves with younger, regenerating forest and shrubland, such as Emerald Hill,
parts of Maidstone Park, the western portion of Keith George Memorial Park and the northern portion
of Wi Tako Reserve (Figure 3.3).
9Figure 3.3: Mean number of native forest bird species detected at each five-minute bird count station in Upper Hutt City between 2011 and 2017.
103.2 Abundance and distribution of native forest bird species
The following species accounts are listed in approximate order of decreasing abundance in Upper Hutt
City. Species that are most frequently encountered during the five-minute bird counts are covered
first, and the species that are only seldom encountered, or not encountered at all during these five-
minute bird counts are treated last. Every species of native forest bird that has been observed in the
six Upper Hutt City reserves surveyed since 2011 is included in this section of the report, and species
lists for each individual reserve can be found in the Appendix.
3.2.1 Tui (Prosthemadera novaeseelandiae)
National conservation status: Not Threatened
(Robertson et al, 2017).
Regional conservation status: Not Threatened
(GWRC/DoC, unpublished data).
Tui are common and widespread in Upper Hutt
City, and are recorded from the majority of five-
minute bird count stations each year at a mean
rate of between 1.7 and 2.5 birds per station.
There has been significant fluctuations in tui
encounter rates from one year to the next
between 2011 and 2017, however there appears
to be no long-term increase or decrease in
encounter rates over this time (F6,609 = 3.93, p =
Image courtesy of Tony Whitehead/NZ Birds Online
0.0007; one-way ANOVA; Figure 3.4). Tui are also
frequently reported by local citizen scientists, and are commonly encountered in suburban and urban
habitats in the city, in addition to the forested reserves sampled as part of this bird monitoring
programme (Figure 3.5).
4
3.5
Mean number of tui counted
3
2.5
2
1.5
1
0.5
0
2011 2012 2013 2014 2015 2016 2017
Year
Figure 3.4: Mean number of tui recorded per five-minute bird count station in Upper Hutt City
between 2011 and 2017 (error bars represent 95% confidence limits).
11Sourced from the LINZ Data Service and licensed by Wellington regional Council for re-
use under the Creative Commons Attribution 4.0 International licence (link is external)
Figure 3.5: Distribution of tui in Upper Hutt City between 2011 and 2018. Orange circles represent tui detections at five-minute bird count stations, with
the size of the circle corresponding to the relative detection frequency. Smaller coloured circles represent tui observations reported by local citizen
scientists via eBird, NatureWatch or the NZ Garden Bird Survey.
123.2.2 Silvereye (Zosterops lateralis)
National conservation status: Not Threatened (Robertson et al,
2017).
Regional conservation status: Not Threatened (GWRC/DoC,
unpublished data).
Silvereye encounter rates have fluctuated significantly in Upper
Hutt City from one year to the next between 2011 and 2017
(F6,609 = 17.35, p = 1.41 x 10⁻¹⁸; one-way ANOVA). Mean
encounter rates have fluctuated from a low of 1.1 birds counted
per station in 2013, to a high of 3.0 birds per station in 2011 and
the species appears to have undergone an overall decline in
abundance over this time (Figure 3.6). Silvereyes remain
common and widespread in Upper Hutt City however, and are
recorded from the majority of five-minute bird count stations
each year. Silvereyes are also frequently reported by local
citizen scientists, and are commonly encountered in suburban and Image courtesy of Ormond Torr/NZ Birds Online
urban habitats in the city (Figure 3.7)
4
3.5
Mean number of silvereyes counted
3
2.5
2
1.5
1
0.5
0
2011 2012 2013 2014 2015 2016 2017
Year
Figure 3.6: Mean number of silvereyes recorded per five-minute bird count station in Upper Hutt
City between 2011 and 2017 (error bars represent 95% confidence limits).
13Sourced from the LINZ Data Service and licensed by Wellington regional Council for re-
use under the Creative Commons Attribution 4.0 International licence (link is external)
Figure 3.7: Distribution of silvereye in Upper Hutt City between 2011 and 2018. Orange circles represent silvereye detections at five-minute bird count
stations, with the size of the circle corresponding to the relative detection frequency. Smaller coloured circles represent silvereye observations reported
by local citizen scientists via eBird, NatureWatch or the NZ Garden Bird Survey.
143.2.3 Grey Warbler (Gerygone igata)
National conservation status: Not Threatened
(Robertson et al, 2017).
Regional conservation status: Not Threatened
(GWRC/DoC, unpublished data).
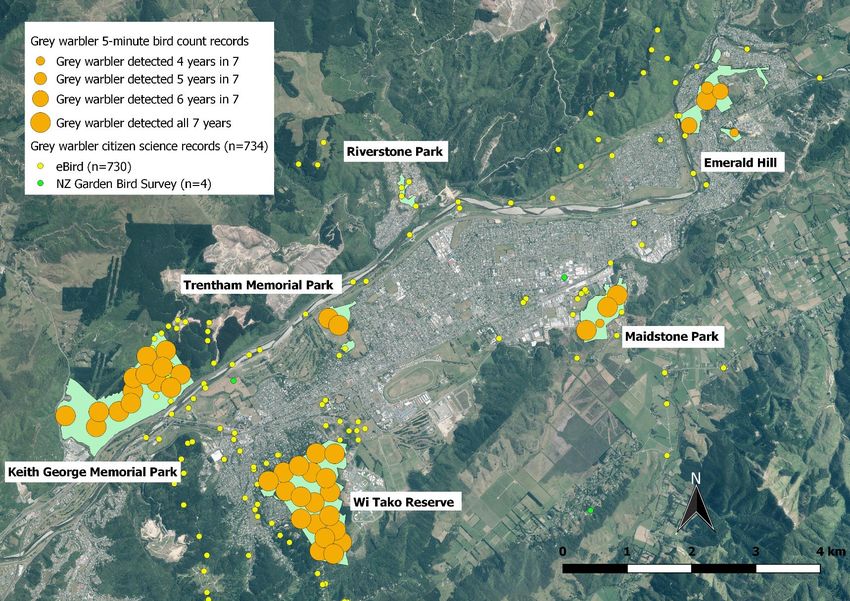
Grey warbler encounter rates have fluctuated
significantly in Upper Hutt City from one year to the
next between 2011 and 2017 (F6,609 = 3.82, p = 0.001;
one-way ANOVA). Mean encounter rates have varied
from a low of 1.7 birds counted per station in 2014, to
a high of 2.3 birds per station in 2011 and the species
appears to have undergone an overall decline in
abundance over this time (Figure 3.8). Despite this,
Image courtesy of Bartek Wypych/NZ Birds Online grey warblers remain common and widespread in
Upper Hutt City, and are recorded from the majority of
five-minute bird count stations each year. Grey
warblers are also frequently reported by local citizen scientists, and are likely to be widespread in
suburban habitats in the city in addition to the forested reserves (Figure 3.9).
4
3.5
Mean number of grey warblers counted
3
2.5
2
1.5
1
0.5
0
2011 2012 2013 2014 2015 2016 2017
Year
Figure 3.8: Mean number of grey warblers recorded per five-minute bird count station in Upper Hutt
City between 2011 and 2017 (error bars represent 95% confidence limits).
15Sourced from the LINZ Data Service and licensed by Wellington regional Council for re-
use under the Creative Commons Attribution 4.0 International licence (link is external)
Figure 3.9: Distribution of grey warbler in Upper Hutt City between 2011 and 2018. Orange circles represent grey warbler detections at five-minute bird
count stations, with the size of the circle corresponding to the relative detection frequency. Smaller coloured circles represent grey warbler observations
reported by local citizen scientists via eBird, NatureWatch or the NZ Garden Bird Survey.
163.2.4 Whitehead (Mohoua albicilla)
National conservation status: At Risk, Declining
(Robertson et al, 2017).
Regional conservation status: Not Threatened
(GWRC/DoC, unpublished data).
Whitehead encounter rates haven’t varied
significantly in Upper Hutt City reserves between
2011 and 2017 (F6,609 = 2.03, p = 0.06; one-way
ANOVA) The mean number of birds encountered
per station has fluctuated from a low of 0.6 birds
per station in 2014 to a high of 1.1 birds per
station in 2013 (Figure 3.10). Whiteheads are
Image courtesy of Tony Whitehead/NZ Birds Online common and widespread in Keith George
Memorial Park, and appear to be largely
restricted to mature beech forest in the southern and western parts of Wi Tako Reserve. They have
also been recorded during five-minute bird counts in Harcourt Park, in Emerald Hill. Whiteheads are
very seldom reported by local citizen scientists from suburban habitats in Upper Hutt City, so it
appears that this species is almost exclusively restricted to native forest and mature exotic forest
habitats in the vicinity of the city (Figure 3.11).
2
1.6
Mean number of whiteheads counted
1.2
0.8
0.4
0
2011 2012 2013 2014 2015 2016 2017
Year
Figure 3.10: Mean number of whiteheads recorded per five-minute bird count station in Upper Hutt
City between 2011 and 2017 (error bars represent 95% confidence limits).
17Sourced from the LINZ Data Service and licensed by Wellington regional Council for re-
use under the Creative Commons Attribution 4.0 International licence (link is external)
Figure 3.11: Distribution of whitehead in Upper Hutt City between 2011 and 2018. Orange circles represent whitehead detections at five-minute bird count
stations, with the size of the circle corresponding to the relative detection frequency. Smaller coloured circles represent whitehead observations reported
by local citizen scientists via eBird, NatureWatch or the NZ Garden Bird Survey.
183.2.5 Fantail (Rhipidura fuliginosa)
National conservation status: Not Threatened
(Robertson et al, 2017).
Regional conservation status: Not Threatened
(GWRC/DoC, unpublished data).
Fantails have undergone a spectacular, 11-fold
increase in abundance in Upper Hutt reserves since
2011 (F6,609 = 16.45, p = 1.29 x 10⁻¹⁷; one-way
ANOVA; Figure 3.12). This dramatic increase likely
represents a rapid population recovery following a
mass mortality event that occurred in July and
August 2011, as a consequence of two unusually
heavy snowfall events in the region (McArthur et
al, 2013b). Fantails appear to be most abundant in
the eastern parts of Keith George Memorial Park,
Image courtesy of Cheryl Marriner/NZ Birds Online and in Trentham Memorial Park and Maidstone
Park. Fantails are also commonly reported by local
citizen scientists from suburban habitats in Upper Hutt City, in addition to the forested reserves (Figure
3.13).
1.2
1
Mean number of fantails counted
0.8
0.6
0.4
0.2
0
2011 2012 2013 2014 2015 2016 2017
Year
Figure 3.12: Mean number of fantails recorded per five-minute bird count station in Upper Hutt City
between 2011 and 2017 (error bars represent 95% confidence limits).
19Sourced from the LINZ Data Service and licensed by Wellington regional Council for re-
use under the Creative Commons Attribution 4.0 International licence (link is external)
Figure 3.13: Distribution of fantail in Upper Hutt City between 2011 and 2018. Orange circles represent fantail detections at five-minute bird count stations,
with the size of the circle corresponding to the relative detection frequency. Smaller coloured circles represent fantail observations reported by local
citizen scientists via eBird, NatureWatch or the NZ Garden Bird Survey.
203.2.6 Bellbird (Anthornis melanura)
National conservation status: Not Threatened
(Robertson et al, 2017).
Regional conservation status: Not Threatened
(GWRC/DoC, unpublished data).
Bellbird encounter rates haven’t varied significantly
from one year to the next in Upper Hutt City between
2011 and 2017 (F6,609 = 2.10, p = 0.052; one-way
ANOVA). The mean number of birds encountered
per station has fluctuated from an unusually low
encounter rate of 0.1 birds per station in 2011 to a
high of 0.42 birds per station in 2015 (Figure 3.14).
Bellbirds appear to be particularly abundant in the
eastern portion of Keith George Memorial Park, and
Image courtesy of Craig McKenzie/NZ Birds Online are moderately common in both Wi Tako Reserve
and Emerald Hill. Bellbirds are regularly reported
from suburban habitats by citizen scientists, with the
majority of observations occurring in the southern suburbs of Silverstream and Pinehaven, or the
northern suburbs of Brown Owl and Totara Park (Figure 3.15).
0.8
0.7
0.6
Mean number of bellbirds counted
0.5
0.4
0.3
0.2
0.1
0
2011 2012 2013 2014 2015 2016 2017
Year
Figure 3.14: Mean number of bellbirds recorded per five-minute bird count station in Upper Hutt
City between 2011 and 2017 (error bars represent 95% confidence limits).
21Sourced from the LINZ Data Service and licensed by Wellington regional Council for re-
use under the Creative Commons Attribution 4.0 International licence (link is external)
Figure 3.15: Distribution of bellbird in Upper Hutt City between 2011 and 2018. Orange circles represent bellbird detections at five-minute bird count
stations, with the size of the circle corresponding to the relative detection frequency. Smaller coloured circles represent bellbird observations reported
by local citizen scientists via eBird, NatureWatch or the NZ Garden Bird Survey.
223.2.7 Tomtit (Petroica macrocephala)
National conservation status: Not Threatened
(Robertson et al, 2017).
Regional conservation status: Not Threatened
(GWRC/DoC, unpublished data).
Tomtit encounter rates have varied significantly
from one year to the next in Upper Hutt City
reserves between 2011 and 2017 (F6,609 = 4.50, p =
0.0002; one-way ANOVA). Although tomtit
encounter rates have varied from low of 0.2 birds
per station in 2015 to a high of 0.7 birds per station
in 2013, there appears to have been no long-term
trend in either the abundance or conspicuousness
of this species during this time (Figure 3.16). Among
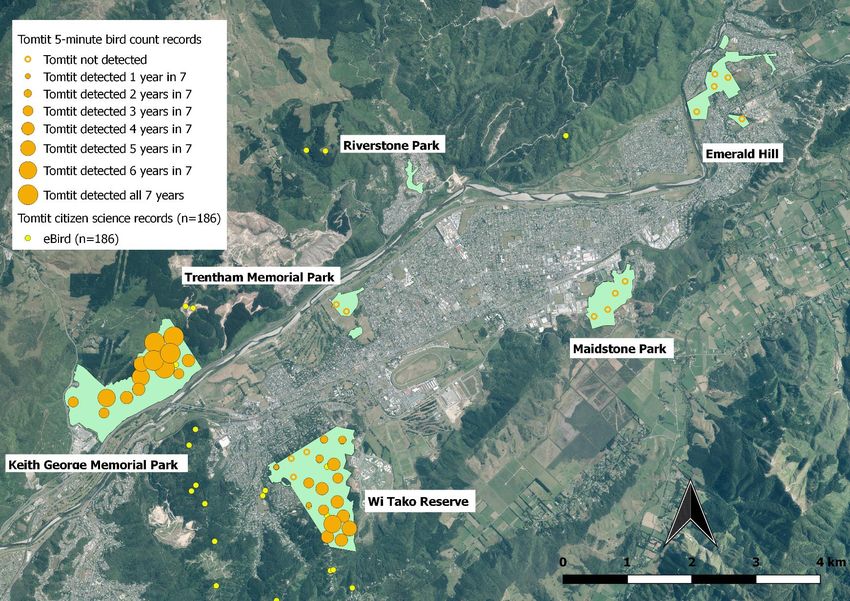
the reserves sampled, tomtits are largely restricted
Image courtesy of Paul Shaw/NZ Birds Online
to the mature beech forest in the eastern portion
of Keith George Memorial Park, and in the southern
portion of Wi Tako Reserve. Tomtits have also been reported by local citizen scientists as occurring in
the mature pine forest on Silverstream Spur, from a bush covenant on Moonshine Road, and from
Cannon Point in the Akatarawa Forest. Tomtits appear to be almost exclusively restricted to mature
forest habitat in the vicinity of Upper Hutt City, and are largely absent from suburban habitats (Figure
3.17).
1
0.8
Mean number of tomtits counted
0.6
0.4
0.2
0
2011 2012 2013 2014 2015 2016 2017
Year
Figure 3.16: Mean number of tomtits recorded per five-minute bird count station in Upper Hutt City
between 2011 and 2017 (error bars represent 95% confidence limits).
23Sourced from the LINZ Data Service and licensed by Wellington regional Council for re-
use under the Creative Commons Attribution 4.0 International licence (link is external)
Figure 3.17: Distribution of tomtit in Upper Hutt City between 2011 and 2018. Orange circles represent tomtit detections at five-minute bird count stations,
with the size of the circle corresponding to the relative detection frequency. Smaller coloured circles represent bellbird observations reported by local
citizen scientists via eBird, NatureWatch or the NZ Garden Bird Survey.
243.2.8 Shining cuckoo (Chrysococcyx lucidus)
National conservation status: Not Threatened
(Robertson et al, 2017).
Regional conservation status: Not Threatened
(GWRC/DoC, unpublished data).
Shining cuckoo encounter rates have varied
significantly from one year to the next in Upper
Hutt City reserves between 2011 and 2017 (F6,609 =
4.99, p = 5.27 x 10⁻⁵; one-way ANOVA). Despite
mean encounter rates fluctuating from a low of
0.1 birds per station in 2014 to a high of 0.4 birds
per station in 2013, there appears to have been no
long-term trend in either the abundance or
conspicuousness of this species during this time
Image courtesy of Rob Lynch/NZ Birds Online
(Figure 3.18). Shining cuckoos are fairly sparsely,
but evenly distributed throughout the Upper Hutt
reserves sampled, having been detected in all but Riverstone Park. Shining cuckoos are occasionally
reported by local citizen scientists from riparian willows along the Hutt River, but are only very
occasionally reported from suburban habitats in the city (Figure 3.19).
1
0.8
Mean number of shining cuckoos counted
0.6
0.4
0.2
0
2011 2012 2013 2014 2015 2016 2017
Year
Figure 3.18: Mean number of shining cuckoos recorded per five-minute bird count station in Upper
Hutt City between 2011 and 2017 (error bars represent 95% confidence limits).
25Sourced from the LINZ Data Service and licensed by Wellington regional Council for re-
use under the Creative Commons Attribution 4.0 International licence (link is external)
Figure 3.19: Distribution of shining cuckoo in Upper Hutt City between 2011 and 2018. Orange circles represent shining cuckoo detections at five-minute
bird count stations, with the size of the circle corresponding to the relative detection frequency. Smaller coloured circles represent shining cuckoo
observations reported by local citizen scientists via eBird, NatureWatch or the NZ Garden Bird Survey.
263.2.9 New Zealand kingfisher (Todiramphus sanctus)
National conservation status: Not Threatened
(Robertson et al, 2017).
Regional conservation status: Not Threatened
(GWRC/DoC, unpublished data).
New Zealand kingfisher encounter rates haven’t varied
significantly in Upper Hutt City reserves between 2011
and 2017 (F6,609 = 1.82, p = 0.09; one-way ANOVA; Figure
3.20). Kingfishers are particularly common in Wi Tako
Reserve, Trentham Memorial Park and Maidstone Park,
where the presence of both mature forest (providing a
lot of cavities for nesting) combined with the proximity
of rivers, stream, seepages and open playing fields
(providing good foraging habitat) may be particularly
Image courtesy of Bartek Wypych/NZ Birds Online
high quality habitat for kingfishers. Kingfishers are also
regularly reported by local citizen scientists, from the
riparian parkland along the Hutt River, and from suburban habitats, particularly the southern suburbs
of Silverstream and Pinehaven (Figure 3.21).
0.5
0.4
Mean number of kingfishers counted
0.3
0.2
0.1
0
2011 2012 2013 2014 2015 2016 2017
Year
Figure 3.20: Mean number of NZ kingfishers recorded per five-minute bird count station in Upper
Hutt City between 2011 and 2017 (error bars represent 95% confidence limits).
27Sourced from the LINZ Data Service and licensed by Wellington regional Council for re-
use under the Creative Commons Attribution 4.0 International licence (link is external)
Figure 3.21: Distribution of NZ kingfisher in Upper Hutt City between 2011 and 2018. Orange circles represent NZ kingfisher detections at five-minute bird
count stations, with the size of the circle corresponding to the relative detection frequency. Smaller coloured circles represent NZ kingfisher observations
reported by local citizen scientists via eBird, NatureWatch or the NZ Garden Bird Survey.
283.2.10 Kereru (Hemiphaga novaeseelandiae)
National conservation status: Not threatened
(Robertson et al, 2017).
Regional conservation status: Not threatened
(GWRC/DoC, unpublished data).
Kereru encounter rates have varied significantly
from one year to the next in Upper Hutt City
reserves between 2011 and 2017 (F6,609 = 2.83, p =
0.010; one-way ANOVA; Figure 3.22). However,
there appears to have been no long-term change in
either the abundance or conspicuousness of this
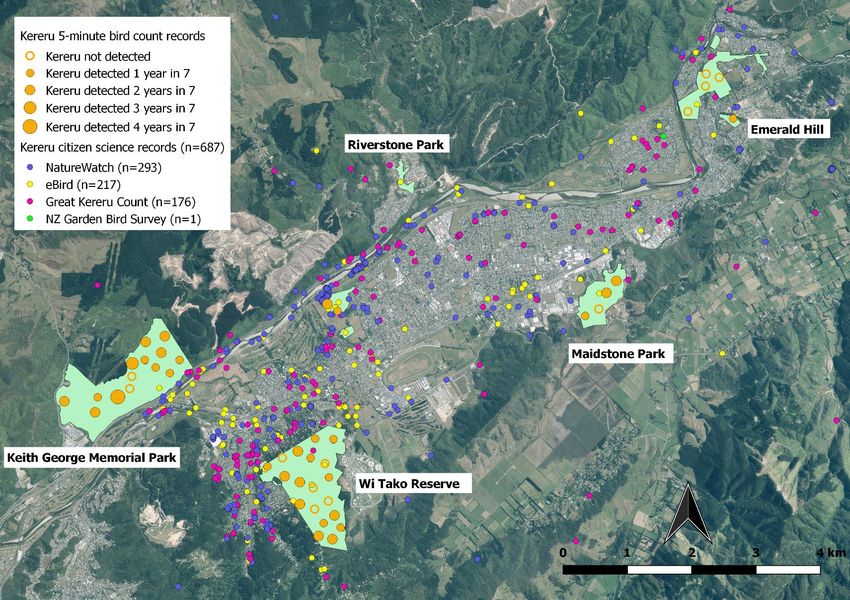
species during this time. Kereru are sparsely
distributed across all of the Upper Hutt reserves
sampled. Kereru are by far the bird species most
frequently reported by local citizen scientists,
partly due to their conspicuousness, and partly
due to the success of the Great Kereru Count. Image courtesy of Arindam Bhattacharya/NZ Birds Online
Kereru frequently occur in urban and suburban
habitats throughout the city, but appear to be
particularly common in ‘greener’ suburbs such as Silverstream and Pinehaven (Figure 3.23). During
spring each year, kereru are conspicuous along the Hutt River, where they spend a great deal of time
foraging on the emerging leaves of willow, lucerne and broom. At this time of the year, both kereru
and tui are conspicuous as road kill along State Highway 2, particularly near the Silverstream
intersection. It appears that both species are in the habit of swooping low across the road when
dispersing between the Hutt Escarpment and the river corridor, and up to several dozen are killed by
passing vehicles each year.
0.5
Mean number of kereru counted
0.4
0.3
0.2
0.1
0
2011 2012 2013 2014 2015 2016 2017
Year
Figure 3.22: Mean number of kereru recorded per five-minute bird count station in Upper Hutt City
between 2011 and 2017 (error bars represent 95% confidence limits).
29Sourced from the LINZ Data Service and licensed by Wellington regional Council for re-
use under the Creative Commons Attribution 4.0 International licence (link is external)
Figure 3.23: Distribution of kereru in Upper Hutt City between 2011 and 2018. Orange circles represent kereru detections at five-minute bird count stations,
with the size of the circle corresponding to the relative detection frequency. Smaller coloured circles represent kereru observations reported by local
citizen scientists via eBird, NatureWatch or the NZ Garden Bird Survey.
303.2.11 New Zealand falcon (Falco novaeseelandiae)
National conservation status: At Risk, Recovering
(Robertson et al, 2017).
Regional conservation status: Regionally Critical
(GWRC/DoC, unpublished data).
New Zealand falcons have been recorded during
four five-minute bird counts carried out between
2011 and 2017, in Keith George Memorial Park and
in Emerald Hill. Falcons are a rare resident in
Upper Hutt City, with a likely population of less
than 10 adult birds. Despite this, falcons are
regularly reported by citizen scientists from both
urban and suburban habitats in Upper Hutt City,
likely due to their relative conspicuousness (Figure
3.24). Falcon sightings often peak in late
summer/autumn, when juvenile birds are
Image courtesy of Steve Attwood/NZ Birds Online dispersing away from their natal territories.
3.2.12 Kakariki (Cyanoramphus novaezealandiae)
National conservation status: At Risk, Relict (Robertson et
al, 2017).
Regional conservation status: At Risk, Recovering
(GWRC/DoC, unpublished data).
Kakariki (red-crowned parakeet) have also been recorded
during four five-minute bird counts carried out between
2011 and 2017, in Keith George Memorial Park and in Wi
Tako Reserve. Kakariki are likely to be occasional visitors
to Upper Hutt City, and are unlikely to be maintaining a
local, self-sustaining population at present. Kakariki have
been reported on only two occasions by citizen scientists
since 2011, both sightings on the Hutt River adjacent to
Keith George Memorial Park (Figure 3.25).
Image courtesy of Laurie Ross/NZ Birds Online
31Sourced from the LINZ Data Service and licensed by Wellington regional Council for re-
use under the Creative Commons Attribution 4.0 International licence (link is external)
Figure 3.24: Distribution of NZ falcon in Upper Hutt City between 2011 and 2018. Orange circles represent NZ falcon detections at five-minute bird count
stations, with the size of the circle corresponding to the relative detection frequency. Smaller coloured circles represent NZ falcon observations reported
by local citizen scientists via eBird, NatureWatch or the NZ Garden Bird Survey.
32Sourced from the LINZ Data Service and licensed by Wellington regional Council for re-
use under the Creative Commons Attribution 4.0 International licence (link is external)
Figure 3.25: Distribution of red-crowned parakeet in Upper Hutt City between 2011 and 2018. Orange circles represent red-crowned parakeet detections
at five-minute bird count stations, with the size of the circle corresponding to the relative detection frequency. Smaller coloured circles represent red-
crowned parakeet observations reported by local citizen scientists via eBird, NatureWatch or the NZ Garden Bird Survey.
333.2.13 Rifleman (Acanthisitta chloris)
National conservation status: At Risk, Declining
(Robertson et al, 2017).
Regional conservation status: Not Threatened
(GWRC/DoC, unpublished data).
Riflemen have been detected on only two occasions
during these five-minute bird counts, at two count
stations in the southern portion of Wi Tako Reserve.
During the 2016 counts, riflemen were detected in
Keith George Memorial Park for the first time, though
not during a five-minute bird count (Figure 3.26).
Riflemen are also seldom reported by local citizen Image courtesy of John and Melody Anderson/New Zealand Birds
Online
scientists, with only a single recent record from the
Cannon Point walkway in Akatarawa Forest. Rifleman
is likely to be the rarest resident native forest bird species present in Upper Hutt parks and reserves,
with tiny, relict populations in both Keith George Memorial Park and Wi Tako Reserve.
3.2.14 Morepork (Ninox novaeseelandiae)
National conservation status: Not Threatened (Robertson
et al, 2017).
Regional conservation status: Not Threatened
(GWRC/DoC, unpublished data).
Moreporks have also been only detected twice during five-
minute bird counts carried out since 2011, both times in
Emerald Hill. In 2017, a single morepork was encountered
during the walk-through survey in Riverstone Park. This
bird was located at its daytime roost after the observer
investigated the alarm calls of a fantail. Despite this,
moreporks are likely to be relatively common and
widespread in Upper Hutt City reserves, given the large
amount of suitable habitat. Moreporks are occasionally
reported by local citizen scientists from suburban habitats
Image courtesy of Adam Clarke/NZ Birds Online in the city, however this species is almost certainly to be
under-reported due to its nocturnal habits (Figure 3.27). A
dedicated citizen science project is likely to be required in
order to gain an accurate understanding of the abundance and distribution of moreporks in the city.
34Sourced from the LINZ Data Service and licensed by Wellington regional Council for re-
use under the Creative Commons Attribution 4.0 International licence (link is external)
Figure 3.26: Distribution of rifleman in Upper Hutt City between 2011 and 2018. Orange circles represent rifleman detections at five-minute bird count
stations, with the size of the circle corresponding to the relative detection frequency. Smaller coloured circles represent tomtit observations reported by
local citizen scientists via eBird, NatureWatch or the NZ Garden Bird Survey.
35Sourced from the LINZ Data Service and licensed by Wellington regional Council for re-
use under the Creative Commons Attribution 4.0 International licence (link is external)
Figure 3.27: Distribution of morepork in Upper Hutt City between 2011 and 2018. Orange circles represent morepork detections at five-minute bird count
stations, with the size of the circle corresponding to the relative detection frequency. Smaller coloured circles represent morepork observations reported
by local citizen scientists via eBird, NatureWatch or the NZ Garden Bird Survey.
363.2.15 Long-tailed cuckoo (Eudynamys taitensis)
National conservation status: At Risk,
Naturally Uncommon (Robertson et al, 2017).
Regional conservation status: At Risk,
Naturally Uncommon (GWRC/DoC,
unpublished data).
The long-tailed cuckoo has only been detected
on one occasion during these five-minute bird
counts, at a count station in Keith George
Memorial Park in 2015. Long-tailed cuckoos
are also seldom reported by local citizen
scientists, with only six observations from four
separate locations in the vicinity of Upper Hutt
City since 2011 (Figure 3.28). It appears that
Image courtesy of Adam Clarke/NZ Birds Online
long-tailed cuckoos are only vagrants, or
irregular visitors to Upper Hutt City at the
present time, suggesting that the local
whitehead populations in both Keith George Memorial Park and Wi Tako will be largely free from
brood parasitism by these cuckoos.
37Sourced from the LINZ Data Service and licensed by Wellington regional Council for re-
use under the Creative Commons Attribution 4.0 International licence (link is external)
Figure 3.28: Distribution of long-tailed cuckoo in Upper Hutt City between 2011 and 2018. Orange circles represent long-tailed cuckoo detections at five-
minute bird count stations, with the size of the circle corresponding to the relative detection frequency. Smaller coloured circles represent long-tailed
cuckoo observations reported by local citizen scientists via eBird, NatureWatch or the NZ Garden Bird Survey.
384. DISCUSSION
4.1 Species diversity
The number of native forest bird species detected during these five-minute counts has varied little
since 2011, suggesting that current environmental management practices are succeeding at
maintaining the existing native species diversity in these parks and reserves. The majority of those
native species that are present tend to be either those that are able to cope with significant
modification and fragmentation of forest habitats and can persist in the presence of mammalian
predators (e.g. grey warbler and silvereye), or those that possess strong dispersal abilities (e.g. kereru)
that are able to reach these reserves from larger tracts of native forest habitat nearby (Heather &
Robertson, 2015). The eastern portion of Keith George Memorial Park, and the southern portion of
Wi Tako Reserve both support a higher diversity of native forest bird species than any of the remaining
parks and reserves sampled. This is likely due to the presence of mature beech forest in these portions
of the reserves (Wassilieff & Clark, 1986).
Two of the native forest bird species detected during these counts, rifleman and kakariki are extremely
uncommon and have very localised distributions, to the extent that they’re unlikely to maintain
functional populations in the reserves in which they’ve been detected in the long term. Riflemen have
only been detected at three locations in Wi Tako Reserve over the past six years, with only one or two
birds observed on any one occasion. During the 2016 counts, riflemen were detected in Keith George
Memorial Park for the first time since these surveys commenced in 2011. Indeed, the only prior record
of riflemen in Keith George Memorial Park that we’re aware of is an observation recorded by local
ornithologist R.H.D. Stidolph on the 20th April 1925 (Stidolph, 1925). Our 2016 record therefore, may
be the first confirmation of the persistence of rifleman in Keith George Memorial Park in over 90 years.
While current levels of mammalian pest control should be sufficient to allow a rifleman population to
recover, the results of this monitoring suggests that this recovery isn’t occurring, probably due to the
very low numbers of riflemen likely to be present in these reserves and in nearby areas of forest
habitat. Management options to improve the likelihood that riflemen will re-establish self-sustaining
populations in both Wi Tako Reserve and Keith George Memorial Park include the installation of nest
boxes to improve rifleman nesting success (Briskie et al, 2014) or a supplementary translocation of
individuals from a nearby source population such as the Wainuiomata Mainland Island.
Kakariki (red-crowned parakeets) have a similarly localised distribution, having only been detected at
several locations in or near Keith George Memorial Park and Wi Tako Reserve. While the current
mammalian pest control regime in both reserves would typically be sufficient to maintain local
populations of kakariki, the presence of introduced eastern rosellas (Platycercus eximius) at relatively
high densities may reduce the likelihood that kakariki can maintain self-sustaining populations in these
two reserves in the long-term. Eastern rosellas are considered to be a potential competitor for nest
sites with native hole-nesters such as kakariki (Wright & Clout, 2001; Galbraith, 2010) and also carry
avian pathogens such as beak and feather disease virus, a pathogen which is known to cause increased
mortality in wild parakeet populations (Ortiz-Catedral et al, 2009; Galbraith, 2010). The presence of
relatively high numbers of eastern rosellas in both Keith George Memorial Park and Wi Tako Reserve
may mean that the re-establishment of kakariki will be relatively unlikely, irrespective of the level of
mammalian pest control being maintained.
Nonetheless, Keith George Memorial Park and Wi Tako Reserve both continue to support populations
of almost all of the native forest bird species detected during these five-minute bird counts between
2011 and 2017 This is unsurprising, given that these are by far the two largest reserves currently being
monitored, and both are relatively well-connected to larger blocks of forest such as the Akatarawa
Forest and Eastern Hutt hills, in comparison to some of the smaller reserves sampled as part of this
39monitoring programme. Both reserves should continue to be considered high priorities for habitat
management within the Upper Hutt City reserves network, as both provide Upper Hutt City ratepayers
with the opportunity to encounter the full range of native forest bird species that currently exists in
the Upper Hutt reserves network. Both reserves have been identified as priority sites for biodiversity
management by Greater Wellington Regional Council, having been selected for inclusion in the
council’s regional Key Native Ecosystems Network (GWRC, 2015; Crisp et al, 2016).
4.2 Bird abundance
In general, encounter rates for frugivorous and nectivorous bird species such as silvereye, tui, kereru
and bellbird appear to have been more variable from year to year than those of insectivorous species
such as grey warbler, tomtit and whitehead. These former species are all highly mobile and individual
birds are known to move relatively long distances to exploit seasonally- or locally-available food
resources (Stewart & Craig, 1985; Robertson, 2013; Heather & Robertson, 2015). Annual differences
in the apparent abundance of these species are likely therefore to be caused by local movements of
birds into or out of these reserves in response to changes in local food availability. Because of their
mobility, the distributions of species such as tui, bellbird and silvereye are likely to vary both between
and within years, so monitoring over longer timeframes will be required before we can expect to
differentiate short-term fluctuations in distribution and conspicuousness from longer-term trends in
abundance. One such longer-term trend may now be emerging for silvereye, however. Between 2011
and 2017 there has been a significant, overall decline in silvereye encounter rates in Upper Hutt
reserves.
Although insectivorous bird species have tended to show less year-to-year variation in abundance in
Upper Hutt City parks and reserves, one exception to this pattern has been the fantail. Fantail
abundance and distribution declined significantly in Upper Hutt reserves between 2010 and 2011
(Govella et al, 2011; McArthur et al, 2012), before undergoing an extremely rapid, 11-fold increase in
apparent abundance between 2011 and 2017 (Figure 3.12). This initial decline was mirrored by similar
dramatic declines in fantail numbers observed in 2011 in other Wellington forests such as Akatarawa
Forest, Kaitoke Regional Park and the Wainuiomata Water Collection Area (McArthur et al, 2012;
GWRC unpublished data). This sudden and widespread decline was probably a consequence of heavy
fantail mortality that occurred during the two unusually severe snowfall events that occurred in the
Wellington Region between the 24th and 26th July and 14th and 17th August 2011 (NIWA, 2012). During
these events, snow fell to sea-level in Wellington City and record low temperatures were recorded
across the region. At Wallaceville in Upper Hutt for example, the maximum recorded temperature on
the 15th of August was the lowest ever observed at this site in 41 years of weather monitoring (NIWA,
2011). Fantails are known to be particularly susceptible to sudden declines and even local extinction
following such severe weather events (Miskelly & Sagar, 2008), but populations often quickly recover
thanks to this species’ high reproductive rate and good dispersal abilities (Heather & Robertson, 2015;
Powlesland, 2013). The rapid increase in the apparent abundance and distribution of fantails in Upper
Hutt reserves that has occurred between 2011 and 2017 therefore appears to represent a rapid
recovery of the local fantail population following a heavy mortality event that occurred during the
winter of 2011. This event highlights the potential susceptibility of local fantail populations to human-
induced climate change. Any increase in the frequency, duration or severity of adverse weather
events occurring in Upper Hutt, particularly those that involved severely cold temperatures, has the
potential to reduce the long-term viability of local fantail populations in Upper Hutt City and its
reserves (McGlone & Walker, 2011).
Significant declines in the encounter rates of both grey warblers and shining cuckoos between 2011-
13 and 2014-15 may have occurred as a result of a change in the observers who carried out these bird
counts in 2013 and 2014. Between 2011 and 2013, these bird counts were carried out by the same
two observers each year, but in 2014-15 were carried out by the lead author (NM) and two additional
40You can also read