NEVADA STATE PRESERVATION REPORT 2021 - DRAFT 11/20/2020 - NEVADA DEPARTMENT OF TRANSPORTATION
←
→
Page content transcription
If your browser does not render page correctly, please read the page content below
NEVADA DEPARTMENT OF TRANSPORTATION

        2021
        NEVADA
        STATE
        PRESERVATION
        REPORT

               DRAFT
              11/20/2020
                       February 2021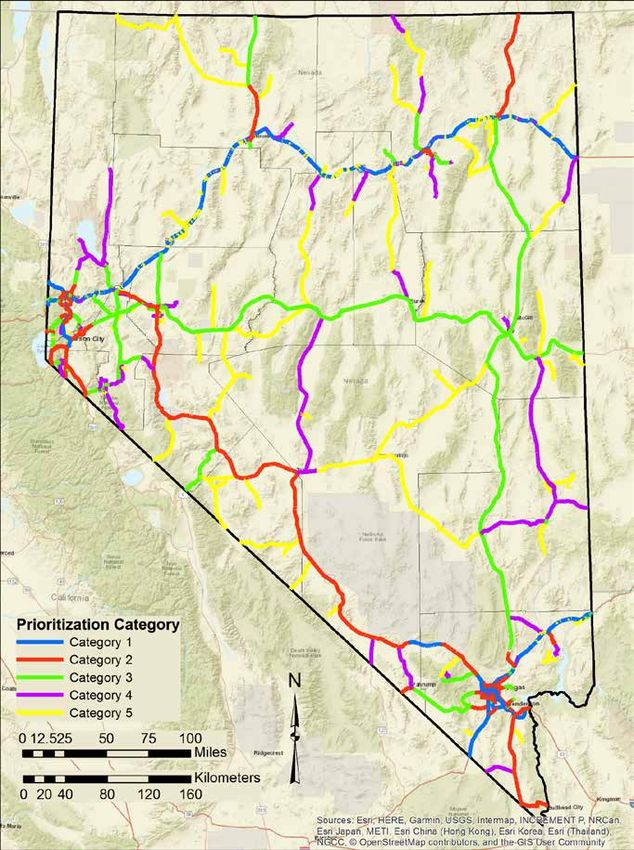
Kristina L. Swallow, P.E.            State of Nevada                           Steve Sisolak
        Director                                                                 Governor
                              Department of Transportation

         State Highway Preservation Report

                          Report to the 2021 Legislature
                As Required by Nevada Revised Statute 408.203 (3)

                                    February 2021
                                   (Biennium 2019-2020)

                            Nevada Revised Statute 408.203(3)
 The director of the Nevada Department of Transportation shall report to the Legislature by
 February 1 of odd-numbered years the progress being made in the Department's 10-year plan
 for the resurfacing of state highways. The report must include an accounting of revenues and
 expenditures in the preceding two fiscal years, a list of the projects which have been
 completed, including mileage and cost, and an estimate of the adequacy of projected
 revenues for timely completion of the plan.

                                                                                                I
                 2021 NEVADA STATE HIGHWAY PRESERVATION REPORT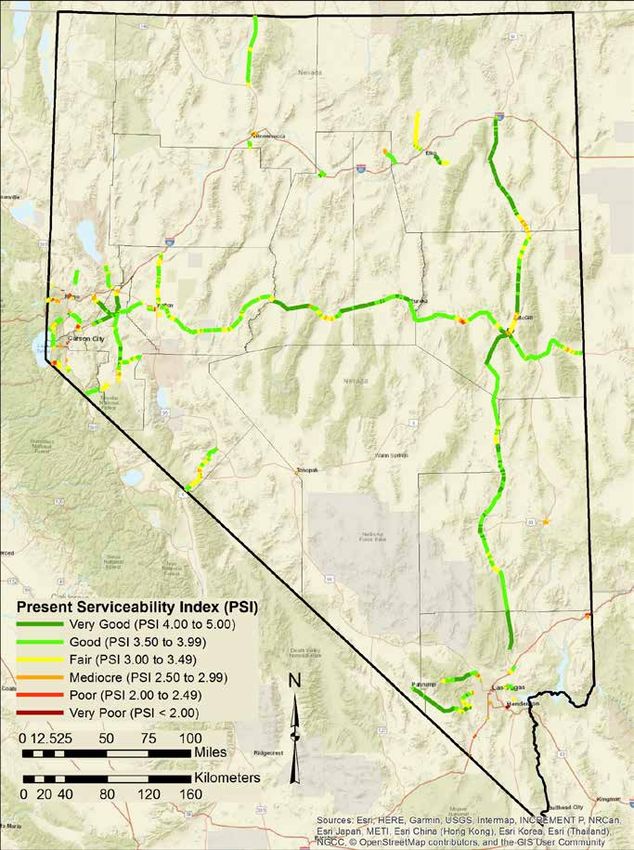
State of Nevada
                                Department of Transportation

                                              Mission

     Provide, operate, and preserve a transportation system that enhances safety, quality of life
     and economic development through innovation, environmental stewardship and a dedicated
     workforce.

                                               Vision

     To be a leader and partner in delivering effective transportation solutions for a safe and
     connected Nevada.

                                           Core Values

              • Respect – Treat others with dignity and value their contributions
              • Integrity – Do the right thing
              • Accountability – Take pride in our work and be accountable for our actions.
              • Communication – Communicate with transparency and responsiveness
                both internally and externally
              • Teamwork – Foster collaborative and effective partnerships both internally and
                externally
              • Flexibility – Be responsive to changing conditions and open to new ideas

                                               Goals

              • Safety first
              • Cultivate environmental stewardship
              • Efficiently operate and maintain the transportation system in Nevada
              • Promote internal and external customer service
              • Enhance organizational and workforce development

II
                    2021 NEVADA STATE HIGHWAY PRESERVATION REPORT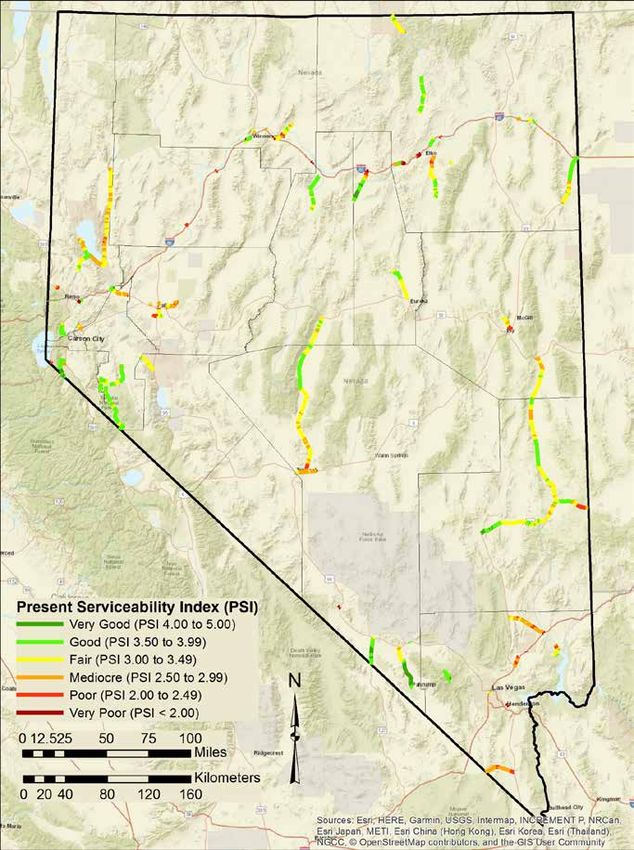
Table of Contents
EXECUTIVE SUMMARY .................................................................................................................... 1
   PAVEMENT PRESERVATION SYNOPSIS .................................................................................. 2
   BRIDGE PRESERVATION SYNOPSIS ......................................................................................... 5
PAVEMENT PRESERVATION ............................................................................................................ 8
   INTRODUCTION ............................................................................................................................. 8
   THE PAVEMENT MANAGEMENT SYSTEM ................................................................................ 8
   ROADWAY NETWORK INVENTORY ........................................................................................... 8
   PAVEMENT CONDITION RATING SYSTEM ............................................................................. 12
   PAVEMENT MAINTENANCE AND REHABILITATION STRATEGIES ..................................... 16
   REVENUE AND EXPENDITURE ................................................................................................. 18
   COSTS OF CONSTRUCTION ..................................................................................................... 24
   PAVEMENT CONDITION ............................................................................................................. 26
   PAVEMENT CONDITION GOAL .................................................................................................. 41
   TRANSPORTATION ASSET MANAGEMENT PLAN CONSISTENCY..................................... 43
   ADEQUACY OF PAVEMENT PRESERVATION FUNDS .......................................................... 45
   PROGRESS IN THE 10-YEAR PLAN FOR RESURFACING OF STATE HIGHWAYS ........... 47
   PAVEMENT PRESERVATION SUMMARY ................................................................................ 49
BRIDGE PRESERVATION ................................................................................................................ 51
   INTRODUCTION ........................................................................................................................... 51
   THE BRIDGE MANAGEMENT SYSTEM .................................................................................... 51
   BRIDGE INVENTORY ................................................................................................................... 51
   BRIDGE CONDITION REPORTING ............................................................................................ 51
   BRIDGE CONDITION OVER TIME .............................................................................................. 62
   THE COST OF BRIDGE CLOSURE FOR OWNERS ................................................................. 64
   PROJECT PRIORITIZATION ....................................................................................................... 65
   BRIDGE PRESERVATION FUNDING ......................................................................................... 65
   BIENNIAL EXPENDITURES FOR FISCAL YEARS 2019 TO 2020 .......................................... 66
   BACKLOG OF BRIDGE PRESERVATION WORK ..................................................................... 67
   PRESENT FUNDING VERSUS NEEDED FUNDING ................................................................ 67
   BRIDGE PRESERVATION ACTION PLAN ................................................................................. 70
   BRIDGE PRESERVATION SUMMARY ....................................................................................... 70

                                                                                                                                                  III
                       2021 NEVADA STATE HIGHWAY PRESERVATION REPORT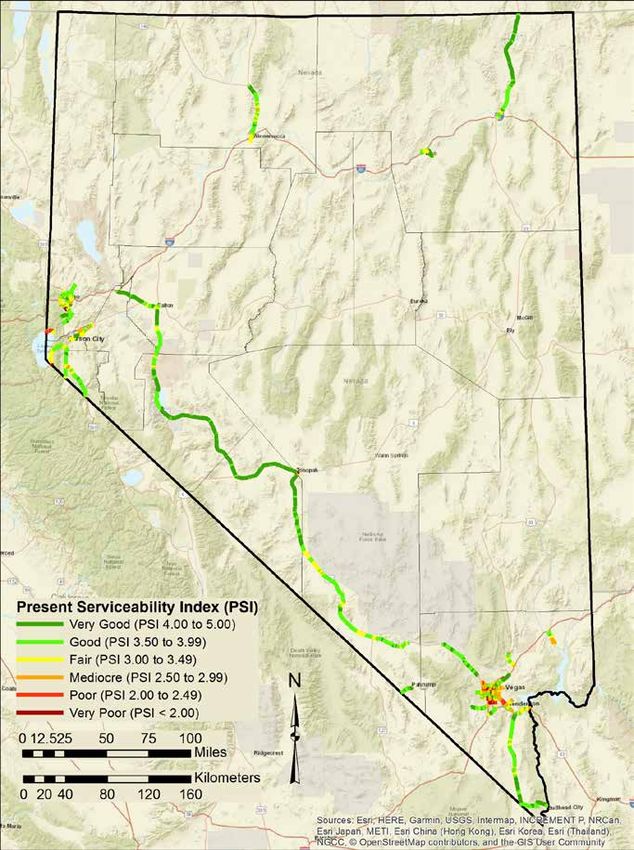
List of Figures
FIGURE E1. Future State-maintained Roadway Network Funding Alternatives ............................ 4
FIGURE E2. Anticipated Costs, Funds and Backlog of Bridge Preservation Work .............................. 7
FIGURE 1. Roadway Network Inventory Identified by Road Prioritization Categories ................ 10
FIGURE 2. PSI Rating System and Corresponding Pavement Condition .................................... 13
FIGURE 2. PSI Rating System and Corresponding Pavement Condition (Continued)................ 14
FIGURE 2. PSI Rating System and Corresponding Pavement Condition (Continued) ................ 15
FIGURE 3. Timing for Repair Strategies Based on PSI Rating System ............................................. 17
FIGURE 4. Timing for Proactive and Reactive Pavement Rehabilitation Expenditures............... 18
FIGURE 5. Funding Sources and Construction Expenditures ....................................................... 19
FIGURE 6. Rehabilitation Project Locations ................................................................................... 23
FIGURE 7. National Highway Construction Cost Index (NHCCI) ....................................................... 25
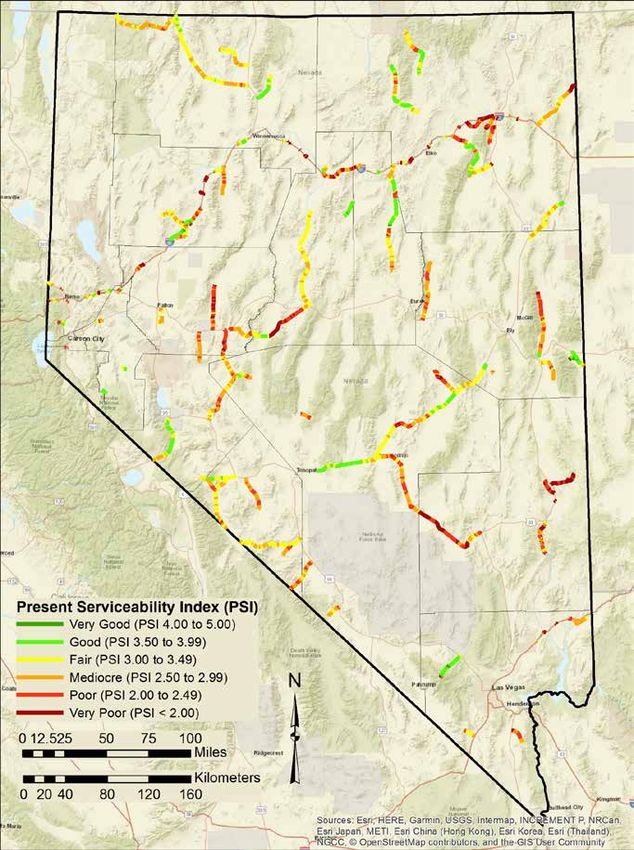
FIGURE 8. Roadway Network Inventory Identified by Present Serviceability Index (PSI) ................. 27
FIGURE 9. Road Prioritization Category 1 Identified by Present Serviceability Index (PSI) ....... 28
FIGURE 10. Road Prioritization Category 2 Identified by Present Serviceability Index (PSI) ..... 29
FIGURE 11. Road Prioritization Category 3 Identified by Present Serviceability Index (PSI) ..... 30
FIGURE 12. Road Prioritization Category 4 Identified by Present Serviceability Index (PSI) ..... 31
FIGURE 13. Road Prioritization Category 5 Identified by Present Serviceability Index (PSI) ..... 32
FIGURE 14. Average PSI and Expenditures for Roadway Network ............................................. 35
FIGURE 15. Average PSI and Expenditures for Road Category 1 ............................................... 36
FIGURE 16. Average PSI and Expenditures for Road Category 2 ............................................... 37
FIGURE 17. Average PSI and Expenditures for Road Category 3 ............................................... 38
FIGURE 18. Average PSI and Expenditures for Road Category 4 ............................................... 39
FIGURE 19. Average PSI and Expenditures for Road Category 5 ............................................... 40
FIGURE 20. Percentage of Miles per Road Category and Pavement Condition ......................... 42
FIGURE 21. Future State-maintained Roadway Network Funding Alternatives ................................. 48
FIGURE 22. Structurally Deficient Bridges ......................................................................................... 54
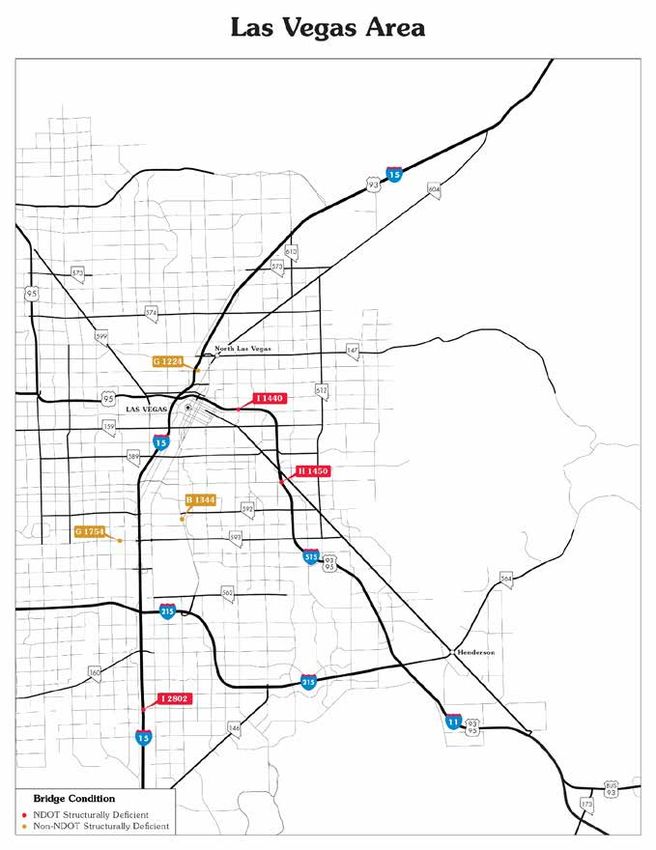
FIGURE 23A. Locations of Structurally Deficient Bridges .................................................................. 55
FIGURE 23B. Locations of Structurally Deficient Bridges .................................................................. 56
FIGURE 23C. Locations of Structurally Deficient Bridges .................................................................. 57
FIGURE 23D. Locations of Structurally Deficient Bridges .................................................................. 58
FIGURE 23E. Locations of Structurally Deficient Bridges .................................................................. 59
FIGURE 24. Nevada Bridge Conditions ............................................................................................. 61
FIGURE 25. NDOT Bridges, Decade of Construction ........................................................................ 61
FIGURE 26. NDOT Bridge Conditions over Time ............................................................................... 62
FIGURE 27. Structurally Deficient NDOT Bridges over Time ............................................................. 63
IV
2021 NEVADA STATE HIGHWAY PRESERVATION REPORT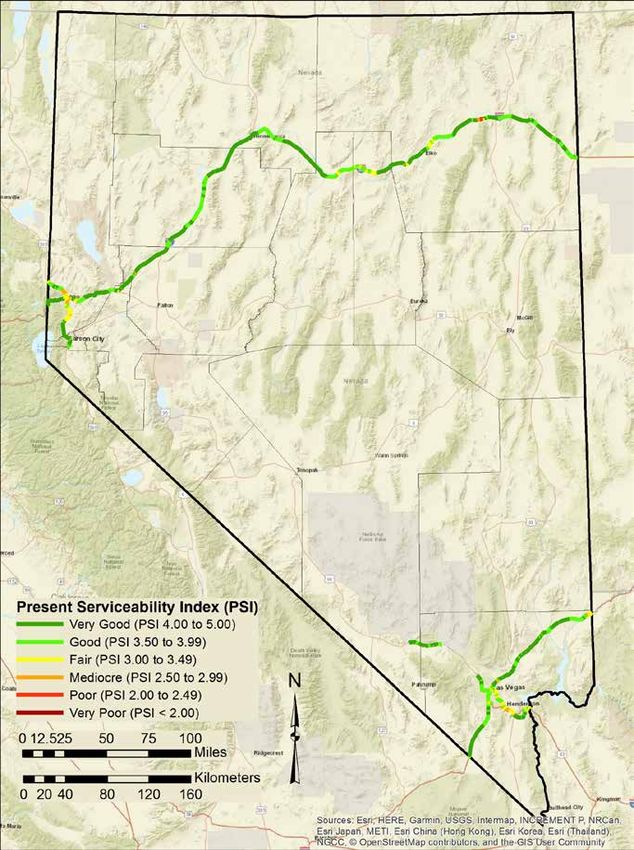
FIGURE 28. Non-NDOT Bridge Conditions over Time ....................................................................... 63
FIGURE 29. Structurally Deficient Non-NDOT Bridges over Time ..................................................... 64
FIGURE 30. Number of 50 Years Old Bridges by Decade ................................................................. 68
FIGURE 31. Anticipated Costs, Funds and Backlog of Bridge Preservation Work ............................ 70

List of Tables
TABLE 1. NDOT’s Road Prioritization Categories ................................................................................ 9
TABLE 2. Comparison of the USDOT and NDOT Road Classification Systems ......................... 11
TABLE 3. Advertised Pavement Repair Work for Fiscal Years 2019 and 2020 ........................... 20
TABLE 4. List of Rehabilitation Projects Advertised in Fiscal Year 2019 ...................................... 21
TABLE 5. List of Rehabilitation Projects Advertised in Fiscal Year 2020 ...................................... 22
TABLE 6. PSI Pavement Condition by Road Prioritization Category ............................................ 26
TABLE 7. District Pavement Condition Identified by Present Serviceability Index (PSI) ............. 33
TABLE 8. County Pavement Condition Identified by Present Serviceability Index (PSI) ............. 34
TABLE 9. Pavement Condition Versus Established Goal by Road Category ............................... 41
TABLE 10. Transportation Asset Management Plan Investment Consistency ............................. 44
TABLE 11. Average Investment of Preservation Funds by Category ........................................... 45
TABLE 12. Funding Necessary to Meet and Maintain Fair or Better Targets ............................... 46
TABLE 13. Bridge Expenditures in Fiscal Years 2019 and 2020 .................................................. 66
TABLE 14. Numbers of Bridges Rehabilitated, Replaced, or Seismically Retrofitted in Fiscal
Years 2019 and 2020 ........................................................................................................................ 66
TABLE 15. Backlog of Bridge Work, State Bridges 2021 ............................................................... 67
TABLE 16. Anticipated Bridge Backlog, Costs, and Funds ............................................................ 69

                                                                                                                                                  V
                       2021 NEVADA STATE HIGHWAY PRESERVATION REPORT
The Nevada Department of Transportation (NDOT) publishes the State Highway Preservation
Report biennially to summarize the work performed and anticipated workload required to
preserve the state-maintained roadway network and bridge infrastructure assets. This report
provides the Nevada Legislature with 2019-2020 information that can be used to determine
whether future revenues are adequate to maintain and preserve the infrastructure assets at
an acceptable level.

NDOT is responsible for maintaining 5,365 centerline miles (13,505 lane miles) of roads and
1,221 bridges. Although the state-maintained roadway network consists of only 14% of the
roads in Nevada, the network is overwhelmingly important as 49% of all automobile traffic and
68% of all heavy truck traffic travel on these roads.

Transportation infrastructure funding, including highway preservation funding, is in short
supply nationwide including Nevada. Article 9, Section 5 of the Nevada constitution created
the State Highway Fund with proceeds from licensing, registration, and other charges with
respect to the operation of any motor vehicle upon any public highway in this state plus excise
taxes on fuel minus administrative costs. This fund is reserved exclusively for the construction,
maintenance, and repair of public highways in Nevada. The Nevada Department of
Transportation (NDOT) is funded primarily with a mixture of fuel taxes, which was last
increased in 1992, and related user fees as noted above plus federal aid and typically does
not utilize any general funds. A safe, efficient and reliable roadway network is important, and
it promotes the general welfare of all the people in the State of Nevada. Adequate preservation
funding is necessary since deteriorated roads and bridges can impede the general economic
and social progress of the State. Investment in infrastructure will boost market economy,
advance travel and trade, and provide a legacy from which future generations can prosper.

Pavement and bridge preservation for fiscal years 2019 and 2020 were analyzed and
presented in this report. Major findings and conclusions are summarized in the Pavement and
Bridge Preservation Synopsis sections.

                                               1
                                                                                                    1
               2021 NEVADA STATE HIGHWAY PRESERVATION REPORT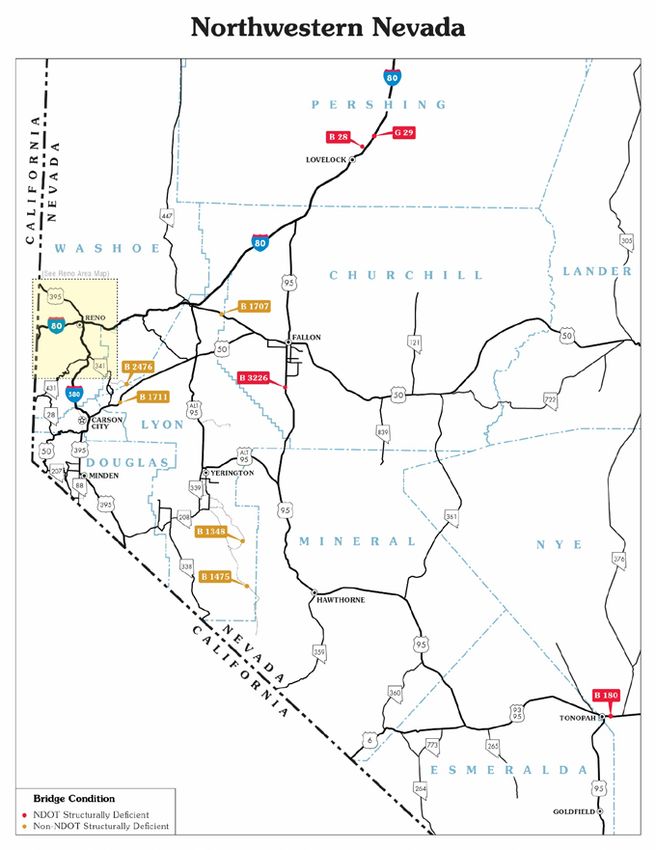
NDOT’s Pavement Management System (PMS) is used to help make decisions on how
    best to maintain and improve the condition of the entire state-maintained roadway
    network. This network consists of 5,365 centerline miles (13,505 lane miles) of roadway
    that is classified into five separate road prioritization categories. Each road prioritization
    category consists of pavements that share similar traffic volumes or loadings, resulting in
    similar rates of deterioration that require similar timing for maintenance and rehabilitation
    repair work. The pavement in each road prioritization category is objectively rated and
    quantified using the Present Serviceability Index (PSI) pavement condition rating system.
    This rating system is divided into six sections that correspond to pavement in very good,
    good, fair, mediocre, poor, and very poor or failed condition.

    Various repair strategies are implemented to improve pavement condition. Maintenance
    repair strategies include work such as chip seals, filling potholes, and patching.
    Preservation mostly involves thin overlays and mill and fills used to maintain surface
    quality. Rehabilitation repair strategies include plant-mix overlays, mill and fills, and cold
    in place recycling with a plant mix overlay. Reconstruction usually involves a roadbed
    modification followed by the placement of new bound layers. The cost and construction
    timing for the various repair strategies can be significantly different and are contingent on
    the pavement condition at the time of the repair. Significant cost savings are possible
    when pavement is proactively treated while in fair condition as compared to reactively
    reconstructed in very poor condition. Repairing pavement in very poor or failed condition
    requires major reconstruction that costs significantly more than the less invasive
    techniques that can be used when pavement is in fair or better condition.

    $317.69 million was invested for maintenance and rehabilitation repair work in fiscal years
    2019 and 2020. This expenditure included $183.12 million investment of state funds,
    $131.21 million investment of federal funds, and $3.37 million investment of funds from
    other sources. More than $283 million of repair work was contracted out to private
    contractors and $34.5 million of repair work was performed by NDOT Maintenance
    personnel. The $283 million of contracted repair work restored 624 centerline miles (1,445
    lane miles) of pavement to acceptable condition levels. Maintenance repair work was
    performed on 488 centerline miles (1,007 lane miles) and rehabilitation repair work was
    constructed on 136 centerline miles (438 lane miles).
                                                  2
2
                  2021 NEVADA STATE HIGHWAY PRESERVATION REPORT
The PSI pavement condition rating system was used to determine if long-term pavement
preservation expenditures were adequate to maintain or improve the roadway network to
acceptable condition levels. Results show that long-term historical funding has not been
adequate. At these historical funding levels, it is anticipated that the overall average
condition of the state-maintained roadway network would deteriorate but remain in fair
condition for the near future.
Previously, a pavement condition goal to maintain a minimum of 95% of roads in fair or
better condition in each road prioritization category was established to provide a measure
of the effectiveness of the maintenance and rehabilitation repair work performed on state
roads. Recognizing the challenge to achieve that goal with limited resources, in 2020,
new performance goals were put in place that are both achievable and provide levels of
service appropriate for each category. The current goal is 95% fair or better for category
1, 90% for category 2, 85% for category 3, 75% for category 4, and 50% for category 5.
Category 1, 3, and 4 currently meet or exceeds these revised goals. Road prioritization
categories 2 and 5 roads fail to meet the established pavement condition goal.
An estimate of the adequacy of projected spending for the timely completion of the
resurfacing plan was ascertained. Historical spending is not adequate to meet the
established performance goal, and an additional expenditure of $100 million is required
each year in addition to the long-term historical average expenditure of $103 million per
year. Projected expenditure of $203 million is required each year to maintain the roadway
network at acceptable condition levels consistent with the goals.
The progress in the 10-year plan for resurfacing of state highways was examined and
different budget scenarios were investigated. The investigation included the comparison
of the predicted percentage of roads in fair or better condition for years 2021 through
2031 with budget scenarios of $203 million and $103 million per year expenditures for
pavement preservation repair work.
Ø The first budget scenario included an average $203 million per year expenditure
for pavement preservation repair work. This budget scenario represents the current
planned spending level, which will maintain a consistent pavement condition of
75% of roads in fair or better condition and allow each category to meet or exceed
the established percent fair or better target.
3
3
2021 NEVADA STATE HIGHWAY PRESERVATION REPORTØ The second budget scenario consisted of an average $103 million per year
expenditure for pavement preservation repair work. This budget is the average
expenditure for pavement preservation work from 2013 through 2020. This budget
scenario would result in the average percentage of roads in fair or better condition
deteriorating from 75% in the year 2019 to approximately 65% by the year 2031.
FIGURE E1 illustrates the comparison of the predicted percentage of roads in fair or better
condition spending either $203 million or $103 million per year expenditures for pavement
repair work.
4
4
2021 NEVADA STATE HIGHWAY PRESERVATION REPORTThe Nevada Department of Transportation is responsible for inspecting and reporting the
condition of all the bridges open to the public in Nevada, except bridges on federal lands.
There are currently 2,107 public bridges in the NDOT bridge inventory. NDOT maintains 1,221
bridges; county and city governments maintain 815 bridges; other local agencies maintain 48
bridges; private entities maintain 11 bridges; railroad maintains 6 bridges; and other state
agencies maintain 6 bridges. The bridge inventory data, together with other factors, allow
NDOT to identify preservation priorities and monitor the state’s effort to maintain bridges in a
structurally sound, functional, and safe condition.
The Sufficiency Ratings are numerical ratings used to assess the overall condition of a bridge
and assists in the prioritization of bridge preservation efforts. Generally, bridges with
Sufficiency Ratings more than 80 (Condition Ratings for critical components of 7 or greater)
are considered “good”, those with Sufficiency Ratings between 50 and 80 (Condition Ratings
of 5 to 6) are considered “fair”, and those with Sufficiency Ratings less than 50 (Condition
Ratings of 4 or less) are considered “poor”. Of the 1,221 bridges maintained by NDOT, only
12 or 1% have a Condition Rating of a critical component of less than 5 and is considered to
be in poor condition.
Structures with low condition or load ratings may be classified as Structurally Deficient.
Structurally Deficient bridges are not necessarily unsafe or dangerous. Rather, these bridges
become a priority for corrective measures, and may be posted to restrict the weight of vehicles
using them. If a deficiency is determined to be severe, or the load carrying capacity is
extremely low, the bridge would be closed to protect the travelling public. Of the 1221 bridges
maintained by NDOT, only 12 or 1% are considered to be Structurally Deficient.
Currently, Nevada bridge conditions compare very favorably to the bridge conditions in many
other states, even though more than half of NDOT’s bridges are more than 40 years old.
However, since older bridges generally have a useful service life of 50 to 75 years, many of
NDOT’s bridges will require more frequent rehabilitation and replacement in the near future.
When bridges deteriorate and require closure, the resulting detours can be very disruptive to
traffic. In both rural and urban bridge closures, the user costs associated with detours can
often be quite significant until the bridge is reconstructed or repaired. The importance of bridge
maintenance and rehabilitation cannot be overemphasized.
5
5
2021 NEVADA STATE HIGHWAY PRESERVATION REPORTThe Nevada Department of Transportation spent a total of approximately $16 million in fiscal
years 2019 and 2020 on bridge preservation while spending on bridge preservation for the
previous two years was approximately $12 million total. The increasing need and decreased
spending on bridge rehabilitation, seismic retrofit, and replacement for the last two fiscal years
increased the backlog of bridge work by over $13 million. An increasing investment in bridge
preservation funding will be necessary to alleviate current backlog and address the anticipated
growing rehabilitation and replacements needs of the state’s aging inventory. The Department
has committed to provide additional bridge preservation funding and, through the One Nevada
Plans, looks to prioritize and utilize this investment in the most efficient way possible, to
preserve the service-life of structures state-wide.
While the need for preservation funding increases every year as the bridge inventory
continues to grow, a much greater funding deficiency is likely to occur because of the age of
NDOT’s bridges. Many of NDOT’s bridges are approaching the end of their useful life and the
need for bridge preservation funds is expected to increase greatly over the next decade. The
majority of the increase in bridge preservation funds needed is an increase in the replacement
of old bridges.
Since NDOT already has 507 bridges over 50 years old, the current practice of replacing
approximately 3 bridges a year is a replacement rate of 0.6% of the bridges over 50 years old.
A replacement rate of 2% a year is necessary to replace the bridges over 50 years old before
they reach 100 years old. If a 2% annual replacement rate is reached in ten years and is
maintained for another ten years, the number of bridges over 50 years old will begin to
stabilize. Twenty years from now, NDOT would have approximately 620 bridges over 50 years
old and would be replacing 12 bridges each year.
NDOT’s current backlog of bridge preservation work is approximately $171 million. Increased
spending in bridge corrective maintenance, rehabilitation, and replacement is necessary to
preserve NDOT’s bridge assets and to avoid costly bridge closures and emergency bridge
replacements.
If bridge preservation spending is increased over the next five years as shown in FIGURE E2,
it is anticipated that the Department can address future projected preservation needs and
6
6
2021 NEVADA STATE HIGHWAY PRESERVATION REPORTreduce the current backlog of bridge work. If the funding is gradually increased as shown over
the next five years, the forecast bridge preservation cost is expected to level off at
approximately $51 million per year.
FIGURE E2. Anticipated Costs, Funds and Backlog of Bridge Preservation Work
7
7
2021 NEVADA STATE HIGHWAY PRESERVATION REPORTPAVEMENT PRESERVATION
This report summarizes the Nevada Department of Transportation's (NDOT’s) effort to
preserve the state-maintained roadway network. The roadway network is vital and one of
the state’s most valuable assets. Although the roadway network consists of only 14% of
the roads in Nevada, approximately 49% of all traffic and 68% of all heavy trucks travel
on state-maintained roads. The following discussion explains how NDOT uses its
available pavement preservation funds to maintain and rehabilitate the roadway network.
The Pavement Management System (PMS) includes the entire inventory of the state’s
existing pavement assets and condition. The primary objective of the PMS is to provide
information that enables users to make informed decisions about how to maintain and
improve the condition of the roadway network while maximizing pavement performance
through the practical use of available funds. NDOT’s management of the pavement
inventory allows maintenance and rehabilitation repair work to be prioritized in an
objective and systematic manner. The PMS improves the efficiency of decision making,
provides assessment on the consequences of decisions through comparative analysis,
and ensures consistency of network and project level activities and results.
The state-maintained roadway network consists of 5,365 centerline miles (13,505 lane
miles) of roads. Centerline miles indicate the length of the road, regardless of the number
of lanes within each mile. So that the network may be more easily managed, it is classified
into five separate road prioritization categories. These road categories are based on
heavy truck equivalent single axle loads (ESALs), average daily traffic (ADT), and federal
guidelines for highway classification descriptions. The roads within each category have
similar in-place pavement thicknesses, similar rates of deterioration, and similar timing for
maintenance and rehabilitation repair work.
8
8
2021 NEVADA STATE HIGHWAY PRESERVATION REPORTTABLE 1 lists the five road prioritization categories and their corresponding descriptions.
Also listed are several examples of easily recognized roads throughout the state to assist
with relating these roads to the assigned categories and descriptions.
TABLE 1. NDOT’s Road Prioritization Categories
Road
1
Prioritization Description Examples
Category
IR015, Clark County
1 Controlled Access Roads IR580, Washoe County
IR080, Elko County
ESAL > 540 SR146, St. Rose Parkway, Clark County
2 or US050, Lincoln Highway, Carson City
ADT > 10,000 SR227, Fifth Street, Elko County
540 ≥ ESAL > 405 SR157, Kyle Canyon Road, Clark County
3 or SR028, Lake Tahoe Area, Douglas County
1,600 < ADT ≤ 10,000 SR225, West Urban Limits of Elko, Elko County
405 ≥ ESAL > 270 SR158, Deer Creek Road, Clark County
4 or SR206, Foothill Road/Genoa Lane, Douglas County
400 < ADT ≤ 1,600 SR228, Jiggs Road, Elko County
SR156, Lee Canyon Road, Clark County
5 ADT ≤ 400 SR121, Dixie Valley Road, Churchill County
SR229, Secret Pass Road, Elko County
1
ESAL is an acronym for “Equivalent Single Axle Load.” This engineering concept is the basis for the
method used to quantify the pavement loading from trucks and count the heavy trucks that travel on
roads. ADT is an acronym for “Average Daily Traffic.” The PMS includes the ADT data, as provided by
NDOT’s Traffic Division, for every road in the state-maintained roadway network.
FIGURE 1 is a map that highlights the state-maintained roadway network inventory
identified by NDOT’s five road prioritization categories.
9
9
2021 NEVADA STATE HIGHWAY PRESERVATION REPORT10
10
2021 NEVADA STATE HIGHWAY PRESERVATION REPORTThere are numerous methods used to classify roads. The United States Department of
Transportation (USDOT) classifies roads for national purposes, while state departments
of transportation classify road inventories using methods for state needs and the needs
of the individual PMS systems employed. The USDOT system focuses mainly of the
purpose of the route, while the NDOT system is largely based on traffic volumes and
loading. Despite these differences, the two systems are generally compatible.
TABLE 2 compares the USDOT’s classification methodology with NDOT’s classification
methodology, which will allow individuals familiar with national classification terminology
to more easily understand the associated NDOT road prioritization categories.
USDOT’s
NDOT’s Road
Functional
Description Examples Prioritization
Classification
Catgegory
Category
Interstates are the highest classification of arterials and
1 Interstate were designed and constructed with mobility and long- 1
distance travel in mind.
The roads in this classification have directional travel
Principal
lanes and are usually separated by some type of
Arterial – Other
2 physical barrier. Access and egress points are limited 1 and 2
Freeways and
to on-ramp and off-ramp locations, or a very limited
Expressways
number of at-grade intersections.
The roads in this classification serve major centers of
Principal
3 metropolitan areas, provide a high degree of mobility, 2
Arterial - Other
and can also provide mobility through rural areas.
Minor arterials link cities, larger towns, and other traffic
4 Minor Arterial 3 and 4
generators such as resorts.
Major collector roads provide service to any county seat
not on an arterial route, to the larger towns not directly
served by higher systems, and to traffic generators of
5 Major Collector 4 and 5
equivalent intra-county importance such as shipping
points, parks, important mining, agricultural areas, and
more.
Minor collectors distribute and channel trips between
*Not
6 Minor Collector local roads and arterials, usually over a distance of less
Applicable
than three-quarters of a mile.
Local roads are not intended for use in long distance
*Not
7 Local travel, except at the origin or destination end of the trip,
Applicable
due to their provision of direct access to abutting land.
*Nevada’s state-maintained roadway network serves the broad expanse within the state’s boundaries.
Several USDOT classifications are developed to describe local county and city roads that are limited for
use in long distance travel and do not encompass the types of roads for which NDOT is responsible.
11
11
2021 NEVADA STATE HIGHWAY PRESERVATION REPORTTo help manage pavements so that they can provide a smooth, comfortable, and safe
ride, it is useful to have a pavement condition rating system that includes all attributes
important to travelers. These attributes include travelers’ responses to motion and
appearance as demonstrated by a smooth riding surface that is without cracking, rutting,
patching, or potholes. NDOT uses a pavement condition rating system called the Present
Serviceability Index (PSI) to objectively measures all these important attributes.
The PSI pavement condition rating system uses a value that is calculated using pavement
roughness measurements and mathematical formulas that quantify pavement distresses
such as cracking, raveling, rutting, and potholes. These measurements and formulas are
combined and standardized into an objective rating scale numbered from zero to five.
Pavement rated from four to five is interpreted as pavement in new or very good condition
with a smooth surface that is without distress or irregularities. Pavement rated less than
two is interpreted as pavement in very poor or failed condition with the roughest of surface
conditions and no longer navigable at the posted speed limit. The PSI pavement condition
rating system is used to quantify the pavement condition for each road within the state-
maintained roadway network.
FIGURE 2 demonstrates how the PSI pavement condition rating system is divided into
six condition levels that correspond to pavement in very good, good, fair, mediocre, poor,
and very poor or failed condition. Descriptions include photographs of what pavement
would typically look like in each condition as well as a discussion of the various stages of
disrepair as pavement deteriorates over time.
12
12
2021 NEVADA STATE HIGHWAY PRESERVATION REPORTPSI
Pavement
Rating Description of Pavement Condition
Condition
Scale
5.00
Very Good to
4.00
Pavement in very good condition has an excellent, very smooth ride quality and
is without any pavement distress. Pavement is in new condition.
3.99
Good to
3.50
Pavement in good condition has a very smooth ride quality and begins to show
minor distresses that are typically environmental rather than load related.
Distresses include minor non-wheelpath longitudinal and transverse cracks as
well as minor surface raveling.
Pavement in good condition can especially benefit from preventive maintenance
such as crack sealing and surface treatments such as chip, slurry, and scrub
seals. Surface treatments impede pavement deterioration and protect the
pavement structure from water infiltration and weathering.
13
13
2021 NEVADA STATE HIGHWAY PRESERVATION REPORTPSI
Pavement
Rating Description of Pavement Condition
Condition
Scale
3.49
Fair to
3.00
Pavement in fair condition has a good ride quality except noticeable environmental
distress has developed. Non-wheelpath longitudinal and transverse cracks are
frequent. There is light surface oxidation and weathering. Structural distress in the
wheelpath in the form of ruts and fatigue cracks begin to occur.
Pavement in fair condition is a candidate for a surface treatment such as micro-
surfacing or double chip seal, and possibly a two inch overlay. An overlay applied on
pavement in this condition will prevent the formation of more severe structural distress.
2.99
Mediocre to
2.50
Pavement in mediocre condition has a barely acceptable ride quality and has
accumulated significant environmental and structural distresses. Pavement has non-
wheelpath longitudinal cracking and transverse cracks so closely spaced that block
cracks develop. Ruts and fatigue cracks in wheelpath are present.
Pavement in mediocre condition is candidate for three inch or thicker overlays and may
require patching before the new overlay is placed. Pavement structural deterioration is
evident.
14
14
2021 NEVADA STATE HIGHWAY PRESERVATION REPORTPSI
Pavement
Rating Description of Pavement Condition
Condition
Scale
2.49
Poor to
2.00
Pavement in poor condition has a poor ride quality and has accumulated large amounts
of environmental and structural-related distresses. The non-wheelpath longitudinal and
transverse cracks are severe. The surface is weathered, rutted, and fatigue cracks are
widespread.
Lower volume roads are candidates for thick overlays or cold in-place recycling (CIR)
and overlay repair. Higher volume roads will require reconstruction such as a full-depth
recycling and overlay repair.
Very Poor
or < 2.00
Failed
Pavement in very poor condition has a very poor ride quality and has accumulated
significant environmental and structural distresses. The surface is pitted and there are
wide non-wheelpath longitudinal and transverse cracks. Networked, spalled fatigue
cracks and deep ruts are prevalent. The deterioration is so advanced potholes are
frequent. The road is no longer navigable at the posted speed limit.
Pavement in this condition requires constant maintenance activity such as patching and
filling potholes. Citizen complaints are common. This pavement always requires full-
depth reconstruction and recycling the road may not be an option.
15
15
2021 NEVADA STATE HIGHWAY PRESERVATION REPORTPavement service life is a function of many parameters. The parameters of most
consequence are the smoothness of the road and the amount of heavy truck loads that
the pavement experiences. New pavement has excellent characteristics such as a very
smooth ride without any surface distress or defects. Relatively little funding is necessary
for new pavement maintenance. However, the smooth ride will gradually become rough
due to cracks, distress, or other types of defects as the pavement deteriorates. Therefore,
it becomes necessary to spend an increasing amount of funds in order to maintain or
rehabilitate the pavement to an acceptable condition level as the pavement deteriorates
over time. The types and extents of distress or defects, along with the severity of the
pavement roughness, determine what types of repair strategies are required for
maintenance and rehabilitation repair work.
Pavement repair strategies are classified into four major categories: Maintenance,
Preservation, Rehabilitation, and Reconstruction.
• . This category includes repairs that address surface deterioration,
but that do not improve the pavements ability to carry traffic loads. This includes
fog seals, crack sealing, chip seals, slurry seals, and full and partial depth patching.
• . Used more specifically when describing pavement treatments,
preservation includes those treatments applied to roads in good condition in order
to prevent further degradation and maintain a high level of service. This category
mostly involves thin overlays and mill and fills used to maintain surface quality.
. This category includes more substantial repairs that are applied
when the pavement is in fair or worse condition to repair the structurally deficient
section and provide a new surface that improves the pavement’s ability to carry
traffic loads. Typical rehabilitation treatments include plant-mix overlays, mill and
• . Reconstruction repairs are applied to roads that are damaged to
the point where they require replacement or recycling of the bound layers, and
potentially the base layers. Typically, reconstruction involves a roadbed
modification followed by the placement of new bound layers.
16
16
2021 NEVADA STATE HIGHWAY PRESERVATION REPORTFor simplicity, in most other sections of this report, the term rehabilitation is used to
include all preservation, rehabilitation, and reconstruction work.
FIGURE 3 exhibits the construction timing for pavement repair strategies based on the
PSI pavement condition rating system. Maintenance and preservation repair strategies
are typically applied when a pavement has a PSI rating of 3.50 or higher. Rehabilitation
and reconstruction repair strategies are commonly constructed when a pavement has a
PSI rating of 3.49 or less.
It should be noted however that the repair strategies explained herein are general policies
and that the construction timing varies for each road prioritization category. For example,
due to financial constraints, a category 5 road may receive a maintenance treatment such
as a chip seal around a PSI rating of 2.5. Conversely, A category 1 road may receive a
rehabilitation treatment while still in good condition in order to proactively maintain the
higher performance standards present on these routes.
5
PSI Rating Scale and Corresponding
VERY GOOD
Pavement Condition Category
4
Maintenance and Preservation - PSI 3.5 or greater. GOOD
Rehabiltation and Reconstruction - PSI 3.49 or less. FAIR
3
MEDIOCRE
POOR
2
VERY POOR
1
FAILED
0
Pavement Age
FIGURE 3. Timing for Repair Strategies Based on PSI Rating System
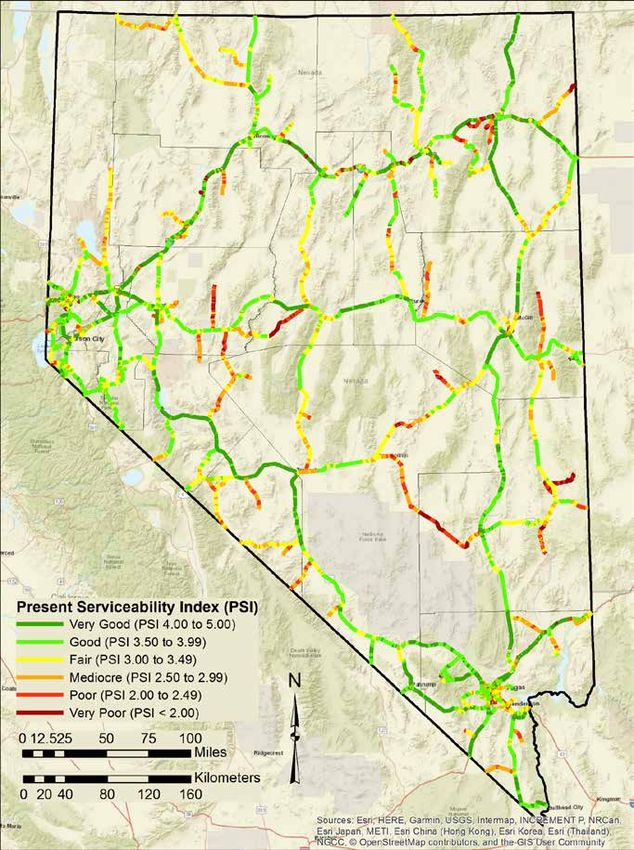
The funds needed for the repair work required to improve roads to acceptable condition
levels when pavement is in poor or worse condition are far greater than the funds needed
for the repair work when pavement is in fair or better condition. FIGURE 4 shows the
timing for the cost saving between various repair options based on the PSI pavement
17
17
2021 NEVADA STATE HIGHWAY PRESERVATION REPORTcondition rating system. Project expenditures will significantly increase when pavement
is allowed to deteriorate from fair condition into very poor or failed condition. Repair work
costs six to ten times more for major reconstruction necessary when pavement is in very
poor or failed condition as compared to the less invasive techniques that can be used
when pavement is in fair or better condition.
NDOT proactively investigates opportunities to use resources wisely by repairing
pavement in fair condition before the pavement deteriorates into worse, and thus more
costly to repair condition. This philosophy of proactive pavement repair strategies lowers
pavement life-cycle costs and better serves the taxpaying public.
5
Spending $1 on "proactive" pavement
VERY GOOD
PSI Rating Scale and Corresponding
rehabilitation before this point…
Pavement Condition Category
4
40% Drop in Quality GOOD
75% of Service Life FAIR
3
MEDIOCRE
40% Drop in Quality POOR
2
VERY POOR
12% of Service Life
1
delays or eliminates the
need to spend $6 to $10 here FAILED
0
Pavement Age
The pavement maintenance and rehabilitation repair work that is performed on the state-
maintained roadway network is principally funded through the State Highway Fund, which
is a dedicated source of funding established by the Nevada State Constitution expressly
for this purpose and appropriated by the legislature. State Highway Fund revenue is
primarily provided by Federal Aid and state resources such as the State gasoline and
special fuel taxes, vehicle registration fees, commercial carrier fees, and driver license
fees.
NDOT invested $317,693,409 for maintenance and rehabilitation repair work on the state-
18
18
2021 NEVADA STATE HIGHWAY PRESERVATION REPORTfees.
NDOT invested $317,693,409 for maintenance and rehabilitation repair work on the state-
maintained roadway network during fiscal
18 years 2019 and 2020. This expenditure
included a $186,118,041 investment of state funds, a $131,207,366 investment of federal
funds, and a $3,368,002 investment of funds from other sources. Other funding sources
include support by local city and public works agencies as well as private utility and
telecommunication enterprise with vested interest in localized areas.
There was $283,178,744 of road repair work contracted out to private contractors and
$34,514,665 of road repair work performed by NDOT Maintenance personnel. The
maintenance repair work was accomplished by both private road contractors and NDOT
personnel. The rehabilitation repair work was solely accomplished by private road
contractors. FIGURE 5 displays the funding sources and construction expenditures
information that includes both maintenance and rehabilitation repair work for fiscal years
2019 and 2020.
NDOT advertised $283,178,744 of contract maintenance and rehabilitation pavement
19 19
2021 NEVADA STATE HIGHWAY PRESERVATION REPORTNDOT advertised $283,178,744 of contract maintenance and rehabilitation pavement
repair work during fiscal years 2019 and 2020.
19 This obligated expenditure improved or
maintained the condition level of 624 centerline miles (1,445 lane miles) of roads. TABLE
3 contains a financial summary of the advertised maintenance and rehabilitation repair
work that was accomplished on the state-maintained roadway network during fiscal years
2019 and 2020, along with the corresponding mileage that was improved.
TABLES 4 and 5 list the specific rehabilitation projects that were advertised during fiscal
years 2019 and 2020. FIGURE 6 identifies the statewide locations where fiscal year 2019
and 2020 rehabilitation projects were completed.
Contract Maintenance Contract Rehabilitation Total Contract Maintenance
Repair Work Repair Work and Rehabilitation Repair
Fiscal Year
Expenditure and Expenditure and Work Expenditure and
Mileage Mileage Mileage
$17,022,924 $143,276,555 $160,299,479
2019 176 Centerline Miles 102 Centerline Miles 278 Centerline Miles
373 Lane Miles 305 Lane Miles 678 Lane Miles
$25,128,945 $97,750,320 $122,879,265
2020 312 Centerline Miles 34 Centerline Miles 346 Centerline Miles
634 Lane Miles 133 Lane Miles 767 Lane Miles
$42,151,869 $241,026,875 $283,178,744
Biennium Total 488 Centerline Miles 136 Centerline Miles 624 Centerline Miles
1007 Lane Miles 438 Lane Miles 1445 Lane Miles
20 20
2021 NEVADA STATE HIGHWAY PRESERVATION REPORTF IS C A L Y E A R 2 0 19
C o nt ra c t R o ad
C o unt y M ile po s t s Le ngt h in M ile s C o st
N um be r C a t e go ry
Clark 0.000 - 17.550 5
3722 24.410 $ 5,842,198
0.460 - 3.320 5
LO C A T IO N : SR 156, LEE CA NYON ROA D, FROM SKI RUN TO US 95, CL 0.00 TO CL 17.55; SR 157, KYLE CA NYON ROA D FROM THE
TRA ILING EDGE OF B -609 TO SR 158, DEER CREEK ROA D, CL 0.46 TO CL 3.32.
S C O P E : ON SR 156, 1.5" COLDM ILL, 2" DENSE GRA DE P LA NTM IX B ITUM INOUS SURFA CE WITH 3/4" OP EN GRA DE B ITUM INOUS
SURFA CE TO SR 158, THEN 1.5" COLDM ILL, 2" P LA NTM IX B ITUM INOUS SURFA CE TO US95; ON SR 157, 1.5" COLDM ILL, 2" DENSE GRA DE
P B S WITH 3/4" OP EN GRA DE B ITUM INOUS SURFA CE
21.960 - 43.293 3
3 7 16 Clark/Nye 11.142 $ 25,262,492
0.000 - 0.950 3
LO C A T IO N : SR 160 B LUE DIA M OND RD, CLA RK COUNTY, FROM 1.03 M ILES NORTH OF M OUNTA IN SP RINGS SUM M IT TO THE CL/NY CO.
LINE (EA STB OUND ONLY) M P CL 21.960 TO M P NY 0.950
S C O P E : ROA DB ED M ODIFICA TION, P ULVERIZE 12 INCHES, REM OVE 4 INCHES, P ROCESS 8 INCH, 6 INCH P B S, WITH OP EN GRA DE
61.495 - 66.263 3
3760 White P Ine 5.186 $ 7,829,399
37.529 - 37.947 3
LO C A T IO N : US 50, WHITE P INE COUNTY, FROM INTERSECTION OF RUTH/KIM B ERLY ROA D EA ST TO WEST END OF ELY, M P WP 61.495
TO 66.263 A ND ON US 6 FROM 0.418 M ILES WEST OF INTERSECTION OF US 93 TO INTERSECTION WITH US 93, M P WP 37.529 TO 37.947
S C O P E : 2 INCH COLDM ILL, 3 INCH P B S DENSE GRA DE, 0.75 INCH P B S OP EN GRA DE ON US 50; 2.75 INCH COLDM ILL, 2 INCH P B S
DENSE GRA DE, 0.75 INCH OP EN GRA DE ON US 6
3763 Carso n City 3.140 - 8.950 5.81 1 $ 11,267,006
LO C A T IO N : I 580 CA RSON CITY FREEWA Y FROM FA IRVIEW INTERCHA NGE TO 0.66 M I SO OF THE CC/WA COUNTY LINE. M P CC 3.14 TO
CC 8.95
S C O P E : 2" COLDM ILL WITH 2" P LA NTM IX B ITUM INOUS SURFA CE WITH OP EN GRA DED SURFA CE, ITS, A ND WRONG-WA Y DRIVER
SYSTEM
3765 Elko 83.260 - 102.790 19.53 1 $ 35,152,895
LO C A T IO N : I 80 FROM 1.04 E OF THE M OOR INTERCHA NGE TO 1.871M I E OF THE OA SIS INTERCHA NGE. M P EL 83.26 TO EL 102.79
S C O P E : 2" M ILL WITH 2" INCH P B S OVERLA Y & OP EN GRA DED; CONSTRUCT NEW EB TRUCK CLIM B ING LA NE M P EL 93 TO 96 &
IM P ROVEM ENTS TO ON RA M P S A T P EQUOP SUM M IT INTERCHA NGE.
3768 Elko 62.090 - 68.978 6.888 1 $ 17,311,929
LO C A T IO N : I 80, ELKO COUNTY, FROM 0.597 M ILES EA ST OF GRA YS CREEK GRA DE SEP A RA TION TO 0.048 M ILES WEST OF THE
WILLOW CREEK GRA DE SEP A RA TION M P EL 62.09 TO M P EL 68.978
S C O P E : RUB B LIZE P CCP 1.5 INCH STRESS RELIEF COURSE 5 INCH P LA NTM IX OVERLA Y WITH A N OP EN GRA DED SURFA CE.
3769 Elko 26.580 - 32.000 5.420 1 $ 12,125,416
LO C A T IO N : I 80 FROM THE TRA ILING EDGE OF H-902 TO 0.93 M ILES WEST OF OSINO INTERCHA NGE. M P EL 26.58 TO 32.00.
S C O P E : COLDM ILL FULL DEP TH, RUB B LIZE P CCP , P LA CE 1.5" STRESS RELIEF COURSE, 5" P LA NTM IX OVERLA Y WITH OP EN GRA DE.
3770 Clark 0.000 - 1.730 1.730 2 $ 4,066,356
LO C A T IO N : SR 564, CLA RK COUNTY, LA KE M EA D P A RKWA Y IR 515 TO B OULDER HIGHWA Y M P CL 0.00 TO M P CL 1.73
S C O P E : COLDM ILL P LA NTM IX B ITUM INOUS SURFA CE WITH OP EN GRA DE A ND A DA RA M P S
3772 Clark 2.520 - 7.300 4.780 2 $ 10,258,041
LO C A T IO N : SR 593 TROP ICA NA A VE FROM M A RYLA ND P KWY TO B OULDER HWY. M P CL 2.52 TO 7.30
S C O P E : M ILL A ND OVERLA Y WITH A REA S OF CONCENTRA TION A ND A DA IM P ROVEM ENTS.
3775 Churchill 85.961- 106.880 20.919 3 $ 12,343,113
LO C A T IO N : US 50, CHURCHILL COUNTY, FROM 4.2 M ILES EA ST OF COLD SP RINGS TO CH/LA COUNTY LINE M P CH 85.961TO M P CH
106.88
S C O P E : 2 INCH COLDM ILL, 11/2 INCH STRESS RELIEF COURSE, 2 INCH P LA NTM IX B ITUM INOUS OVERLA Y WITH OP EN GRA DE
3776 Clark 0.000 - 0.460 0.46 3 $ 1,817,710
LO C A T IO N : SR 157, KYLE CA NYON ROA D, CLA RK COUNTY, FROM THE B EGINNING OF THE DEA D END TO THE TRA ILING EDGE OF B -
609. M P CL 0.00 TO M P CL 0.46
S C O P E : 1.5 INCH COLDM ILL WITH 2 INCH P LA NTM IX B ITUM INOUS SURFA CE WITH OP EN GRA DE A ND SLOP E IM P ROVEM ENT
21
21
2021 NEVADA STATE HIGHWAY PRESERVATION REPORTFISCAL YEAR 2020
Contract Road
County Mileposts Length in Miles Cost
Num ber Category
3791 P ershing IR080 P E 62.495-75.090 12.595 1 $ 17,010,870
LO C A T IO N : I 80, P ERSHIN G COUN TY, FROM 0.513 M ILES WEST OF DUN GLEN IN TERCHA N GE TO P E/HU COUN TY LIN E, M P P E 62.495 TO
M P P E 75.09
S C O P E : 1.5 IN CH COLDM ILL, 2 IN CH P LA N TM IX B ITUM IN OUS OVERLA Y WITH OP EN GRA DE
IR015 CL118.480-123.770 1
3805 Clark 5.51 $ 11,609,540
FRCL49 CL 0.000 - 0.220 3
LO C A T IO N : I 15, CLA RK CO, FROM 1.87 M I SOUTH OF THE WEST M ESQUITE IN TERCHA N GE TO THE N V/A Z STA TE LIN E, M P CL 118.48 TO
M P CL 123.77; FRCL49, FROM 0.04 M I SOUTH OF THE JUN CTION OF RA M P S 1A N D 2 TO 0.06 M I N ORTH OF RA M P S 3 A N D 4, M P CL 0.00 TO
M P CL 0.22
S C O P E : I 15, 1.5 IN CH COLDM ILL, 2 IN CH P LA N TM IX B ITUM IN OUS OVERLA Y WITH OP EN GRA DE; FRCL49, 2.75 IN CH COLDM ILL, 2 IN CH
P LA N TM IX B ITUM IN OUS OVERLA Y WITH OP EN GRA DE.
IR015 CL 26.110-28.540 1
3807 Clark IR015 CL 29.980-32.450 2.695 1 $ 10,678,188
FRCL61CL 1.380-1.600 3
LO C A T IO N : I 15 S, CLA RK CO, A T SLOA N IN TCHG, M P CL 25.22, FRCL61SLOA N RD M P CL 1.38 TO M P CL 1.60, A N D 0.59 M N OF SLOA N
IN TCHG TO 0.3 M N DUCK CREEK, M P CL 26.11TO M P CL 32.50, WITH THE EXCEP TION OF STA RR IN TCHG, M P CL 28.54 TO M P CL 29.98
S C O P E : 3" COLDM ILL W/ 3" P LA N TM IX A N D 3/4" OP EN GRA DED SURFA CE A T SLOA N IN TCHG RA M P S A N D SLOA N ROA D; 2"
COLDM ILL W/ 2" P LA N TM IX A N D 3/4" OP EN GRA DED SURFA CE ON I-15 S
3 8 12 Clark SR596 CL 43.007-45.038 2.031 2 $ 6,911,357
LO C A T IO N : SR 596 JON ES B LVD, SOUTH OF US 95, A N D N ORTH TO SM OKE RA N CH ROA D, CLA RK COUN TY. M P CL 43.007 TO M P CL
45.038.
S C O P E : P ULVERIZE 14.75 IN CHES REM OVE 6.75 IN CHES, ROA DB ED M ODIFICA TION 8 IN CHES, 6 IN CHES P B S WITH OP EN GRA DE,
CONSTRUCT A DA IM P ROVEM ENTS
3 8 17 Lander US050 LA 23.300-24.440 1.14 3 $ 7,596,298
LO C A T IO N : US 50, A USTIN , FROM 0.52 M ILES E OF SR 305 TO EA ST SIDE OF TOWN M P LA 23.30 TO M P LA 24.44
S C O P E : P ULVERIZE EXISTIN G ROA DB ED 13 ¾” DEEP , 5 ¾” ROA D-EX, 8” ROA DB ED-M OD, WITH 5” P B S A N D ¾” OP EN GRA DED
WEA RIN G COURSE. REP LA CE WA TERLIN E A N D LIN E SEWER LIN E
SR659 WA 22.873-22.980 2
3821 Washo e 6.377 $ 14,503,007
SR659 WA 0.000-6.270 2
LO C A T IO N : SR 659 S M CCA RRA N B LVD, WA SHOE COUN TY, FROM S VIRGIN IA STREET TO SR 647 W 4TH STREET M P WA 22.873 TO M P
WA 22.98 A N D M P WA 0.00 TO M P WA 6.27
S C O P E : M ILL A N D OVERLA Y 3.75" WITH A DA IM P ROVEM EN TS
US050 WP 67.609-68.450 3
3824 White P ine 1.144 $ 24,929,474
US093 WP 53.639-53.942 3
LO C A T IO N : US 50, ELY, A ULTM A N ST A N D GREA T B A SIN B LVD, US 50 M P WP 67.609 TO M P WP 68.450, US 93 M P WP 53.639 TO M P WP
53.942
S C O P E : P ULVERIZA TION , ROA DB ED M ODIFICA TION , P LA N TM IX B ITUM IN OUS SURFA CE WITH OP EN GRA DE, CURB , GUTTER,
SIDEWA LK, LIGHTIN G, A DA , DRA IN A GE, SEWER, A N D WA TER IM P ROVEM EN TS.
3829 Lyo n US050A LY11.148-14.120 7.139 3 $ 4,511,586
LO C A T IO N : US 50A , LYON COUN TY, IN FERN LEY, FROM 0.015 M ILES SOUTH OF ROYA L OA K DRIVE TO SR 427. LY 11.184 TO LY 14.120.
S C O P E : 3 A N D 3/4" COLDM ILL WITH 3" P LA N TM IX B ITUM IN OUS SURFA CE OVERLA Y WITH 3/4" OP EN GRA DED WEA RIN G COURSE
A ND CONSTRUCT M ULTI-USE P A TH.
22
22
2021 NEVADA STATE HIGHWAY PRESERVATION REPORT23
23
2021 NEVADA STATE HIGHWAY PRESERVATION REPORTThe costs for maintenance and rehabilitation repair work on highways fluctuate over time.
The periodic fluctuations are typically due to instabilities in the costs of road building
materials such as asphalt, cement, and steel, as well as the fluctuations in energy costs.
Although these fluctuations occasionally lead to price decreases, the general trend for
maintenance and rehabilitation repair work costs is in the upward direction.
NDOT recognizes that these periodic cost fluctuations complicate the project planning
process and cause uncertainty in the highway construction industry. NDOT tries to
mitigate this uncertainty by sharing the risk with contractors through fuel and asphalt
escalation clauses in project contracts. However, sharing the risk of cost fluctuations does
not eliminate the overall long-term increase in construction costs as reported by the
Associated General Contractors of America, the American Road and Transportation
Builders Association, the Federal Highway Administration, and other data sources.
The Federal Highway Administration developed the National Highway Construction Cost
Index (NHCCI) to measure average changes in the prices of highway construction costs
over time. This index is based on pricing information contained in winning highway
construction contracts. FIGURE 7 shows the NHCCI index from March 2003 through
March 2020. Although the cost trend was reasonably flat for some time, the recent trend
shows the price increasing by nearly 8% per year. When compared to a general index
such as the Producer Price Index (PPI) published by the Bureau of Labor Statistics (BLS),
the NHCCI exhibits similar patterns, but faster growth. This relationship suggests that the
costs of road construction are generally outpacing normal inflation, which further strains
the ability to provide necessary funding.
24
24
2021 NEVADA STATE HIGHWAY PRESERVATION REPORTFIGURE 7. National Highway Construction Cost Index (NHCCI)
A significant portion of NDOT funding for road construction projects comes from fuel
taxes, which have not provided revenue that keeps up with inflation. Because of this,
the purchasing power of the revenue for road construction is approximately forty percent
of what it was in 1992. Future revenue from fuel taxes will see even more pressure with
increasing fuel economy standards and the accelerating adoption of electric vehicles.
25
25
2021 NEVADA STATE HIGHWAY PRESERVATION REPORTA safe, efficient, and reliable roadway network is a matter of regional importance and
promotes the general welfare of all people that live, work, and play in the state. Nevada’s
pavement has ranked in the top one-half in the nation for the last several years as
compared with the overall highway performance and efficiency of other states’ roadway
networks as reported in the Annual Highway Report by the Reason Foundation. NDOT
uses the PSI pavement condition rating system previously discussed and graphically
shown in FIGURE 2 to evaluate and report the condition of the roadway network. TABLE
6 presents the PSI condition data for each road prioritization category on the state-
maintained roadway network. Category 1 is divided into asphalt (A) and Portland Cement
Concrete (C) surfaces for further clarity.
PSI Condition by Road Prioritization Category
PSI Percentage (% ) and Centerline Miles
Condition Rating
Road Category 1 Roadway
Scale Road Road Road Road
Network
A C Category 2 Category 3 Category 4 Category 5
Totals
67.6% 4.3% 34.0% 25.3% 4.4% 0.7% 20.0%
Very Good 5.00 to 4.00
379.6 4.3 314.8 308.2 37.6 10.5 1,055
26.0% 41.3% 38.0% 47.7% 32.2% 14.9% 31.1%
Good 3.99 to 3.50
146.1 41.0 352.2 580.0 276.8 238.4 1,635
5.1% 37.5% 16.3% 21.4% 38.4% 28.8% 24.1%
Fair 3.49 to 3.00
28.80 37.30 151.30 260.80 330.40 461.20 1,270
1.1% 14.7% 6.7% 4.4% 19.8% 29.0% 14.6%
Mediocre 2.99 to 2.50
6.2 14.6 61.6 53.3 170.5 463.8 770
0.1% 2.1% 3.1% 0.9% 4.2% 16.2% 6.4%
Poor 2.49 to 2.00
0.5 2.1 28.6 10.5 36.4 258.5 337
0.0% 0.1% 2.0% 0.4% 0.9% 10.5% 3.8%
Very Poor < 2.00
0.0 0.1 18.4 4.4 7.9 168.2 199
Total Miles 661 927 1,217 860 1,601 5,265
* 1) Data as reported in the 2019 PMS Data Warehouse.
2) The reported total of 5,265 miles includes only those roadways that were surveyed in 2019.
The total state-maintained roadway network mileage of 5,365 miles mentioned in the Roadway Network
Inventory section of the report is the official mileage count that includes all roads.
FIGURE 8 is a map of the state’s roadway network inventory identified by the PSI rating
system. FIGURES 9 through 13 are maps of road prioritization categories 1 through 5
identified by the PSI rating system.
26
26
2021 NEVADA STATE HIGHWAY PRESERVATION REPORTYou can also read