Mintel Sustainability Barometer 2021 - CONSULTING - Cdurable.info
←
→
Page content transcription
If your browser does not render page correctly, please read the page content below
CONSULTING

Mintel
Sustainability
Barometer
2021

Mintel Consulting provides custom deliverables
to meet our clients’ sustainability briefs.

LANDSCAPING                            FORESIGHT                                  CREATIVITY                              SOCIALISATION                          VALIDATION

Objective: Know your                   Objective: Future-proof                    Objective: a list of what               Objective: Achieve a                   Objective: Maximise
customers and competition              your business                              you offer/provide and                   sustainable culture                    impact and investment
                                                                                  clients receive
What we will do:                       What we will do:                                                                   What we will do:                       What we will do:
Run consumer research segmentation     Leverage our framework of macro            What we will do:                        Deliver inspirational C-suite,         Test your product and service
studies to reveal purchasing drivers   drivers, consumer trends, 100 weekly       Facilitate co-creation workshop         conference key note kick-off           ideas with qualitative concept
and use our GNPD database to track     innovation observations, consumer data     sessions structured around a            presentations and panel discussions    groups. Build, conduct and analyse
product launches and claims. Conduct   trackers and patent analyses to quantify   framework designed to cover all         in person —or virtually— with our      bespoke consumer research surveys
social media listening surveys to      the world of 2030 and beyond.              consumer needs. Render design           expert speakers and analysts.          to spec. Use survey benchmarking
measure consumer conversations.                                                   prototypes. Concept debrief                                                    against your consumer panels to
                                       What you will get:                         presentations evaluating potential in   What you will get:                     track product launches
What you will get:                     A trends framework quanitified with        the context of the current consumer     Sustainable thinking activated,        and performance.
Reports, presentations and databooks   data-driven projections to help you        and product market.                     communicated and cascaded
revealing white spaces in product      navigate the risks and opportunities                                               internally to ensure it runs through   What you will get:
markets, new consumer groups to        ahead and ensure that you remain           What you will get:                      every part of your business.           Initiatives and launches
target and the best strategies for     relevant. Inspirational, early signal      Propositions quanitified by data,                                              pre-validated by consumer analysis
reaching them.                         showcases of the products and services     forged to meet consumer needs and                                              and evaluated by ongoing market
                                       that will mainstream in future.            evaluated against the competition.                                             product tracking thereafter.

  Find out more: mintel.com/mintel-consulting
3
                                          CONSULTING

    ‘We’re trying to sell peace, like a
    product, you know, and sell it like
    people sell soap or soft drinks.’
    - John Lennon, 14th June 1969
Welcome to the Mintel                                                              Content
Sustainability Barometer 2021
Simply ‘doing good’ wasn’t enough to     actionable consumer insights and
get people to buy sustainable goods      expert recommendations that—when
and services fifty years ago, and        combined with other credible market,          PART ONE
that’s still the case today.             environmental and policy data—help
                                         companies and brands make better,             Consumer beliefs
The truth is that while consumer         sustainability-driven decisions about         and behaviours
choices are integral to reducing         the future of their business and its
inequalities and emissions (being        impact on society.
linked to 55% of the cumulative
reductions needed by 2050                You’ve taken the first step by reading
according to the IEA, for instance),     this introduction, but the real lessons
they’re driven by much more than         begin in the pages that follow:
altruism alone. We need data to          namely, how to better appeal to
help us figure out how else to get our   consumers and sell sustainability
policies and products to resonate with   to align with their understanding,
people if they are to accelerate us      expectations and sense of self.               PART TWO
towards a better and more
                                                                                       Challenges
equitable world.                         Mintel is here to help you—your
                                         policies, products and services—be            for companies
As the experts in what consumers         credibly and profitably sustainable
want and why, Mintel has launched        as quickly as possible. We hope this
a new Sustainability Barometer to        report gives you some new ideas.
track consumer behaviours, purchase      If you’d like to build on those and/or
preferences and attitudes regarding      create new ones, please get in touch
sustainability and to offer lessons      with your Account Manager
to be learned from best-in-class         or contact Mintel Consulting.
innovations, communications and
campaigns. It provides valuable and      Best wishes,
                                                                                       PART THREE
                                                                                       Approaches
                                                            Richard Cope               for success
                                                            Senior Trends
                                                            Consultant
PART ONE PART TWO PART THREE
Consumer beliefs and behaviours Challenges for companies Approaches for success
Consumers seek protection from climate change Consumers’ environmental concerns nderstand consumers’ characterisation
U
and touchpoints
Figure 1:1 Ownership of and interest in air conditioning ................................................ 8 Figure 2:1 Consumers’ top enviromental concerns ............................................................ 30
Figure 1:2 Current and potential share of homes with air conditioning .............. 9 Figure 2:2 Share of annual GHG emissions by sector ...................................................... 31 Figure 3:1 How all vs sustainable consumers describe themselves ...................... 50
Figure 1:3 Ownership of and interest in air purifiers ......................................................... 10 Figure 2:3 Movement of carbon between land, Figure 3:2 The differences in how sustainable consumers
atmosphere and oceans ............................................................................................. 32 describe themselves ......................................................................................................... 51
Figure 1:4 Current and potential share of homes with air purifiers ........................ 11
Figure 3:3 What European sustainable consumers are driven by .......................... 52
How consumers’ concerns match up with emissions
There’s still time to make a difference
Educate on impact
Figure 2:4 Consumers selecting air quality (e.g. exhaust fumes, industrial
Figure 1:5 Consumers’ sense of optimism and impact ..................................................... 13 emissions) as a top three environmental concern .................................... 34 Figure 3:4 Consumers’ sense of climate change by country
Figure 2:5 Consumers selecting deforestation, loss of biodiversity or and total GHGs ...................................................................................................................... 55
Sustainable purchasing now and in future chemicals entering the environment (e.g. pesticides) as a
top three environmental concern ......................................................................... 36
Sell in the science
Figure 1:6 Most important factors for consumers when choosing Figure 2:6 Consumers selecting plastic pollution (e.g. ocean plastic)
to buy one product over another ........................................................................... 15 as a top-three environmental concern’ ............................................................ 37 Figure 3:5 Consumers agreeing that ‘science can provide
Figure 1:7 Most important factors when choosing one at-home Figure 2:7 Consumers’ attitudes to climate change ......................................................... 38 solutions to the climate crisis’ ................................................................................... 57
coffee product to buy over another .................................................................... 16
Figure 1:8 EV ownership and potential ....................................................................................... 17
Solutions consumers think will save the planet Use clear metrics and language
Figure 1:9 EVs’ share of all cars owned and car
Figure 2:8 Environmental solutions perceived by consumers Figure 3:6 Factors that would encourage consumers to buy products
penetration level, 2021 Europe ................................................................................ 18
as having ‘high to moderate impact’ .................................................................. 41 or services that claim to benefit/protect the environment ............... 59
Figure 1:10 EVs’ share of new purchases considered
Figure 2:9 Consumers selecting deforestation as a top three Figure 3:7 What encourages consumers to buy products or services
in the next 1–3 years in Europe ................................................................................. 18
environmental concern ................................................................................................. 42 that claim to benefit/protect the environment ......................................... 60
Figure 1:11 Home solar panel ownership and potential .................................................. 19
Figure 2:10 Consumers perceiving planting new forests as having ‘high to
Figure 1:12 Current and potential share of homes with solar panels .................... 20 moderate impact’ and percentage of land covered by forests,
Europe, by country, 2021 .............................................................................................. 43
Sustainable behaviours and their drivers
Figure 1:13 Sustainable behaviours in the past 12 months .............................................. 22
Figure 1:14 Transport behaviours in the past 12 months ................................................... 23
Consumers hold companies responsible
Figure 1:15 Who consumers think is most responsible for
sustainability issues ........................................................................................................... 25
Figure 1:16 Types of companies ranked ‘most responsible’
for protecting the environment ............................................................................... 26
Consumer beliefs
and behaviours
01
   Consumers seek protection   04
                                  Sustainable behaviours
    from climate change            and their drivers

02
   There’s still time to       05
                                  Consumers hold
    make a difference              companies responsible

03
   Sustainable purchasing      06
                                  Key takeaways
    now and in future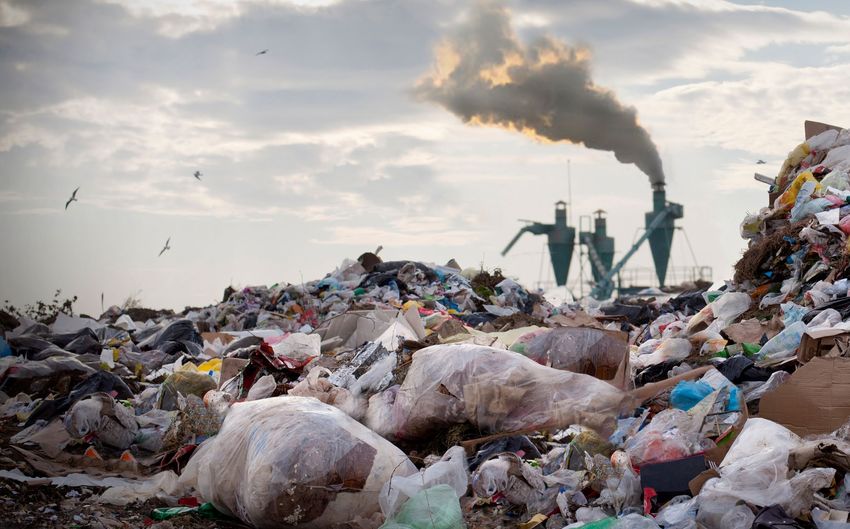
01   Consumers seek protection
     from climate change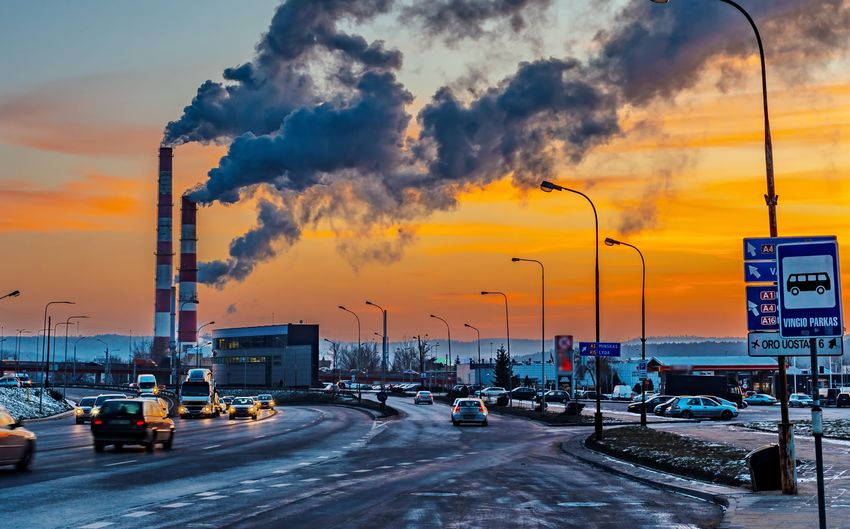
8

CONSUMER BELIEFS AND BEHAVIOURS | Consumers seek protection from climate change                                                                                                                                           CONSULTING

Beyond any concerns voiced,                   FIGURE 1:1
a clear indication of just how
seriously consumers are taking
climate change and pollution                                                                         Ownership of and interest in air conditioning
is the proportion of them
expressing an interest in buying air
conditioning units and air purifiers
in the future.                                             5%
                                                                    11%                      11%
In this context, global warming                                                  9%
creates a vicious circle by                                                                                         26%
                                                                                                        20%                              29%
increasing demand for air                                                                                                     19%
conditioning, which then uses
more energy. Aspiring to have                                                                                                                       23%
                                                                                                                                                                20%
air conditioning is a practical
reaction to—and recognition                                                                                                                                                 53%
of—climate change, as well as                              93%
an indication of how protection,                                    82%         81%          81%
comfort and a desire for higher                                                                                                                                                                           44%
                                                                                                        66%         66%       63%                                                      23%
                                                                                                                                         62%                                                    29%
living standards are major drivers
                                                                                                                                                    52%         51%                                                          30%
that cannot be disregarded in                                                                                                                                                                                       21%
positioning sustainable products.
                                                                                                                                                                            26%        23%
                                                                                                                                                                                                18%
                                                                                                                                                                                                          13%       12%      11%
                                                           China   S Korea       USA         Japan     Australia   Thailand   Canada     India       Italy      Spain      Brazil      France   Ireland   Poland   Germany    UK

                                                                                                            Currently have             Do not have but interested in purchasing in the future

                                               Base: 500 internet users aged 16/18+;
                                               Source: Dynata/Lightspeed/Mintel March 2021
9

CONSUMER BELIEFS AND BEHAVIOURS | Consumers seek protection from climate change                                                                                                                                                        CONSULTING

  FIGURE 1:2

                                                                     Current and potential share of homes with air conditioning

                                                                         30%                                                 100%
                                                                                                                                                  Air con penetration 2021 %

                                         Canada

                                         82%             63%                         Ireland
                                                                                                             U.K.
                                                                                     47%       18%                                                Poland
                                                                                                             42%          11%                                                        China                                    Japan
                                                                                                                                Germany           58%            13%
                                                                                                                                                                                     98%     93%                              92%     81%
                                                                                                                                33%       12%
                                                                                                                                                                                                              S Korea
                                                  U.S.                                                                                                            India

                                                  91%          81%
                                                                                                                    France                                                                                    93%        82%
                                                                                                                                                                  91%          62%
                                                                                                                    46%         23%
                                                                                                                                          Italy                                              Thailand
                                           91%                                                                                            71%              51%                               93%        66%

                                                                                                     Spain

                                                                                                     71%            51%

                                                                            Brazil                                                                                                                        Australia

                                                                            79%         26%                                                                                                               86%           66%

     Base: 500 internet users aged 16/18+;
     Source: Dynata/Lightspeed/Mintel March 2021
10

CONSUMER BELIEFS AND BEHAVIOURS | Consumers seek protection from climate change                                                                                                                          CONSULTING

  FIGURE 1:3
                                                                                                                                                                                  Demand for air purifiers
                                                                                                                                                                                  illustrates how seriously people
                                                                                                                                                                                  are taking pollution as a threat
                                                           Ownership of and interest in air purifiers                                                                             to health. Again, it underlines
                                                                                                                                                                                  the general importance of
                                                                                                                                                                                  self-preservation and health as
                                                                                                                                                                                  key drivers for the future uptake
                                                                                                                                                                                  of environmentally beneficial
           22%                                                                                                                                                                    products, not just those
                                                                                                                                                                                  designed to counter threats.
                       26%
                                   38%

                                                          46%
                                                 26%

                                                                     29%
                                                                              36%
           70%                                                                                                                                        32%
                                                                                         35%        52%
                                                                                                               42%         47%        47%
                       62%

                                   48%                                                                                                          69%
                                                 46%                                                                                                           30%
                                                          40%                                                                                                            28%
                                                                     39%      31%
                                                                                         26%        21%        21%
                                                                                                                           18%        16%       16%   13%      10%       8%
           China      S Korea        India       Japan   Thailand    USA      Canada   Australia    Poland     Ireland     Spain       Italy    UK    Brazil   Germany   France

                                                             Currently have            Do not have but interested in purchasing in the future

   Base: 500 internet users aged 16/18+;
   Source: Dynata/Lightspeed/Mintel March 2021
11
CONSUMER BELIEFS AND BEHAVIOURS | Consumers seek protection from climate change CONSULTING
FIGURE 1:4
Current and potential share of homes with air purifiers
30% 100%
Air purifier penetration 2021 %
Canada
67% 31% Ireland
U.K.
62% 21% Poland
48% 16% China Japan
Germany 73% 21%
92% 70% 72% 46%
40% 10%
S Korea
U.S. India
68% 39%
France 88% 62%
86% 48%
34% 8%
Italy Thailand
91% 63% 16% 86% 40%
Spain
65% 18%
Brazil Australia
82% 13% 61% 26%
Base: 500 internet users aged 16/18+;
Source: Dynata/Lightspeed/Mintel March 202102 There’s still time to
make a difference13
CONSUMER BELIEFS AND BEHAVIOURS | There’s still time to make a difference CONSULTING
In most countries, a small majority still believe that we We’re talking to the wrong people
have time for redemption, and that optimism is closely
related to a sense that consumer behaviours can make Marketers are fixated and focused on Millennials as the core That hasn’t yet translated into strong ownership of big-ticket,
the difference. For brands, the opportunity here is to sustainability target market, but almost without exception the high-impact products like solar panels for the home or electric
become the chosen partners of those consumers looking 55+ segments agree most strongly that their behaviour ‘can vehicles (both of which are accented towards 25–34s), but
to make a difference. The challenge thereafter is for make a positive difference to the environment’. Over 55s’ potential interest in both—while slightly below average—
brands to maintain those relationships by proving what scores are at least six percentage points higher than presents an opportunity, especially when we consider the
difference they’ve made and reporting back on average across all markets. superior spending power of over 55s generally across our
that impact. featured countries.
FIGURE 1:5
Consumers’ sense of optimism and impact
65%
64% 63% 63% 63% 64% 62% 62%
59% 59%
56% 56% 55% 54% 56% 55% 55%
54% 53%
51% 51% 52% 51% 50% 35%
47% 47% 49% 15%
42% 44%
37%
Brazil Spain Canada Italy China Thailand Poland UK France Ireland S Korea India USA Germany Australia Japan
If we act now we still have time to save the planet My behaviour can make a positive difference to the environment
Base: 500 internet users aged 16/18+;
Source: Dynata/Lightspeed/Mintel March 202103 Sustainable purchasing
now and in future15
CONSUMER BELIEFS AND BEHAVIOURS | Sustainable purchasing now and in future CONSULTING
Now: FMCG staples FIGURE 1:6
When purchasing fast-moving
consumer goods (FMCG) Most important factors for consumers when
staples, consumers do consider choosing to buy one product over another
sustainability factors. When
asked to choose their top five
considerations when making
FMCG purchases, consumers
typically select two or more
related to sustainability when
purchasing coffee, soap or socks.
These priorities often lean towards Coffee Soap Socks
packaging considerations, as do
consumers’ concerns (Figure 2:1),
when in reality resource impact
might be greater.
31% 30% 43% 35% 33% 31%
It comes in minimal or It was produced in It does not contain It comes in minimal They don’t contain They come
recyclable packaging an environmentally ingredients/chemicals or recyclable materials that are harmful in minimal
friendly way that are harmful to packaging to the environment (e.g. or recyclable
the environment (e.g. synthetic microfibres packaging
microplastics or glitter) or dyes that might be
released during washing)
Base: 500 internet users aged 16/18+;
Source: Dynata/Lightspeed/Mintel March 202116
CONSUMER BELIEFS AND BEHAVIOURS | Sustainable purchasing now and in future CONSULTING
Now: Red lines FIGURE 1:7
consumers won’t cross
This data is equally useful in showing
Most important factors when choosing one at-home
that consumers won’t compromise coffee product to buy over another
on quality or brand familiarity in the
name of sustainability. A product’s
positioning should never discount the It is made from high quality ingredients
‘pleasure principle’. Looking at the
example of coffee, we should never 36%
forget that a sustainable coffee is
first and foremost a coffee. It must
deliver pleasure, taste and quality It is from a brand that I have bought before
before anything else. Likewise,
sustainability is important when
35%
it comes to packaging, but the
practical, fundamental elements
are just as crucial. The cardinal
It comes in minimal packaging or packaging that can be recycled
rule of packaging should be that it
protects the product and secures
its shelf life so that the energy and 31%
other resources that went into its
production aren’t wasted.
It was produced in an environmentally friendly way (e.g. without causing deforestation)
30%
The packaging makes it easy to keep the product fresh (e.g. is air tight/resealable)
30%
Note: Coffee is defined as ground beans, pods or instant granules.
Base: 500 internet users aged 16/18+
Source: Dynata/Lightspeed/Mintel, March 202117
CONSUMER BELIEFS AND BEHAVIOURS | Sustainable purchasing now and in future CONSULTING
Future: FIGURE 1:8
Electric vehicles
EV ownership and potential
Ownership of hybrid and fully electric
vehicles (EVs) remains weak outside
northern Asia, but the proportions
of people who are ‘realistically
interested in buying in the near future
(i.e. in the next 1–3 years)’ are huge.
Entry-level costs and the rate of
technological change are current
obstacles, but the potential market
share of EVs in Europe is significant
(Figures 1:8 to 1:10). 70%
52%
47% 53% 61%
52% 53%
24% 44%
38% 41%
30% 39% 35%
27% 27%
23%
19% 15% 15% 12% 11% 10% 9% 8% 3% 2%
7% 7% 6% 6% 6%
China Japan India Ireland S Korea Australia USA Thailand Canada Brazil Spain UK France Italy Germany Poland
Owns EV now Do not own but interested in purchasing in the future
Base: 500 internet users aged 16/18+;
Source: Dynata/Lightspeed/Mintel March 202118
CONSUMER BELIEFS AND BEHAVIOURS | Sustainable purchasing now and in future CONSULTING
FIGURE 1:9 FIGURE 1:10
EVs’ share of all cars owned and car EVs’ share of new purchases considered in
penetration level, 2021 Europe the next 1–3 years in Europe
30% 100%
Car penetration 2021 %
U.K.
Ireland
Ireland 66%
U.K. 69% Poland
19% 78% Poland
9% 69% Germany
50%
Germany 3% 65%
57%
4% 67%
France
France
61%
8% 78%
Italy
Italy
80%
7% 89%
Spain
Spain 73% 18%
8% 84%
Base: 500 internet users aged 16/18+; Base: 500 internet users aged 16/18+;
Source: Dynata/Lightspeed/Mintel March 2021 Source: Dynata/Lightspeed/Mintel March 202119
CONSUMER BELIEFS AND BEHAVIOURS | Sustainable purchasing now and in future CONSULTING
Future: Home solar panels FIGURE 1:11
Ownership or usage of solar panels in Home solar panel ownership and potential
consumers’ main homes is also low, but
again the potential is strong. In all but a
couple of Northern European countries, India 43% 50% 7%
the proportion of people expressing an
interest in purchasing solar panels in the Australia 38% 35% 27%
future exceeds those with no interest in
doing so. China 24% 56% 20%
What factors can help solar Thailand 24% 61% 15%
power grow?
Ireland 18% 58% 24%
The aspiration to own or use solar panels
is driven in part by climate change USA 16% 46% 38%
feeling tangible and local. Those who
believe that the country they live in is Italy 15% 58% 27%
suffering from climate change are more
likely (by five percentage points on Japan 12% 31% 57%
average) to be interested in purchasing
solar panels in the future. S Korea 12% 56% 32%
In terms of touchpoints, interest in owning Germany 12% 38% 50%
solar panels also increases (by four
percentage points) among those who UK 11% 48% 41%
‘like to be among the first to try new
technologies’ and to a lesser degree Poland 11% 54% 35%
(by two percentage points) among those
who ‘have a budget that I try to stick to France 9% 32% 59%
as much as possible’.
Spain 7% 67% 27%
As with EVs, brands need to appeal more
to these sentiments if aspiration is to be Canada 6% 53% 41%
converted into ownership.
Brazil 5% 80% 15%
Base: 500 internet users aged 16/18+; Currently own Do not have but interested in purchasing in the future Do not have and not interested in purchasing in the future
Source: Dynata/Lightspeed/Mintel March 202120
CONSUMER BELIEFS AND BEHAVIOURS | Sustainable purchasing now and in future CONSULTING
FIGURE 1:12
Current and potential share of homes with solar panels
40% 100%
Solar penetration 2021 %
Canada
59% 6% Ireland
U.K.
76% 18% Poland
China Japan
59% 11%
Germany 65% 11%
80% 24% 43% 12%
50% 12%
S Korea
U.S. India
62% 16%
France 68% 12%
93% 43%
41% 9%
Italy Thailand
91% 73% 15% 85% 24%
Spain
74% 7%
Brazil Australia
85% 5% 73% 38%
Base: 500 internet users aged 16/18+;
Source: Dynata/Lightspeed/Mintel March 202104 Sustainable behaviours
and their drivers22
CONSUMER BELIEFS AND BEHAVIOURS | Sustainable behaviours and their drivers CONSULTING
Simplicity and frugality FIGURE 1:13
The most popular behaviours are Frugality also informs attitudes to
those that are simple and frugal, food waste, with meal planning Sustainable behaviours in the past 12 months
in other words, where consumers increasing significantly amongst
can have a positive impact those consumers who also state ‘I
by following straightforward have a budget that I try to stick
Recycled packaging
processes or by cutting back on to as much as possible’. Growing
spending. Where they do spend food, however, is a behaviour
their money or time, there is a based on experience as much 60%
clear bias towards initiatives with as economics. What’s more,
a strong human—and not just Mintel’s characterisation studies
environmental—component (see Figure 3:1) confirm that
Returned packaging (e.g. retailer bags) to a store to be recycled
or benefit. sustainable consumer groups are
more likely than average to agree
Recycling (at kerbside) is the that they’re ‘actively seeking 55%
most commonplace sustainable ways to reduce stress’ and that
behaviour, closely followed ‘experiences are more important
by returning packaging to to me than material possessions’.
stores. There is a stark cultural Bought fewer new clothes
contrast between Asia-Pacific Abstinence costs nothing, and
and European markets in rates reducing consumption is one 52%
of ‘returning’ versus ‘recycling’ way for people to reduce their
packaging, but the relationship emissions and conserve resources.
with the retailer is key. Accepting The success of fashion resellers
returned packaging is the clearest like Depop (18 million users and Planned meals at home to avoid wasting food
and most popular example counting) is built on their appeal
of companies partnering with to a combination of consumers’ 52%
consumers on an issue they feel sense of individuality, authenticity
concerned about and fulfilling and sustainability, and Mintel’s
consumers’ desire to make characterisation studies (see
a difference with their Figure 3:1) confirm that a key tenet
behaviour (Figure 1:5). of sustainable consumer groups is Base: 500 internet users aged 16/18+;
that they ‘like to stand out from Source: Dynata/Lightspeed/Mintel March 2021
the crowd’.23
CONSUMER BELIEFS AND BEHAVIOURS | Sustainable behaviours and their drivers CONSULTING
Health FIGURE 1:14
Despite reports that people are turning once
again to cars and taxis, the biggest shift in Transport behaviours in the past 12 months
transport behaviours has been towards
micro-mobility and zero-emission modes of
transport. Consumers who agree that ‘it’s
important for me to lead an active lifestyle’ 42%
are more likely to have adopted more
environmentally friendly transport behaviours
in the past 12 months, thus reinforcing the
observation that many sustainable behaviours
26%
are driven by self-preservation and the urge to 24%
protect oneself. This ethos of ‘good for me, good 20% 19%
for the planet’ suggests that sustainable products
and services should appeal to people’s desire to
feel—and look—in good health. 8%
Walked more often Cycled more often Travelled by public Used my/my household’s Started cycling Used taxis more often
instead of taking transport transport more often car more often
Base: 500 internet users aged 16/18+;
Source: Dynata/Lightspeed/Mintel March 202105 Consumers hold
companies responsible25
CONSUMER BELIEFS AND BEHAVIOURS | Consumers hold companies responsible CONSULTING
Issues FIGURE 1:15
Consumers hold companies most Who consumers think is most responsible for sustainability issues
responsible—i.e. more responsible
than governments or themselves—for
a host of environmental and social Reducing the of use of fossil
targets and standards. A big majority fuels for energy (e.g. coal,
gas)
of consumers hold companies most
responsible for increasing recycling A Reducing emissions from
slight majority hold them responsible 60% vehicles (e.g. exhaust fumes)
for ensuring fair conditions and pay
50%
for workers and for reducing emissions Increasing use of
from road and air transport. Even on 40% renewable energy
issues where a minority of consumers 30%
hold companies most responsible, Reducing emissions
20% from aircraft/flying
they still amount to almost a fifth
of respondents. 10%
Increasing forestation
(e.g. planting more trees)
0%
Stopping pollution entering
rivers and seas
Conserving clean
water supplies
Increasing the amount of
packaging that is recycled
Reducing investments in
companies/industries that
rely on fossil fuels
Ensuring fair conditions
and fair pay for workers
Companies Consumers Government
Promoting equality (i.e. in
relation to gender, race and/
or sexual orientation)
Base: 500 internet users aged 16/18+; Note: social questions not asked in China
Source: Dynata/Lightspeed/Mintel March 202126
CONSUMER BELIEFS AND BEHAVIOURS | Consumers hold companies responsible CONSULTING
FIGURE 1:16 Sectors
Companies—especially those in
Types of companies ranked ‘most certain sectors such as transport
and household—are being held
responsible’ for protecting the environment accountable for their action.
Failure to react to this reality will
ultimately hit their bottom lines.
Passenger transport companies (e.g. airlines, taxi, rail companies) 44%
Household product manufacturers (e.g. cleaning products, toilet paper) 39%
Packaged meat, poultry and/or fish manufacturers 35%
Packaged drink manufacturers 28%
Other packed food/drink manufacturers 25%
Retailers (e.g. supermarkets, online retailers) 23%
Skincare and haircare product manufacturers 18%
Make-up product manufacturers 17%
Dining venues (e.g. restaurants, coffee shops) 15%
Note: Figures for ‘any rank’ for question Please rank 1-3, where 1 has the most
responsibility; Base: 500 internet users aged 16/18+;
Source: Dynata/Lightspeed/Mintel March 202127
CONSULTING
Key Takeaways
01 02 03 04
The huge proportions of Consumers still feel they can Are we talking to the wrong Consumers buy staple
consumers aspiring to buy ‘be the change’—but only people? Marketers are products sustainably, but they
air conditioners and air just. The opportunity here is fixated and focused on have ‘red lines’ and won’t
purifiers confirms their for brands to become the Millennials, but consumers’ compromise on quality or
belief in climate change chosen partners for those sense of personal impact brand familiarity in the name
and pollution, but it also consumers looking to make increases with age. of sustainability.
demonstrates the importance a difference.
of ‘non-sustainable’
considerations, like
well-being, as key
purchasing drivers.
05 06 07 08
Consumers are gearing up The most popular sustainable Consumers hold companies Some companies are
to invest in bigger-ticket behaviours are simple, frugal most responsible for deemed more accountable
sustainable home and or healthy. increasing recycling and than others, especially
transport purchases. at least as responsible as passenger transport
governments for ensuring companies, household
fair conditions and pay for product manufacturers and
workers and for reducing packaged meat, poultry or
emissions from air transport fish manufacturers.
and vehicles.28
CONSULTING
Challenges
for companies
01   Consumers’
     environmental concerns
02
How consumers’ concerns
match up with emissions
03
Solutions consumers think
will save the planet
04
Key Takeaways01 Consumers’
environmental concerns30
CHALLENGES FOR COMPANIES | Consumers’ environmental concerns CONSULTING
When consumers are asked to FIGURE 2:1
select up to three environmental
concerns, it’s unsurprising that
Consumers’ top enviromental concerns
the concerns that are the most
tangible (climate change),
threatening to one’s health (air
quality) and visible (plastic Climate change/global warming 53%
pollution) are out in front by
some distance. Consumers
Air quality (eg exhaust fumes, industrial emissions)
aren’t environmental scientists, 52%
and, with their current levels of
understanding, these factors will
Plastic pollution (eg ocean plastic) 52%
always precede considerations
around GHG emissions when it
comes to ranking their concerns. Deforestation 40%
Waste pollution (eg landfills) 40%
Water shortages 40%
Chemicals entering the environment (eg pesticides) 38%
Loss of biodiversity on land (eg species extinction, loss of wildlife habitat) 30%
Loss of biodiversity in the oceans (eg species extinction, loss of wildlife habitat) 30%
Food shortages due to drought or crop failure 28%
Note: Consumers were asked to choose up to three concerns. Results show ‘any ranking’.
Base: 500 internet users aged 16/18+
Source: Dynata/Lightspeed/Mintel, March 202131
CHALLENGES FOR COMPANIES | Consumers’ environmental concerns CONSULTING
Considering FIGURE 2:2
carbon emissions
The negative impact of
Share of annual GHG emissions by sector
consumer-facing products and
services can be gauged in terms
of their contribution to the share of
GHG emissions by sector shown
in Figure 2:2.
73.2% 18.4% 5.2% 3.2%
Agriculture, forestry
Energy Industry Waste
In this regard, waste (including & land Use
ocean plastic) and deforestation
have a relatively low emissions
footprints compared with that of
agriculture as a whole or indeed Energy use Energy use Agricultural
24.2% 16.2% Transport 17.5% 4.1% 3% Cement 1.9% Landfill
energy use in consumer-facing in industry in buildings soils
areas such as transport. Road Residential Livestock
10.6% Other industry 11.9% 10.9% 5.8% 2.2% Chemicals 1.3% Waste water
transport buildings & manure
7.2% Iron and steel 1.9% Aviation 6.6% Commercial 3.5% Crop burning
Non-ferrous
0.7% metals
1.7% Shipping 2.2% Deforestation
Chemical & Unallocated fuel
3.6% 0.4% Rail 7.8% combustion
1.4% Cropland
petrochemical
Food & Rice
1% 0.3% Pipeline Fugitive 1.3%
Tobacco 5.8% emissions cultivation
from energy
0.6% Paper & pulp production 0.1% Grassland
Energy in
0.5% Machinery 1.7% agriculture
& fishing
Note: Annual total estimated at 51 billion gigatonnes (Gts).
Sources: Adapedted from Climate Watch; World Resources Institute32
CHALLENGES FOR COMPANIES | Consumers’ environmental concerns CONSULTING
Considering carbon storage FIGURE 2:3
Emissions related to By comparison, the ocean is a
consumer-facing products and giant: it holds 37,000 billion tonnes Movement of carbon between land, atmosphere and oceans (Gts)
services (covered in Figure 2:2), of carbon, but only 1,000 billion
and environmental solutions, can tonnes of that is close to the surface,
also be evaluated by how they where it’s used by phytoplankton Atmosphere
(800)
Atmospheric
affect the amount of carbon stored for photosynthesis, transferred to Carbon Net Annual
in the sea, soil, plants and animals. fish and other animals up the food Increase
chain, then back down to the deep 4
The Earth holds 65,500 billion metric ocean when they die. Carbon is also 60
tonnes of carbon, most of which stored (very efficiently) in mangrove 120+3
Photosynthesis
is stored in rocks. The remainder forests, seaweeds, seagrasses Plant
9
flows between the ‘reservoirs’ of and corals. respiration
Fossil fuels,
the ocean, atmosphere, plants and cement, and
soil. The human-generated activities The implications in the ocean are Plant land-use change
covered in Figure 2:2 remove the same as those on land: changes biomass
carbon from the reservoirs of fossil to habitat and biodiversity— (550)
Net terrestrial 90+2
fuels, soil and biomass, adding it through activities like overfishing uptake 90
to the atmosphere and raising and fertiliser run-off (where the 3
the temperature. excess can cause bacteria and
So
algae growth and toxify water il c 60 Surface ocean
arb
on (1,000)
Earth’s plant biomass holds 500 ecosystems)—transfer this stored Mi Air-sea gas
c
billion tonnes of carbon and the soil carbon into the atmosphere and res robi exchange
p a
de irat l
2,300 billion tonnes. These figures raise the temperature. co ion d
mp an
demonstrate how agricultural osi and i on ion
tio t
n ira osit
cultivation and deforestation sp
Re mp Deep ocean
e co
practices can potentially release So d (37,00)
il ( n
carbon into the atmosphere. 2,3 n kto is
00 pla es
)
h yto synth
P 2
oto ke 0)
GtC/y: Gigatonnes of ph p ta ,00
Fo u ( 6
ssi an en
ts
carbon/year lp o ce i m
oo t ed
Numbers in parentheses l (1 Ne es
0,0 t i v
refer to stored carbon 00 ac
) Re
pools. Red indicates carbon
from human emissions.
Note: Annual total estimated at 51 billion gigatonnes (Gts).
Sources: Adapted from Climate Watch; World Resources Institute33
CONSULTING
02 How consumers’ concerns
match up with emissions34
CHALLENGES FOR COMPANIES | How consumers’ concerns match up with emissions CONSULTING
After climate change, FIGURE 2:4
air quality is the second
most likely issue to be a
top-three concern for Consumers selecting air quality (e.g. exhaust fumes, industrial
consumers. There is a emissions) as a top three environmental concern
good reason for that since
emissions from energy
usage alone in industry and
road transport generated 70%
36.1% of global GHG
64% 64%
emissions in 2016. 62% 61%
53% 53% 53% 52% 52%
48%
45%
40% 39%
37%
33%
23%
36.1% of 15% 16%
19%
15% 16% 15%
global GHG 12% 11% 11% 11% 11% 11%
9% 8% 7%
emissions
come from China Poland S Korea Thailand Italy Brazil India Canada USA Spain France Ireland Australia UK Japan Germany
industry and
road transport
Any rank 1
energy
emissions.
Note: Consumers were asked to choose up to three concerns. The figure shows air quality
selected first and ‘any ranking’. Base: 500 internet users aged 16/18+
Source: Dynata/Lightspeed/Mintel, March 2021; Climate Watch; World Resources Institute.35 CHALLENGES FOR COMPANIES | How consumers’ concerns match up with emissions CONSULTING 18.4% of global GHG emissions come from agriculture, forestry and land use. Agriculture, forestry and land use all release carbon stored in soil and biomass, and together they generate 18.4% of annual GHG emissions. If we combine consumers’ concerns related to this sector, then 72% select at least one of these factors (deforestation, loss of biodiversity or chemicals entering the environment) as a top-three concern. High proportions of consumers select two of these concerns in their top three, underlining how seriously consumers take these issues, particularly in relation to food and drink.
36

CHALLENGES FOR COMPANIES | How consumers’ concerns match up with emissions                                                                                                                                                                                                             CONSULTING

  FIGURE 2:5

                                                           Consumers selecting deforestation, loss of biodiversity or chemicals entering
                                                             the environment (e.g. pesticides) as a top three environmental concern

       84%               84%
                                          81%                81%
                                                                              78%                77%                 76%              76%
                                                                                                                                                        73%                73%              72%
                                                                                                                                                                                                             67%              66%

                                                                                                                                                                                                                                                59%
                                                                                                                                                                                                                                                                 55%
                                                                                                                                                                                                                                                                                51%
            49%
                                                45%

                                                                   39%
                                                                                                        35%                                 36%                                                   35%
                               34%                                                  34%                                    33%                                33%
                                                                                                                                                                                 28%                               28%
                                                                                                                                                                                                                                    26%

                                                                                                                                                                                                                                                                   21%
                                                                                                                                                                                                                                                      17%
                                                                                                                                                                                                                                                                                      14%
                  9%                                  9%
                                                                         6%                                                                       7%
                                                                                          5%                                     5%                                  4%                                 3%
                                     3%                                                                         3%                                                                     3%                                3%                3%               2%             2%               1%

          Germany           Italy            France            Spain              India              Thailand         Brazil             UK                Ireland            Poland          Canada           USA             Australia          China            Japan          S Korea

                                                                                                                       Any one concern            Two concerns            Three concerns

   Note: Consumers were asked to choose up to three concerns. The figure shows ‘any ranking’
   for deforestation, loss of biodiversity or chemicals entering the environment (e.g. pesticides)
   Base: 500 internet users aged 16/18+
   Source: Dynata/Lightspeed/Mintel, March 2021; Climate Watch; World Resources Institute.
37
CHALLENGES FOR COMPANIES | How consumers’ concerns match up with emissions CONSULTING
The most generous estimate for emissions in reality, these are overlapping concerns.
from plastic (even accounting for its Sea Shepherd’s revelation that 46% of
production using fossil fuels, its incineration plastic in the Great Pacific Garbage Patch 3.6% of global GHG 90% of excess heat
and disposal) is a tenth of that of industry and
road transport energy emissions, yet ocean
is actually fishing nets, confirms that fishing
and food have a far greater impact than
emissions came from from GHGs since 1971
plastic is a priority for many consumers. packaging when it comes to damaging the the production and has been absorbed by
Understandably, people don’t think in terms
of GHGs, but more consumers prioritise
ocean and the role of its biomass in
storing carbon.
incineration of plastic the ocean.
ocean plastic than a loss of biodiversity in in 2015. Source: Intergovernmental Panel on
Climate Change (IPCC)
the oceans when,
FIGURE 2:6
Consumers selecting plastic pollution (e.g. ocean plastic)
as a top-three environmental concern’
62%
59% 59% 58% 58% 58% 57% 57%
51% 50% 49%
47%
43% 42%
40%
37%
18% 19%
13% 15% 13% 13% 13% 13% 13%
12% 12%
10% 10% 10%
8% 7%
UK Ireland S Korea India Germany Poland Canada Italy France China Spain Australia USA Japan Thailand Brazil
Any rank 1
Note: Consumers were asked to choose up to three concerns. The figure shows plastic pollution selected first and ‘any ranking’.
Base: 500 internet users aged 16/18+
Source: Dynata/Lightspeed/Mintel, March 2021; UC Santa Barbara; Climate Watch; World Resources Institute; Sea Shepherd.38
CHALLENGES FOR COMPANIES | How consumers’ concerns match up with emissions CONSULTING
Seeing is believing
National levels of concern around climate delivering solutions or sustainable products, as Protocol encouraged an international approach
change appear grounded in what consumers is confirmed in our characterisation studies in with emission-reduction projects in developing
experience in their own countries. Tangibility is Chapter 3 (see Figure 3:1), where sustainable countries counted as part of a ‘donor’ country’s
key to why consumers buy into or engage with consumers are distinguished by the high targets, the 2015 Paris Agreement promotes
some issues more than others. emphasis they place on values like ‘community’ doing things in one’s own backyard to avoid any
and ‘localism’. ‘double counting’ (i.e. where countries can allow
That may hardly seem an earth-shattering an emission reduction to be claimed by another
insight, but it signifies the importance of This theme of localism also has historic and party and also count it as part of the reduction
tangibility and localism when it comes to political significance. While the 2005 Kyoto towards its own target).
FIGURE 2:7
Consumers’ attitudes to climate change
69%
64%
61% 59%
59%
57%
54% 54% 54%
52% 52%
47%
51% 49% 48% 49% 51% 48% 48%
47% 45% 45% 45%
41% 42% 42% 43%
38% 37% 37%
34% 33%
S Korea Italy Japan Spain China Canada Germany Ireland UK Thailand Brazil India France USA Poland Australia
Concerned about climate change (any rank) I believe that the country where I live is suffering from climate change
Base: 500 internet users aged 16/18+;
Source: Dynata/Lightspeed/Mintel March 202139
CHALLENGES FOR COMPANIES | How consumers’ concerns match up with emissions CONSULTING
Concerns: Loss of biodiversity in the oceans
Consumers are more concerned about In Kenya, Mikoko Pamoja is a
ocean plastic than a loss of biodiversity community-led, Plan Vivo-certified
in the oceans (see Figure 2:1), yet the mangrove conservation and restoration
destruction of marine habitats is more project that provides long-term incentives
worrying, especially as it diminishes for mangrove protection and restoration
the planet’s power to store carbon and through community involvement.
decelerate climate change.
In the UK, the four-year ReMEDIES project
The good news is that marine conservation has begun to plant eight hectares of
can boost carbon sequestration. Mangroves seagrass meadows in Plymouth Sound
cover 2% of marine environments but account and the Solent Maritime Special Area
for 10–15% of the carbon stored, while of Conservation. The project is aimed at
seagrasses cover just 0.2% of the seafloor starting to redress the loss of an estimated
yet absorb 10% of the carbon dioxide stored 92% of the UK’s seagrass, caused by pollution
by the ocean. To put things into context, a and physical disturbance from boats.
typical square kilometre of territorial forest The project is supported by the Marine
stores 30,000 metric tonnes of carbon. The Conservation Society.
figure for seagrass is 83,000.03 Solutions consumers think
will save the planet41
CHALLENGES FOR COMPANIES | Solutions consumers think will save the planet CONSULTING
Environmental innovations FIGURE 2:8
perceived as having a ‘high to
moderate impact’ can be quick
wins for companies looking to
Environmental solutions perceived by consumers as having ‘high to moderate impact’
roll out a consumer-friendly
strategy that doesn’t require
explanation or sales skills.
Planting new forests 88%
However, as with consumers’
priorities, the real question
is what is most impactful—or
Protecting existing forests 87%
relevant—for a business’s sector.
The results in Figure 2:8 help to
identify laudable, high-impact
Investments in renewable energy 82%
solutions that require greater
education and better positioning
by businesses if they’re to resonate 78%
Projects for developing countries to use clean fuels at home
and succeed with consumers.
Preferential loans to invest in energy efficiency upgrades 73%
Bans or limitations on diesel/petrol/gas vehicles 72%
A carbon tax on companies, services and products 71%
Food produced from leftover ingredients 66%
GMO crops to withstand pests/climate change 64%
Food grown in labs 48%
Base: 500 internet users aged 16/18+;
Source: Dynata/Lightspeed/Mintel March 202142
CHALLENGES FOR COMPANIES | Solutions consumers think will save the planet CONSULTING
Planting trees is the cornerstone of FIGURE 2:9
many businesses’ efforts to offset
emissions, and it understandably
resonates with the high proportions of Consumers selecting deforestation as a
consumers citing deforestation as a top three environmental concern
top-three concern (Figure 2:1).
This is laudable and much needed, but 59%
protecting existing forests is an even 52%
more impactful solution, since saplings 48% 48%
47%
won’t absorb as much carbon dioxide 46%
44%
as cut-down mature forests would’ve 42%
released. In storage terms, the older 38% 38% 37%
35%
the forest, the greater the impact. For 33% 33%
30%
example, a one-hectare commercial
conifer plantation grown over 50 years
will store between 50 and 100 tonnes 14%
15%
13%
of carbon, but that rises to 250 tonnes 10% 10% 9% 10% 10% 10% 10%
8%
for a plantation that is 300 years old.* 7% 7%
5%
7% 6%
3%
Germany Brazil France Spain Italy UK Thailand India Poland Ireland Japan Canada Australia USA China S Korea
Any rank 1
Note: One tonne of carbon is equivalent to 3.7 tonnes of carbon dioxide.
Base: 500 internet users aged 16/18+
Sources: Dynata/Lightspeed/Mintel, March 2021; Eurostat; *Forestry Commission43
CHALLENGES FOR COMPANIES | Solutions consumers think will save the planet CONSULTING
FIGURE 2:10
Planting new forests
Consumers perceiving planting new forests as having ‘high to moderate
impact’ and percentage of land covered by forests, Europe, by country, 2021 With trees and carbon
sequestration, it’s about
0% 100% species too.
Land area covered by forest (%)
Ireland
UK
Poland
88% 11%
88% 13%
Germany 90% 31%
87% 33%
France
89% 31%
Italy
94% 32%
Spain
91% 37%44
CHALLENGES FOR COMPANIES | Solutions consumers think will save the planet CONSULTING
Solutions: Investments in
renewable energy
World Tree’s programmes use the After forest planting and conservation,
fastest-growing hardwood tree in the world, the ‘investments in renewable energy’ are most
Empress Splendor. It can grow 10 to 20 feet tall in likely to be perceived by consumers as
its first year and reach maturity in 10 years, with an having a ‘high to moderate’ positive impact
acre typically capturing 103 metric tonnes of carbon on the environment. However, many of
dioxide. That compares very favourably with 9.5 for these schemes are based on ‘offsetting’—as
most species. What’s more, if an Empress is cut down, it opposed to actually reducing—a company’s
regrows from the stump and will regenerate up to seven carbon emissions footprint.
times, continuing to absorb carbon for over 50 years.
The NGO RE100 shows how things can be
different by helping companies along a
stringent, direct route to taking responsibility
for zero emissions across their entire
supply chain.
By pledging to transition to 100% renewable
electricity within their operations and their
global supply chains by 2050, brands can’t
simply offset their operations by investing
Sources: RE100; Burberry
in someone else’s renewable project on the
other side of the world.
Instead, they must invest in putting solar
panels on the roofs of their offices and
those of their third-party factory suppliers.
RE100 partner Burberry demonstrates just
how far companies need to go. It already
sources 90% of its electricity from renewable
sources, but a lower proportion, 41%, of
Source: World Tree its products are manufactured in facilities
‘where a significant portion of the
energy used is renewable, either
on-site or procured’.45
CHALLENGES FOR COMPANIES | Solutions consumers think will save the planet CONSULTING
Solutions: Food
grown in labs
Consumers favour supposedly more
‘natural’ solutions over lab-grown
foods, which tend to focus on
realistic-looking meat alternatives.
But Solein from Solar Foods is
lab-grown food with a difference,
and it aims to deliver on a huge
scale. In a twist on traditional
fermentation techniques,
water is taken from the air for
microorganisms to live in. They’re
then fed bubbles of carbon dioxide,
nitrogen, calcium, phosphorus and
potassium so that they grow and
multiply. This process generates 1kg
of nutrient-rich powder from two
ingredients: water and renewably
sourced electricity.
Source: Solar Foods (https://solarfoods.fi/)46
CONSULTING
Key Takeaways
01 02 03
Consumers are most concerned by Companies must address these ‘Seeing is believing’: national levels
the environmental issues that are concerns but still engage on the issues of concern around climate change
the most tangible (climate change), that are most impactful and relevant are closely linked to what consumers
threatening to one’s health (air quality) to their business. experience in their own countries,
and visible (plastic pollution). making tangibility—and locality
—key to which issues and solutions
consumers buy into.
04 05
Consumers perceive planting new These solutions, along with lab-grown
forests, protecting existing forests, and foods, present opportunities for
investments in renewable energy as tangible, local solutions.
the highest-impact solutions.Approaches
for success
01   Understand consumers’
     characterisation
     and touchpoints
02
Educate on impact
03
Sell in the science
04
Use clear metrics and language
04
Key Takeaways01 Understand consumers’
characterisation
and touchpoints49
APPROACHES FOR SUCCESS | Understand consumers’ characterisation and touchpoints CONSULTING
Who are the ‘sustainable’ consumers?
Mintel’s driver statements—where Potential ownership is also stronger
consumers answer whether (by four percentage points)
characteristics do or don’t describe amongst those who identify with
them—can answer this question the statement ‘I think that it’s worth
and suggest touchpoints for how to paying more for products of a
engage with them. higher quality’.
For instance, EV/hybrid vehicle The key opportunity here is for
ownership increases (by an financial services companies to
average of four percentage explain and quantify the short-term
points) amongst consumers who benefits of EVs to budget-minded
identify with the statement ‘I like drivers, then align themselves with
to be amongst the first to try new products that promote the leasing
technologies’, but it only increases or purchasing of cleaner vehicles.
amongst those who agree with the
statement ‘I have a budget that I What is the characterisation of,
try to stick to as much as possible’ and what is most important to, a
in the more developed markets sustainably minded consumer?
of China and Japan. Progressive By building a sustainably-minded
tech-savviness defines the EV consumer group and comparing it
owner, but a focus on the superior against the average, we can see
return on investment resulting from that this group identifies especially
ownership is yet to appear in the strongly with commonplace
‘developing’ markets of Europe and factors like sticking to budgets and
the Americas. convenience (‘I am always on the
lookout for things that make my
The same characteristics hold life easier’). Sustainable products
true for those aspiring to own and services should ignore these
EVs. Aspiration levels are even essential qualities at their peril
stronger (by an average of eight in the same way that they should
percentage points) amongst heed consumers’ red lines about
consumers who identify with the what they won’t sacrifice for
statement ‘I like to be among sustainability (Figure 1:7).
the first to try new technologies’.50
APPROACHES FOR SUCCESS | Understand consumers’ characterisation and touchpoints CONSULTING
FIGURE 3:1
How all vs sustainable consumers describe themselves
73%
It is important for me to feel part of a community
83%
70%
Experiences are more important to me than material possessions
81%
73%
I have a budget that I try to stick to as much as possible
80%
67%
I try to buy from local companies where possible
80%
71%
I am always on the lookout for things that make my life easier
79%
69%
I am activley seeking ways to reduce stress
77%
54%
It is important for me to lead an active lifestyle
72%
Being able to express my individuality is a top priority for me in my life
61%
69%
I like to be amongst the first to try new technologies 48%
54%
43%
I like to stand out from the crowd
49%
All Sustainability-minded consumers
Base: 500 internet users aged 16/18+;
Source: Dynata/Lightspeed/Mintel March 202151
APPROACHES FOR SUCCESS | Understand consumers’ characterisation and touchpoints CONSULTING
When it comes to what most FIGURE 3:2
distinguishes a sustainably-minded
consumer from an average
consumer, we see: the importance of The differences in how sustainable consumers describe
human elements around ‘community’
and ‘localism’; a reaffirmation
themselves (percentage points change versus all consumers)
that healthy, active lifestyles also
resonate; and that there are other
touchpoints to explore around It is important for me to feel part of a community 18
reassurance (reducing stress),
individuality, early adoption and I try to buy from local companies where possible 13
egotism (‘I like to stand out from
the crowd’). Appealing to these
Experiences are more important to me than material possessions 11
touchpoints is crucial if we’re to
position sustainable products and
services successfully and ‘sell them It is important for me to lead an active lifestyle 10
like soap or soft drinks’.
I am always on the lookout for things that make my life easier 8
I am activley seeking ways to reduce stress 8
Being able to express my individuality is a top priority for me in my life 8
I have a budget that I try to stick to as much as possible 7
I like to be amongst the first to try new technologies 6
I like to stand out from the crowd 6
Base: 500 internet users aged 16/18+;
Source: Dynata/Lightspeed/Mintel March 202152
APPROACHES FOR SUCCESS | Understand consumers’ characterisation and touchpoints CONSULTING
FIGURE 3:3 Applying this approach to western European
consumers, we can see that Italians might
react best to playful or moral positioning that
What European sustainable consumers are driven by emphasises community benefits while also
appealing to the progressive tech-savviness of
Morals ‘early adopters’.
Image Ethics
90%
Identity Individuality Equality Germans show standard levels of pragmatism
80% Surroundings
but are more disposed to the human rather
70%
Community Sustainability than environmental element of messaging and
60%
identify less with technological or
Heritage
50%
Localism
experiential drivers.
40%
30% UK consumers are least inclined towards early
Media 20% Adventure adoption and focus on premium qualities
10% and those that boost their sense of image
Technology
0% and individuality.
Early Adopters Playfulness
Psycological Experiences
Experience
Nutrition Nostalgia
Physical Quality
Wellbeing
Premium Budget
Convenience
Value
Germany Italy UK
Base: 500 internet users aged 16/18+;
Source: Dynata/Lightspeed/Mintel March 202153
APPROACHES FOR SUCCESS | Understand consumers’ characterisation and touchpoints CONSULTING
Characterisation: Standing
out from the crowd on
a budget
We began with the premise that simply
‘doing good’ isn’t enough for goods
and services to sell and succeed. The
sustainably-minded consumers we’ve
identified are notably characterised
by being more budget conscious and
keener to express their individuality than
the average consumer. They also have
stronger peacock tendencies (‘I like to
stand out from the crowd’). Source: Back Market,
‘Freedom’ campaign
Refurbished tech reseller Back Market
appeals strongly to these values with a
compelling proposition that addresses
the growing problem of e-waste while
promising a ‘fairer, more sustainable future
by allowing very high-tech products to be
sold at up to 70% cheaper than new ones’.
Its ‘Freedom’ campaign extols the virtues
of democratically priced devices and
being ‘different’, while trolling
Apple—and those who line up for its
devices en masse—in the process.You can also read