Low-Voltage Icing Protection Film for Automotive and Aeronautical Industries - MDPI
←
→
Page content transcription
If your browser does not render page correctly, please read the page content below
nanomaterials

Article
Low-Voltage Icing Protection Film for Automotive
and Aeronautical Industries
Liberata Guadagno 1, *, Fabiana Foglia 1 , Roberto Pantani 1 , Maria Dolores Romero-Sanchez 2 ,
Blanca Calderón 2 and Luigi Vertuccio 1, *
 1   Department of Industrial Engineering, University of Salerno, Via Giovanni Paolo II, 132,
     84084 Fisciano (SA), Italy; ffoglia@unisa.it (F.F.); rpantani@unisa.it (R.P.)
 2   Applynano Solutions S.L., Parque Científico de Alicante, Naves de Apoyo, 3, Zona Ampliación del Campus,
     03005 Alicante, Spain; md.romero@applynano.com (M.D.R.-S.); blanca.calderon@applynano.com (B.C.)
 *   Correspondence: lguadagno@unisa.it (L.G.); lvertuccio@unisa.it (L.V.)

 Received: 30 April 2020; Accepted: 7 July 2020; Published: 9 July 2020

 Abstract: High-performance heater films are here proposed. They manifest great applicative
 potentiality in the de-icing technology of aircraft and motor vehicles. The films are suitable to be
 integrated into composite structures for the de/anti-icing function, which can be activated if the
 need arises. The heating is based on the joule effect of the current flowing through the electrically
 conductive films. Voltage and current parameters have been set based on the generators’ capacities
 on-board an aircraft and a car, as well as on the energy consumption during the operating conditions
 and the autonomy in the time. Green processes have been employed through all preparative steps of
 the films, which are composed of expanded graphite (60% wt/wt) and polyvinyl alcohol (PVA) (40%
 wt/wt). The results reveal a very significant influence of the aspect ratio of the filler on the heating
 and de-icing performance and suggest how to enhance the de-icing efficiency saving energy and
 adapting the current on-board aircraft/car generators for de-icing operations.

 Keywords: graphene derivatives; smart materials; aspect ratio; electrical heating; de-icing

1. Introduction
     The icing has relevant effects on the flying safety of an aircraft and the greenhouse gas emissions in
the environment. Ice on aircraft surfaces modifies the smooth flow of air, decreasing lift, increasing the
mechanical resistance determined by the contact of the aircraft with the air and determining a decrease
in the stability. The increase in mechanical resistance needs to be compensated by an additional power
with the increase in fuel consumption and emission of gaseous pollutants. Furthermore, the maneuvers
necessary for the lift, in this adverse condition, and to maintain the desired altitude cause an additional
ice accumulation underside of the wings and fuselage. Usually, the de-icing of an aircraft is carried out
through a sprayable chemical, in the case of aircraft stopped on the ground, before takeoff or resorting
to board mechanisms, specifically studied for the ice removal, which can be classified as mechanical,
chemical or thermal. The latter is currently one of the most used. This technology exploits the power of
engines conveying hot air from one of the turbine stages to heat the airfoil leading edges [1], resulting in
high fuel consumption, and the increase of CO2 and NOX in the Earth’s atmosphere. Hence, the current
technology is economically expensive, involves a waste of resources and an increase in air pollution.
It needs only think, for example, that more than 300,000 tons of CO2 are generated daily from the
aircraft flights [1]. Thus, there is a growing need for new technologies allowing air decarbonization
and low-cost environmentally-friendly flights. Different research approaches have been used to solve
the de-icing problem. One of these is inspired by the lotus leaf and the water strider. The passive
anti-icing strategy based on hydrophobic surfaces has been investigated, which can retard freezing or

Nanomaterials 2020, 10, 1343; doi:10.3390/nano10071343                    www.mdpi.com/journal/nanomaterials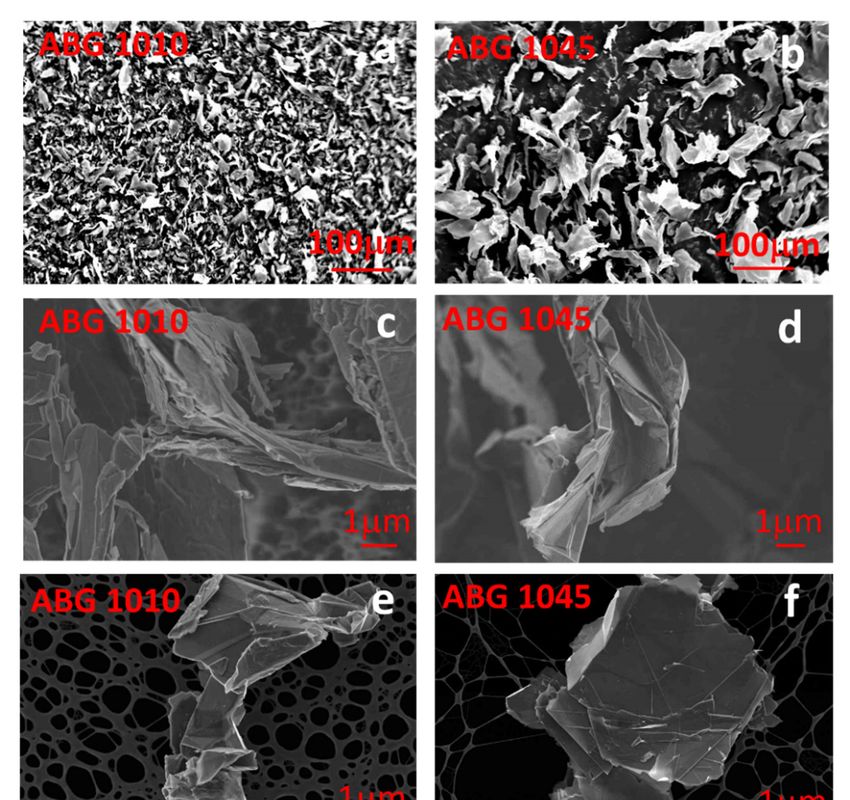
Nanomaterials 2020, 10, 1343                                                                           2 of 16

frosting and facilitate water droplets sliding off [2–5]. The contact angle plays a fundamental role, in the
hydrophobicity of the surfaces and on the water droplet freezing process. Previous studies [3,6–8] have
suggested that the freezing start time is delayed due to the smaller solid/liquid contact area, decreasing
the heat transfer from the water droplet to the cooling surface. In this context, PDMS polymer, thanks
to its low surface energy, seems to turn out to be a good candidate for preparing a hydrophobic surface
for anti-icing applications [4,9]. Together with this passive strategy, electro-thermal de-icing methods,
at lower power, can be alternative leading technologies to the above-mentioned solution. In this context,
for developing a very effective electro-thermal anti/deicing strategy, one of the factors to be taken into
account is the possibility to employ the energy source currently already available on the vehicles.
      The on-board generators are characterized by a limited power (for example all the Boeing 787
generators produce together 800 KW), and only a part of this energy is reserved to activate the
electro-thermal de-icing systems (from 45 to 75 KW) [10]. For instance, according to the reference [10],
an heat flux density from 14 KW/m2 to 34 KW/m2 is needed for a Boeing 787. In recent years, academic
and industrial research has increasingly focused on the design of electro-thermal heating systems,
which can exploit the advantages of the electrically conductive nanoparticles. In this case, the heating is
determined by the Joule effect of the current flowing through the electrically conductive nanomaterial.
Joule heating is an energy-efficient method of ice removal that can be capable of real-time de-icing.
The choice fell on systems loaded with carbon fillers to replace metal-based electrical heating devices,
which present various drawbacks such as high production costs, emission of the electromagnetic wave
and oxidative corrosion [11]. Carbon nanotubes [12,13], graphite derivatives [14–17] and graphene
nanoribbons [18] have become the first candidates to develop polymeric matrices or functional coatings
able to confer anti/de-icing ability to polymeric systems. Their introduction allowed enhancing
the electrical, mechanical and thermal properties [19–21]. However, these properties depend on
aspect ratio, size, structure and morphology of the nanoparticles dispersed in the composite [19,22].
Many researchers used graphite derivatives or carbon nanotubes to modify the carbon fiber reinforced
epoxy composite, improving the electrical conductivity and opening a possibility to use the composite
as a heater to de-ice aircraft surfaces. Although the electrical conductivity of the developed nanocharged
resins has been found to significantly increase [23–26] up to value about 102 –103 S/m; it should be
considered that for these values, the voltage required to promote effective heating, in acceptable times,
is still too high compared to the voltage that can be supplied of the currently onboard generators
of an aircraft. It is worth noting that for Carbon Fiber Reinforced Composites (CFRCs), which are
reinforced with electrically conductive fibers, at least on a theoretical basis, it may be possible to exploit
the Joule effect of the current running through the fibers. This strategy is not practicable for Glass
Fibers Reinforced Composites (GFRCs), due to the insulating properties of the glass fibers. In this last
case, the reinforced epoxy composites must be impregnated with resins containing a high amount of
nanofiller, corresponding to a nanofiller concentration beyond the Electrical Percolation Threshold
(EPT). This requirement imposes restrictions on the choice of the manufacturing process [27,28] or the
control of viscosity, through specific functionalization of the nanofiller, to mitigate the increase in the
viscosity due to nanoparticles, hence still making the nanofilled resin processable [29–31]. A completely
different approach has been recently proposed in literature. It is based on the employment of a film
heater used as an interlayer among the layers of GFRCs or CFRCs. In this last direction, the 2D structures,
like buckypaper, or graphene-based films, may fulfill requirements such as structural compatibility,
flexibility, mechanical reinforcement and adaptability in multilayered structures. Currently, 2D
structures can be fabricated by chemical vapor deposition [32], oxide paper-reduction [33,34] and
casting [35], to name a few. The graphene/graphite structures are based on stacking processes and
orientations of graphitic multilayers allowing high mechanical robustness. This robustness is obtained
at the expense of the flexibility of the 2D system. The use of thin thickness allows only apparent
flexibility. The introduction of small amounts of an appropriate polymer allows obtaining, at the same
time, high mechanical strength and discrete flexibility [36]. In a previous paper [36], it has been proven
that the employment of a heating film based on the exfoliated graphite may represent a very efficient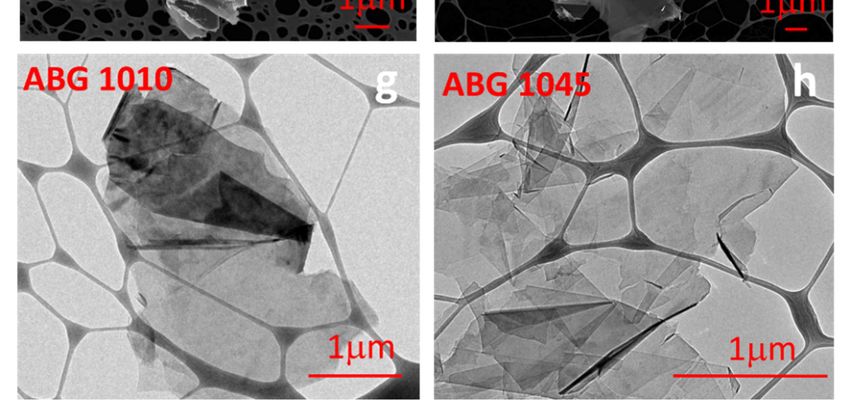
Nanomaterials 2020, 10, 1343                                                                                          3 of 16

  strategy for developing anti/de-icing protection systems. For instance, the problem of icing of the
  aircraft/automotive parts can be efficiently solved using flexible films as a ply of the GFRCs or CFRCs.
  To prepare this ply, we have tried to optimize all the conditions before dealing with issues related to
  the scale-up of the technology involving large panels also of curved geometry. In particular, in this
  work, two types of expanded graphite, commercially available, are used to produce flexible films, by a
  green solvent casting process, using a PVA-based water solution. The structural investigation has
  highlighted that the different aspect ratio of two fillers; and the different structure of the starting fillers
  determine a different heating performance of the obtained films. Higher performance is obtained when
  the filler with the highest aspect ratio is used. The flexible film heater presents great potentiality as
  de-icing 2020,
Nanomaterials technology,
                  10, x FOReasily integrable in part of the aeronautical panels or of the aircraft structure.
                            PEER REVIEW                                                                4 of 17

  2. Materials and MethodsBRUKER Vertex70 (Bruker,
    FTIR spectroscopy                                                    Fillers/film          According to ref [36]
        Two expanded graphitesBillerica,
                                     (supplied   Ma,byUSA)
                                                        Superior Graphite Co. Chicago, Illinois, USA) have been
                                                                                               Three points bending
  used   for the
   Dynamic       production of heating
              mechanical         Tritec 2000films:  the ABG 1010 and the
                                                DMA-Triton                   FilmABG 1045. The       heater films, based on
                                                                                                        mode
  PVA   (Sigma
      analysis    Aldrich—70,000–100,000
               (DMA)         Technology (Triton  MW)    (Sigma Aldrich
                                                     Technology,       (0.3Missouri,
                                                                             × 10 × 15 USA) have been prepared by a
                                                                                               Amplitude    = 0.05 mm;
  solvent casting process in whichGrantham,
                                       the dispersionUK) of filler has been mm    3)
                                                                                obtained    by ultra-sonication (Hielscher
                                                                                               According to ref [36]
  model UP200S-24 kHz high       power ultrasonic probe) (Hielscher Ultrasonics, Teltow, Germany). Thermal
                               Mettler DSC 822/400 (Mettler
  Differentialof
  annealing     Scanning
                  the film completed     the(Mettler-Toledo
                                               production procedure.        In particular, the     expanded     graphite
                                 Toledo)                                 Fillers/film          According    to ref [36] has
    Calorimetry
  been suspended  (DSC)and mixed by    magnetic      stirring  in a solution    of   deionized   water   and  PVA    having a
                                   Columbus, OH, USA)
  ratio PVA/water (g/mL) of about      0.3 TGA/SDTA
                                  Mettler    g in 75 mL in 851order to obtain a good solubilization of the polymer in
    Thermogravimetric
                             (Mettler-Toledo
  water. After the solubilization                Columbus,
                                    of the polymer,            OH, mixture
                                                         the liquid      Fillers/film
                                                                                has been ultra-sonicated
                                                                                               According to forref [36]
                                                                                                                   two-hours,
      analysis (TGA)
  allowing to obtain a stable ExpandedUSA)      Graphite (EG) solution. Afterwards, a 200 ± 10 µm-thick flexible
  filmDynamic    Light
        heater has   been obtainedZetasizer    ZSP (Malvern
                                    by evaporation        casting, followed     by thermal
                                                                            Fillers            annealing
                                                                                             Refraction     at 120
                                                                                                         index
                                                                                                                    ◦ C for 1 h
                                                                                                                (1.33–2.4)
     Scattering (DLS)         Panalytical Ltd Malvern, U.K.)
  applying a pressure of 500 psi. A ratio by weight of expanded graphite/PVA equal to 60/40 has been
  chosen for both graphites. HPThis
                                 34401A    Digital
                                      specific      Multimeterallows obtaining
                                                 composition                 Film       shapeable flexible graphite-based
 Electrical conductivity                                                                            4-wire method
  foils. This aspect is relevant  because
                             (Keysight        some aircraft
                                         Technologies,    Santa parts are more
                                                                        (0.2 × 7.5vulnerable
                                                                                     ×1          than others. Ice accretion
       measurement                                                                             According    to ref [36]
  during the flight occurs most of all on the leading edge of thecm              3)
                                                                              aircraft    wing and generally covers only
                             Rosa,Ca, USA)
  2% of the wing chord [37].-Thermocouples
                                   Efficient film (Omega
                                                       flexibility allows its applicability also to localized zones
  with a curved geometry, such       as,  for  example,
                               Engineering Ltd. Manchester the more vulnerable part of an aircraft (leading edges).
  Films   with  a
       Temperatureratio by weight   of expanded
                                              U.K.)   graphite/PVA     equal    to 70/30 have been also prepared and
                                                                             Film
  characterized
       measurement  for both graphites.-PowerThesupply
                                                  results are not reported
                                                                        (0.2 × 7.5here
                                                                                     × 5 because     their characterization
                                                                                               According    to ref [36]
                              (EA-PS 2042-20B)
  highlighted that the requirement                  (EA Elektro-
                                         of flexibility   was not satisfied.     3)
                                                                             cmThe     film heaters here analyzed, with a
                              Automatik
  ratio by weight of graphite/PVA            GmbH
                                          equal   to and  Co.KG
                                                      60/40  are shown in Figure 1. The expanded graphites and
                                  Helmholtzstr,     Viersen)
  the flexible film heaters have been characterized by different experimental techniques summarized
                             Imager camera PCE-PI 450 (PCE                   Film                Frequency = 27 Hz
  in Table   1. Many of the characterization procedures have been carried out in agreement with those
       Temperature
                              Deutschland GmbH Meschede,                (0.2 × 7.5 × 5             IR resolution of
 distribution
  described in monitoring
                  a previous paper [36].
                                             Germany)                       cm ) 3               382 × 288 pixels

                                 Figure 1. Optical
                                    Figure         images
                                           1. Optical     of the
                                                      images      developed
                                                              of the        filmfilm
                                                                     developed    heaters.
                                                                                     heaters.

3. Results and Discussion

3.1. Structural Analysis

     X-ray diffractograms of the expanded graphites are shown in Figure 2a. The ratio between the
area of the 002 peak (centered at about 2θ = 26°) and of the superimposed amorphous halo (red line,
Nanomaterials 2020, 10, 1343                                                                                           4 of 16

                                            Table 1. Characterization methods.
                                                                       Characterized        Procedure Measurement/
         Method                             Device
                                                                         Sample             Technical Specifications
   Wide-angle X-ray             Bruker D8 Advance diffractometer
                                                                           Fillers             According to ref [36]
  diffraction (WAXD)               (Bruker, Billerica, MA, USA)
   Scanning Electron           JSM-6700F, (JEOL Akishima, Tokyo,
                                                                           Fillers             According to ref [36]
   Microscopy (SEM)                            Japan)
      Transmission                                                                          Resolution image 0.38 nm
                                   JEOL model JEM-1400 Plus
  Electron Microscopy                                                      Fillers          between dots and 0.2 nm
                                 (JEOL Akishima, Tokyo, Japan)
         (TEM)                                                                                   between lines.
                                  Renishaw inVia (Renishaw
  Raman Spectroscopy                                                       Fillers             According to ref [36]
                                  Wotton-under-Edge, U.K.)
                               BRUKER Vertex70 (Bruker, Billerica,
   FTIR spectroscopy                                                     Fillers/film          According to ref [36]
                                         Ma, USA)
  Dynamic mechanical                                                                        Three points bending mode
                               Tritec 2000 DMA-Triton Technology             Film
    analysis (DMA)                                                                            Amplitude = 0.05 mm;
                               (Triton Technology, Grantham, UK)     (0.3 × 10 × 15 mm3 )
                                                                                               According to ref [36]
  Differential Scanning     Mettler DSC 822/400 (Mettler Toledo)
                                                                         Fillers/film          According to ref [36]
   Calorimetry (DSC)       (Mettler-Toledo Columbus, OH, USA)
  Thermogravimetric        Mettler TGA/SDTA 851 (Mettler-Toledo
                                                                         Fillers/film          According to ref [36]
     analysis (TGA)                 Columbus, OH, USA)
     Dynamic Light         Zetasizer ZSP (Malvern Panalytical Ltd.
                                                                           Fillers          Refraction index (1.33–2.4)
    Scattering (DLS)                   Malvern, U.K.)
        Electrical              HP 34401A Digital Multimeter
                                                                             Film                4-wire method
      conductivity           (Keysight Technologies, Santa Rosa,
                                                                     (0.2 × 7.5 × 1 cm3 )      According to ref [36]
      measurement                         Ca, USA)
                            -Thermocouples (Omega Engineering
                                    Ltd. Manchester U.K.)
      Temperature                      -Power supply                         Film
                                                                                               According to ref [36]
      measurement                   (EA-PS 2042-20B) (EA             (0.2 × 7.5 × 5 cm3 )
                           Elektro-Automatik GmbH and Co.KG
                                   Helmholtzstr, Viersen)
      Temperature              Imager camera PCE-PI 450 (PCE                                   Frequency = 27 Hz
                                                                             Film
      distribution                   Deutschland GmbH                                            IR resolution of
                                                                     (0.2 × 7.5 × 5 cm3 )
       monitoring                   Meschede, Germany)                                          382 × 288 pixels

3. Results and Discussion

3.1. Structural Analysis
      X-ray diffractograms of the expanded graphites are shown in Figure 2a. The ratio between the
area of the 002 peak (centered at about 2θ = 26◦ ) and of the superimposed amorphous halo (red line,
Figure 2a) allowed evaluating the percentage of exfoliated graphite according to a procedure already
described in literature [13].
      According to the Hermans–Weidinger method [38], the ABG 1010 and ABG 1045 present an
exfoliation percentage of about 12% and 14%, respectively. Furthermore, based on Hermans–Weidinger
method [38] and on Scherrer’s equation [39], the number of layers for each graphite [40] has been
calculated. In particular, considering the value of 3.39 Å for the d-spacing of the reflection (002),
a number of about 92 layers for the ABG 1010 and 78 layers for the ABG 1045 has been obtained.
The Micro-Raman (MR) spectra of the fillers are shown in Figure 2b. Two intense peaks are detected,
one at 1580 cm−1 , known as “G band” [41] and the other one at 2700 cm−1 known as “2D band” [22,42].
Furthermore, the peak related to the “D band” (1352 cm−1 ), associated with the edge distortion
phenomena [43] results negligible for both fillers (Figure 2b) due to the presence of graphitic blocks in
the filler. The level of disorder in graphene is similar for both expanded graphites. In fact, the average
value of the intensity ratio of the D-band (1352 cm−1 ) to G-band (1580 cm−1 ) (ID/IG) is 0.081 ± 0.02
for ABG 1010 system and 0.083 ± 0.01 for ABG 1045 system. The Micro-Raman spectra, not reported
here, on the film heaters have shown an additional exfoliation, which may be due to the effect of the
ultrasonication process. In fact, higher average values of ID/IG, with respect to the values of fillers,
have been obtained. In particular, the values of ID/IG are 0.141 and 0.114 for ABG 1045 and ABG 1010
film heaters, respectively. In order to further define the size of the graphite nanoparticles, an analysis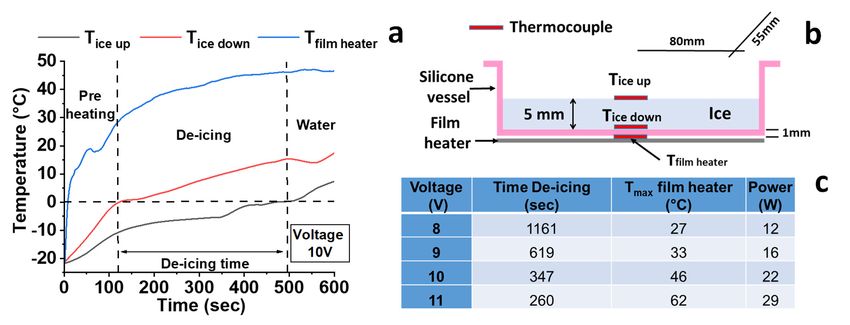
Nanomaterials 2020, 10, 1343                                                                                                                           5 of 16

of the frequency distribution has been obtained for both fillers. Different particle sizes, ranging from
1 µm to 450 µm, were observed (Figure 2c,d). In particular, the ABG 1010 is characterized by a size
distribution between 1 µm and 60 µm centered at a value of about 14 µm (Figure 2c), whereas the ABG
1045 sample manifests a wider distribution up to values of 450 µm with an average value of 75 µm
(Figure 2d). In any case, the ABG 1045 filler, compared with the grade 1010, results to be composed
of wider particle sizes, but characterized by thinner thicknesses (see the average number of layers
resulting from X-ray analysis). This result, added to the different length perpendicular to the reflection
plane 002, observed in the XRD analysis, allows affirming that the two fillers strongly differ in their
aspect ratio. Since DLS could overestimate the particle size of the samples, due to the presence of
agglomerates, morphological analysis has been carried out to evaluate the size of the graphitic blocks
Nanomaterials
of            2020, 10,graphites.
   both expanded       x FOR PEER REVIEW                                                            5 of 17

                                                                                                       ABG 1010 (powder) Sample           ID/IG
                                        ABG 1010 (powder)
        a                               ABG 1045 (powder)            b                                 ABG 1045 (powder) ABG 1010
                                                                                                                              ABG 1045
                                                                                                                                          0.081±0.02
                                                                                                                                          0.083±0.01
                                        Amorphous halo                                                                1580
                Intensity (A.U.)

                                                                            Intensity (A.U.)
                                                                                                             1352

                                                                                                                       1580

                                                                                                             1352

                                   10   15   20   25     30   35   40                          500       1000   1500     2000    2500    3000
                                                                                                                                -1
                                              2θCuKα (deg)                                                  Raman shift (cm )
        c                    8                                            d                    8
                                                       ABG 1010 (powder)                                    ABG 1045 (powder)

                             6                                                                 6
            Volume (%)

                                                                           Volume (%)

                             4                                                                 4

                             2                                                                 2

                             0                                                                 0
                                   1         10         100        1000                            1            10           100         1000
                                              Size (μm)                                                              Size (μm)

      Figure 2. Structural investigation of ABG 1010 and ABG 1045 powders: (a) X-ray diffraction,
      Figure 2. Structural investigation of ABG 1010 and ABG 1045 powders: (a) X-ray diffraction, and (b)
      and (b) Raman spectra; (c) size distribution of ABG 1010, and (d) ABG 1045 powders.
      Raman spectra; (c) size distribution of ABG 1010, and (d) ABG 1045 powders.
3.2. Morphological Analysis
       According to the Hermans–Weidinger method [38], the ABG 1010 and ABG 1045 present an
       SEM investigation of the expanded graphite ABG 1010 and ABG 1045 samples has been performed
exfoliation percentage of about 12% and 14%, respectively. Furthermore, based on Hermans–
to analyze the morphology of each filler before the production of the film heater. Figure 3 shows
Weidinger method [38] and on Scherrer’s equation [39], the number of layers for each graphite [40]
SEM images of ABG 1010 and ABG 1045 powders, respectively. The expanded graphite nanoparticles
has been calculated. In particular, considering the value of 3.39 Å for the d-spacing of the reflection
appear like a porous structure with graphitic blocks not well separated and folded. The nanosheets of
(002), a number of about 92 layers for the ABG 1010 and 78 layers for the ABG 1045 has been obtained.
the exfoliated graphite are characterized by highly irregular shapes as already found for this kind of
The Micro-Raman (MR) spectra of the fillers are shown in Figure 2b. Two intense peaks are detected,
filler [22,36] and−1 due to the thermal treatment of the raw graphite. From−1a first analysis, the size of ABG
one at 1580 cm , known as "G band" [41] and the other one at 2700 cm known as “2D band” [22,42].
1045 seems to be larger than that of ABG 1010 (Figure 3a,b). The     size of the expanded graphite samples
Furthermore, the peak related to the “D band” (1352 cm−1), associated with the edge distortion
was calculated by averaging the size of at least 50 particles using the FESEM images. The images in
phenomena [43] results negligible for both fillers (Figure 2 b) due to the presence of graphitic blocks
Figure 3c,d correspond to the graphite samples after a sonication treatment in a 0.1 mg/mL concentration
in the filler. The level of disorder in graphene is similar for both expanded graphites. In fact, the
isopropanol solution followed by the drying process at room       temperature. Sample ABG 1010 shows a
average value of the intensity ratio of the D-band (1352 cm−1) to G-band (1580 cm−1) (ID/IG) is 0.081 ±
lower size (20.0 ± 11.1 µm) than ABG 1045 filler, which is characterized by an average particle size
0.02 for ABG 1010 system and 0.083 ± 0.01 for ABG 1045 system. The Micro-Raman spectra, not
of 59.7 ± 30.9 µm with a higher standard deviation. These results are in agreement with the analysis
reported here, on the film heaters have shown an additional exfoliation, which may be due to the
effect of the ultrasonication process. In fact, higher average values of ID/IG, with respect to the values
of fillers, have been obtained. In particular, the values of ID/IG are 0.141 and 0.114 for ABG 1045 and
ABG 1010 film heaters, respectively. In order to further define the size of the graphite nanoparticles,
an analysis of the frequency distribution has been obtained for both fillers. Different particle sizes,
ranging from 1μm to 450 μm, were observed (Figure 2c,d). In particular, the ABG 1010 is characterized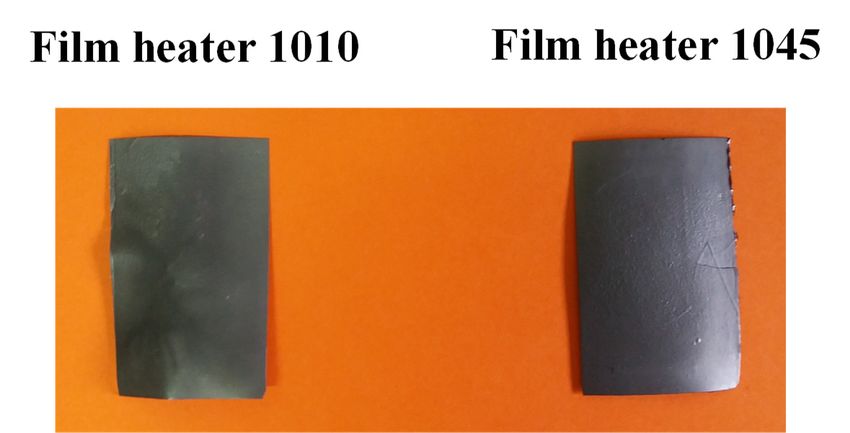
Nanomaterials 2020, 10, 1343                                                                                         6 of 16

of the frequency distribution (DLS). Finally, TEM micrographs (Figure 3e,f) highlight that the ABG
1045 sample result was composed of thinner blocks than the ABG 1010 sample, confirming the X-ray
results. In fact, it is well evident, through TEM investigation, that the highest thickness of the filler
ABG 1010 hinders the transmission of the electrons, making the TEM image darker. The structural
and morphological analysis highlight that the two considered systems differ in their aspect ratio.
In particular, from the evaluation of the average size obtained by morphological analysis and the length
perpendicular to the reflection 002 obtained by diffractometric analysis, aspect ratio values of about
600 and 2300 have been calculated for ABG 1010 and ABG 1045 filler, respectively. This significant
Nanomaterialshas
difference    2020, 10, x found
                 been     FOR PEER REVIEW
                                relevant in determining the performance of the de-icing phenomenon.7 of 17

     Figure 3.
     Figure  3. (a)
                (a) SEM
                    SEM micrograph
                          micrograph ofof the
                                          the exfoliated  graphite ABG
                                               exfoliated graphite  ABG 1010
                                                                          1010 raw
                                                                               raw powder
                                                                                    powder and and (b)
                                                                                                   (b) the
                                                                                                       the exfoliated
                                                                                                            exfoliated
     graphite  ABG    1045 raw   powder;   (c) magnification   of the SEM   micrograph    of the exfoliated
     graphite ABG 1045 raw powder; (c) magnification of the SEM micrograph of the exfoliated graphite        graphite
     ABG 1010
     ABG   1010 raw
                 raw powder
                      powder andand (d)
                                    (d) magnification
                                        magnification of of the
                                                            the SEM
                                                                SEM micrograph
                                                                      micrograph ofof the
                                                                                      the exfoliated
                                                                                           exfoliated graphite
                                                                                                       graphite ABG
                                                                                                                 ABG
     1045  raw   powder;   (e) FESEM    micrograph     of the  exfoliated  graphite ABG     1010
     1045 raw powder; (e) FESEM micrograph of the exfoliated graphite ABG 1010 and (f) exfoliated and   (f) exfoliated
     graphite ABG
     graphite   ABG 1045
                      1045 after
                            after sonication
                                  sonication treatment
                                               treatment in
                                                          in isopropanol
                                                              isopropanol solution;
                                                                            solution; (g)
                                                                                       (g) TEM
                                                                                           TEM micrograph
                                                                                                 micrograph of  of the
                                                                                                                   the
     exfoliated  graphite  ABG   1010, and   (h) the exfoliated  graphite ABG   1045  after  sonication
     exfoliated graphite ABG 1010, and (h) the exfoliated graphite ABG 1045 after sonication treatment intreatment  in
     isopropanol solution.
     isopropanol    solution.

3.3 FTIR Spectra Analysis
     Figure 4a shows the FTIR spectra of the two fillers. Both spectra are typical of an oxidized
graphite. The broad intense band around 3440 cm−1 is due to the O-H stretching vibration. This band
is diagnostic of OH groups and/or COOH groups. The weak signals at 2857 and 2923 cm−1 in the
Nanomaterials 2020, 10, 1343 7 of 16
3.3. FTIR Spectra Analysis
Figure 4a shows the FTIR spectra of the two fillers. Both spectra are typical of an oxidized
graphite. The broad intense band around 3440 cm−1 is due to the O-H stretching vibration. This band
is diagnostic of OH groups and/or COOH groups. The weak signals at 2857 and 2923 cm−1 in the
spectrum of the ABG 1045 powder sample are due to C-H stretching vibrations (asymmetrical and
symmetrical stretching of methylene groups, respectively (νasCH2 and νsCH2 ). In addition to these
signals, the spectrum of the ABG 1010 powder sample also shows the peak at 2963 cm−1 , indicating the
presence of C-H stretching vibrations of methyl groups. The C=C stretching vibration (CC ring) of the
Nanomaterials 2020, 10, x FOR PEER REVIEW 8 of 17
graphitic phase is observed at 1636 cm−1 [44]. On the left side of this last band, C=O stretching signals
are
the observable
spectral range (seefrom
signals
1000at
to1732,
1500 cm 1740 cm−1strong
−1, two ) indicating the presence
C-O bands at 1100 and of 1024
carboxyl
cm−1 ingroups. In the
the spectrum
spectral range from 1000 to 1500 cm −1 , two strong C-O bands at 1100 and 1024 cm −1 in the spectrum
of the ABG 1010 sample indicate that more oxygenated functional groups are bonded to graphite
of the plane
basal ABG of 1010
thissample
sampleindicate that morethe
[22]. In addition, oxygenated
presence of functional
the moregroups
intense arepeakbonded
at 1262tocmgraphite
−1 in the
basal plane of this sample [22]. In addition, the presence of the more intense peak at 1262 cm −1 in the
spectrum of ABG 1010 sample, also indicates a higher contribution of oxygen due to epoxy rings (all
spectrum
ring bonds ofstretch
ABG 1010 andsample,
contractalso indicates
in phase). Thea peak
higheratcontribution
805 cm−1 is most of oxygen due to
likely due to the
epoxy rings (all
contribution
ring bonds stretch −1
of the same groupand contract in phase).
(asymmetrical The peak at[45].
ring stretching) 805 These
cm isdata mosthighlight
likely duethatto the
thecontribution
graphite with of
the same group (asymmetrical ring stretching) [45]. These data highlight that the
higher aspect ratio exhibits a lower amount of oxygen, as expected. In fact, since the oxygen is mostly graphite with higher
aspect ratio
attached to exhibits
the edges, a lower amountcontent
the relative of oxygen, asedges
of the expected. In fact,issince
vs. surface lowertheinoxygen is mostly
the graphite attached
with higher
to the edges,
aspect the relative
ratio. However, content
for of the edges
both graphites vs. surface
the presence is lower in the
of oxygenated graphite
groups, with
on the higher aspect
graphitic layers,
ratio.
makesHowever,
the graphitefor both
moregraphites the presence
hydrophilic, allowingofthe oxygenated
formationgroups, on the bonds
of hydrogen graphitic
withlayers, makes
oxygenated
the graphitegroups
functional more hydrophilic,
of the PVAallowing
polymerthe formation
(black line inofthe
hydrogen
range 3000bonds cmwith oxygenated
−1–3700 functional
cm−1 of Figure 4b)
groups of the PVA polymer (black line in the range 3000 cm −1 –3700 cm−1 of Figure 4b) [36,44,46].
[36,44,46].
Figure 4. FTIR spectra of the (a) fillers; (b) magnification of spectra of the fillers in the wavenumber
Figure 4. FTIR spectra of−1the (a) fillers; (b) magnification of spectra of the fillers in the wavenumber
range 2000 cm−1 –400 cm ; (c) film heaters.
range 2000 cm−1–400 cm−1; (c) film heaters.
3.4. Physical Analysis of the Film Heaters
3.4. Physical Analysis of the Film Heaters
Dynamic Mechanical Analysis (DMA) has been carried out to characterize the film heaters.
Dynamic
The results are Mechanical Analysis
shown in Figure 5a,b.(DMA) has been carried out to characterize the film heaters. The
results are shown in Figure 5a,b.Nanomaterials 2020, 10, 1343 8 of 16
Nanomaterials 2020, 10, x FOR PEER REVIEW 9 of 17
1000
a b
0.15
Storage Modulus
Tan δ (/)
0.10
(MPa)
100
0.05
ABG 1010 film heater ABG 1010 film heater
ABG 1045 film heater ABG 1045 film heater
10 0.00
-60 0 60 120 180 -60 0 60 120 180
Temperature (°C) Temperature (°C)
0.0
c d
100
-0.2
Heat flow (W/g)
80
Weight loss (%)
-0.4 60
-0.6 40
ABG 1010 filler
-0.8 20 ABG 1045 filler
ABG 1010 film heater ABG 1010 film heater
ABG 1045 film heater ABG 1045 film heater
-1.0 0
-60 0 60 120 180 240 0 200 400 600 800
Temperature (°C) Temperature (°C)
Figure 5.
Figure Physicalanalysis
5. Physical analysisof
ofthe
thefilm
filmheaters:
heaters:(a)
(a)storage
storagemodulus
modulusasas a function
a function of of
thethe temperature
temperature in
in the range−60 ◦ C ÷ 180 ◦ C; (b) tanδ as a function of the temperature in the range −60 ◦ C ÷ 180 ◦ C;
the range−60 °C ÷ 180 °C; (b) tanδ as a function of the temperature in the range −60 °C ÷ 180 °C; (c)
(c) Differential Scanning Calorimetry (DSC) curve of the film heaters in the temperature range −60 ◦ C ÷
Differential Scanning Calorimetry (DSC) curve of the film heaters in the temperature range −60 °C ÷
300 ◦ C; (d) thermogravimetric analysis of the fillers and film heaters.
300 °C; (d) thermogravimetric analysis of the fillers and film heaters.
The storage modulus (Figure 5a) progressively decreases up to 180 ◦ C. The change in shape of the
The storage modulus (Figure 5a)◦ progressively decreases up to 180 °C. The change in shape of
curve profile in the range between 20 C and 40 ◦ C is related to glass transition temperature (Tg ) of the
the curve profile in the range between 20 °C and 40 °C is related to glass transition temperature (Tg)
polymeric component of the film. A glass transition temperature (Tg ) value of ~30 ◦ C is confirmed
of the polymeric component of the film. A glass transition temperature (Tg) value of ~30 °C is
by the presence of a peak in the profile of tanδ (Figure 5b). Although the PVA is characterized by a
confirmed by the presence of a peak in the profile of tanδ (Figure 5b). Although the PVA◦ is
low glass transition temperature, both film heaters manifest higher storage modulua, even above 0 C.
characterized by a low glass transition temperature, both film heaters manifest higher storage
Differential Scanning Calorimetry (DSC) and Thermogravimetric Analyses have also been carried
modulua, even above 0 °C. Differential Scanning Calorimetry (DSC) and Thermogravimetric
out for the characterization of the thermal properties of the film heaters. The results are shown in
Analyses have also been carried out for the characterization of the thermal properties of the film
Figure 5c shows that the PVA component of the films melts in the temperature range between 200 ◦ C
heaters. The results are shown in Figure 5c shows that the PVA component of the films melts in the
and 235 ◦ C, where an endothermic peak centered around 224 ◦ C is observed. Figure 5d highlights
temperature range between 200 °C and 235 °C, where an endothermic peak centered around 224 °C
that, as expected, the film heaters degrade in a range of temperatures lower than the respective fillers.
is observed. Figure 5d highlights that, as expected, the film heaters degrade in a range of
In particular, ABG 1045 filler is characterized by greater thermal stability compared to the ABG 1010
temperatures lower than the respective ◦fillers. In particular, ABG 1045 filler is characterized by
filler, which can be quantified in about 30 C as shown by the shift of the mid-point (50% weight-loss
greater thermal stability◦ compared to the ABG 1010 filler, which can be quantified in about 30 °C as
temperature) from 840 C, for the ABG 1010 sample, to 870 ◦ C for ABG 1045. The higher stability
shown by the shift of the mid-point (50% weight-loss temperature) from 840 °C, for the ABG 1010
of ABG 1045 is also obtained for the film systems, where an increase in the midpoint of about 70 ◦ C
sample, to 870 °C for ABG 1045. The higher stability of ABG 1045 is also obtained for the film systems,
is observed. The onset-degradation temperature (5% weight-loss temperature) shifts from a value
where ◦an increase in the midpoint of about 70 °C is observed. The onset-degradation temperature
of 265 C for the ABG 1010 based system to a temperature value of 280 ◦ C for the ABG 1045 based
(5% weight-loss temperature) shifts from a value of 265°C ◦for the ABG 1010 based system to a
system, with a gain in terms of thermal stability of about 15 C. These results perfectly agree with
temperature value of 280 °C for the ABG 1045 based system, with a gain in terms of thermal stability
the FTIR results of Figure 4a, which highlights a higher concentration of oxygenating groups on the
of about 15 °C. These results perfectly agree with the FTIR results of Figure 4a, which highlights a
graphite ABG 1010 characterized by a lower aspect ratio. In any case, both the heating films are
higher concentration of oxygenating groups on the graphite ABG 1010 characterized by a lower
thermally stable up to 200 ◦ C. The electrical conductivity of graphene film heaters was measured using
aspect ratio. In any case, both the heating films are thermally stable up to 200 °C. The electrical
the four-wire technique. The values 3.0 × 10³ S/m and 4.7 × 10² S/m were obtained for ABG 1045
conductivity of graphene film heaters was measured using the four-wire technique. The values 3.0 ×
and ABG 1010 based systems, respectively. Although the two fillers appear almost similar in many
103 S/m and 4.7 × 10² S/m were obtained for ABG 1045 and ABG 1010 based systems, respectively.
aspects, the film heaters based on the different graphites differ in electrical conductivity by an order of
Although the two fillers appear almost similar in many aspects, the film heaters based on the different
magnitude. This is probably due to the different aspect ratio of the two fillers. In fact, the ABG 1045
graphites differ in electrical conductivity by an order of magnitude. This is probably due to the
filler is characterized by a greater degree of expansion with respect to ABG 1010 filler. This allows the
different aspect ratio of the two fillers. In fact, the ABG 1045 filler is characterized by a greater degree
formation of more efficient percolation pathways, which determine a greater electrical conductivity.
of expansion with respect to ABG 1010 filler. This allows the formation of more efficient percolation
In a previous work [22], a little (4% wt/wt) variation in the exfoliation degree of a 2D filler led to
pathways, which determine a greater electrical conductivity. In a previous work [22], a little (4%
a difference in electrical conductivity of about 12 orders of magnitude, for an amount of filler near
wt/wt) variation in the exfoliation degree of a 2D filler led to a difference in electrical conductivity of
about 12 orders of magnitude, for an amount of filler near the Electric Percolation Threshold (EPT)Nanomaterials 2020, 10, 1343 9 of 16
Nanomaterials 2020, 10, x FOR PEER REVIEW 10 of 17
of
thethe system.
Electric In this lastThreshold
Percolation case, the difference
(EPT) of the in electrical
system. In conductivity
this last case,canthe
be ascribed
difference to in
anelectrical
increase
in the expansion
conductivity can bedegree
ascribed of tothe
an starting
increase in filler. The difference
the expansion degreeinofelectrical
the startingconductivity is lower
filler. The difference
compared
in electricaltoconductivity
the previous is referenced
lower comparedcase, because in the film
to the previous heaterscase,
referenced herebecause
discussed, thefilm
in the amount of
heaters
the
herefiller is 60% the
discussed, by amount
weight, of therefore
the fillera is
filler
60%concentration far beyond
by weight, therefore theconcentration
a filler EPT. Debelakfar et beyond
al. [47]
highlighted that an
the EPT. Debelak etincrease in the granulometry
al. [47] highlighted and sizeinofthe
that an increase thegranulometry
graphite particles allows
and size a reduction
of the graphite
in the electrical
particles allows a resistance
reduction in intheanelectrical
epoxy resin-based
resistance insystem.
an epoxy Hence, the factor
resin-based system.thatHence,
influences the
the factor
electrical conductivity
that influences of the two
the electrical systems isofmost
conductivity likely
the two due to is
systems the characteristic
most likely duesizes
to theofcharacteristic
the graphitic
blocks.
sizes of The ABG 1045blocks.
the graphitic filler isThecharacterized
ABG 1045 filler by a is
size of the graphitic
characterized blocks
by a size larger
of the than the
graphitic ABGlarger
blocks 1010
filler,
than theas also
ABGevidenced
1010 filler,byasthe
alsodifferent
evidenced values of the
by the aspectvalues
different ratio. of the aspect ratio.
3.5. Electrical
3.5. Electrical Heating
Heating Behavior
Behavior (Constant
(Constant Current)
Current)
The electrical
The electricalheating
heatingbehavior
behavior of the two two
of the considered films was
considered filmsinvestigated by applying
was investigated different
by applying
constant current from 0.2 to 0.8 A. Two Cu foils strips, acting as electrodes, with
different constant current from 0.2 to 0.8 A. Two Cu foils strips, acting as electrodes, with a thickness a thickness of 80 mm
were adhered on both sides of film/paper, in order to apply a suitable electric
of 80 mm were adhered on both sides of film/paper, in order to apply a suitable electric current current density and hence
evaluateand
density the heating temperature
hence evaluate by the use
the heating of thermocouples
temperature by the use appositely placed on both
of thermocouples surfacesplaced
appositely of the
on both surfaces of the film heater. Figure 6a,b show the time dependent-temperature profiles ofABG
film heater. Figure 6a,b show the time dependent-temperature profiles of the two systems. The the
1010 film heater,
two systems. Thefor
ABGthe1010
samefilm
current value,
heater, allows
for the same faster heating
current value,and higher
allows values
faster of theand
heating maximum
higher
temperature
values of the than the ABG
maximum 1045 system.
temperature than the TheABG
maximum temperatures
1045 system. The maximum(Tmax ) of the two films,
temperatures (Tmaxat)
different constant currents, are shown in Figure
of the two films, at different constant currents, are shown 6c. The T values increase linearly with
max in Figure 6c. The Tmax values increase the applied
current, with
linearly but with differentcurrent,
the applied slopes. This different
but with detected
different slope
slopes. candifferent
This lead to incorrect
detected assessment
slope can lead of the
to
effectiveness of the two systems. For a proper evaluation on the comparison
incorrect assessment of the effectiveness of the two systems. For a proper evaluation on the between the different
systems, the between
comparison relationshipthebetween
differentthe appliedthe
systems, electric power and
relationship maximum
between temperature
the applied electricvalues
power should
and
be considered.
maximum The electric
temperature power,
values defined
should by the product
be considered. Theofelectric
the voltage
power, (V)defined
and the by current (I), P = VI,
the product of
is converted into heat by the Joule heating process. Figure 6d shows a linear
the voltage (V) and the current (I), P = VI, is converted into heat by the Joule heating process. Figure relationship between
theshows
6d electrica power and the maximum
linear relationship between temperature
the electricobtained,
power and in the
theelectric
maximum power range fromobtained,
temperature 0.5 W to
10 W. For
in the the same
electric power value
rangeof power,
from 0.5theWgraph
to 10 highlights
W. For thealmost
same valuethe same temperature
of power, values
the graph for both
highlights
systems. In light of the above considerations, the two systems can be
almost the same temperature values for both systems. In light of the above considerations, theconsidered equivalent and in
two
both cases,
systems a desired
can steady-state
be considered maximum
equivalent temperature
and can be acontrolled
in both cases, desired by adjusting the
steady-state applied
maximum
electric power.
temperature can be controlled by adjusting the applied electric power.
a 0.2 A 0.4 A
45
0.6 A 0.8 A
b
11.2 volt
80 4.2 volt
70 40
10.0 volt
Temperature (°C)
Temperature (°C)
60 35 3.6 volt
50
7.5 volt 30
3.1 volt
40
25
30 5.0 volt 2.5 volt
20 Film heater ABG1010 20 Film heater ABG1045
0 50 100 150 200 250 300 0 50 100 150 200 250 300
c Time (s) Time (s)
d
Film heater ABG 1010 Film heater ABG 1045
80
80
Temperature Max (°C)
Temperature Max (°C)
70
60 60
50
40
40
20 30
20
0
0.0 0.2 0.4 0.6 0.8 1.0 0 2 4 6 8 10
Current (A) Power (W)
Figure 6.
Figure Temperature–time plots
6. Temperature–time plots at
at different
different applied
applied current
current for
for (a) the ABG
(a) the ABG 1010
1010 film
film heater;
heater; (b)
(b) the
the
ABG 1045
ABG 1045 film
film heater;
heater; (c)
(c) TTmax vs. applied current of the film heaters at room temperature; (d) T max vs.
max vs. applied current of the film heaters at room temperature; (d) Tmax
vs.
applied power of the film heaters at room temperature.
applied power of the film heaters at room temperature.
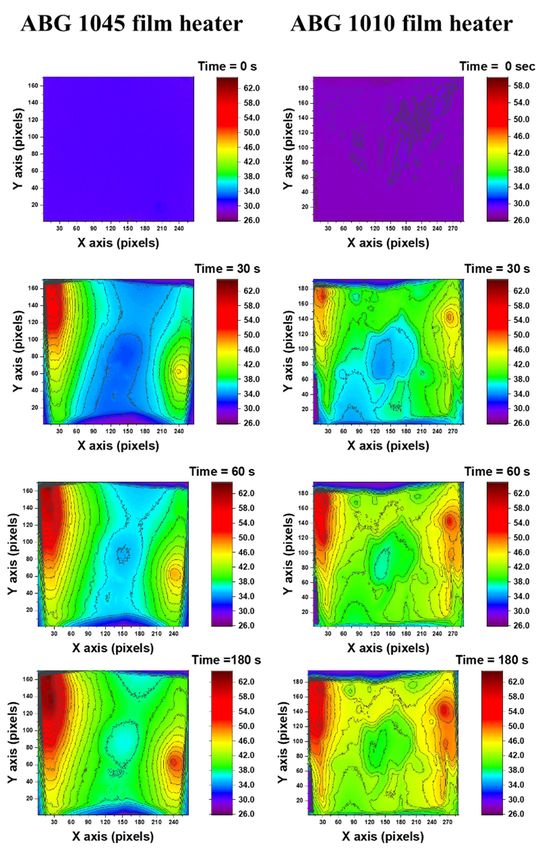
To better understand the heat generation and heat transfer process, an infrared camera was used
to observe the performance of both systems. In particular, in Figure 7, the temperature mapping of
the film heaters (dimensions 0.2 × 7.5 × 5 cm3 ) vs. time during heating has been monitored applying
the same constant power of 2 W. The samples were positioned vertically, keeping the two film facesNanomaterials 2020, 10, 1343 10 of 16
isolated from the contact state with other corps, allowing to have the same boundary conditions on
both faces of the film exposed to the air. The pictures were taken at different times in order to evaluate
the evolution of the heating process on the surfaces of the films. In particular, the investigation has been
performed in the commencement of heating (initial step, and after 30 and 60 s) and in the steady-state
condition, which is reached after 180 s of heating. In both systems, the hottest zones are those where
the copper contacts are located. The greater electrical conductivity of the copper contact, with respect
to the heater film, determines a more effective local heating. In this way, a temperature gradient is
created between the edges zones (next to the copper contacts) of the sample and the central part.
For this reason, a further heating phenomenon is obtained besides that obtained by the Joule effect.
The images of Figure 7 show that the ABG 1045 based system is characterized by a surface temperature
distribution more homogeneous compared with the ABG 1010 system. The uniformity is visible in
the central area of the film, which acquires the same color tone at a longer time. The ABG 1010 based
sample, unlike the ABG 1045 film heater, presents discontinuities in the color also in the central zone of
the sample even after 180 s. In order to highlight this aspect, an analysis of the average temperature in
the central area of the two samples analyzed was carried out. Figure 8 shows the thermal image of11the
Nanomaterials 2020, 10, x FOR PEER REVIEW of 17
ABG 1010 and ABG 1045 systems, after 180 s while an electrical power of 2 W is applied.
Figure 7. Thermal images of the two film surfaces at different times (initial step, after 30 s, 60 s and
Figure
180 s).7. Thermal images of the two film surfaces at different times (initial step, after 30 s, 60 s and
180 s).
To better understand the heat generation and heat transfer process, an infrared camera was used
to observe the performance of both systems. In particular, in Figure 7, the temperature mapping of
the film heaters (dimensions 0.2 × 7.5 × 5 cm3) vs. time during heating has been monitored applyingNanomaterials 2020, 10, x FOR PEER REVIEW 12 of 17
temperature in the central area of the two samples analyzed was carried out. Figure 8 shows the
Nanomaterials
thermal image 10, the
2020, of 1343ABG 11 of
1010 and ABG 1045 systems, after 180 s while an electrical power of 2W 16
is applied.
Time =180 s a ABG 1045 system b
160
62.0
24
140 58.0 21
Frequency (%)
Y axis (pixels)
120 54.0 18
50.0
100
15
46.0
80
42.0 12
60
38.0 9
40
34.0
6
20 30.0
3
26.0
30 60 90 120 150 180 210 240
0
X axis (pixels) 35 36 37 38 39 40 41 42 43 44
Temperature (°C)
Time = 180 s c 15 ABG 1010 system d
180 62.0
12
Frequency (%)
160 58.0
Y axis (pixels)
140 54.0
120 50.0 9
100 46.0
80 42.0 6
60 38.0
40 34.0 3
20 30.0
26.0 0
30 60 90 120 150 180 210 240 270 39 40 41 42 43 44 45
X axis (pixels) Temperature (°C)
Figure 8. (a) Thermal images on the film surface of the ABG 1045 film heater; (b) surface temperature
distribution
Figure 8. (a)of the ABG
Thermal 1045 film
images heater;
on the (c) Thermal
film surface images
of the on the
ABG 1045 film
film surface
heater; (b)ofsurface
the ABG 1010 film
temperature
heater; (d) surface
distribution of the temperature
ABG 1045 filmdistribution
heater; (c)of the ABG
Thermal 1010 film
images heater.
on the film surface of the ABG 1010 film
heater; (d) surface temperature distribution of the ABG 1010 film heater.
The distribution of the temperature values, detected considering the pixels in the region delimited
by theTheblack square line,
distribution ofisthe
shown in the Figure
temperature 8b,d.detected
values, Although the average
considering temperature
the pixels in thevalues are
region
quite similar (about 38 ◦ C for the ABG 1045 system and about 41 ◦ C for the ABG 1010 system), the two
delimited by the black square line, is shown in the Figure 8b,d. Although the average temperature
systems
values arediffer in the
quite temperature
similar (about 38 distribution
°C for thevalue.
ABG In1045fact, the ABG
system and1045 system
about 41 °Cpresents
for theaABG
narrower
1010
distribution temperature and the central region of the film (Figure 8a) with a more
system), the two systems differ in the temperature distribution value. In fact, the ABG 1045 system homogeneous color
tone witharespect
presents narrowerto the ABG 1010 system
distribution (see Figure
temperature and the8c).central
Bearing in mind
region thatfilm
of the the energy
(Figuresupplied
8a) withtoa
the
moretwo systems is the
homogeneous same
color tone(2 with
W) and that to
respect thethe
dimensions
ABG 1010 of the samples
system are similar,
(see Figure the different
8c). Bearing in mind
heating conduction along the surface probably is due to the different interconnection
that the energy supplied to the two systems is the same (2 W) and that the dimensions of the samples between the
adjacent graphitic
are similar, sheets, in
the different the PVA
heating matrix. This
conduction alonginterconnection is a function
the surface probably is due of the structure
to the of
different
the fillers, which present different size and aspect ratio, as described above in the
interconnection between the adjacent graphitic sheets, in the PVA matrix. This interconnection is a morphological and
structural
function ofanalysis.
the structure of the fillers, which present different size and aspect ratio, as described above
in the
3.6. morphological
Electrical and structural
Heating Behavior analysis.
(Constant Voltage)
The last electrical
3.6. Electrical heating(Constant
Heating Behavior analysis was carried out by applying different constant voltages from
Voltage)
3.5 V to 6.0 V, at the environmental temperature of −20 ◦ C. This investigation allows evaluating the
The last electrical heating analysis was carried out by applying different constant voltages from
applicability of the heater systems, considering the capacity of the generators on-board the aircraft
3.5 V to 6.0 V, at the environmental temperature of −20°C. This investigation allows evaluating the
and the large areas affected by the icing phenomenon. The onboard generators supply an alternating
applicability of the heater systems, considering the capacity of the generators on-board the aircraft
voltage of 115/230 V (similar to that of a domestic electrical appliance) while the onboard control
and the large areas affected by the icing phenomenon. The onboard generators supply an alternating
units require a direct voltage of 28 V (comparable to that available in a car). A converter reduces
voltage of 115/230 V (similar to that of a domestic electrical appliance) while the onboard control
the alternating voltage of the 115/230-volt generators to achieve an alternating voltage of 28 V, and a
units require a direct voltage of 28 V (comparable to that available in a car). A converter reduces the
transformer/rectifier then rectifies that to a 28 V direct voltage [48–50]. Figure 9a,b show the trend of
alternating voltage of the 115/230-volt generators to achieve an alternating voltage of 28 V, and a
the temperature versus time of the film heaters ABG 1010 and ABG 1045, respectively.
transformer/rectifier then rectifies that to a 28 V direct voltage [48–50]. Figure 9a,b show the trend of
the temperature versus time of the film heaters ABG 1010 and ABG 1045, respectively.Nanomaterials 2020, 10, 1343 12 of 16
Nanomaterials 2020, 10, x FOR PEER REVIEW 13 of 17
3.5 V 4.0 V 4.5 V 5.0 V 5.5 V 6.0 V
0
Film heater ABG1010
a 40
Film heater ABG1045
b
30
Temperature (°C)
Temperature (°C)
-5
20
-10 10
0
-15 -10
-20
-20
0 250 500 750 1000 0 250 500 750 1000
Time (s)
40
Time (s)
Film heater ABG1010 c 1600 Film heater ABG1010
d
Heat flux density (W/m2)
Temperature max (°C)
30 Film heater ABG1045
1400 Film heater ABG1045
20 1200
1000
10 800
0 600
400
-10
200
-20 0
3.0 3.5 4.0 4.5 5.0 5.5 6.0 6.5 3.5 4.0 4.5 5.0 5.5 6.0
Voltage (volt) Voltage (volt)
Figure 9. Temperature–time plots at −20 ◦ C at different voltage for (a) the ABG 1010 film heater; (b) the
Figure 9. Temperature–time plots at −20 °C at different voltage for (a) the ABG 1010 film heater; (b)
ABG 1045 film heater; (c) Tmax vs. applied voltage of the film heaters at −20 ◦ C; (d) Tmax vs. applied
the ABG 1045 film heater; (c) Tmax vs. applied voltage of the film heaters at −20 °C; (d) Tmax vs. applied
power of the film heaters at −20 ◦ C.
power of the film heaters at −20 °C.
The ABG 1045 based system reaches maximum temperatures higher than those of the ABG 1010
The ABG 1045 based system reaches maximum temperatures higher than those of the ABG 1010
based system (Figure 9c) for the same voltage value. The latter system, in the considered range voltage,
based system (Figure 9c) for the same voltage value. The latter system, in the considered range
does not reach the temperatures required for de-icing (T > 0 ◦ C). On the contrary, the ABG 1045
voltage, does not reach the temperatures required for de-icing (T > 0 °C). On the contrary, the ABG
based system, having a higher electrical conductivity, allows for the same applied voltage (Figure 9c)
1045 based system, having a higher electrical conductivity, allows for the same applied voltage
to supply sufficient power to achieve de-icing. The heat flux density detected for ABG 1045 film
(Figure 9c) to supply sufficient power to achieve de-icing. The heat flux density detected for ABG
heater, for all the voltage values able to give de-icing, and displayed in Figure 9d, is lower than those
1045 film heater, for all the voltage values able to give de-icing, and displayed in Figure 9d, is lower
required for example for a Boeing 787, which needs values of heat flux densities from 14 KW/m2 to
than those required for example for a Boeing 787, which needs values of heat flux densities from 14
34 KW/m2 ) [10]. On the bases of this consideration, a comparison of the energy consumption between a
KW/m2 to 34 KW/m2) [10]. On the bases of this consideration, a comparison of the energy
classical heating de-icing technology and the developed film heater can be performed. In fact, a silicone
consumption between a classical heating de-icing technology and the developed film heater can be
rubber wire heater [51] needs 23250 W/m2 to raise the surface temperature from −0.5 ◦ C to 34.4 ◦ C in
performed. In fact, a silicone rubber wire heater [51] needs 23250 W/m2 to raise the surface
90 s. The use of a rubber wire heater to heat an area equal to that of the samples obtained in this study,
temperature from −0.5 °C to 34.4 °C in 90 s. The use of a rubber wire heater to heat an area equal to
would need about 94 W. The use of 6 V with the ABG 1045 system would allow reaching, in about 90
that of the samples obtained in this study, would need about 94 W. The use of 6 V with the ABG 1045
s, the temperature of 25 ◦ C, starting from an environment temperature significantly lower than 0 ◦ C
system would allow reaching, in about 90 s, the temperature of 25 °C, starting from an environment
(−20 ◦ C) with a power equal to 6 W. Film heaters similar to those here described are developed in the
temperature significantly lower than 0 °C (−20 °C) with a power equal to 6 W. Film heaters similar to
literature, but pay little attention to technological parameters such as the suitable voltage on-board the
those here described are developed in the literature, but pay little attention to technological
aircraft and/or car. Yan et al. [52] proposed a composed bilayer film of multi wall carbon nanotubes
parameters such as the suitable voltage on-board the aircraft and/or car. Yan et al. [52] proposed a
(MWCNT) and polydimethylsiloxane which can reach temperatures up to 200 ◦ C considering voltage
composed bilayer film of multi wall carbon nanotubes (MWCNT) and polydimethylsiloxane which
values up to 100 V. In particular, temperatures similar to those obtained in this work (80 ◦ C), in the same
can reach temperatures up to 200 °C considering voltage values up to 100 V. In particular,
boundary conditions (room temperature) were obtained with a voltage of about 60–70 V. In another
temperatures similar to those obtained in this work (80 °C), in the same boundary conditions (room
study, resins loaded with graphene nanoplatelets have been proposed as self-heating coatings of
temperature) were obtained with a voltage of about 60–70 V. In another study, resins loaded with
composite materials [53]. The low concentrations of conductive used fillers allow good de-icing
graphene nanoplatelets have been proposed as self-heating coatings of composite materials [53]. The
performance only with applied voltages of about 700–800 V. In this work, the detected performance
low concentrations of conductive used fillers allow good de-icing performance only with applied
highlights that the obtained film heater can be a valid alternative to known resistance heating pad
voltages of about 700–800 V. In this work, the detected performance highlights that the obtained film
thermal systems as silicone rubber wire heaters and different other film heaters proposed in literature.
heater can be a valid alternative to known resistance heating pad thermal systems as silicone rubber
wire heaters and different other film heaters proposed in literature. Further de-icing tests wereYou can also read


