MONGOLIA DIGITAL WATER PLATFORM: DEVELOPMENT OF A GROUNDWATER MONITORING PORTAL USING DISRUPTIVE TECHNOLOGY - 2030 Water Resources Group
←
→
Page content transcription
If your browser does not render page correctly, please read the page content below
MONGOLIA April 2021

DIGITAL WATER PLATFORM: DEVELOPMENT
OF A GROUNDWATER MONITORING PORTAL
USING DISRUPTIVE TECHNOLOGY
Digital Water Platform: Development of groundwater monitoring portal using disruptive technology

DISCLIAMER
This work is a product of 2030 WRG with external contributions. The findings, interpretations,
and conclusions expressed in this work do not necessarily reflect the views of the World Bank,
its Board of Executive Directors, or the governments they represent. The World Bank does not
guarantee the accuracy of the data included in this work. The boundaries, colors,
denominations, and other information shown on any map in this work do not imply any
judgment on the part of the World Bank concerning the legal status of any territory or the
endorsement or acceptance of such boundaries.

This report has been reviewed and accepted by the 2030 WRG Mongolian Multi-Stakeholder
Platform.

 2
Digital Water Platform: Development of groundwater monitoring portal using disruptive technology ©2021 ׀2030 Water Resources Group World Bank Country Office 14241, Seoul street 4, MCS plaza Ulaanbaatar city, Mongolia 14241 Phone: +976 70078235 Web: www.2030wrg.org Email: ddechinlkhundev@worldbank.org obazargochoo@worldbank.org Prepared and Edited by: Munkhtsetseg Zorigt National Consultant, 2030 Water Resources Group, World Bank Saulyegul Avlyush, PhD Mongolia Partnerships Coordinator, 2030 Water Resources Group Contributed by: Mahesh Patankar Senior Advisor, Disruptive Technologies, 2030 Water Resources Group Odbayar Bazargochoo Mongolia Partnerships Coordinator, 2030 Water Resources Group BlobCity Inc. KPM LLC Led and Managed by: Dorjsuren D, PhD Mongolia Country Coordinator, 2030 Water Resources Group Rochi Khemka Global Partnerships Coordinator, 2030 Water Resources Group 3
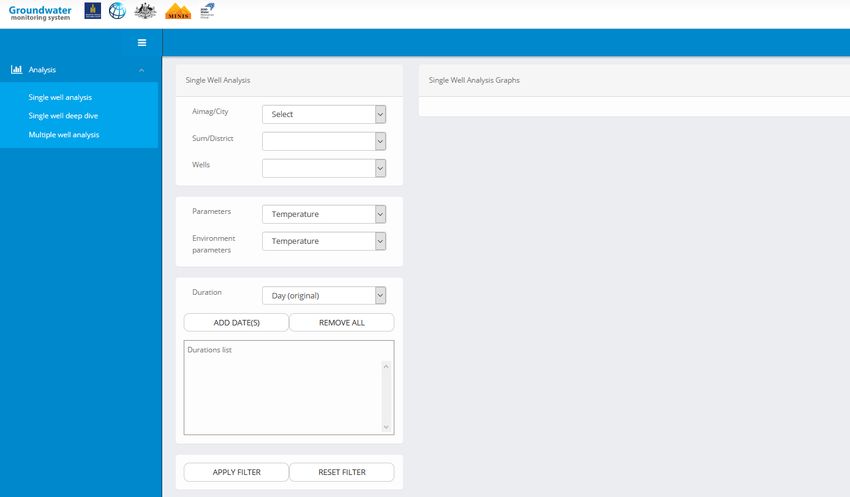
Digital Water Platform: Development of groundwater monitoring portal using disruptive technology

 Contents
1. Introduction ....................................................................................................................................................... 9
2. Use of disruptive technologies in groundwater management in Mongolia.......................... 10
 2.1. Background ......................................................................................................................................... 10
 2.2. Objectives of the project ................................................................................................................ 10
 2.3. Stakeholder engagement ............................................................................................................... 11
3. Background on the groundwater monitoring system in Mongolia .......................................... 12
 3.1. Groundwater monitoring network (www.groundwater.mn) ........................................ 12
 3.2. Monitoring parameters and data frequency ......................................................................... 14
 3.2.1. Groundwater level and its measurement...................................................................... 14
 3.2.2. Water quality data .................................................................................................................. 15
 3.2.3. Climate and water consumption data............................................................................. 15
 3.3. Brief analysis of current situation of GW in Mongolia....................................................... 16
 3.3.1. South Gobi region.................................................................................................................... 16
 3.3.2. Tuul river basin........................................................................................................................ 20
 3.4. Analysis for groundwater data management and recommendations for further
 development ......................................................................................................................................................... 23
 3.4.1. Data collection .......................................................................................................................... 24
 3.4.2. Data quality evaluation......................................................................................................... 26
 3.4.3. Data storage .............................................................................................................................. 26
 3.4.4. Data processing........................................................................................................................ 28
 3.4.5. Data reporting and presentation ...................................................................................... 28
4. Development of the groundwater dashboard (www.iucn.blobcity.com) ............................. 29
 4.1. Process description of the groundwater dashboard development.............................. 29
 4.2. Statistical methods and disruptive technology used for the dashboard ................... 30
 4.2.1. Anomaly detection.................................................................................................................. 30
 4.2.2. Methods of prediction analysis ......................................................................................... 30
 4.2.3. Performance of the predictive analysis ......................................................................... 32
 4.3. Components of the dashboard .................................................................................................... 38
 4.3.1. Single well analysis ................................................................................................................ 38
 4.3.2. Single well analysis deep dive ........................................................................................... 39
 4.3.3. Multiple well analysis ............................................................................................................ 40
 4.3.4. Anomaly detection.................................................................................................................. 40
 4.3.5. Prediction analysis ................................................................................................................. 41
 4.3.6. Dashboard filters..................................................................................................................... 41

 4
Digital Water Platform: Development of groundwater monitoring portal using disruptive technology

 4.3.7. User management ................................................................................................................... 42
 4.3.8. Data upload................................................................................................................................ 43
 4.3.9. Upload climate data ............................................................................................................... 43
5. Converting current groundwater monitoring network to the portal
(www.groundwater.mn)........................................................................................................................................ 44
 5.1. Process description of upgrading existing monitoring network .................................. 44
 5.2. Data entries to the portal .............................................................................................................. 44
 5.3.1. Uploading climate data into the dashboard ................................................................. 44
 5.3.2. Uploading water consumption data ................................................................................ 45
 5.3.3. Prediction model ..................................................................................................................... 45
 5.3.4. User management ................................................................................................................... 45
 5.4. Upgraded structure of the monitoring portal ....................................................................... 48
 5.5. User management............................................................................................................................. 49
 5.5.1. “Admin” users ........................................................................................................................... 49
 5.5.2. “RBAs” users.............................................................................................................................. 49
 5.5.3. “Guest” users ............................................................................................................................. 49
 5.6. Dashboard menus ............................................................................................................................. 50
6. Conclusions ..................................................................................................................................................... 52
7. Recommendations........................................................................................................................................ 53
8. References ....................................................................................................................................................... 55

 5
Digital Water Platform: Development of groundwater monitoring portal using disruptive technology

List of tables
Table 1. GW aquifers and monitoring boreholes of the provinces of Mongolia.............................. 13
Table 2. Information of the monitoring boreholes in the South Gobi region................................... 17
Table 3. Trends of the GW level at the monitoring boreholes in the South Gobi regions ........... 18
Table 4. GW monitoring boreholes in the Tuul river basin ..................................................................... 21
Table 5. Trend analysis for the monitoring boreholes with consistent data between 2015-
2020 in the Tuul river basin ................................................................................................................................. 22
Table 6. Accuracy of the results of the groundwater level prediction model .................................. 33
Table 7. Predicted values of the groundwater level of the 12 wells in the Tuul river basin ..... 38
Table 8. Meteorological data format for uploading to the dashboard ................................................ 43
Table 9. Brief analysis of key stakeholders .................................................................................................... 46
Table 10. Recommendations on groundwater monitoring objectives and sustainable
operation of the portal............................................................................................................................................ 53

 6
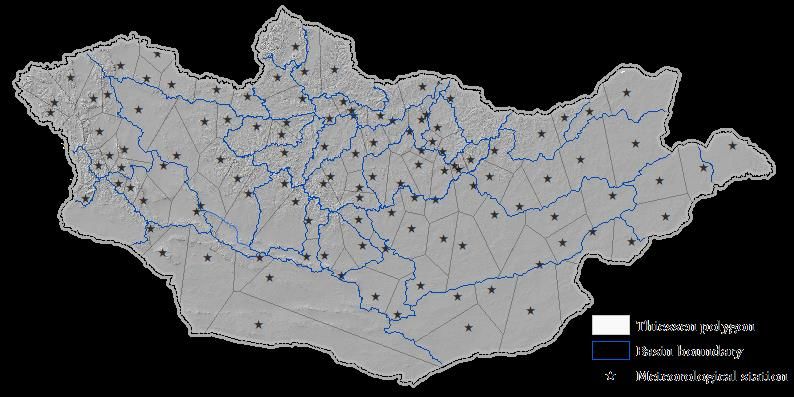
Digital Water Platform: Development of groundwater monitoring portal using disruptive technology

List of figures
Figure 1. Groundwater monitoring network of Mongolia ....................................................................... 13
Figure 2. General overview of GW level measurements ........................................................................... 15
Figure 3. GW monitoring boreholes used for the analysis....................................................................... 16
Figure 4. Inconsistency of the groundwater level of well 52 in the Galba Uush Dolood Gobi
basin ............................................................................................................................................................................... 17
Figure 5. Groundwater level variations of the monitoring wells in the South Gobi region ....... 18
Figure 6. Inconsistency of the groundwater level of Well 13 in the Tuul river basin .................. 21
Figure 7. Groundwater level variations of the monitoring wells in the Tuul river basin ........... 22
Figure 8. Data management.................................................................................................................................. 24
Figure 9. Erroneous data records ...................................................................................................................... 25
Figure 10. Anomaly detection.............................................................................................................................. 30
Figure 11. Data consistency of the groundwater prediction analysis................................................. 33
Figure 12. Actual and predicted ground water level until May 2021 for 12 wells ........................ 37
Figure 13. Dashboard structure.......................................................................................................................... 38
Figure 14. Appearance of the Single well analysis menu ......................................................................... 39
Figure 15. Appearance of the Single well deep dive menu ...................................................................... 39
Figure 16. Appearance of the Multi well analysis menu ........................................................................... 40
Figure 17. Appearance of the Anomaly detection menu .......................................................................... 40
Figure 18. Appearance of the Prediction menu ............................................................................................ 41
Figure 19. Dashboard menu of the User management .............................................................................. 42
Figure 20. Dashboard menu of Team settings .............................................................................................. 43
Figure 21. Thiessen polygons of Mongolia based on meteorological stations ................................ 44
Figure 22. Prediction code on the Python in the Jupyter Notebook .................................................... 45
Figure 23. User management of the Mongolian groundwater dashboard ........................................ 48
Figure 24. Main menu of the portal ................................................................................................................... 48
Figure 25. Appearance of the dashboard menu for the Public users .................................................. 50
Figure 26. Single well analysis section............................................................................................................. 50
Figure 27. Single well deep dive analysis section........................................................................................ 51
Figure 28. Multiple well analysis section ........................................................................................................ 51

 7
Digital Water Platform: Development of groundwater monitoring portal using disruptive technology

Abbreviations
AUGWB - Altai Uvur Gobi Water Basin
EICIMH - Environmental Information Center, Institute of Meteorology and Hydrology
GW – Groundwater
GUDGWB - Galba Uush Doloodiin Gobi Water Basin
GDP – Gross Domestic Production
IТ – Information technology
LLC - Limited Liability Company
MET– Ministry of Environment and Tourism
МL – Machine Learning
NAMEM - National Agency of Meteorology and the Environment Monitoring
RBA – River Basin Authority
RI – Republic of India
UGGKhWB - Umard Gobiin Guveet Khalkh Water Basin
WB – World Bank
WRG – Water Resources Group

 8
Digital Water Platform: Development of groundwater monitoring portal using disruptive technology

 1. Introduction
Groundwater is the primary source of water supply in Mongolia and accounts for
approximately 82% of water use. As such, monitoring and assessing groundwater resources is
essential for policy and decision making, compliance assessments, the use of preemptive
measures for groundwater exploration, and protection of the resource.

Nonetheless, water demand in Mongolia has steadily increased due to population growth and
economic development in Ulaanbaatar city, and mining activity in the Southern Gobi region. To
ensure groundwater is managed properly requires timely and accurate data capturing,
information dissemination, and stakeholder capacity building.

The Government of Mongolia requested 2030 WRG’s Mongolia team to support the
development of a groundwater monitoring portal using disruptive technologies for sustainable
groundwater management in the country. With the endorsement of 2030 WRG’s Multi-
Stakeholder Platform Steering Board in Mongolia, the team initiated this project in September
2019.

The project aimed to develop a new cutting edge digital portal and dashboard for groundwater
datasets using disruptive technologies. However, Mongolia suffered from a lack of
groundwater data due to data confidentiality and security issues. Thus, the project was
implemented as two sub-projects.

 (1) The primary project started with anonymized data sharing from selected river basins
 of Mongolia, with the densest and reliable data for data analysis. This resulted in the
 development of a new groundwater dashboard created by 2030 WRG, with the support
 of the Department of Groundwater Monitoring, Water Authority, and Ministry of
 Environment and Tourism of Mongolia. The team also created a model for predictions
 of groundwater levels using machine learning techniques and Artificial Intelligence
 (AI).

 (2) The second objective of the project was upgrading the dashboard of KPM LLC in
 Mongolia, using the prediction models developed under this project. The revamped
 portal under this project has allowed accurate monitoring and predictions of the
 current and future groundwater resources.

All the deliverables of the above projects were handed over to the key project partners, namely
Water Authority and Ministry of Environment and Tourism of Mongolia on March 15, 2021.

This report provides (a) a background assessment of the prevailing situation of groundwater
monitoring and data management in Mongolia, (b) the results and outcomes of the
development of a groundwater dashboard and portal, and conversion of the existing
groundwater monitoring system to the portal, and (c) recommendations for further
development of a digital water platform and groundwater data management in Mongolia. In
summary, the project has initiated and facilitated the development of a Groundwater
Management Centre for sustainable groundwater management using disruptive technology.

 9
Digital Water Platform: Development of groundwater monitoring portal using disruptive technology

2. Use of disruptive technologies in groundwater
 management in Mongolia

2.1. Background
Mongolia is susceptible to water stress and is projected to experience significant gaps in water
supply and demand in two economically significant areas: Ulaanbaatar, the capital city of
Mongolia, and the southern Gobi region, Mongolia’s mining hub. In view of Mongolia’s growing
population and prominent—but water-intensive—mining sector, Mongolia’s water demand is
expected to exceed supply capacity by the year 2021 (2030 WRG hydroeconomic analysis,
2014).

Total water resources of Mongolia are estimated at 564.8 million m3/year. The majority of the
water comes from surface water (98.1%), including glaciers, and only 1.9 % comes from
groundwater resources (MET, 2019). However, 82 percent of total water use was contributed
by groundwater resources. Moreover, water use increased 2.3 times between 2013 and 2016,
with close to 95 percent of such use permitted through groundwater resources (MET, 2017).
Another important issue is the use of water for the mining sector in the Southern Gobi region.
According to the 2018 Annual Report of MET, water use is maximum in the agriculture and
livestock sectors (305 million m3/year or 54% respectively) and mining contributing to 16%
(90 million m3/year). Amongst all the sectors, the mining sector is likely to increase its water
consumption, with a high level of gross domestic product (GDP) growth expected through
exports of minerals to other countries. As such, the mining water consumption, which is
dependent primarily on the non-renewable fossil water needs specific attention.

In this context, a good understanding of the water availability, particularly in the southern Gobi
region, is of prime importance. The current groundwater monitoring network in Mongolia has
a total of 273 monitoring boreholes and it will be extended with another 170 new boreholes in
2050, as documented in Mongolia’s long-term development policy vision document (Vision
2050). Therefore, 2030WRG initiated the groundwater portal and dashboard to create a
predictive analytical tool for groundwater availability using disruptive technology.

2.2. Objectives of the project
2030 WRG specified the following objectives in the application of disruptive technologies for
groundwater management in Mongolia:

• Assess the current level of groundwater through an IT-enabled platform using data from
 initial observation wells
• Suggest a robust data capture and transfer process to store and curate the data on a
 central server/ repository
• Explore correlations of groundwater levels with weather patterns, rainfall and other
 suitable independent variables
• Use machine learning tools to identify data anomalies and provide early warnings

 10
Digital Water Platform: Development of groundwater monitoring portal using disruptive technology

• Model the groundwater data with a select set of independent variables
• Disseminate learnings from Mongolia to other 2030 WRG multi-stakeholder platforms

2.3. Stakeholder engagement
This project was initiated with data collection through the officials of the Ministry of
Environment and Tourism and the Water Authority of Mongolia. An initial meeting was held
with Ministry officials, including the service provider, and former and current groundwater
monitoring experts, who shared the data from the previous groundwater monitoring phase.
Consequently, the meeting enabled the stakeholders to identify the rationale and needs for the
groundwater dashboard.

The discussion highlighted the need to create a general map of the groundwater portal, such
as data collection and user right of access, and to enable predictions of groundwater availability
through digital technology applications.

The project regularly engaged with stakeholders through 2030 WRG multi-stakeholder
platform in Mongolia, with the final deliverables endorsed through the platform’s Steering
Board and workstreams.

 11
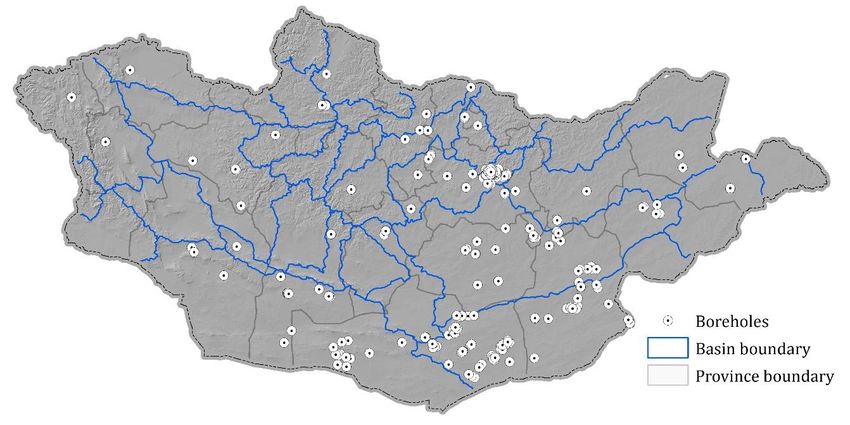
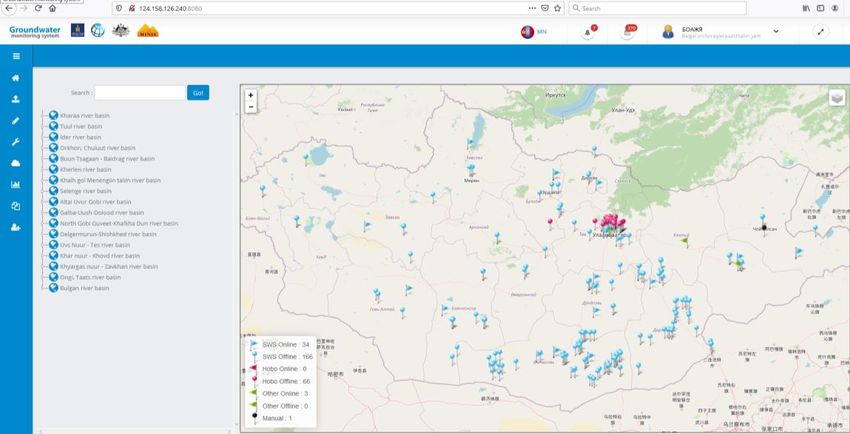
Digital Water Platform: Development of groundwater monitoring portal using disruptive technology

3. Background on the groundwater monitoring system in
 Mongolia
At the start of the project, there were three main digital groundwater databases in Mongolia:

(1) Environmental Information Center, National Agency of Meteorology and the Environment
Monitoring (NAMEM) contains some of the static data on the groundwater resource, generated
through the Integrated Water Resource Management project implemented by Ministry of
Environment and Tourism, and annual statistical data on groundwater resource and
consumption collected from provincial environmental departments and river basins –
www.eic.mn;
(2) Groundwater monitoring network portal, containing dynamic data, mainly collected by
dataloggers – www.groundwater.mn;
(3) Integrated water database in Kharaa River Basin, containing multiple types of data for
characterizing the Kharaa River Basin, and management of water resources within the basin.

Only the database of Environmental Information Center is open to the public, with the other
two databases limited by access restrictions, due to confidentiality and data security issues, as
open data licensing is not practised in Mongolia. However, dynamic groundwater data is
captured in the groundwater.mn portal, including data from 273 monitoring wells. Also, this
monitoring network is the main data source for the government, including the Water Authority,
river basin authorities and experts, and groundwater specialists. Hence, the monitoring
network provided the groundwater data for the project.

The purpose of this chapter is to review the groundwater monitoring network, from the
collection of data to the dissemination of results.

3.1. Groundwater monitoring network (www.groundwater.mn)

The groundwater monitoring network www.groundwater.mn compromises 273 wells (Figure
1) for observational and abstraction purposes. At the national level, monitoring potable water
supply is a high priority; thus, it is assumed that priority has been given to the potable water
supply wells. At the river basin scale, the territory of Mongolia is divided into 29 river basins.
Out of 29 river basins in Mongolia, ten river basins do not have monitoring points.

Among RBAs, Tuul River basin, Umard Gobiin Guveet Khalkh Water Basin (UGGKhWB), Galba-
Uush-Doloodiin Gobi Basin (GUDGWB), Altain Uvur Gobi Basin (AUGWB) have been covered
intensively with groundwater monitoring points, due to intensifying mining activities and
groundwater demand. There are 42 water aquifers that have been identified in the AUGWB
and GUDGWB, respectively. Approximately, more than 50 water aquifers have been identified
in the UGGKhWB. Aquifers belong to Gobi-Sumber, Dornogobi and Umnugobi provinces
generally have monitoring points.

 12
Digital Water Platform: Development of groundwater monitoring portal using disruptive technology

 Figure 1. Groundwater monitoring network of Mongolia

At the national level, the monitoring network has covered all the province centers in
Mongolia (Table 1).

 Table 1. GW aquifers and monitoring boreholes of the provinces of Mongolia

 GROUNDWATER NUMBER OF
 № PROVINCE AQUIFERS MONITORING WELLS
 1 ARKHANGAI 6 2
 2 BAYANKHONGOR 24 13
 3 BAYAN-ULGII 3 2
 4 BULGAN 9 4
 5 DARKHAN 2 3
 6 DORNOD 8 8
 7 DORNOGOBI 14 31
 8 DUNDGOBI 17 11
 9 GOBI-ALTAI 13 4
 10 GOBISUMBER 2 6
 11 KHENTII 7 7
 12 KHOVD 7 3
 13 KHUVSGUL 6 4
 14 ORKHON 2 2
 15 SELENGE 4 1
 16 SUKHBAATAR 10 8
 17 TUV 6 13
 18 ULAANBAATAR 14 73
 19 UMNUGOBI 25 68
 20 UVURKHANGAI 6 4
 21 UVS 5 1
 22 ZAVKHAN 4 5

 13
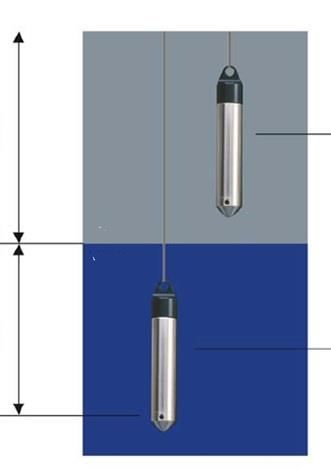
Digital Water Platform: Development of groundwater monitoring portal using disruptive technology

3.2. Monitoring parameters and data frequency
At present, the groundwater monitoring database is developed to contain the following types
of data:
 • Groundwater level, pressure, temperature, hardness, total dissolved solids and
 conductivity in time series;
 • Geological data, such as borehole logs as static one-time entry for some wells;
 • Hydrogeological data, such as depth to water surface, as static data;
 • Construction data, such as casing, piezometer, and borehole development photos, as
 static, one-time entry;
 • Type of equipment, such as pumping equipment and records, as static, one-time entry;
 • Geophysical data, including surface and borehole measurements, as static, one-time
 entry.

During the data collection process, it became clear that many of these wells have no known
construction information. Without such information, it becomes difficult to assess the spatial
and vertical monitoring coverage of hydrogeological units and groundwater zones. The
essential well log data and zones of completion for wells monitored in the RBAs should be
incorporated into the database. This information will be used in many of the data evaluations,
including zone-specific queries that have been designed and used to illustrate current
groundwater conditions.

The frequency of these data is hourly (2-4 hours) and measurements have been launched since
2014 for the monitoring wells.

 3.2.1. Groundwater level and its measurement
Conceptually, to measure groundwater level, the logger of the water pressure sensor is
installed in the wells. There are two main types of loggers installed for the groundwater
monitoring network of Mongolia, including Diver loggers of ‘Van Essen” for 166 wells, and
“Hobo” loggers of “Onset” installed for 66 monitoring wells. Depending on the type of
equipment, the logger measures the water pressure. Variation of the air pressure may influence
the measurements. It is recommended, therefore, to install barometer logger (Figure 2).

 14
Digital Water Platform: Development of groundwater monitoring portal using disruptive technology

 Air pressure ( )

 Water level
 Water pressure ( )

 +

 Source: Van Essen, 2009

 Figure 2. General overview of GW level measurements

The collected data from the loggers are recorded as absolute pressure. This means that the
pressure sensor not only measures the water pressure, but also the air pressure pushing on
the water surface. Thus, air pressure should be subtracted from the absolute pressure of water
to reduce the variation of the air pressure effect. Then water pressure can be converted into
water level related to the vertical reference datum.

 = ( + ) −

 3.2.2. Water quality data
Water quality data in the wells are variable and insufficient in the current monitoring network.
It should be noted that there is no mechanism to upload water quality data into the monitoring
network.

 3.2.3. Climate and water consumption data
Climate and groundwater abstraction are valuable information for groundwater monitoring
and assessment. The current monitoring network has no linkage to climate data. A few of the
well loggers were installed with precipitation loggers, but they are not operative. Similarly,
groundwater use is not linked to monitoring wells.

 15
Digital Water Platform: Development of groundwater monitoring portal using disruptive technology

3.3. Brief analysis of current situation of GW in Mongolia
We briefly analyzed data from 102 wells from the total 273 monitoring points in Mongolia
(Figure 3) for the two regions of South Gobi and Ulaanbaatar, where the highest density of
groundwater monitoring wells are located with the longest data records.

The monitoring points were located in the Gobi region at wells with depths ranging between
25-320 m. The depth of only one well was 24.8 m, depths of 29 wells were in the range of 33-
93.5 m, depths of 28 wells were in the range of 100-188 m, depths of 5 wells were in the range
of 204-243 m, and the depths of 3 wells were in the range of 290-320 m. The selected 44 wells
in the Southern Gobi region were in the deep zone up to 300 m below the ground. For the Tuul
river basin in the Ulaanbaatar area, a total of 84 monitoring well are registered in the network,
of which 16 are non-operative. Of these, 58 wells were selected in the shallow and intermediate
zone up to 88 m below the ground surface. The depths of 49 wells is in the range of 8-47 m and
depths of 19 wells is in the range of 60-88 m.

 Figure 3. GW monitoring boreholes used for the analysis

The groundwater data analysis conducted for the two selected regions is explained in the
following sections.

 3.3.1. South Gobi region

In the data analysis phase, the Umnugobi province has been selected due to the density of the
network of groundwater monitoring points. Four river basins, UGGKhWB, GUDGWB, AUGWB
and Ongi river basin are located in the Umnugobi province territory. Umnugobi province
monitors groundwater levels through an extensive network of 67 monitoring points that
belong to GUDGWB and AUGWB. Only 44 of them were usable for this analysis (Table 2). The
number of monitoring points with information for about 4 years (2015-2019) were 44, with
19 of them were newly established in 2018-2019, approximately. Dataloggers of four
monitoring points seemed to have stopped functioning.

The network monitoring points have been classified to the extent possible by zone of
completion and location within a subbasin. Monitoring points in the network include: no
monitoring points in the shallow zone, 23 monitoring points in the intermediate zone, and 21
monitoring points in the deep zone, ranging between 24-320 m depth, of the selected 44 wells.
The median depth was 101.7 m, which is selected as a delineating border between

 16
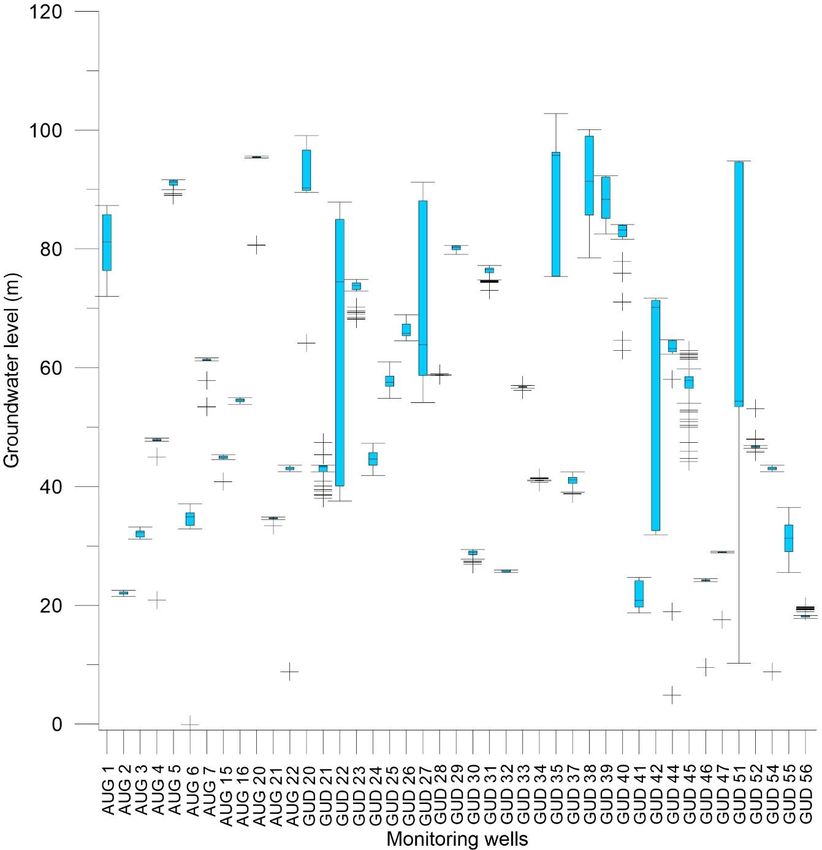
Digital Water Platform: Development of groundwater monitoring portal using disruptive technology

intermediate and deep zones. The depths of the first and second quartiles were 60.3 m and
132.5 m, respectively. 2030 WRG did some analysis on existing data gathered since 2015 for
South Gobi Area and the results are shown below.
In Umnugobi province, a total of 39 aquifers have been identified, consisting of 21 aquifers
belong to Altai Uvur Gobi Water Basin and 18 aquifers belong to Galba Uush Doloodiin Gobi
Water Basin. Based on hydrogeologic maps and mining license maps, a pattern of monitoring
points emerged. In addition to monitoring points of potable water supply for soum or province
centers, monitoring points have mostly utilized existing wells along with known groundwater
aquifers, which have been surveyed largely for mining exploration.

 Table 2. Information of the monitoring boreholes in the South Gobi region

 Well location Total number of Number of wells Installed Online Active online
 wells selected new wells wells
 Tsogttsetsii 12 6 6 -
 Khankhongor 7 3 4 -
 Bayan-Ovoo 10 5 5 2 2
 Khanbogd 19 16 1 3 2
 Nomgon 2 1
 Noyon 1 1
 Khankhongor 2 - 2 2 2
 Bayandalai 2 2 1 1
 Gurvantes 12 10 1
 Total 67 44 19 8 7

Data for more than 70% of the selected wells are incomplete and inconsistent. For instance,
Figure 4 shows the there is incomplete historical data for well 52 (namely GUD 52) with a gap
for the period June 2018 to August 2019 (Figure 4).
 54
 Groundwater level (m)

 52

 50

 48

 46

 44

 42
 4/2017

 8/2018
 8/2015

 2/2016
 4/2016
 6/2016
 8/2016

 2/2017

 6/2017
 8/2017

 2/2018
 4/2018
 6/2018

 2/2019
 4/2019
 6/2019
 8/2019
 10/2015
 12/2015

 10/2016
 12/2016

 10/2017
 12/2017

 10/2018
 12/2018

 10/2019
 12/2019

 Date

Figure 4. Inconsistency of the groundwater level of well 52 in the Galba Uush Dolood Gobi basin

The boxplots of the water level of the wells show that variations of the water level are low.
However, there are still certain anomalies present (Figure 5).

 17
Digital Water Platform: Development of groundwater monitoring portal using disruptive technology

 Figure 5. Groundwater level variations of the monitoring wells in the South Gobi region

Trend analysis for the groundwater levels of the monitoring wells in the Umnugobi province is
illustrated in Table 3. Three monitoring wells are located near soum centers, four wells are
located within the influence zone of a mining license area and the rest of the wells are in areas
with little anthropogenic impact. Two monitoring wells are in the influence zone of soums and
have a constant decreasing trend. The wells located in the influence zone of a mining license
have an increasing trend until 2017 and a decreasing trend since 2017, plotting a downward
parabola. The details have been discussed below (Table 3).

 Table 3. Trends of the GW level at the monitoring boreholes in the South Gobi regions

 Well location Monitoring well Groundwater level Groundwater Linkage with
 description trend description level trend precipitation and
 other factors

 18
Digital Water Platform: Development of groundwater monitoring portal using disruptive technology

Noyon There is only one The trend of No impact -
 monitoring well groundwater level is a consistent with the
 (100.1 m) at constant increase by general trend of
 deep zone. It can 11.1 m between 2015- precipitation of this
 be said that the 2019. period.
 monitoring well
 is located in
 natural settings
 with minimal
 anthropogenic
 effect.
Sumber-Ovoot There are two The trend of Seasonal
 wells at groundwater level is a fluctuation of
 intermediate constant decrease by intermediate
 level (50.3 0.28-0.70 m between groundwater
 m) and one 2015-2018, and an monitoring wells
 monitoring well increase by 0.02-0.42 followed by
 at deep (100.6 m in 2019 compared seasonal
 m) zones. It can to 2018. The deep fluctuation of the
 be said that the monitoring well has a precipitation trend,
 well is located in similar pattern of a but the general
 the natural zone decrease by 1.36 m trend has been
 with minimal between 2015-2018 different.
 anthropogenic and an increase by The precipitation
 effect. 0.16 m in 2019. did not affect the
 deep well based on
 this snapshot of
 data.
Nariin Sukhait There are three Except for one The trend could
 monitoring wells monitoring well, two have been more
 at shallow wells at intermediate likely to be
 (33.6 m) and one shallow wells and on influenced by
 monitoring well deep well have a trend mining activities
 at deep (70.5 of water level increase rather than
 m) zones. All of by 0.15-0.95 m precipitation
 the wells are between 2015-2017 trends.
 located in or and decrease by 0.25-
 near the mining 1.17 m in 2017-2019.
 license area. One monitoring well
 has a constant
 increase of 3.2 m in
 2019.
Tooriin shand Two monitoring The trend of change in The precipitation
 wells at deep the groundwater level might have
 (101.5 m) zone is a decrease of 0.68- influenced the
 are located in 0.93 m between 2015- seasonal
 natural settings. 2019. groundwater level
 fluctuations, yet it
 needs further

 19
Digital Water Platform: Development of groundwater monitoring portal using disruptive technology

 studying. The
 general trend in
 groundwater level
 does not match the
 precipitation trend
 pattern in
 Gurvantes soum.
 Gurvan tes One monitoring The trend of the No sign of effect of
 well at deep groundwater level is a precipitation.
 (101.7 m) zone decrease of 1.49 m. It
 is located in the should be noted that
 influence zone of the datalogger level
 the soum center. and groundwater level
 do not match closely.
 Bayandalai One monitoring Due to the lack of The groundwater
 well at sufficient data in level at
 intermediate 2017, and a total lack intermediate
 (40.7 m) and one of data in 2018, it is monitoring well
 well at deep impossible to say has shown a
 (86.6 m) zones anything about seasonal
 are located next the trend in the deep fluctuation with an
 to the soum well monitoring point. almost half year
 center. In addition, it should lagged behind
 be noted that the precipitation.
 datalogger Compared with
 level in deep well and only precipitation
 groundwater level in data, it can be said
 deep well is not that there is
 exactly matched. The anthropogenic
 intermediate impact besides of
 monitoring well point precipitation
 has a groundwater variation pattern.
 level trend of decrease
 by 0.31 m between
 2015-2019, if one day
 data on Aug-18, 2019
 is excluded.

 3.3.2. Tuul river basin
Tuul river basin is the most crowded basin of Mongolia with the capital city, Ulaanbaatar,
located in the basin, hosting over half the national population. The basin area covers 15,059
km2 with a length of 1.2-4 km. The water supply for Ulaanbaatar is provided by groundwater
from 10 wellfields in the alluvial, diluvial and proluvial deposits (Dorjsuren et al 2015). There
are 84 monitoring points in the Tuul river basin, of which only 58 were accessible during the
project. These monitoring points are located in the shallow (0-50 m) and deep zone (>50 m).
The median depth was 30 m. The depths of the first and third quartiles were 22.9 m and 45 m,
respectively. In this report, 58 wells in Ulaanbaatar in the Tuul river basin were selected and
analyzed for groundwater level data between the period of 2015 and 2020 (Table 4).

 20
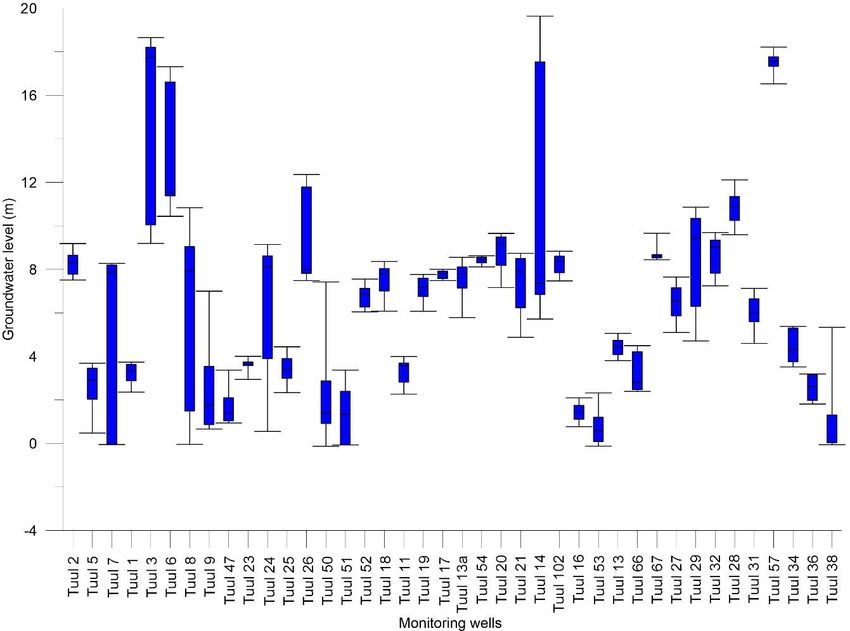
Digital Water Platform: Development of groundwater monitoring portal using disruptive technology

 Table 4. GW monitoring boreholes in the Tuul river basin

 Wellfields Total number of Operative Non Wells with online
 monitoring wells operative logger
 Deed 12 8 4 2

 Tuv 15 15 - 1
 Gachuurt 8 6 2 1
 Makh Kombinat 3 3 -
 Uildver 10 9 1 1
 Nisekh 3 3 - 1
 Yarmag 4 3 1 1
 Uliastai valley 4 2 2 1
 Others 25 14
 Total 84 74 10 8

Data for more than 71% of the selected wells is incomplete and inconsistent. For instance,
Figure 6 shows there is incomplete historical data for well 13 (namely Tuul 13) with a gap for
the period September 2016 to May 2017 and since June 2019.

 6

 5
 Groundwater level (m)

 4

 3

 2

 1

 0
 Dec-14

 Aug-15

 Aug-16

 Aug-18
 Apr-15
 Jun-15

 Dec-15

 Dec-16

 Aug-17

 Dec-17
 Oct-15

 Apr-16
 Jun-16

 Oct-16

 Apr-17
 Jun-17

 Oct-17

 Apr-18
 Jun-18

 Dec-18
 Oct-18

 Apr-19
 Jun-19
 Feb-15

 Feb-16

 Feb-17

 Feb-18

 Feb-19

 Date

 Figure 6. Inconsistency of the groundwater level of Well 13 in the Tuul river basin

Boxplots of the groundwater level show higher variations but with fewer outliers than the
South Gobi region (Figure 7).

 21
Digital Water Platform: Development of groundwater monitoring portal using disruptive technology

 Figure 7. Groundwater level variations of the monitoring wells in the Tuul river basin

Groundwater level data is captured for 12 wells with data ranging from January 2015 to June
2020. The result of the trend analysis shows that most of the wells have seasonal fluctuations
and are weakly correlated with precipitation (Table 5).

Table 5. Trend analysis for the monitoring boreholes with consistent data between 2015-2020
 in the Tuul river basin

 Wells location Monitoring well Groundwater Groundwater Linkage with
 description level trend level trend precipitation and
 description other factors
 Deed One monitoring The trend of No sign of effect of
 well is in the Groundwater precipitation.
 shallow zone (38 level has
 m) under the increased
 anthropogenic between 2017-
 impact. 2018, and
 decreased in
 2019.

 Tuv 6 wells are located There is a There is a weak
 in this wellfield constant trend correlation
 14.5-29 m from for the 2 wells between

 22
Digital Water Platform: Development of groundwater monitoring portal using disruptive technology

 the ground (12,20), but groundwater levels
 surface. Three of third well (13) and precipitation
 them are under the has decreased by and 6 wells have
 natural condition 0.2 m. seasonal
 and rest are under fluctuation.
 the anthropogenic
 impact.
 Gachuurt Total of 3 Base on No sign of effect of
 monitoring wells groundwater precipitation.
 are located in the level data
 shallow zone (20- between 2015-
 50 m) under the 2020, one well’s
 anthropogenic water level has
 impact. decreased and
 two wells are
 constant.

 Uildver Two monitoring One well's No sign of effect of
 wells are located in groundwater precipitation, but
 the shallow zone level has seasonal variations
 under the decreased noted.
 anthropogenic between 2015-
 impact. 2017 and
 increased over
 2018-2020.
 Another well’s
 water level has
 fluctuated
 seasonally since
 2018.

3.4. Analysis for groundwater data management and
 recommendations for further development
To achieve the objective of the groundwater monitoring portal, additional tools such as data
input, initial processing, validation, reporting and visualization are needed. From a broad
perspective, every process involving data can be a part of data management. Hence, the data
management model adapted from Data Documentation Initiative (Thomas et al. 2009) and as
defined by Fitch, P. et al. (2016) is depicted in Figure 8, showing how each step can been applied
to groundwater data management.

 23
Digital Water Platform: Development of groundwater monitoring portal using disruptive technology

 Source: Thomas (2009)

 Figure 8. Data management

 • Define study: Define objectives and data requirements to initiate data management.
 Depending on the objective, types of data, accuracy, interval could be defined in more
 detail.
 • Data collection: Collecting data as per objectives and requirements as mentioned in the
 previous step.
 • Data processing and validation: Data is preprocessed into appropriate resolutions and
 formats such that it is suitable for further steps along with quality assurance and
 validations.
 • Data archiving: Data is archived in either a central place or distributed places with a
 possibility to data exchange.
 • Data distribution: Either publicly or user-controlled access can be implemented.
 • Data discovery: User can answer a question with the help of data.
 • Do study: Depending on whether the user achieved a goal or not in this stage, further
 development ideas or subsequent repurposing data can arise.
 • Followed by above-mentioned concept, data management analysis and a set of
 recommendations have been produced in the next subsections.

 3.4.1. Data collection
Data collection in Mongolia is a multi-faceted issue, characterized by institutional, legal,
cultural, and technical dimensions. Technical issues are easier to identify and correctable. The
common technical issues are:
 - Groundwater measurements are made incorrectly in the field, such as erroneous
 reading of level gauges;
 - Field technician fails to calibrate gauges or dataloggers;
 - The data collector does not perform a data quality evaluation;
 - Errors are introduced into the data as it is imported into whatever method is being
 used for its storage. Typical errors include transcription errors through manually
 inputting data and unit conversion errors or decimal mis-conversion or entering;
 - Erroneous data is recorded due to datalogger glitch or malfunction;
 - Testing data is included in the data recordings.

 24
Digital Water Platform: Development of groundwater monitoring portal using disruptive technology

Several of the above mentioned issues have been identified in the groundwater
monitoring network collected through dataloggers. Through brief analyses, the
dominance of the issues has been identified (Figure 9).
 - Data recordings have been stopped
 - Erroneous data have been recorded
 - Datalogger recorded data during downloading data process
 - Testing data is included in the data recordings

 Data recordings have been
 stopped
 11%
 Erroneous data have been
 39% recorded
 22%
 Datalogger recorded data
 during downloading data
 process
 Testing data is included in the
 28% data recordings

 Figure 9. Erroneous data records

It should be noted that (1) the source of the issues was not always clear, and the erroneous
data could have been introduced through a combination of more than one reason, and (2)
certain issues cannot be identified unless there is a written document on standard operating
procedure and logs.

Another important issue to be noted is the possibility of sensor depth change during data
collection and the logger relaunching process. On several occasions, suspicious changes have
been observed in groundwater level time series data without any apparent reason. It could be
either substantial abstraction over a period, or change in logger depth. Yet, it was indiscernible
due to lack of abstraction data. The most common issue was the termination of recordings of a
parameter, which is mainly groundwater hardness data. The second common issue was the
records of erroneous data, mostly due to glitches in the dataloggers. However, it is easily
amendable either manually or automatically. Third common issue which could be also easily
amendable is records of data during data downloading and logger relaunching process. Again,
the erroneous data can be easily discerned from the general pattern of data and amended via
manual or automated processes. Finally, the test data also can be easily discerned based on
technician’s logs and easily amendable via manual data processing.

For instances, a total of 46 errors have been noted in the groundwater time-series data of 44
monitoring points in the South Gobi region. The ubiquity of the errors in the database strongly

 25
Digital Water Platform: Development of groundwater monitoring portal using disruptive technology

indicates that appropriate data handing and data validation should be in place. In other words,
the data collector does not perform a data quality evaluation.

 3.4.2. Data quality evaluation

Primary validation: This type of validation may be performed by visual inspection of the data
and is intended to catch errors. Some examples in the case of groundwater level data are:
 • A recorded depth to water that is greater than the depth of the well;
 • Errors due to a change in the height of the measuring point;
 • Errors due to assigning the groundwater level recordings to the wrong well or
 screen due to careless labeling while entering a file.

Secondary validation: The purpose of this step is to determine whether the selected values
are errors or natural extremes. Simple statistical methods are available to check whether
apparently erroneous values are statically likely.

Examples of validation steps for groundwater level measurements:
 • Contour maps of groundwater level data for a certain period or date can be used to
 identify outliers. Outliers show up as a high levels of contours around the location of
 the concerned well. The values causing the supposed discrepancies in the regional
 contour map should be checked.
 • Preparing time series graphs with multiple hydrographs and the visual inspection
 of the graphs may show erroneous measurements. Comparing hydrographs would
 normally show similar trends and fluctuations, and if not, may indicate erroneous
 groundwater level measurements.
 • Some simple statistical methods are available to check groundwater level
 measurements e.g. deviation from the mean or the median. Data series can be
 checked for values which differ more than three times the standard deviation from
 the mean or median.

The groundwater database has manual and automated data correction capacities. The
automated data correction capacity is based on moving average technique. In general, it would
be desirable to have more than one technique available for selection for automated error
correction.

Tertiary validation: Tertiary validation involves advanced techniques for analysis and
validation of spatial and temporal data. This includes, for instance, advanced statistics and
comparison of different data types. Advanced statistical methods can be used for detection of
outliers. Parametric and non-parametric statistical trend detection techniques have been
developed for time series to provide most likely estimates of the water level changes over time
and the corresponding confidence interval.

 3.4.3. Data storage

 26
Digital Water Platform: Development of groundwater monitoring portal using disruptive technology

At present, no historical data has been entered or stored into the groundwater database. Yet, it
is advisable to adapt a consistent Electronic Data Format (EDF) or other standards, such as
those of the Open Geospatial Consortium (OGC), the International Organization for
Standardization (ISO) and World Meteorological Organization (WMO). Inconsistencies may
require alignment of the data at five levels: systems, syntax, structure, semantics and
pragmatics. At present, the only minor issue is the deployment time of the dataloggers, which
have not been consistent. Mostly, dataloggers have an option to start at a specified date/time
in the future and those options can be utilized in order to solve this type of issue.

It is advisable to have meta-data corresponding to the data anticipated in the future. There is a
significant international adoption of the ISO/TC2116 standards. Most of the data are available
from RBAs. However, the groundwater monitoring database lacks majority of the above-
mentioned data. Ideally, all of the information listed above should be stored electronically and
in a central repository. However, storing the above data in a digital database requires a major
effort, which may not be feasible in the first phase of groundwater assessment. In the case of
limited budget, it is recommended to give high priority to electronic storage of groundwater
variables.

Unless the data is collected by a sole collector, and handled, processed, and stored by the same
person, the best practice is to have standard operating procedures (SOP), which is a manual
describing the protocols for collecting and handling data in the field and in the office/lab
settings. It ensures uniformity, consistency, and completeness of data sets. The SOP will enable
technical personnel to understand and replicate the work at hand and force them to conduct
complete and thorough surveys. SOPs should be established at the outset of an investigation to
establish that work has been conducted to a consistent and scientifically defensible standard.

The SOP needs to contain several elements: 1. Step-by-step guidelines, and 2. Field notes (e.g.
date/time of datalogger data collection and re-launching, or battery replacement etc.). In
addition to enforcing the collection of specific data elements, the data repository (database or
GIS) should contain mandatory fields that match those on the field data collection sheets. By
enforcing the mandatory nature of these fields, the data cannot be saved into the system, unless
they are completed. Other basic steps to maintain the integrity of the data include taking
succinct and clear field notes and permanently archiving them. SOP is essential for quality
assurance.

 27
Digital Water Platform: Development of groundwater monitoring portal using disruptive technology

 3.4.4. Data processing
The processing of data should allow for interpretation of the groundwater resource.
Examples of the type of data processing that would be applied to the database include the
following:
 - Common ways of presenting groundwater level data by means of contour maps
 (spatial image) or hydrographs (time series).
 - Water level elevation with respect to a reference level, usually mean sea level
 - Single date or average value over a period.
 - Care should be taken that only measurements from the same time or period and same
 hydrostratigraphic unit are used; otherwise misleading results will be obtained.
 - Provide a means of relating the impact of natural and human influences to the
 groundwater resource.
 - Plot precipitation on the secondary axis to provide a visual observation of the
 response of the groundwater resource to this event.
 - Abstraction rates can also be helpful when interpreting groundwater hydrographs
 due to potential anthropogenic influence on the environment.

 3.4.5. Data reporting and presentation
The current groundwater monitoring network has a wide range of functionality in terms of
generating data reports, including:
 - Graphical representations of data, comparing several parameters of one monitoring
 point for the selected timeframe
 - Graphical representations of data, comparing several monitoring points for the
 selected parameter for the selected timeframe
 - One-time well construction report
 - Data input report
 - Log of user access etc.

 28
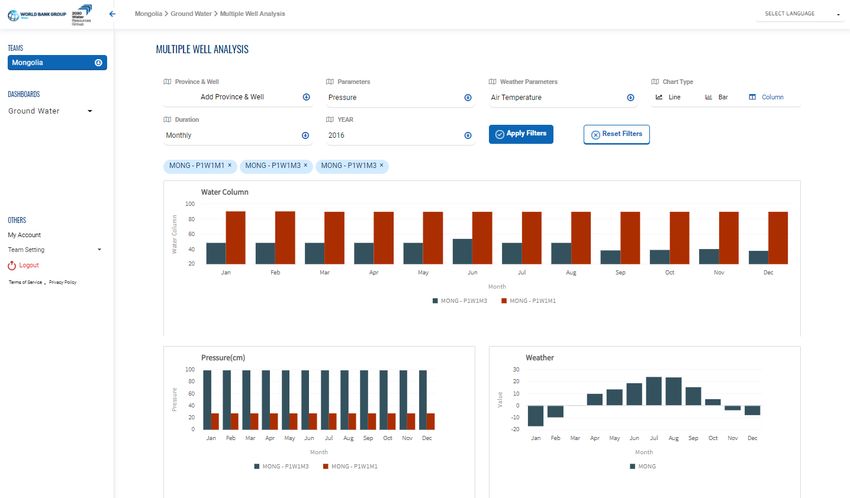
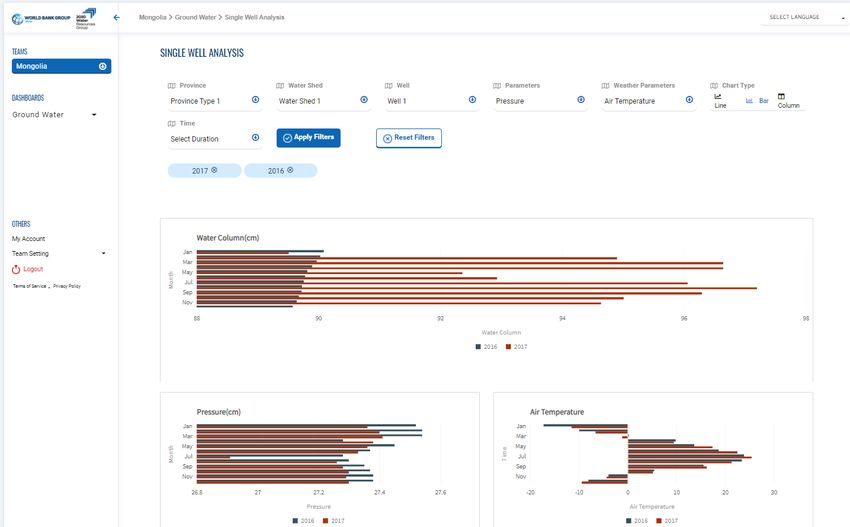
Digital Water Platform: Development of groundwater monitoring portal using disruptive technology

4. Development of the groundwater dashboard
 (www.iucn.blobcity.com)
 4.1. Process description of the groundwater dashboard
 development
Visualizing the groundwater monitoring data and managing it from a web-based portal or
dashboard is valuable and timely information for stakeholders. Based on the analysis of the
existing groundwater monitoring system described in the previous chapters, the 2030 WRG
team identified a need to develop a groundwater dashboard for a graphical illustration of
groundwater and related data. Moreover, current monitoring wells will be extended by about
170 new boreholes in 2050 towards Mongolia’s long-term development policy vision 2050,
with machine learning applied for predictions. In order to achieve this objective, two main
issues needed to be addressed:

 • The first one was sharing the location of wells. The location of the wells is currently
 not shareable and is kept confidential according to Article 13.1.5. of the Law on State
 and official secrets of Mongolia.

To solve this problem, the project collaborated with government officials and the Water
Authority, and agreed to share anonymized data. The coordinates of the location of the
monitoring wells were not shared with the project partners and members. Only the time-series
of groundwater data was anonymized and coded for use.

 • Secondly, the project could not be implemented for all 273 wells at the national level
 due to legal issues and data availability. As such, priority basins for the dashboard and
 prediction analysis needed to be selected.

Through agreement with the Water Authority, the project selected two regions, namely Tuul
river basin and South Gobi region.

A new dashboard was developed by 2030 WRG with the support of BlobCity Inc. for the
groundwater monitoring of Mongolia. The first step was building the data management
concept to a new dashboard based on a review of the current groundwater monitoring
network. The next step was to design and develop the dashboard with five sections including
(1) Single well analysis, (2) Single well deep dive, (3) Multiple well analysis, (4) Anomaly
detection and (5) Prediction.

The next step was to upload groundwater metrics to the dashboard. A total of 44 wells’ metrics
were taken from the monitoring network www.groundwater.mn. The selected metrics of data
recorded on the monitoring wells included: groundwater pressure, temperature, conductivity
and pH. In addition, climate metrics like air temperature, precipitation and wind speed from
the closest station were gathered. All data for period from 2014 to 2019 is covered and
uploaded to the dashboard. Users can see the plots of groundwater metrics for the selected
time duration.

 29
You can also read