Variable source regions of Denmark Strait and Faroe Bank Channel overflow waters
←
→
Page content transcription
If your browser does not render page correctly, please read the page content below

SERIES A
                                                                                                                                          DYNAMIC
                                                                                                                                          METEOROLOGY
                                                                                                                                          AND OCEANOGRAPHY
               P U B L I S H E D B Y T H E I N T E R N AT I O N A L M E T E O R O L O G I C A L I N S T I T U T E I N S T O C K H O L M

Tellus (2010), 62A, 551–568
                                                                                                                                                         C 2010 The Author
                                                                                                                                                         Journal compilation
                                                                                                                                                                             C 2010 Blackwell Munksgaard
Printed in Singapore. All rights reserved
                                                                                                                                                                           TELLUS

   Variable source regions of Denmark Strait and Faroe
              Bank Channel overflow waters
By A R M IN K Ö H L ∗ ,                             Institut für Meereskunde, Zentrum für Meeres- und Klimaforschung, Universität Hamburg,
                                                                         20146 Hamburg, Germany
                                                                 (Manuscript received 5 August 2009; in final form 23 March 2010)

                                                                          ABSTRACT
                  The pathways of the water that overflows the Greenland–Scotland Ridge and their source regions are studied with an
                  ocean circulation model. Depending on the size of wind stress curl around Iceland, different water mass properties
                  are found in the less dense fraction of the overflows on both sides of Iceland. Although in both cases, this fraction
                  contributes to only a small part of the overflow, their pathways and associated source regions characterize also changes in
                  the pathways of the denser fractions which is confirmed by backward float experiments. In detail, large Denmark Strait
                  overflow during high wind stress curl conditions is associated with a primary pathway along the East Greenland Current
                  with one branch encircling the Greenland Sea that is supplied by regions further southward while the other branch
                  enters through Fram Strait. During low forcing conditions, the source region shifts into the Iceland Sea associated with
                  a reversal of a current north of Iceland. The Faroe Bank Channel overflow is primarily fed by sources in the Norwegian
                  Sea with water flowing southward along the Norwegian shelf. A smaller contribution that is enhanced during high
                  forcing follows along the Jan Mayen Ridge and provides water from the Iceland Sea and the Greenland Sea.

                                                                                                                                   Ridge. See Fig. 1 for a location of the topographic features in
1. Introduction
                                                                                                                                   the Nordic Seas. Reduced convection in the Greenland Sea, a
The Nordic Seas are characterized by large water mass transfor-                                                                    decreasing overflow through FSC (Hansen et al., 2001), and
mation due to air–sea interaction and the large property con-                                                                      the freshening throughout the overflows (Dickson et al., 2002)
trast of the inflowing water masses: from the south, warm                                                                          have been related to the recently described slowing of the At-
and saline Atlantic Water that crosses the Greenland-Iceland-                                                                      lantic meridional overturning circulation (Bryden et al., 2005).
Scotland Ridge follows north-eastward within the Norwegian                                                                         In this context, Quadfasel and Käse (2007) reported no notice-
Atlantic Current and enters the Arctic Ocean. As the water is                                                                      able trends of the overflow transports during the last decade
modified along its path, the southward inflow from the Arctic                                                                      while variability of the composition has been observed. Along
Ocean through Fram Strait is cold and fresh, and flows along                                                                       this line, Tanhua et al. (2005) suggest that the overflow might
the east coast of Greenland; cyclonic circulations within the                                                                      be a robust feature with the ability to switch between different
subbasins characterize the interior flow.                                                                                          sources.
   The prominent location of the Nordic Seas between the North                                                                        Model simulations indicate the DS and Faroe Bank Channel
Atlantic and the Arctic Ocean causes this area to be one of the                                                                    (FBC) overflow variability to be in antiphase (Köhl et al., 2007b;
most important controlling regions for changes in the Arctic                                                                       Serra et al., 2010). Over the period 1992–2003, the high resolu-
Ocean and North Atlantic while it appears to be also largely                                                                       tion model simulation of Köhl et al. (2007b) shows in agreement
affected by circulation changes in these adjacent seas. The wa-                                                                    with Biastoch et al. (2003) larger transports through DS from
ter exported via the two main overflow branches through the                                                                        1997 to 2000 during high wind stress curl forcing and larger
Denmark Strait (DS) and the Faroe-Shetland Channel (FSC)                                                                           transports through FBC after 2001 during low forcing. Changes
forms the lower branch of the North Atlantic Deep Water and                                                                        of the DS overflow were attributed by Köhl et al. (2007b) to
influences the circulation and water mass properties in the North                                                                  changes of the wind stress curl around Iceland and reservoir
Atlantic (Schmitz and McCartney, 1993; Dickson and Brown,                                                                          height changes upstream of the sill. The latter were suggested
1994). An additional smaller part flows over the Iceland-Faroe                                                                     to be due to circulation changes north of the Greenland Ice-
                                                                                                                                   land Scotland Ridge which was investigated in further detail by
  ∗ Corresponding author.                                                                                                          Käse et al. (2009) with a series of idealized experiments. Vari-
e-mail: armin.koehl@zmaw.de                                                                                                        able Fram Strait export, local convection or basin wind stress
DOI: 10.1111/j.1600-0870.2010.00454.x                                                                                              changes were described to lead to changes in the pathways of

Tellus 62A (2010), 4                                                                                                                                                                                551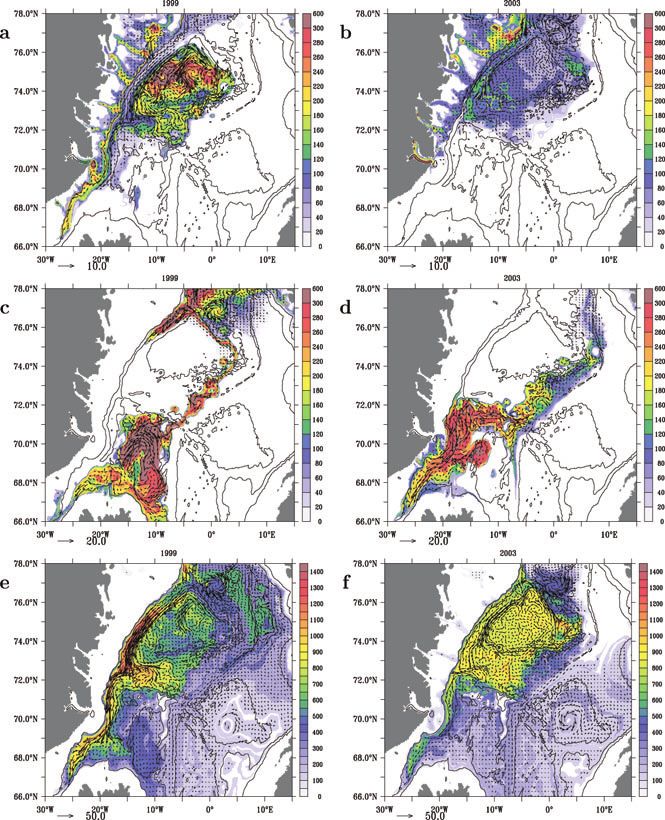
552                                                                  A . K Ö H L

                                                                                               FS

                                                                                 GS
                                                                JMF
                                                                       Z                    MR

                                                                                                     LB
                                                                IS

                                                                           JMR
                                                                                     NB
                                  DS
                                               Iceland

                                                                                                        low curlτ(NAO )
                                                                                                                      +
                                                                                  FSC                   high curlτ(NAO )

Fig. 1. Schematic of the Nordic Seas with the circulation of water emphasizing different contributing to the overflows during high and low wind
stress curl around Iceland that is related to high and low NAO, respectively. The coloured shaded areas indicate larger pools of water that potentially
contributes to the overflows. The four major basins are the Lofoten Basin (LB) and the Norwegian Basin (NB) in the east and the Greenland Sea and
the Iceland Sea (IS) in the west separated by the Mohn Ridge (MR) which continues to the south as Jan Mayen Ridge (JMR). Dashed lines indicate
pathways of overflow water mass types that contribute only indirectly (e.g. through enhancing reservoirs) to the overflows.

dense water in the Nordic Seas. Serra et al. (2010) demonstrate                  explains changing water masses at FSC and the changes of asso-
that a large fraction of the wind stress curl variability in the                 ciated upstream pathways. In Section 5, adjoint sensitivities are
Nordic Seas is related to the NAO and that a relation of the                     used to describe the relation between the overflows at DS and
NAO to the DS overflow follows from this. This relation is less                  FBC and how upstream density signals affect both overflows.
clear during certain periods particularly after the mid 1990s. Al-               We finish with concluding remarks in Section 6.
though measurement-based Denmark Strait overflow estimates
by Macrander et al. (2005) and Dickson et al. (2008) suggest
                                                                                 2. Methodology
a slightly later maximum during the period 1999–2000, the ob-
served FBC transport variability reported by Olsen et al. (2008)                 As the previous study by Käse et al. (2009), the analysis is based
is in good agreement with the simulated variability by Köhl et al.              on the model results of Köhl et al. (2007b) who also describe
(2007b), confirming large FBC transports after 2001.                             the model setup in greater detail. The numerical model was
    In the following, we will follow along this line but investigate             set up for the region of the Nordic Seas including the western
in greater detail where the source regions of the overflows are,                 subpolar Atlantic from 51◦ N to 78◦ N and from 46◦ W to 17◦ E.
how water overflowing the Greenland Iceland Scotland Ridge                       It is nested into the global 1◦ global synthesis of Köhl et al.
propagates towards the sill, and how the source regions and                      (2007a). The grid is horizontally isotropic with a zonal reso-
pathways change with forcing changing from high to low wind                      lution of 1/10◦ and has 30 levels in the vertical. Coefficients
forcing conditions. As explained in detail later, the study is based             of biharmonic horizontal diffusion and viscosity vary spatially
to a large extent on the simulation over the period 1992–2004                    with the cube of the horizontal grid spacing and have equatorial
described by Köhl et al. (2007b). One should keep in mind that                  values of 1010 m4 s−1 . After starting from rest and climatologi-
this simulation has some shortcomings concerning a missing                       cal Levitus and Boyer (1994), Levitus et al. (1994) temperature
spinup, the length of the run and the boundary conditions that                   and salinity in 1992, the simulation was forced over the period
are provided by a global synthesis. After a brief presentation of                1992–2004 by the daily atmospheric state obtained from the
the simulation and methodological aspects, Section 3 describes                   NCEP/NCAR reanalysis project using bulk formula according
changing water masses at the DS and the changes of associ-                       to Large and Yaeger (2004). Vertical mixing is parameterized
ated upstream pathways of these water masses. Section 4 then                     by the K-profile parametrization (KPP) scheme of Large et al.

                                                                                                                                 Tellus 62A (2010), 4
VA R I A B L E S O U R C E R E G I O N S O F D E N M A R K S T R A I T A N D FA RO E BA N K C H A N N E L OV E R F L OW WAT E R S    553

(1994) and a dynamic/thermodynamic sea ice model of Zhang             (2007b), which was related to upstream circulation changes due
and Rothrock (2000) is applied. For adjoint sensitivity stud-         to changing forcing conditions by Köhl et al. (2007b) and Käse
ies, a low-resolution twin version of this configuration was set      et al. (2009), it seems reasonable to try to investigate the associ-
up which has an isotropic horizontal resolution of 1/4◦ with          ated changes in water mass properties in this model simulation.
equatorial values of 4 × 10¹¹ m4 s−1 for horizontal diffusion and     Although the simulation of water mass properties including their
viscosity. Both models were based on the MITgcm code that is          spreading, particularly downstream of the overflows, is accord-
designed to allow the construction of the adjoint by the auto-        ing to Willebrand et al. (2001) among the weakest capabilities
matic differentiation tool TAF (Transformation of Algorithms          of present-day ocean models, their work also suggests that wa-
in Fortran) (Giering and Kaminski, 1998) which was used to            ter mass properties are adjusting relatively slowly. Although,
generate the adjoint model. As in Hoteit et al. (2005), we use        the above-mentioned shortcomings of the Köhl et al. (2007b)
larger viscosities in the adjoint to prevent it from developing un-   simulation, for example the lack of spinup and the short inte-
stable modes. To this end, an additional viscosity of 104 m2 s−1      gration time, promised to be an advantage since the background
was employed in the adjoint model. Backward float trajecto-           ocean state remains relatively close to the climatology, a fur-
ries were calculated offline based on linearly interpolated 3-day     ther investigation revealed that water masses, for example in the
snapshots of the three-dimensional velocities from the high-          East Greenland Current, are also not correctly represented in
resolution model output.                                              the climatology. The model state is therefore biased from the
                                                                      beginning, a fact that has to be taken into consideration when
                                                                      comparing to observed water mass characteristics.
3. Changing water masses and pathways
                                                                          For different years, Fig. 2 shows TS-diagrams of the water
of the Denmark Strait Overflow
                                                                      masses in the Denmark taken along a section just upstream of
Swift and Aagaard (1981) described the main source of the DS          the sill where diapycnal mixing associated with the overflows
overflow as originating from the Iceland Sea and Smethie and          has not yet impact the water mass properties and across which
Swift (1989) then related the dense part of the overflow to the       previous transports by Köhl et al. (2007b) were calculated. The
intermediate water in the Greenland Sea. However, a comple-           section encompasses only the latitudes where densities larger
mentary circulation scheme was presented by Mauritzen (1996)          than σ = 27.8 exist and excludes thus most of the Polar Sur-
who describes the origin of the overflow water as originating         face Water and the Atlantic inflow. The years 1994 and 2003
from 3 branches of the Norwegian Atlantic Current that, after         correspond to low wind stress forcing around Iceland and are
transformation in the Arctic Ocean and at Fram Strait, return         characterized by relatively warm and saline conditions while
as East Greenland Current (EGC). The two branches that either         during stronger forcing in 1999 the water is colder and fresher.
flow westward in the Fram Strait or northward through Fram            As mentioned before, these water masses can not be compared
Strait supply the DS overflow water while the flow through the        without corrections to the T-S characteristics from hydrographic
Barents Sea opening form the FBC overflow. It was realized            sections, for example the T-S diagram shown in Fig. 6 of Rudels
over the years that several different water masses contribute to      et al. (2002) and Fig. 4 of Rudels et al. (2003). Their sections
the overflow and that, on its route along the Greenland slope,        across the entrance of the DS (roughly along 23◦ W only 2◦ east-
the EGC exchanges waters with the Greenland and Iceland Seas          ward of our definition) were taken in 1990 and 1998, years of
and incorporates additional intermediate water masses (Rudels         very high and relatively high NAO, respectively. The modelled
et al., 2002). The common notion nowadays is that Arctic              water masses in the East Greenland Current are biased to low
Atlantic Water and upper Polar Deep Water, with contribution          temperatures reaching hardly a temperature maximum of 1 ◦ C
from Return Atlantic Water (RAW) and Icelandic Arctic Inter-          as compared to the observed maximum of around 2 ◦ C. This is
mediate Water (IAIW), form the main constituents of the DS            owing to the fact that not even the climatology the model was
overflow. However, this view is still not generally accepted,         start from provides correct T-S characteristics. As the temper-
especially since Jonsson (1999) argues that a westward current        ature maximum in the East Greenland Current decreases due
north of Iceland suggests the Iceland Sea as the main contributor     to mixing with colder and fresher water along its way towards
to the DS overflow.                                                   the DS (see Rudels et al., 2003), their TS-diagram from the
   Rudels et al. (2003) described, for the first time, that the       1998 section taken in a year with large wind stress with maxi-
pathways of the water supplying the DS overflow may not be            mum temperatures around 1.5 ◦ C should be compared with the
as steady as present-day circulation schemes may suggest. By          simulated characteristics of maximum temperatures just below
comparing water masses derived from hydrographic observa-             1 ◦ C in 1999. Consequently, both water masses describe mainly
tions taken in the early and late 1990s upstream of DS, they          sources from the East Greenland Current.
found temporal variations in the composition of source water              Rudels et al. (2002) concluded that the even colder and fresher
masses and concluded that this also indicates a possibility for       water masses (below 1 ◦ C) seen in their earlier observation, taken
a temporal change in the upstream pathways. As temporal vari-         during even higher NAO in year 1990 points at a source from
ability in the strength of the overflows was found by Köhl et al.    the Iceland Sea. This case is not realized during the model run

Tellus 62A (2010), 4
554                                                                A . K Ö H L

                                          NAO

                                                                                                                DK03

                                 1994
                                 1999
                                 2003

                                                                                                              DKdense

                                                                      DK99

Fig. 2. T-S diagram of the water masses in the Denmark Strait sampled along 26◦ W between 66.6◦ N and 68.0◦ N in three different years as
indicated. The definition of the three water mass classes is indicated by boxes in the corresponding colour. The black box defines the densest class
with a lower boundary at 1.2 ◦ C not visible on the plot. The TS-characteristics of 1999 is typical for the period 1995–2001, the remaining years
correspond to the characteristics of 1994 and 2003. The small inset shows the annual mean NAO Index from NOAA Climate Prediction Center for
the period 1992–2003 and the DS overflow together with the wind stress curl averaged over the region around Iceland and scaled as in Fig. 7 of Köhl
et al. (2007b).

which instead realizes two cases of low wind stress forcing.                σ < 28.0, water mass properties for the year 1999 and 2003
Although the tendency of the model seem to be correct that                  almost perfectly separate into two disjunct classes, allowing for
during higher wind stress curl situations (e.g. from 1994 to 1999)          a simple definition of two classes, DK99 and DK03, as indicated
the temperatures in the Denmark Strait are lower we will show               by the green and blue boundaries in Fig. 2. For the remaining
in the following that the associated circulation changes are quite          dense part, only one class (DKdense) is defined as indicated by
different from the tendency that is observed for the transition             the black box. These simplified definition of water mass classes
from high (in 1998) to even higher NAO in 1990. Eldevik et al.              are chosen to provide a comprehensive classification of many
(2009) presented an analysis of temperature and salinity changes            complicated processed associated with formation and mixing of
in the Nordic Seas for the period 1950 to 2005. As in the model,            water masses that the model is not expected to represent correctly
they find a general warming and salinification trend in the DS              although it expected that the imprint of larger circulation shifts
overflow from 1999 to 2003, although 1999 and 2003 do not                   on the water mass characteristics are represented sufficiently
appear as particular extreme cases in their analysis. Opposing a            correctly.
simple relation to the NAO or wind stress curl, 1990 appears to                Comparing layer thicknesses of the three classes and how they
be relative warm and salty.                                                 transform from high to low wind stress curl conditions (Fig. 3),
   According to Rudels et al. (2003), on time scales from month             reveals a major switch in the circulation regime. From 1999 to
to years, variable wind forcing controls the sources to be either           2003, the main pathway of water exiting through the DS changes
from the Iceland Sea or from the EGC. On longer time scales,                from an almost exclusive EGC source to a dominant source in
the Greenland Sea convection is the key to the variable wa-                 the Iceland Sea. At the same time, the pool of DK03 water in the
ter masses. Strong convection forces the Recirculating Atlantic             Iceland Sea has shifted towards the northwest while the volume
Water (RAW) to dominate in the EGC and in the DS overflow                   has not changed much (Figs. 3c and d). The origin of the warm
whereas low convection causes more Arctic Atlantic Water to                 and salty water masses needs further explanation. In the model,
enter the EGC. By tracing back the different water masses, we               the warm and salty water that is found in the near surface depths
will try to asses, if changing pathways and origins can be re-              (depth range 40–300 m) of the Iceland Sea shares some charac-
vealed. For the lighter fraction of the overflow, roughly water of          teristics with the Recirculating Atlantic Water, that can be found

                                                                                                                               Tellus 62A (2010), 4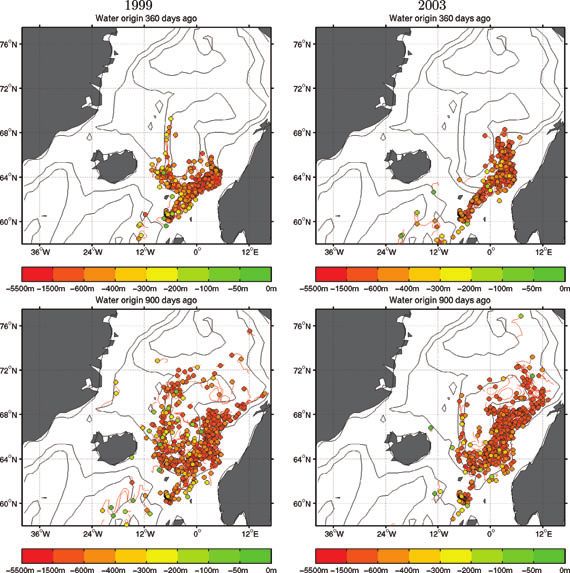
VA R I A B L E S O U R C E R E G I O N S O F D E N M A R K S T R A I T A N D FA RO E BA N K C H A N N E L OV E R F L OW WAT E R S               555

Fig. 3. Layer thickness (in m) of different water mass classes. Shown are years of high and low wind stress curl (1999,2003), respectively for the
classes DK99 (a,b), DK03 (c,d) and DKdense (e,f). Volume transports (in m2 s−1 ) from vertically integrated velocities in the respective layer are
overlaid.

in the Fram Strait, rather than the signal of the Recirculating              Atlantic water with the fresher and colder water of the Iceland
Atlantic Water near the Denmark Strait. It originates from water             Sea resulting into characteristics that resemble the Recirculating
of the Irminger Current that is entrained and advected with the              Atlantic Water. The creation of this water is associated with a
westward current north of Iceland. Further on its cyclonic path              stronger cyclonic circulation in the Iceland Sea while this water
around the Iceland Sea, it includes water from the Arctic Front              gets exported during the following period of low wind stress
which carried with the northward current along the Mohn ridge.               forcing when the cyclonic circulation relaxes. Recent combined
It then circulates westward south of the Jan Mayen Fracture                  observations from Argo profiles reveal in fall 2006 some indi-
Zone penetrating into the Iceland Sea. These water masses mix                cation of a northward spreading of warm and salty water along

Tellus 62A (2010), 4
556                                                                A . K Ö H L

                                                                               Considering the associated transports shown as overlaid vec-
                                                                            tors in Fig. 3, the contribution from the EGC has disappeared
                                                                            completely in the lighter fraction and is replaced by a source of
                                                                            DK03 water from the Iceland Sea. In the dense fraction (Figs 3e
                                                                            and f), the Iceland Sea has changed from a net receiver of dense
                                                                            water from the EGC to a net source of dense water for the flow
                                                                            into the DS. Between 68◦ N and 69◦ N dense water is entering the
                                                                            Iceland Sea and flowing eastward with the East Icelandic Current
                                                                            in 1999 while in 2003 the currents reverse, leading to contribu-
                                                                            tion from two paths, one southward from the northern part of the
                                                                            Iceland Sea and a westward flow north of Iceland. Note, that the
                                                                            westward current across the Hornbanki section (21.5◦ W), which
                                                                            Jónsson and Valdimarsson (2004) suggested as an indicator for
Fig. 4. Layer thickness (in m) of the water mass classes DK03               the main source of the DS overflow being located in the Ice-
calculated from the objectively analyzed Argo temperature and salinity      land Sea, is always westward as also the transport time series
profiles provided by Gaillard et al. (2009).                                of Köhl et al. (2007b) demonstrate, although the contributions
                                                                            to this current switch from the EGC in 1999 to sources from
                                                                            the Iceland Sea in 2003. According to the modelling results, the
                                                                            presence of this current is therefore not a sufficient indicator for
the Jan Mayen Ridge followed by a westward advection into the               a source in the Iceland Sea.
Iceland Sea south of the Jan Mayen Fracture Zone (Fig. 4). This                Timeseries of a decomposition of the DS overflow into the
pathway of near surface water is also indicated by the drifter              contributions from the three water masses are shown in Fig. 5b
trajectories show by Poulain et al. (1996) (their Fig. 4 and                together with the total overflow. Most noticeable is the small
Scheme 7), although one has to keep in mind that drifters are               contribution from the lighter water masses that contribute with
moving slightly above this layer.                                           0.6 Sv to only about 25% of the total overflow. In comparison,
   During the period 1999 to 2003, the large pool of cold and               observational data from a seven-section mean suggest a larger
fresh water (DK99, in panels a and b) in the Greenland Sea has              fraction of the transport in the density range 27.8 < σ < 27.95
ceased and been replaced by denser water (DKdense), which                   of about 40% (Plate 1 of Girton et al., 2001). However, the
was concentrated in the EGC in 1999 and is more spread out                  range of values from the observations is rather large and their
towards the east in 2003 (Figs 3e and f). From 1999 to 2003,                model results show roughly the same low value as the present
changes in respective volumes north of the Greenland Iceland                simulation. Accordingly, estimates from some individual sec-
Scotland Ridge are summarized in Fig. 5a showing a constant                 tions, particularly those further upstream, provide even lower
DK03 volume and a reduction of DK99 by 50%. However, the                    values than the models. Results of the present model show that
largest changes are visible in the dense fraction with a build up           already downstream of 27◦ W entrainment starts to play a role
of volume in the period 1995–2000 during low wind stress curl               which may account for the differences. The contribution from
conditions and a decrease thereafter. At interdecadal time scales,          DK99 disappears after 2001 while the contribution from DK03
a relation of deep convection in the Greenland Sea to negative              increases over the period 1999–2003 from 0.2 to 0.6 Sv largely
NAO phases has been discussed previously by Dickson et al.                  balancing the decrease in DK99. The total DS overflow vari-
(1996) which was confirmed in the present simulation by Käse               ability follows thus the variability of the dense fraction which
et al. (2009). However, the study by Häkkinen (2007), similar              decreases by about 0.4 Sv over the same period. Although the
to Rudels et al. (2003), emphasizes advection and mixing of                 contributions from the lighter fractions are small and seem to
Atlantic and Arctic water masses as the most critical aspect in             balance each other, they carry almost an equal amount of vari-
leading to deep water renewal in the Greenland Sea. After the               ability as the dense fraction. This is remarkable since the total
large DS overflow during 1997–1999, the volume of DKdense                   volume of DK99 and DK03 and its variability is much smaller
fraction has increased in the Greenland Sea and the gain in                 than those of DKdense. At the same time, the inflow of Atlantic
dense water (DKdense) at expense of the lighter fraction (DK99)             Water stays constant over the period 1999 to 2003 whereas the
is provided by upward displacement of the upper boundary of                 outflow of Polar Surface Water reduces from 1.14 to 0.24 Sv
the dense fraction from 350 to 150 m depth (not shown) which                (not shown).
points at a local source of dense water through convection. In                 Regarding only layer transports, the actual pathways of water
the Greenland Sea the total thickness of the upper and lower                cannot clearly be identified. Particularly, it remains unclear how
layer together (DK99+DKdense) has not changed significantly                 much water from the EGC is provided to the DS overflow in
indicating that no major net advection out of basin has taken               comparison to contributions from the Iceland Sea in the years
place.                                                                      1999 as opposed to 2003 and whether water from the centre

                                                                                                                            Tellus 62A (2010), 4
VA R I A B L E S O U R C E R E G I O N S O F D E N M A R K S T R A I T A N D FA RO E BA N K C H A N N E L OV E R F L OW WAT E R S 557
a
b
Fig. 5. Total volume of water in the density
classes DK99, DK03, and DKdense (a) and
their contributions to the DS overflow
calculated as transports across 25◦ W below
σ = 27.8 (b).
of Greenland Sea contributes to the DS overflow. To separate of the ridges is due to water from the overflows east of Iceland
the paths that actually contribute to the DS overflow from water that is either entrained into the overflow or part of the inflowing
of the same type that is just recirculating, floats were seeded water into which some of the floats were inevitably seeded).
upstream of the overflow and followed backward in time. The An additional contribution from the shallow inflow on the shelf
trajectories reveal the purely advective pathways. Mixing is only through Fram Strait is visible. In year 1999, the main contribu-
taken into account as far as it is represented by resolved eddies. tion is from the EGC with a small part from the Iceland Sea that
DS overflow transports show a noticeable seasonal cycle with appears to be due to eddy mixing.
larger transports during early winter. However, separate back- Over the course of the 4 years of backward integration, about
ward calculations for floats seeded in winter and summer do not 30% of the floats exiting through the DS came through the Fram
reveal any dependence on the season (not shown). Snapshots of Strait. At 360 days ago shown in Fig. 6c only 8% are north of
float positions after 180, 360 and 720 days of backward integra- 78◦ N but about 20% are in the eastern Greenland Sea, at the
tions in year 1999 and 2003, respectively, shown in Fig. 6 reveal western flank of the Mohn Ridge. Inspecting the TS characteris-
a distinct shift in pathways that basically reflects the changes dis- tics of the floats, the larger part of the latter floats have salinities
cussed above for the light fractions (the additional route south larger than 34.8 and show a positive slope in the TS diagram
Tellus 62A (2010), 4558 A . K Ö H L
Fig. 6. Backward float positions with a path from the last 30 days and depth indicated by colour. 1000 floats were seeded along 26◦ W roughly below
σ = 27.8 in year 1999 (left panels) and 2003 (right panels), respectively and integrated backward for periods as indicated in the panels. Floats were
not strictly seeded in southwestward moving water therefore some of the floats follow the pathways south of the Greenland Iceland Scotland
Ridge.
Tellus 62A (2010), 4VA R I A B L E S O U R C E R E G I O N S O F D E N M A R K S T R A I T A N D FA RO E BA N K C H A N N E L OV E R F L OW WAT E R S 559
indicating RAW whereas a smaller fraction is colder and fresher et al. 2001; Eldevik et al., 2009). Similar to the previous section,
(not shown). As we go further back in time (Fig. 6e), the larger water mass characteristics were computed to reveal the simu-
fraction is originating from regions southeast while the smaller lated changes over the period 1994-2003. A section upstream
fraction originates from moving along the Jan Mayen Fracture of the overflow (the Faroe-Shetland section along 52.4◦ N) was
Zone and then continuing along the Mohn Ridge, these indicate selected to minimized the effect of the substantial mixing in the
Arctic Ocean water that is branching off the EGC and than is FSC channel (e.g. Borenäs et al. 2001) that would not allow us
cyclonically moving around the Greenland Sea. Note, that water to relate changing characteristics to changing pathways.
from the centre of the Greenland Sea hardly contributes to the In the lighter fraction of the overflowing water shown in
overflowing water. The traveltime from the Fram Strait to the DS Fig. 7, a shift to more saline conditions can be observed from
of about 1 year is in agreement with other studies (Olsson et al., the years 1999 to 2003 which looks similar to the bimodal T-S
2005; Eldevik et al., 2009). In 2003, the pathway entirely shifts characteristics which Borenäs et al. (2001) related to the absence
to a source in the Iceland Sea. For longer time scales, smaller or presence of IAIW water mass. However, the convexity due to
contributions from EGC, the Jan Mayen Current, and even the the presence of fresh IAIW in the left (1999) curve is not very
Norwegian Sea become visible. There are no distinctively dif- clearly pronounced in the simulation which shows a larger shift
ferent pathways visible for deeper (denser) as opposed to the in the Norwegian Sea Intermediate Water instead. They also re-
lighter fractions. The purely advective pathways reveal thus a ported a seasonal dependence of the occurrence of the IAIW
clear separation of the regimes for high and low wind stress curl signal which the simulation partly confirms. Although, includ-
conditions. ing the seasonal spread, water mass types for 1999 and 2003 will
For spring 2002, Jeansson et al. (2008) describes the East overlap, a clear difference between the states of 1999 in compar-
Greenland Current to be the main source for the waters found ison to 2003, as the Fig. 7 illustrates, holds and the shift to more
at the Denmark Strait Sill. The East Greenland Current carried saline conditions from 1999 to 2003 is also in agreement with
water masses from different source regions in the Arctic Ocean, the observed variability in the FSC that Eldevik et al. (2009)
the West Spitsbergen Current and the Greenland Sea. A sepa- recently reported. Although we find also reasonable agreement
rate calculation with floats seeded in spring 2001 (not shown) with the temperature and salinity changes in the North Atlantic
revealed that the simulated path has already switched to the Water, RAW, and the overflows as defined in their analysis (not
source in the Iceland Sea confirming the earlier notation that the shown), the shortness of period 1992–2004 does not allow us to
simulated changes are earlier in time. follow along their line and analyse statistical relations with any
significance. An attempt is therefore made to define two classes,
FSC99 and FSC03, and an additional dense class, FSCdense,
as indicated in Fig. 7 to allow for a later decomposition of the
4. Changing water masses and pathways
transports.
of the Faroe Bank Overflow
The sources of the FBC overflow can be divided into three
Aagaard et al. (1985) suggest Norwegian Sea Deep Water paths: the East Icelandic Current, the shorter pathway through
mixed with intermediate waters from the Norwegian Sea, nowa- the Jan Mayen Channel and a deeper path of Norwegian Sea
days termed Norwegian Sea Arctic Intermediate Water after Arctic Intermediate Water from the Norwegian Sea. As for the
Blindheim and Ådlansdsvik (1995), to form the outflow through DS, the change from high to low wind stress curl shifts the cir-
the FBC. While after Read and Pollard (1992) relatively fresh culation patterns. Considering the layer thicknesses shown in
water from the East Icelandic Current additionally contributes Fig. 8, the pool of FSC99 water that is present in 1999 along the
to overflowing water. The latter water mass is characterized by a Arctic Front, is exported towards the FBC following a current
salinity minimum and as it is modified by mixing with surround- along the Mohn and Jan Mayen Ridge system. A further frac-
ing water it is termed Modified East Icelandic Water. Although tion is exported northeastward into the Lofoten Basin. The pool
the water mass names indicate origins in the Iceland and Norwe- moved southward and is much reduced in 2003 now additionally
gian Sea, only a part of the Norwegian Sea Intermediate Water exporting water westward in a current north of Iceland, although
is formed by sinking in the frontal region in the Norwegian Sea due to mixing the signature is lost before it enters the entrance
whereas the remaining part as well as the deep water flows from to the DS. From 1999 to 2003, a build up of FSC03 water is no-
the Greenland Sea through the Jan Mayen Channel (Hansen and ticeable in the centre of the Lofoten Basin and a small fraction
Østerhus, 2000). leaves this basin southward underneath the eastern branch of the
The large-scale reorganization of the flow north of the Green- Norwegian Atlantic Current. Käse et al. (2009) demonstrated the
land Iceland Scotland Ridge, that leads to different water masses possibility of such a current in a circulation that is purely driven
at the DS, is likely to affect also the pathways of the FBC by a density difference across the Greenland Iceland Scotland
overflow including possible changes in its water masses. Obser- Ridge or by a deep inflow through Fram Strait. The strong an-
vational evidence exist for such changes on seasonal and on inter- ticyclonic mesoscale feature visible in the centre of the Lofoten
annual to interdecadal timescales (Turrell et al., 1999; Borenäs Basin is well observed and described in detail by Köhl (2007). It
Tellus 62A (2010), 4560 A . K Ö H L
1994
1999
2003
FSC99
FSC03
FSCdense
Fig. 7. T-S diagram of the water masses in the Faroe-Shetland Channel sampled along 62.5◦ N in the years 1994, 1999 and 2003.
is embedded into the cyclonic circulation of the Lofoten Basin above in the layer of the FSC03 class, water from the Norwegian
(see also Fig. 2 of Käse et al., 2009.) According to Köhl (2007), Sea follows the eastern path along the Norwegian shelf edge
it emerges from anticyclones which are shed by the Norwegian feeding the FBC overflow (note, east of this current the flow is
Atlantic Current and which are topographically guided into the always southward). In the idealized experiments by Käse et al.
centre of the Lofoten Basin where they merge. Both the cyclonic (2009), the reversal of this current can be induced by a switch
circulation of the basin and the anticyclonic circulation of the from deep to shallow inflow through Fram Strait. Hansen et al.
vortex are indicated by the float trajectories shown in Søiland (2001) related the FBC overflow to the depth of isopycnals at
et al. (2008). However, the vortex remains rather inactive for the the Ocean Weather Ship Mike which, however, was no longer
distribution of the overflowing water masses. supported by more recent measurements of Hansen and Østerhus
The low-salinity part of the FSCdense includes a large fraction (2007) who consequently uttered doubts about the weakening of
of the previously defined DKdense water mass. It is therefore the FBC-overflow in the 1950–2000 period that Hansen et al.
inevitable that both classes reveal common features. Particularly, (2001) reported. The eastern path may communicate changes
the thickening in the Greenland Sea from 1999 to 2003 and the at Mike into the FSC and may thus enable a relation between
reduction of the EGC is a dominant feature of both patterns. interface changes and the FSC overflow. However, the path of
However, the circulation of FSCdense additionally reveals more communication is altered by the strength of the wind stress curl.
details in the Iceland and the Norwegian Sea. A large fraction of Considering the contributions of the three water mass classes
the FSCdense water in the Greenland Sea is not part of DKdense to the FBC overflow transport variability, the decomposition
and will therefore not exit through the DS. Particularly near the of the transport shown in Fig. 9b demonstrates that FSC99 and
Jan Mayen Fracture Zone, a large volume of FSCdense exists FSC03 have only a minor contribution to the transports with very
that flows eastward into the Norwegian Sea in 1999 and which small changes after 1999. The time variability is thus explained
largely has disappeared in 2003. The transports north of Iceland entirely by the dense fraction that carries almost the total trans-
reverse from eastward to westward and the strong southward port. However, the upstream volume changes of the three classes
current following the Jan Mayen Ridge weakened in 2003. The (Fig. 9a) are equally large, with nearly perfectly anticorrelated
water flowing along these pathways seems not to follow directly variability between the FSC99 and FSC03 volumes (r = 0.95).
into the entrance of FBC but a large part flows northward roughly Because the export of FSC99 and FSC03 is small and nearly
along 2◦ W and is buffered in the Norwegian Sea. Consequently, constant, formation and transformation are the major factors to
a larger volume has build up there in 1999. In 2003, the direction explain the covariability. The relatively fresh FSC99 water that is
of the flow along 2◦ W is reversed and similar to what was seen formed near the frontal region is exported into the Lofoten basin
Tellus 62A (2010), 4VA R I A B L E S O U R C E R E G I O N S O F D E N M A R K S T R A I T A N D FA RO E BA N K C H A N N E L OV E R F L OW WAT E R S 561 Fig. 8. Layer thickness (in m) of different water mass classes. Shown are years of high and low wind stress curl (1999, 2003) for the classes FSC99 (a,b), FSC03 (c,d) and FSCdense (e,f). Transport densities (in m2 s−1 ) from vertically integrating velocities in the respective layers are overlaid. (Fig. 8a) where it partly becomes entrained into the overlying et al. (2009), the deep inflow through Fram Strait establishes a saline water by winter time convection. This process explains the regime similar to a flow purely driven by a density difference newly formed water of the FSC03 volume that is visible in the across the Greenland Iceland Scotland Ridge, that leads to larger centre of the Lofoten Basin in 2003. After 1994, there seems to FSC transports, as opposed to shallower inflow through the Fram be a reasonably good correlation between the FSCdense volume Strait that promotes DS overflow. and the FSC overflow although most of the additional volume is At last, we want to trace the pathways of the FBC overflow located just south of Fram Strait and in the Greenland Sea and water by backward floats for the two different regimes. For 1999, seems to be fairly isolated from the FSC. According to Käse a large fraction of the water is originating from the southward Tellus 62A (2010), 4
562                                                           A . K Ö H L

a

b

                                                                                               Fig. 9. Total volume of the water in the
                                                                                               density classes FSC99, FSC03 and
                                                                                               FSCdense (a) and their contributions to the
                                                                                               FSC overflow calculated as transports across
                                                                                               62.4◦ N east of Faroe Islands below
                                                                                               σ = 27.8.

flow along the Norwegian shelf edge (Fig. 10a) while a smaller         the calculation of regions that influence the heat transport in the
fraction follows along the faster pathway along the Jan Mayen          North Atlantic (Marotzke et al., 1999). In this process, an adjoint
Ridge. For longer time scales, the floats originate also from the      model is used to efficiently calculate gradients (or sensitivities)
eastern basins and the EGC by crossing over north of Iceland           of a quantity with respect to perturbations of certain parameters
and along the Jan Mayen Fracture Zone. In 2003, the eastern            of the model.
branch is the only supply for water while only for longer time            Here we calculate December 1999 and 2003 sensitivities of
scales (2002 and 2001) the two western pathways, mostly along          the monthly mean overflow through DS and FBC. The calcu-
the Jan Mayen Ridge, become active.                                    lations are done with the low-resolution version of the model
                                                                       which shows slightly lower mean transports through DS and
                                                                       FBC with basically the same temporal variability. The discussion
5. Sensitivity of the overflows to interface
                                                                       will focus on sensitivities to interface height changes. Although
height changes
                                                                       many causes of changes for the DS and FSC overflow exist (e.g.
Adjoint sensitivities calculations are a tool to determine regions     Biastoch et al., 2003; Lake and Lundberg, 2006; Köhl et al.,
and mechanisms that contribute to changes of a target quantity.        2007b; Käse et al., 2009), there is a general agreement that the
One of the first ocean applications of these sensitivities was         overflows on both sides of Iceland are hydraulically controlled

                                                                                                                      Tellus 62A (2010), 4
VA R I A B L E S O U R C E R E G I O N S O F D E N M A R K S T R A I T A N D FA RO E BA N K C H A N N E L OV E R F L OW WAT E R S 563
Fig. 10. Backward float positions with path of the last 30 days and its depth indicated by colour. 1000 floats were seeded along 7◦ W roughly below
σ = 27.8 in year 1999 (left panels) and 2003 (right panels), respectively and integrated backward for periods as indicated in the
panels.
(e.g. Käse et al., 2003; Girton et al., 2006). In hydraulic control reservoir located, especially, how large is the area and how does
theory, changes of the flow through a strait depend within the this change if lags are considered, secondly, how do the different
approximation of a two-layer fluid only on the height of the forcing mechanisms ultimately change the reservoir height. Al-
interface upstream. though the second question is more important, it is much harder
For the DS overflow, in the simple relation to address and we will therefore restrict the discussion to the
first question which can be addressed by the sensitivities of the
∂DSO
DSO = h27.8 , (1) transports to reservoir height changes as shown in Fig. 11.
∂h27.8
Figure 11a shows the sensitivity of the December 1999 DS
the sensitivities ∂DSO/∂h27.8 describe at which locations per- overflow to h27.8 changes in the same month which therefore
turbations of the local height of the σ = 27.8 surface (h27.8 ) describes the reservoir of an immediate response. Positive sen-
will change the DS overflow most. sitivities indicate regions where increasing the reservoir height
Hansen et al. (2001) proposed a relation between the remote enhances the transport. Accordingly, the main upstream reser-
reservoir height as measured by Ocean Weather Ship Mike and voir for the DS overflow lies very localized directly upstream
the FBC overflow. This relation was questioned by Helfrich and on the right hand side (looking downstream of the flow) of the
Pratt (2003) and Pratt (2004) because the predicted transport is channel. Negative sensitivities are located to the left enhancing
very far from the actual location. They argued that, if the loca- the southward deep layer transport according to the geostrophic
tion of the source changes, the flow through the strait may stay relation. Additional negative sensitivities are located along the
constant even though the reservoir height changes at a certain eastern shelf of Iceland, along the northern part of the Iceland-
location. Two questions emerge: first, where is this upstream Faroe Ridge and at the entrance of the FSC. Switching to the
Tellus 62A (2010), 4564 A . K Ö H L
Fig. 11. Sensitivity of the Denmark Strait (a,c,e) and Faroe-Shetland (b,d,f) overflow of December 1999 to interface height changes in December
1999 (a,b) and 6 months before in May 1999 (c,d). Panel (e) and (f) show the Sensitivity of the December 2003 overflows to interface height changes
6 months before. The interface is the height of the σ = 27.8 surface. Values are in m3 km−1 s −1 .
FBC overflow (Fig. 11b), reveals similar patterns with regionally A reversal of sign is expected because a larger transport in
reversed signs. The upstream reservoir for the FBC overflow lies one of the overflows has to be compensated by either a larger
directly in the FBC and extends westward along the Jan Mayen upper layer inflow or a reduced overflow on the other side of
Ridge. In comparison to the DS sensitivity, the pattern along Iceland because the net northward transport is prescribed to be
the Norwegian shelf slope and into the DS have a reversed 1 Sv. Because the former will not be very sensitive to inter-
sign. face changes, in most areas the sign reverses promoting either
Tellus 62A (2010), 4VA R I A B L E S O U R C E R E G I O N S O F D E N M A R K S T R A I T A N D FA RO E BA N K C H A N N E L OV E R F L OW WAT E R S 565
cyclonic or anticyclonic circulation anomalies around Iceland. for such a mechanism exist only during high wind stress curl
Only along the eastern Icelandic shelf and north of the Iceland- forcing.
Faroe Ridge sensitivities are negative for both cases. The reser-
voir area obviously belongs to the so far neglected Iceland-
6. Conclusions
Faroe Ridge overflow which affects the DS and FSC overflow
in the same way. The result is surprising because the mean over- By analysing numerical ocean model results, we investigate
flow transport across Iceland-Faroe Ridge is only 0.02 Sv (Köhl changing water masses and source regions of the overflows west
et al., 2007b). However, the temporal variability of this over- and east of Iceland under high and low wind stress curl forcing
flow is quite large with instantaneous transport values exceeding conditions. As previously noted, changes in water mass char-
2 Sv. acteristics indicate changes of source regions and vice versa.
On longer time scales, propagation of density anomalies be- Although a close correspondence between modelled and ob-
come more important. We show sensitivities to h27.8 changes served water masses could not be established, a validation with
6 months before for both overflows for the high and low wind simulated backward float trajectories show that the characteris-
stress curl cases. For the large wind stress curl case (Figs 11c and tics are still a valid means to reveal changing pathways. From
d), DS sensitivities propagate mainly along the EGC concentrat- this analysis, a slightly modified circulation scheme emerges
ing in agreement with the backward floats shown in Fig. 6 at that is presented in Fig. 1. From analysing a series of sections
70◦ N. For the FSC sensitivity, the two pathways east of Iceland from the Fram Strait to the DS, Rudels et al. (2002) concluded
are present as two isolated areas of positive sensitivities roughly that the main source of the DS overflow is the EGC with con-
at 3◦ E, 63◦ N and 2◦ W, 64◦ N. An additional area is visible at tributions from the Iceland Sea, contradicting the early notion
7◦ W, 65◦ N that also exists in Fig. 11c and that originates in both of Swift et al. (1980) who described the upper Arctic Inter-
cases from the Iceland-Faroe Ridge. The situation changes dur- mediate Water formed in the Iceland Sea as the main source.
ing a low wind stress curl (Fig. 11f). Here, the western branch In agreement with Rudels et al. (2002), our circulation scheme
along the Jan Mayen Ridge is much reduced in comparison to suggests during moderately strong wind stress curl in 1999 the
the high wind stress curl case. The eastern branch dominates and main source of the DS overflow to be the EGC, whereas in the
positive sensitivity reaches the position of Weather Ship Mike at model during periods with low wind stress curl the source is in
0◦ , 66◦ N in May, 6 months prior to the overflow response which the Iceland Sea and signatures of warmer and saltier water are
supports the 8-month-delayed linkage between the magnitude found in the lighter fraction of the overflow. In contrast, for the
of the overflow and the upstream reservoir conditions suggested very high NAO year 1990 Rudels et al. (2002) reports a larger
by Hansen et al. (2001). A comparison with Fig. 11d reveals contribution from the Iceland Sea due to mixing which then re-
that the propagation speed of the sensitivities may depend on sults into colder and fresher DS overflow water characteristics.
the forcing conditions, which may lead to a loss of coherence of Three cases emerge from this: first, during moderate wind stress,
the two signals for a fixed lag during certain periods also noted water is brought by the EGC to the DS while the Iceland Sea is a
by Hansen and Østerhus (2007). The two panels also illustrate receiver and the cyclonic circulation in the Iceland Sea entrains
the argument of Pratt (2004) that as the upstream flow path may Atlantic Water from the Irminger Current and the Arctic Front.
change the location of the reservoir will also move. As shown Secondly, during low forcing conditions, the cyclonic circula-
in Figs 11a and b, the problem is resolved if one moves closer tion in the Iceland Sea relaxes and the basin is able to directly
to the entrance of the sill; the controlling region for the instanta- export water leading to a predominant source from the Iceland
neous overflow is then relatively small and always located near Sea which releases high salinity near surface water that was en-
the sill. The interesting new result different from steady solu- trained during moderate forcing conditions. Thirdly, during very
tions regarded by Helfrich and Pratt (2003) is the dynamical high wind stress a strong EGC leads to an enhanced mixing of
aspect of the reservoir height. The reservoir height is advected the EGC water with the water from the Iceland Sea which thus
with the flow and will causes a response of the overflow with a indirectly contributes to the overflow water and leads the coldest
certain time lag. The origin of overflow anomalies can therefore temperature characteristics.
be traced back to upstream changes. As the forcing goes from high to low wind stress curl,
At last, DS sensitivities are regarded again. Although from the westward current north of Iceland, which according to
the results of Section 3, the EGC branch is expected to be much Jonsson (1999) identifies the Iceland Sea as the main contribu-
reduced during low wind stress curl situations (Fig. 11e), a large tor to the DS overflow, is found to change its direction. At the
sensitivity pattern is visible along the EGC branch whereas no same time, the contribution to FBC overflow from a path along
sensitivity patterns are visible in the Iceland Sea. However, the the slopes north of the Faroes intensifies. The existence of these
propagation of sensitivities reveal no apparent link to the DS and currents and the related changes can be rationalized considering
the pattern seems to emerge from a local instability. In summary, the potential vorticity budget of the dense layer circulation in the
for the FBC overflow the advection of interface height anomalies Nordic Seas. Helfrich and Pratt (2003) consider the budget in a
seems to be a relevant mechanism whereas for the DS indications basin with inflow on one side and outflow on the other side with
Tellus 62A (2010), 4566 A . K Ö H L
an optional interior downwelling source. Without this source, the Norwegian Basin is less pronounced. However, in contrast
the conservation of potential vorticity leads to a split into two to Eldevik et al. (2005), who claim that during low NAO the
boundary currents and a symmetric flow along f /H contours, for pathway taken by the Greenland Sea Water exported at DS is
example the eastern and the western boundary of the basin. When the EGC, we find a general absence of this path during low wind
the source is represented by interior downwelling, the outflow stress curl. Moreover, their slower path of water that does not
implies an anticyclonic circulation along the eastern boundary. leave at the DS and consequently travels through the Iceland and
In the Nordic Seas, inflow is represented by the flow through the Norwegian Sea to the FBC during low NAO, although present in
Fram Strait and outflow by the overflows. However, the picture the scheme in Fig. 1, is mainly a feature of high wind stress curl
is complicated by a separation of the basin in four subbasins and conditions in our model. Differences may arise since after the
two outflows. Simplifying the circulation by regarding only two mid-1990s the wind stress curl around Iceland and the NAO are
basins (the eastern basins of the Norwegian Sea and the western less tightly related to the NAO as the NAO centre of action shifts
basins of the Iceland and Greenland Sea), the linearity of the northeastward (Zhang et al., 2008). Following these changes, the
balance implies that the total circulation is a superposition of the sources of the FBC overflows change from a two path system
circulations in the individual basins. during high wind stress curl conditions with additional contribu-
The case of an interior source is also realized in the DAM tions from the East Icelandic Current to mainly a single source
BREAK experiment of Käse et al. (2009) shown in their with water spreading only along the Norwegian Shelf slope in
Fig. 5a. Although there is no interior source, because it is a contrast to Søiland et al. (2008) who sees the current along the
non-stationary case the condition of only outflow implies anti- slope north of the Faroe as the exclusive source of the FBC
cyclonic circulation in both subbasins represented be a strong overflow. However, changes in water masses and pathways are
southward flow along the Mohn Ridge and along the Norwe- found to be consistent with the findings of Borenäs et al. (2001)
gian shelf. Including inflow of dense water from the north, the and can be rationalized by the idealized case of Helfrich and
flow is closer to stationarity and more symmetric in both basins Pratt (2003). Similar to the explanation for the current north of
with a strong East Greenland Current and southwestward flow Iceland earlier, the southward flow along the Norwegian con-
along the slope north of the Faroes (see their Fig. 5b). As it tinental slope is also part of the anticyclonic circulation that is
is part of the anticyclonic branch, in both cases the flow north enhanced during low wind stress forcing, whereas the flow north
of Iceland is westward. In our model about 1.7 Sv dense (be- of the Faroe, which is part of the cyclonic basin circulation is
low σ = 27.8) water enters through Fram Strait while about stronger during high wind forcing.
4.1 Sv leaves through the overflows. This implies a net outflow Recently, Eldevik et al. (2009) presented a different analysis
balanced by an interior source which in turn implies an anti- of temperature and salinity changes at the DS and FBC based
cyclonic circulation of the dense water. Superimposed on this on statistical relations. They explain changes in the overflow
purely density driven circulation is the wind driven barotropic over the period 1950–2005 by advection of anomalies that orig-
circulation which is cyclonic. The composition is visible in Fig. 2 inate from the Atlantic inflow, whereas the current manuscript
of Käse et al. (2009), showing a cyclonic circulation in the in- associates water mass changes with changes in origin due to
terior of the basins with smaller anticyclonic parts further up different circulation regimes. Both interpretations are simplified
the slopes north of Iceland and along the Norwegian Shelf. The views, one is approximating the circulation in the Nordic Seas as
anticyclonic part of the circulation is enhanced during condi- unchanged whereas the other does the same for the background
tions with weak cyclonic wind stress and vice versa implying water masses. In reality, both processes are likely to play a
that during strong forcing the current north of Iceland reverses role and the interplay between both should be considered. How-
to a westward flow and the current along the Norwegian shelf ever, wind driven circulation changes provide a fast means to
intensifies as it is seen for the switch from 1999 to 2003. change the water masses intermittently while advection should
In a tracer release experiment (Eldevik et al., 2005), inves- play a role on longer time scales. To this end, Eldevik et al.
tigated the spreading of the Greenland Sea water through the (2009) describe only changes on time scales longer than 5 years.
Nordic Seas to the overflows in high and low NAO conditions A timescale argument might thus provide a means to separate
that correspond to high low wind stress curl conditions and pro- these complementary mechanisms that seem to provide contra-
vided a circulation scheme very similar to Fig. 1. During high dictory explanations at first. Both analyses leave also room for
NAO, the barotropic circulation is enhanced in the Nordic Seas unaccounted processes.
(Furevik and Nilsen, 2005) and in agreement with Eldevik et al. Modelling the spreading and mixing of water masses are up
(2005), our simulation confirms their finding that the intensified to now the most difficult tasks for ocean models. Therefore,
circulation is related to larger currents connecting the Greenland the level of agreement between the model results and observed
and the Norwegian Sea along Jan Mayen Fracture Zone leading data remains rather qualitative and is based on relative simple
to a more direct connection of the Greenland Sea Water to the means of comparison. However, the analysis of changes of wa-
FSC. During low NAO, they found that the Jan Mayen Current ter masses and their associated pathways in the Nordic Seas re-
and the shortcut have disappeared and the meridional flow in vealed numerous findings that observations could confirm. Some
Tellus 62A (2010), 4VA R I A B L E S O U R C E R E G I O N S O F D E N M A R K S T R A I T A N D FA RO E BA N K C H A N N E L OV E R F L OW WAT E R S 567
inconsistencies remain, particularly, the separation between the The Nordic Seas: An integrated perspective (eds. H. Drange, T. M.
circulation states for high and low wind stress curl states may Dokken. T. Furevik. R. Gerdes and W. Berger), Geophysikal Monog-
not be as clear in the real world and certainly also not as easy to raphy Series, AGU, 105–136.
see in the observations. The situation is additionally complicated Giering, R. and Kaminski, T. 1998. Recipes for adjoint code construc-
as the relation of wind stress curl around Iceland to the NAO is tion. ACM Trans. Math. Software 24(4), 437–474.
Girton, J.B., Sanford, T.B. and Käse, R.H. 2001. Synoptic sections
changing since the mid 1990s.
of the Denmark Strait overflow. Geophys. Res. Lett. 28, 1619–
1622.
7. Acknowledgments Girton, J.B., Pratt, L.J., Sutherland, D.A. and Price, J.F. 2006. Is the faroe
bank channel overflow hydraulically controlled? J. Phys. Oceanogr.
Nuno Serra provided valuable comments on the paper and the 36, 2340–2349.
backward float program was developed by Robert Landsberger. Häkkinen, S. 2007. Upper ocean T-S variations in the Greenland Sea
This work was supported by Sonderforschungsbereich 512 of and their association to climatic conditions. J. Geophys. Res. 112,
the Deutsche Forschungsgemeinschaft and is a contribution to doi:10.1029/2006JC003498.
CliSAP. The integration of the model was performed at the Hansen, B. and Østerhus, S. 2000. North Atlantic–Nordic Seas ex-
German high-performance computing centre DKRZ. changes. Prog. Oceanogr. 45, 109–208.
Hansen, B. and Østerhus, S. 2007. Faroe Bank overflow 1995–2005.
Prog. Oceanogr. 52, 817–856.
References
Hansen, B., Turrell, W.R. and Østerhus, S. 2001. Decreasing overflows
Aagaard, K., Swift, J.H. and Carmack, E.C. 1985. Thermohaline circula- from the Nordic Seas into the North Atlantic Ocean through the Faroe
tion in the Arctic Mediterranean Seas. J. Geophys. Res.90, 4833–4846. Bank Channel Science 1950. Nature 411, 927–930.
Biastoch, A., Käse, R. and Stammer, D. 2003. The sensitivity of the Helfrich, K.R. and Pratt, L.J. 2003. Rotating hydraulics and upstream
Greenland-Scotland Ridge overflow to forcing changes. J. Phys. basin circulation. J. Physical. Oceanogr. 33, 1651–1663.
Oceanogr. 33, 2307–2319. Hoteit, I., Cornuelle, B., Köhl, A. and Stammer, D. 2005. Treating
Blindheim, J. and Ådlansdsvik, B. 1995. Episodic formation of in- strong adjoint sensitivities in tropical eddy-permitting variational data
termediate water along the Greenland Sea Arctic Front. ICES CM assimilation. Q. J. Met. Soc. 613, 3659–3682.
1995/Mini:6, 11 pp. Jeansson, E., Jutterström, S., Rudels, B., Rudels, B., Anderson, L.G.
Borenäs, K.M., Lake, I.L. and Lundberg, P.A. 2001. On the intermediate and co-authors. 2008. Sources to the East Greenland Current and
water masses of the Faroe-Bank Channel overflow. J. Phys. Oceanogr. its contribution to the Denmark Strait overflow. Prog. Oceanogr. 78,
31, 1904–1914. 12–28.
Bryden, H.L., Longworth, H.R. and Cunningham, S.A. 2005. Slowing Jonsson, S. 1999. The circulation in the northern part of the Denmark
of the Atlantic meridional overturning circulation at 25◦ N. Nature Strait and its variability. ICES CM, 9.
436, 655–657. Jónsson, S. and Valdimarsson, H. 2004. A new path for the Denmark
Dickson, R., Lazier, J., Meincke, J., Rhines, P. and Swift, J. 1996. Strait overflow water from the Iceland Sea to Denmark Strait. Geo-
Longterm coordinated changes in the convective activity of the North phys. Res. Lett. 31, L03305.
Atlantic. Prog. Oceanogr. 38, 241–295. Käse, R.H., Girton, J.B. and Sanford, T.B. 2003. Structure and variability
Dickson, B., Yashayaev, I., Meincke, J. and Turrell, B. 2002. Rapid fresh- of the Denmark Strait overflow: model and observations. J. Geophys.
ening of the deep North Atlantic Ocean over the past four decades. Res. 108, doi:10.1029/2002JC001548.
Nature 416, 832–836. Käse, R.H., Serra, N., Köhl, A. and Stammer, D. 2009. Mechanisms
Dickson, B., Dye, S., Jónsson, S., Köhl, A., Macrander, A. and co- for the variability of dense water pathways in the Nordic Seas. J.
authors. 2008, Arctic-Subarctic Ocean Fluxes: Defining the role of Geophys. Res. 114, C01013, doi:10.1029/2008JC004916.
the Northern Seas in Climate, Springer, Dordrecht, The Netherlands, Köhl, A. 2007. Generation and stability of a quasi-permanent vortex in
pp. 443–474. the Lofoten Basin. J. Phys. Oceanogr. 37, 2637–2651.
Dickson, R.R. and Brown, J. 1994. The production of North Atlantic Köhl, A., Stammer, D. and Cornuelle, B. 2007a. Interannual to decadal
deep water: sources, rates, and pathways. J. Geophys. Res. 99, changes in the ECCO global WOCE synthesis. J. Phys. Oceanogr. 37,
12319–12341. 313–337.
Eldevik, T., Straneo, F., Sando, A.B. and Furevik, T. 2005. Pathways Köhl, A., Käse, R.H., Stammer, D. and Serra, N. 2007b. Causes of
and export of Greenland Sea water. The Nordic Seas: An integrated changes in the Denmark Strait Overflow. J. Phys. Oceanogr. 37,
perspective (eds. H. Drange, T. M. Dokken, T. Furevik, R. Gerdes and 1678–1696.
W. Berger), Geophysikal Monography Series, AGU, 89–105. Lake, I. and Lundberg, P. 2006. Seasonal barotropic modulation of
Eldevik, T., Nilsen, J.E.Ø., Iovino, D., Olsson, K.A., Sandø, A.B. and the deep-water overflow through the Faroe Bank Channel. J. Phys.
co-authors. 2009. Observed sources and variability of Nordic Seas Oceanogr. 36, 2328–2339.
overflow. Nat. Geosci. 2, 406–410. Large, W.G. and Yaeger, S.G. 2004. Diurnal to decadal global forcing
Gaillard, F. G.,Autret, E., Thierry, V., Galaup, P., Coatanoan, C. and for ocean and sea-ice models: the data sets and flux climatologies.
co-authors. 2009. Quality control of large argo data sets. J. Atmos. NCAR Technical Note 105.
Ocean. Tech. 26, 337–351. Large, W.G., Williams, J.C. and Doney, S.C. 1994. Ocean vertical mix-
Furevik, T. and Nilsen, J.E. Ø. 2005. Large-scale atmospheric variabil- ing: a review and a model with a nonlocal boundary layer parametriza-
ity and its impact on the Nordic Seas ocean climate—a review in. tion. Rev. Geophys. 32, 363–403.
Tellus 62A (2010), 4You can also read