Modelling of the tsunami from the December 22, 2018 lateral collapse of Anak Krakatau volcano in the Sunda Straits, Indonesia
←
→
Page content transcription
If your browser does not render page correctly, please read the page content below
www.nature.com/scientificreports

                          OPEN     Modelling of the tsunami from the
                                   December 22, 2018 lateral collapse
                                   of Anak Krakatau volcano in the
Received: 24 April 2019
Accepted: 2 August 2019            Sunda Straits, Indonesia
Published: xx xx xxxx
                                   Stephan T. Grilli 1,2, David R. Tappin 3,4, Steven Carey2, Sebastian F. L. Watt5,
                                   Steve N. Ward6, Annette R. Grilli1, Samantha L. Engwell3, Cheng Zhang7, James T. Kirby                         7
                                                                                                                                                      ,
                                   Lauren Schambach1 & Muslim Muin8
                                   On Dec. 22, 2018, at approximately 20:55–57 local time, Anak Krakatau volcano, located in the Sunda
                                   Straits of Indonesia, experienced a major lateral collapse during a period of eruptive activity that began
                                   in June. The collapse discharged volcaniclastic material into the 250 m deep caldera southwest of the
                                   volcano, which generated a tsunami with runups of up to 13 m on the adjacent coasts of Sumatra and
                                   Java. The tsunami caused at least 437 fatalities, the greatest number from a volcanically-induced
                                   tsunami since the catastrophic explosive eruption of Krakatau in 1883 and the sector collapse of
                                   Ritter Island in 1888. For the first time in over 100 years, the 2018 Anak Krakatau event provides an
                                   opportunity to study a major volcanically-generated tsunami that caused widespread loss of life and
                                   significant damage. Here, we present numerical simulations of the tsunami, with state-of the-art
                                   numerical models, based on a combined landslide-source and bathymetric dataset. We constrain the
                                   geometry and magnitude of the landslide source through analyses of pre- and post-event satellite
                                   images and aerial photography, which demonstrate that the primary landslide scar bisected the Anak
                                   Krakatau volcano, cutting behind the central vent and removing 50% of its subaerial extent. Estimated
                                   submarine collapse geometries result in a primary landslide volume range of 0.22–0.30 km3, which is
                                   used to initialize a tsunami generation and propagation model with two different landslide rheologies
                                   (granular and fluid). Observations of a single tsunami, with no subsequent waves, are consistent
                                   with our interpretation of landslide failure in a rapid, single phase of movement rather than a more
                                   piecemeal process, generating a tsunami which reached nearby coastlines within ~30 minutes. Both
                                   modelled rheologies successfully reproduce observed tsunami characteristics from post-event field
                                   survey results, tide gauge records, and eyewitness reports, suggesting our estimated landslide volume
                                   range is appropriate. This event highlights the significant hazard posed by relatively small-scale lateral
                                   volcanic collapses, which can occur en-masse, without any precursory signals, and are an efficient and
                                   unpredictable tsunami source. Our successful simulations demonstrate that current numerical models
                                   can accurately forecast tsunami hazards from these events. In cases such as Anak Krakatau’s, the
                                   absence of precursory warning signals together with the short travel time following tsunami initiation
                                   present a major challenge for mitigating tsunami coastal impact.

                                   In the evening of December 22, 2018, a lateral collapse on the southwest flank of Anak Krakatau (AK) volcano,
                                   Indonesia, generated a tsunami along adjacent coastlines in which at least 437 people died1. This was the most
                                   damaging volcanically-generated tsunami since the 1883 eruption of Krakatau, which killed 36,000 people2,3,
                                   and the lateral-collapse generated tsunami at Ritter Island, Papua New Guinea, in 18884. Over the past 20 years,

                                   1
                                     Department of Ocean Engineering, University of Rhode Island (URI), Narragansett, RI, USA. 2Graduate School of
                                   Oceanography, University of Rhode Island (URI), Narragansett, RI, USA. 3British Geological Survey (BGS), Nottingham,
                                   UK. 4University College London (UCL), London, UK. 5School of Geography, Earth and Environmental Sciences,
                                   University of Birmingham (UB), Birmingham, UK. 6University of California Santa Cruz (UCSC), Santa Cruz, CA, USA.
                                   7
                                    Center for Applied Coastal Research, University of Delaware (UD), Newark, DE, USA. 8Bandung Institute of Technology,
                                   Bandung, Indonesia. Correspondence and requests for materials should be addressed to S.T.G. (email: grilli@uri.edu)

        Scientific Reports |   (2019) 9:11946 | https://doi.org/10.1038/s41598-019-48327-6                                                                1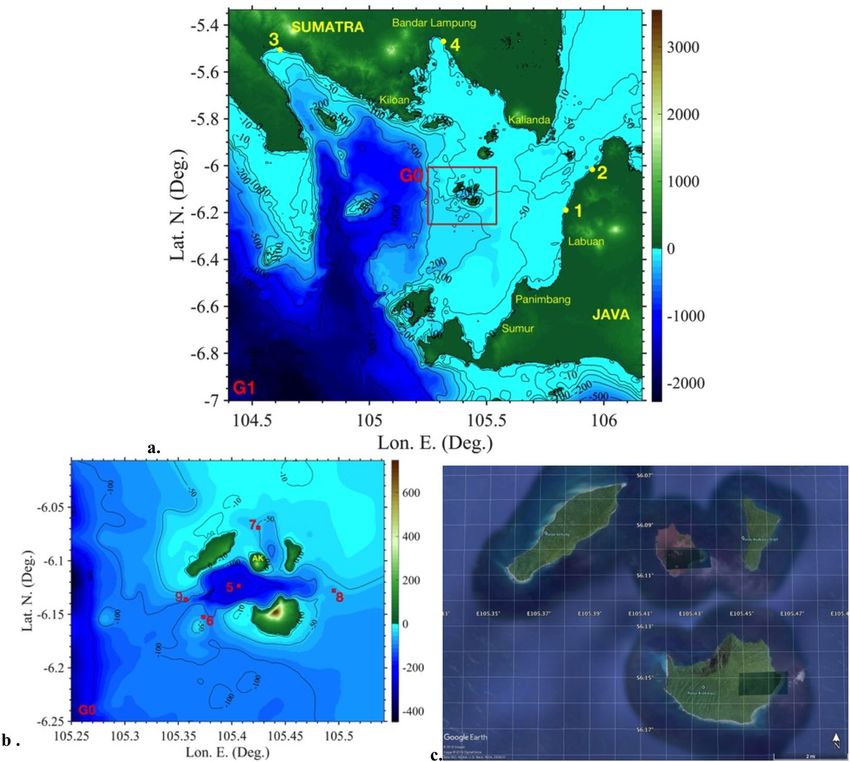
www.nature.com/scientificreports/                                                                www.nature.com/scientificreports

                           Figure 1. Sunda Straits area, for AK collapse and tsunami simulations. (a,b) Bathymetry/topography (colour
                           scales and contours in meter; Mean Sea Level bathymetry/topography dataset obtained from12, +1.5 m for
                           tide), tide (1–4) and wave gauges (5–9) (Table 1): (a) FUNWAVE G1 (100 m horizontal resolution grid); (b)
                           NHWAVE G0 grid (90 m horizontal resolution and 5 vertical σ-layers), with footprint marked by red box in (a).
                           (c) Pre-collapse image showing AK and Sertung (W), Panjang/Kitjil (E), and Rakata/Krakatau. Maps in (a,b)
                           were produced by the authors based on the bathymetry/topography dataset, using MATLAB version 2017b (c),
                           map data is from: GOOGLE EARTH, 2019 DigitalGlobe (Data: SIO, NOAA, U.S. Navy, NGA, GEBCO).

                           catastrophic tsunamis in Papua New Guinea (1998), the Indian Ocean (2004), and Japan (2011) have driven
                           major advances in understanding of earthquakes and submarine landslides as tsunami sources, from develop-
                           ments in constraining source mechanisms, their geographical distribution, and tsunami numerical modelling
                           capability. Tsunamis from volcanic sources, including both eruptions and landslides, have resulted in significant
                           losses of life and property5,6, accounting for 20% of all volcanic fatalities over the past 400 years7, but there are no
                           direct observations of a large-scale volcanic tsunami since that at Ritter Island8. Tsunamis from lateral collapses
                           have been widely modelled, including very large landslide scenarios on ocean islands e.g.,9–11, as well as smaller
                           scale landslides more comparable to the AK collapse12–14. However, because of the paucity of historical examples
                           the results of these models are not fully validated, and aspects of both landslide source mechanisms e.g.,15–17 and
                           tsunami behaviour e.g.,10,11 remain poorly understood and challenging to model.
                               Anak Krakatau (Fig. 1), a small composite volcanic cone that developed within the 250 m deep caldera of
                           Krakatau, emerged subaerially in 192818–20. It is situated on the northeast margin of the caldera wall and is aligned
                           with the feeder vents of the 1883 Krakatau eruption2. During the past 90 years, it has grown from a submarine vol-
                           cano to a subaerial edifice with a pre-collapse height of about 335 m. Retreats of the coastline to the SW by several
                           hundred metres in 1934, 1935 and 195020 align with the 2018 collapse and imply instability of the edifice on the
                           SW side, as a result of its position on the submerged scarp of the 1883 caldera. Early activity at Anak Krakatau was
                           dominated by phreatomagmatic explosions. The first lava flows were erupted between 1960 and 1963 as the vent
                           site became fully subaerial21 and numerous subsequent eruptions have mostly featured expansion of the island
                           by the growth of lava deltas and a steep sided central pyroclastic cone22. A small tsunami ~2 m high was recorded
                           on Rakata (the southernmost and largest island of the Krakatau archipelago) during a subaerial eruption in 1981,
                           and inferred to originate from a small flank landslide, highlighting the potential instability of the southwest flank
                           of the volcano18. Apart from this event, no other tsunamis from the volcano have been reported. The most recent

Scientific Reports |   (2019) 9:11946 | https://doi.org/10.1038/s41598-019-48327-6                                                               2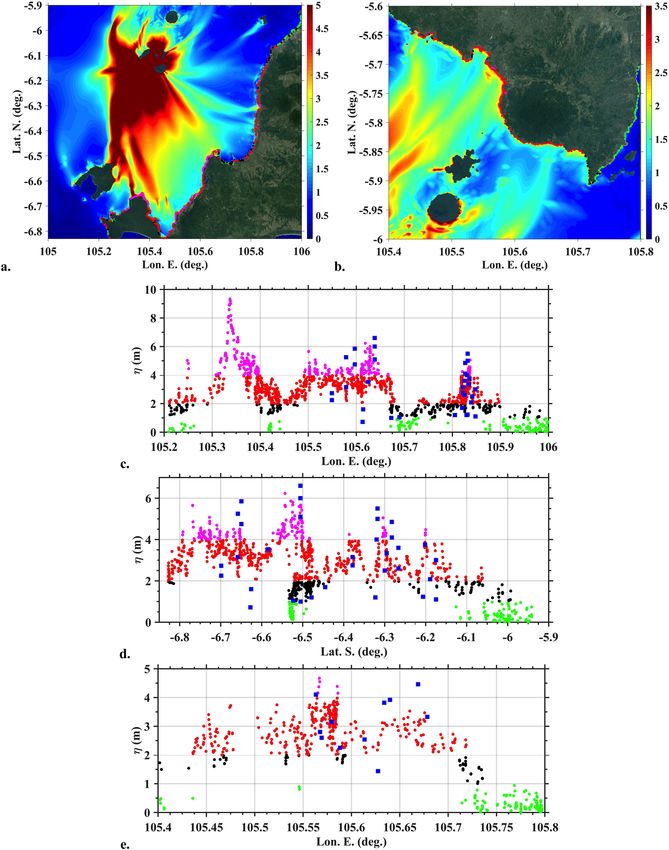
www.nature.com/scientificreports/                                                                       www.nature.com/scientificreports

                            Tide/wave Gauges       Lon E.           Lat N.          Measured      Simulated      Depth
                            (Fig. 1a,b)            (Deg.)           (Deg.)          Arrival (s)   Arrival (s)    (m)
                            1. TG: Serang, Jambu   105o 50′ 27.6″   −6o 11′ 21.5″   1920          1870            12.1
                                                      o
                            2. TG: Ciwandan        105 57′ 10.8″    −6o 01′ 02.5″   2570          2500             3.7
                            3. TG: Kota-Angung     104o 37′ 08.5″   −5o 30′ 01.2″   2340          2240             3.7
                            4. TG: Panjang         105o 19′ 06.1″   −5o 28′ 08.7″   3420          3390             3.9
                            5. WG                  105.4066o        −6.1234o        N/A           28             256.9
                            6. WG                  105.3733o        −6.1524o        N/A           130             67.4
                            7. WG                  105.4246o        −6.0691o        N/A           70              49.8
                            8. WG                  105.4954o        −6.1279o        N/A           205             63.3
                            9. WG                  105.3571o        −6.1361o        N/A           145             95.5

                           Table 1. Lat-Lon/depth and measured45/simulated (0.27 km3 volume; granular slide) arrival times at Tide
                           Gauges 1–4 (TG; Figs 1a, 5a–d; see Supplementary #3), and location/depth at numerical Wave Gauges 5–9 (WG;
                           Fig. 1b). In simulations, AK collapse is assumed to take place at 20:57′ local time (UTC + 7). Listed depth is
                           that in model grid G1 assuming a +1.5 m tide elevation. Difference in arrival time at tide gauges are 30–100 s,
                           compared to the 1 min data interval. Note, as shown in Fig. 5a–d, the simulated arrival time (first crest) is closely
                           identical for both rheologies (viscous or granular collapse); hence a single number is listed in the table. N/A:
                           Not Applicable.

                           period of volcanic activity of AK started in June 2018 and continued into December, producing Strombolian
                           explosions, lava flows, and ash plumes reaching altitudes of up to 5 km23. On Dec. 22, 2018, a major lateral col-
                           lapse occurred on AK’s southwest flank, which discharged volcaniclastic material into the sea and triggered a
                           destructive tsunami24,25. Based on seismic records26, eyewitness reports e.g.24, and the agreement of modelled
                           waves with tsunami arrival times at tide gauges (Ina-COAP, 2019; see below; Fig. 1, Table 1), the collapse is esti-
                           mated to have taken place at 20:55′–57′ (UTC + 7). Within 30 minutes, the tsunami flooded the coasts of west Java
                           and southeast Sumatra, causing up to 13 m runups. 13,000 people were injured, 33,000 displaced, and thousands
                           of buildings destroyed1,27,28. The tsunami struck near high tide (about 1.5 m over Mean Sea Level (MSL)) thereby
                           increasing its impact.
                               In this paper, we use high-resolution satellite imagery and aerial photography to develop a model of the AK
                           lateral collapse scenario as a basis for numerical tsunami simulation. Tsunami simulation results are tested against
                           time series of sea surface elevation recorded at tide-gauge, field observations of tsunami flow depth and inunda-
                           tion along the coasts of Java and Sumatra, and eyewitness accounts. Here, for the first time since 1883, we have an
                           opportunity to test state-of-the-art tsunami modelling methodologies against direct observations constraining
                           both volcanic-tsunami source parameters and observations of the generated waves. With remarkable prescience,
                           a tsunami from a hypothetical AK collapse was modelled by12; the collapse in their model was to the SW, with a
                           volume of 0.28 km3, and they predicted tsunami wave heights and arrival times along surrounding coastlines. Our
                           work provides an opportunity to test the validity of this hypothetical scenario from an actual event. The results
                           presented here constrain the style of the AK lateral collapse, providing an analogy for future events at other vol-
                           canic islands, and test current landslide-tsunami models, thus forming an important contribution towards assess-
                           ing tsunami hazard from similar future events and developing improved volcanic-tsunami mitigation strategies.

                           Results
                           The 22nd December AK collapse volume and geometry. Satellite photographs and radar images pro-
                           vide the key evidence from which we interpret the AK 2018 collapse geometry and volume. Oblique aerial pho-
                           tographs from December 23rd are particularly important (Supplementary #1)29,30, because they unambiguously
                           identify breaks in the pre-collapse coastline that mark the edge of the failure scarp. The photographs show a sharp,
                           steep-sided cut of the coastal lava deltas to the NW and SE of the pre-collapse vent site. These breaks in the coast
                           constrain the margins of the primary collapse scar on the Sentinel-1A satellite radar images from December 23rd
                           (Western Indonesian Time) and ALOS-2 images on December 24th 31,32, which confirm the form of the land-
                           slide headwall and provide critical observations of the post-collapse coastline. Our interpretations of these radar
                           images show that the opening angle of the headwall scar was very wide, defining a broadly linear collapse that
                           cut behind the vent. Based on the coastlines defined in Fig. 2, the collapse reduced the subaerial area of the island
                           by 49%. Although the photographs and radar images provide evidence on the subaerial part of the collapse, to
                           produce such a dramatic change in the volume and shape of the island, the collapse plane evidently extended
                           below sea level. This resulted in the submergence of the vent site, as can be seen from the intense Surtseyan explo-
                           sive eruptions observed on 23rd December29,30. In addition to the observations of the subaerial headwall shape
                           from the satellite data, the Surtseyan explosions provide an approximate constraint on the depth of the landslide
                           basal plane at the vent site. Historical observations suggest Surtseyan activity is characteristic of vent depths ≤50
                           m33–35. To estimate the geometry of the landslide basal plane (and hence the collapse volume), we have combined
                           our constraints on the subaerial headwall with an assumed depth of 25 m at the vent site. We have taken a more
                           conservative value than the 50 m depth noted above, based on the observation that debris rapidly accumulated
                           around the vent site in the days following the collapse, reconstructing the subaerial island in this region. Finally,
                           we have restricted the extent of the basal plane to lie within the submarine bulge of Anak Krakatau evident in
                           bathymetry36 (i.e., we assume that the collapse was confined to the AK edifice, rather than cutting into older rocks

Scientific Reports |   (2019) 9:11946 | https://doi.org/10.1038/s41598-019-48327-6                                                            3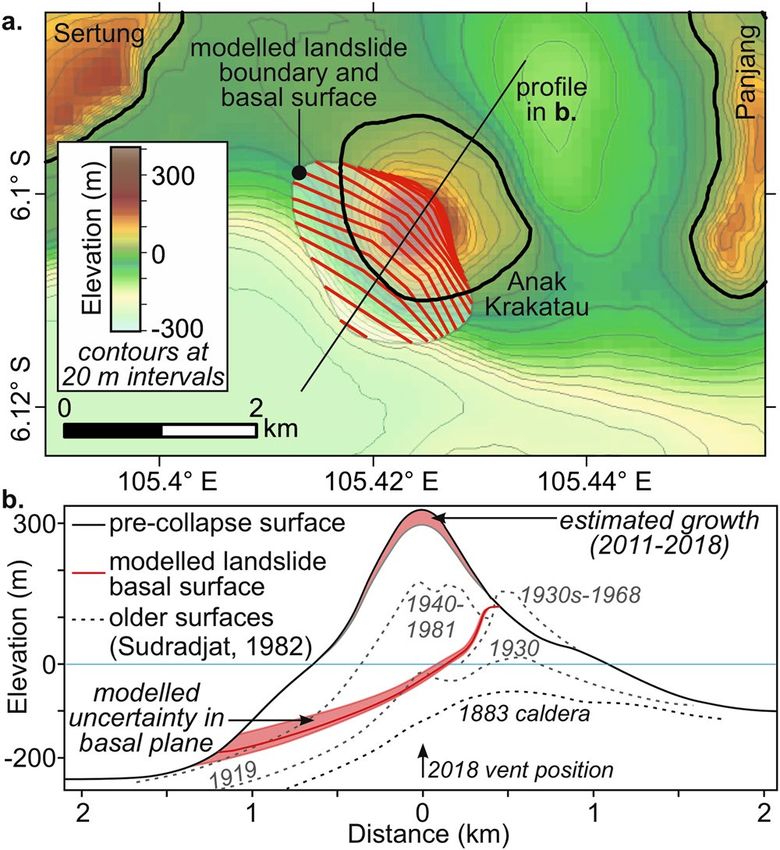
www.nature.com/scientificreports/                                                              www.nature.com/scientificreports

                           Figure 2. Morphological changes at Anak Krakatau spanning the December 22nd 2018 lateral collapse. Features
                           are interpreted from various satellite images29–32.

                           of the caldera margin). These assumptions result in a concave and gently dipping form to the basal plane (Fig. 3),
                           typical of subaerial lateral collapse scars36,37. Although the submarine form of the landslide scar is uncertain,
                           a substantially smaller collapse than predicted by the above assumptions would require a sub-horizontal sub-
                           merged basal plane, which is hard to reconcile with the wide collapse opening angle. We also have no evidence to
                           infer a substantially deeper collapse scar, particularly given the rapid subaerial emergence of post-collapse debris
                           around the vent site. We therefore consider our approximation to be appropriate given an absence of additional

Scientific Reports |   (2019) 9:11946 | https://doi.org/10.1038/s41598-019-48327-6                                                           4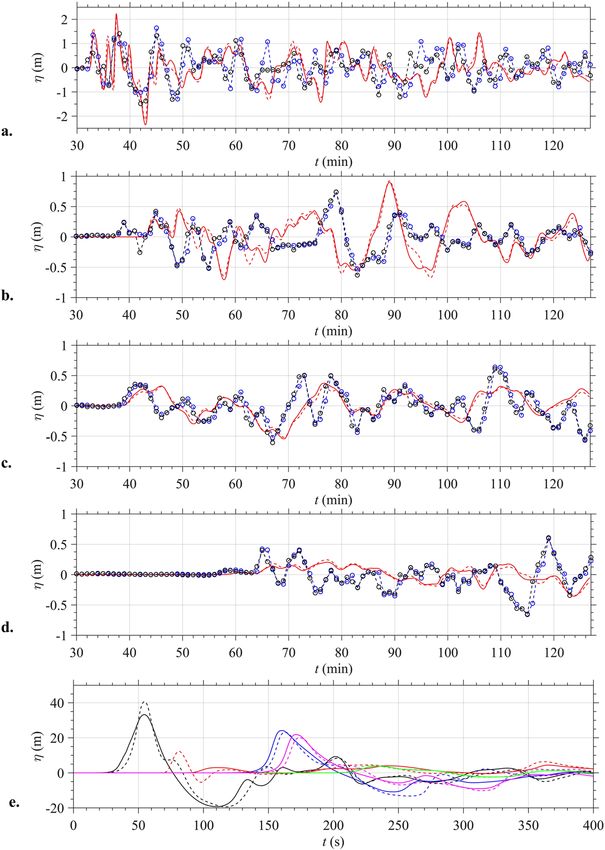
www.nature.com/scientificreports/                                                                www.nature.com/scientificreports

                           Figure 3. Geometry of modelled AK collapse. (a) Pre-collapse bathymetry and topography (colour scale
                           and contours) of parts of Sertung and Panjang, and AK with superimposed geometry of collapsed volume
                           (perimeter and contour levels at 20 m intervals); (b) Transect in SW direction (marked by black line in a)
                           showing AK’s historical growth, the failure surface of the modelled most likely 0.27 km3 volume scenario
                           (consistent with Fig. 2), with associated uncertainty (two additional volumes are modelled for the upper and
                           lower failure surfaces, with a 0.22 (−20%) and 0.30 km3 (+10%) volume, respectively). Maps and surfaces were
                           created by the authors with ArcMap10.2, using the dataset obtained from12 and the interpretation in Fig. 2.

                           post-collapse bathymetric or geophysical constraints on the basal plane (noting that this plane is already likely to
                           have been partially buried).
                              Because the earliest post-collapse satellite images and aerial photographs are from ~12 hours after the event,
                           they provide no evidence on whether the collapse was a single event or occurred in stages. However, the tsunami
                           observations, primarily the single wave train reported and absence of observed subsequent tsunamis, suggest one
                           main phase of failure. This provides support for our numerical tsunami modelling based on a single collapse and
                           using the headwall geometry derived from the 23rd December images.

                           Landslide tsunami generation and impact modelling in the near-field. Bathymetric and top-
                           ographic data at an approximate 100 m resolution were obtained from the work of12, which was interpolated
                           to set-up model grids (90 and 100 m resolutions; Fig. 1a,b and see details below). Comparing Fig. 1b to the
                           pre-collapse aerial image of Fig. 1c shows that AK and the coastline of the three surrounding islands of Sertung,
                           Panjang, and Rakata are well resolved in our grids. A simplified landslide headwall shape and basal plane geom-
                           etry was defined on this grid based on the constraints outlined above. The likeliest landslide basal plane defined
                           by these constraints is shown in Fig. 3 (solid red line), together with our estimate of the associated uncertainty
                           (shaded red). The modelled collapse volume based on our best-estimated failure surface is calculated at 0.27 km3.
                           To investigate the effects of the failure surface uncertainty on the collapse volume, we also considered and sim-
                           ulated collapse volumes corresponding to the upper and lower bounds of the shaded uncertainty area in Fig. 3,
                           which yielded 10% larger (0.30 km3) and 20% smaller (0.22 km3) volumes. Our best estimated collapse volume
                           is similar to that assumed by12, albeit for a different failure plane. The three failure surfaces and resulting collapse
                           geometry and volumes were used to initialize simulations with a three-dimensional (3D) slide and hydrodynamic
                           model of tsunami generation and propagation (“Non-Hydrostatic WAVE model” NHWAVE38–40; see methods), as
                           detailed below. For each of the 3 selected collapse volumes and corresponding geometry, the 3D model was used
                           in the near-field (Fig. 1b; grid G0, 90 m horizontal resolution with 5 boundary fitted vertical layers) to simulate
                           the lateral collapse landslide and the corresponding tsunami generation.
                               As the actual collapse mechanism is unknown, for each collapse volume, simulations were performed assum-
                           ing two alternative rheologies (granular material and dense viscous fluid), which were available in this model
                           (animations of results are provided in Supplementary #2 for the 0.27 km3 volume scenario). Using these two
                           rheologies allowed assessment, to some extent, of the effect on tsunami simulations of the epistemic uncertainty
                           associated with different model physics, while the range of simulated collapse volumes allowed assessment of the
                           effect on tsunami simulations of the aleatory uncertainty associated with selecting a failure surface and resulting
                           collapse volume.

Scientific Reports |   (2019) 9:11946 | https://doi.org/10.1038/s41598-019-48327-6                                                               5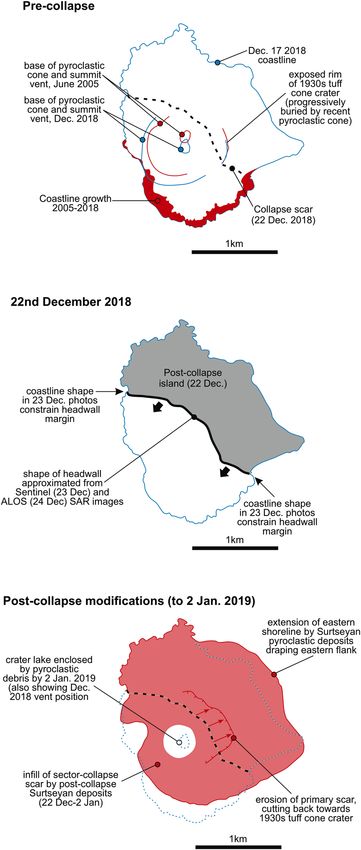
www.nature.com/scientificreports/ www.nature.com/scientificreports
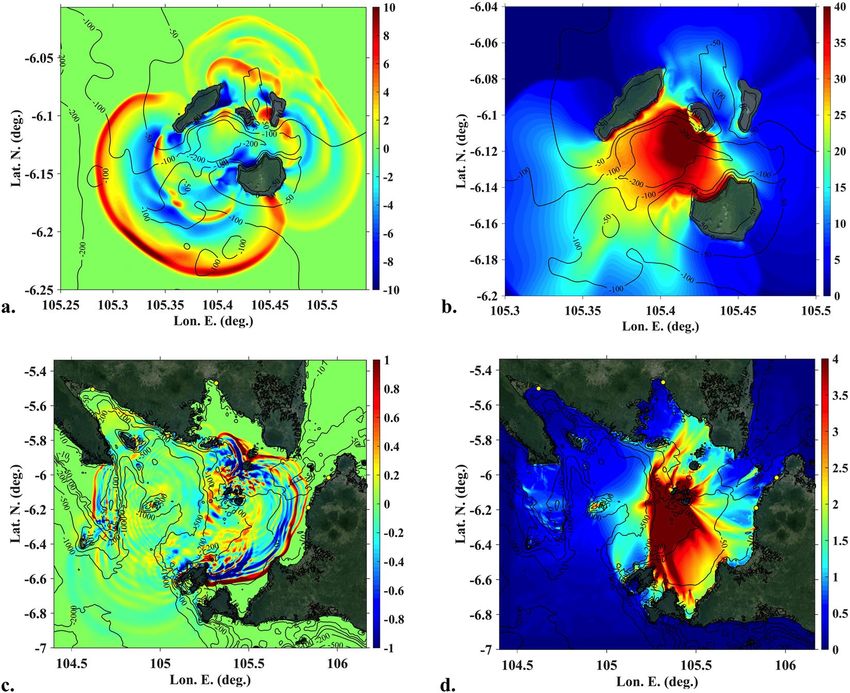
Figure 4. Tsunami surface elevations for AK collapse. (a,b) Instantaneous and maximum surface elevations
(colour scale in meter), respectively, simulated with NHWAVE in grid G0, for the 0.27 km3 granular AK
collapse at and up to 410 s; (c) Instantaneous surface elevation simulated with FUNWAVE-TVD at 1810 s in
grid G1; (d) Envelope of NHWAVE/FUNWAVE- TVD SE up to 7,610 s. Reference level is MSL + 1.5 m (tide
elevation in Marina Jambu45 at the time of tsunami arrival). Maps in (a–d) were produced by the authors based
on the bathymetry/topography dataset, using MATLAB version 2017b; topography from GOOGLE EARTH
georeferenced satellite images was embedded in these maps using an API key: GOOGLE EARTH, 2019
DigitalGlobe.
For each rheology, animations of model results show the 3D slide motion with or without the corresponding
wave generation, which allows for easier identification of the slide in the latter case (Supplementary #2). For both
rheologies, results show a rapid collapse of AK’s cone, causing a thick flow of material to the SW, which gradually
fills the bottom of the caldera, together with the lateral runout of a thinner layer of slide material. With superim-
posed wave generation, animations show that a leading elevation wave nearly 50 m high is first generated near
AK, that travels in a dominant SW direction, followed by a deeper negative elevation wave at the location formerly
occupied by AK’s cone. Whereas the leading elevation wave propagates south-westward away from AK, interact-
ing with the bathymetry and the nearby islands on which it runs up, the deep over 50 m trough near the volcano
rebounds as a backwash that causes an over 40 m runup onto AK’s collapse scar. Subsequently, waves reflected
from nearby islands propagate back onto AK and onto other islands. Both these reflected and initial waves cause
significant runup on the most exposed parts of the three surrounding islands of Sertung to the W, Panjang to the
E, and Rakata to the S (Fig. 1b,c, and Supplementary #4).
For the 0.27 km3 volume likeliest scenario, Fig. 4a,b show instantaneous surface elevations computed in grid
G0 at time t = 410 s for the granular slide, and the envelope of maximum elevation up to this time, respectively. In
Fig. 4a, large leading waves (3–10 m high) are seen to propagate in all directions, but preferentially in the SW/SSE,
N and ENE directions. Surface elevation time series computed for both rheologies at numerical wave gauges 5–9
(Fig. 1b; Table 1) up to 410 s (Fig. 5e) confirm these observations and show overall a good agreement with each
other, particularly further away from AK (e.g., leading elevation waves in gauges 6 and 9). However, the granular
slide causes significantly larger waves at gauge 7 than the viscous slide, which appears to result from the different
behaviour and runout of the slide material in the northern direction (see animations in Supplementary #2). At
gauge 5, close to AK in the SW direction, the leading waves are 33 and 42 m high, for the viscous and granular
slides respectively. At gauges 6 and 9, further away from the volcano in the same direction, these are closer, in
the 20–25 m range. At gauge 7 in the N direction, wave elevation reaches 5 and 13 m for the viscous and granular
rheology, respectively, and at gauge 8 in the E direction, elevation reaches 6 and 7 m. At all numerical wave gauges,
the large leading waves are followed by smaller oscillations, with a short 100–120 s period. Surface elevation time
Scientific Reports | (2019) 9:11946 | https://doi.org/10.1038/s41598-019-48327-6 6www.nature.com/scientificreports/ www.nature.com/scientificreports
Figure 5. Surface elevation time series at: (a–d) Tide Gauges 1–4 (TG; Table 1; Fig. 1a) computed with
FUNWAVE in grid G1; symbols are detided observations using 2 different sensors45. (e) Numerical Wave
Gauge 5–9 (WG; Table 1; Fig. 1b) computed with NHWAVE in grid G0: (black) 5, (blue) 6, (red) 7, (green) 8,
(magenta) 9. Time t = 0 is estimated collapse time, 20:57′ local time (UTC + 7). Computations are for (solid)
viscous slide, or (dashed) granular slide.
series simulated for the three volumes and the two rheologies are compared at the five numerical wave gauges in
Fig. S.6d–i Supplementary #3). Overall, results are consistent with those of Fig. 5e, with a larger effect of model
rheology than collapse volume (within the tested range) on wave generation in the near-field.
The surface elevation envelope of Fig. 4b shows a 25–40 m maximum runup along AK’s SW coast. On the
directly exposed steep shores of the nearby islands of Rakata and Sertung runup reaches up to at least 45 m.
On Panjang, which is located behind AK’s main collapse direction, due to wave refraction around the volcano
(see animations in Suppl. #2), runups still reach 15–25 m. Aerial images from a drone survey on Jan. 11th41 as
well as coastline changes evident in ALOS-242 and Planet.com43 satellite images, show clear signs of large runup
on the order computed with the model, on the E coast of Sertung, the W/SW coast of Panjang and NW coast
of Rakata (see details in Suppl. #4). On Panjang, tree trunks are still in-situ, but there is very severe vegetation
damage across the entire island from post-collapse, phreatomagmatic ash deposition, which obscures evidence of
tsunami-related damage in the north.
Tsunami propagation and coastal impact modelling in the far-field. The 2D model
FUNWAVE-TVD (Total Variation Diminishing version of the fully nonlinear Boussinesq wave model
FUNWAVE–TVD44; see methods) is used (Fig. 1a; grid G1, 100 m resolution) to simulate tsunami propagation
from the near-field to the surrounding coasts in the far-field; the model is initialized using NHWAVE results such
as shown in Fig. 4a. As for the near-filed simulations, the three different collapse volumes were simulated for both
Scientific Reports | (2019) 9:11946 | https://doi.org/10.1038/s41598-019-48327-6 7www.nature.com/scientificreports/ www.nature.com/scientificreports
rheologies. Figure 4c shows instantaneous surface elevations computed at t = 1810 s for the 0.27 km3 granular
collapse, when the leading tsunami waves are about to reach the Tide Gauge 1 at Marina Jambu45, on the W coast
of Java (Fig. 1a; Table 1). At this time, the pattern of tsunami waves in the Sunda Straits is already quite complex,
with waves propagating in many directions from their interaction with the bathymetry, the coastline, and other
islands. This pattern would become even more complex as time increases, due to further multiple wave reflections
within the Straits. Figure 4d shows the envelope of maximum surface elevations computed up to t = 7,610 s. As a
result of the initial directionality of the generated wave train and bathymetric focusing, in particular by the steep
linear scarp that divides the shallow eastern half of Sunda Straits from the much deeper Semangka trough to the
west, wave elevations are greater in a number of narrow, preferential, directions, particularly in the S, SE, E and
NE directions; the model predictions of tsunami coastal impacts are also larger at coastal sites in those directions.
For the 0.27 km3 volume likeliest scenario (granular case), Fig. 5a–d compare surface elevation time series
computed for the viscous and granular slides to field observations made at Tide Gauges 1–445 (Fig. 1a; Table 1).
The surface elevation data recorded at 1 min intervals by two functioning sensors was detided using a Butterworth
filter (Supplementary #3). Overall, there is a good agreement between the observed and simulated time series,
particularly earlier in the time series. As summarized in Table 1, arrival times at each gauge are predicted to
within 30–100 s of observations. Considering the 1 min interval of tide gauge data, this is quite a small discrep-
ancy. Although the phase lag between simulations and observations increases with time, the trough to crest eleva-
tion of the largest waves is well captured in simulations. Additionally, each tide gauge is located within a harbor/
marina or close to or behind protective coastal structures (Supplementary #3), whose complex geometry is not
represented in the 100 m resolution grid G1. These surrounding structures would have induced reflections and
seiching that significantly affected the recorded signal. Finally, as reported by eyewitnesses, simulations predict
that multiple large waves of short period (initially 5–8 minute period) impacted the coast, with the second or later
waves being the largest.
Time series of surface elevation were also computed at the four Tide Gauges for the two additional collapse
volumes and each rheology. Only small differences could be observed in these far-field results between the six
scenarios (Fig. S.6a–d in Supplementary #3), indicating that our predictions of the tsunami coastal impact are
not very sensitive to finer details of the collapse scenario assumed for Anak Krakatau (i.e., both small changes
in volume and differences in rheology). Hence, given bathymetric/topographic data and model grids, far-field
tsunami impact results are quite robust. Finally, we also note that the arrival time of the first elevation wave at
each tide gauge is closely identical for each scenario (Fig. 5a–d, and Fig. S.6a–d in Supplementary #3), indicating
that the tsunami travel time to shore is dominated by the wave celerity, which is primarily dependent on water
depth and, for these fairly short waves, to some extent, also on wave frequency. For the very large initial waves
generated near the volcano, amplitude dispersion effects caused by wave nonlinearity will also affect tsunami wave
celerity and thus travel time. However, results at the near-field numerical wave gauges show (Fig. 5e, and S.6e–i in
Supplementary #3) that wave time series are quite similar in amplitude (and frequency) and hence effects of wave
nonlinearity on tsunami celerity will also be similar. As a result of these observations, a single arrival time at the
Tide Gauges was reported in Table 1 for the six simulated scenarios.
Figure 6a,b show zoom-ins of the envelope of maximum surface elevation of Figs 4d, 6c–e show the corre-
sponding flow depths at the shore, obtained by interpolating the envelope along the 0 m contour level, for two
highly impacted sections of coast in West Java and Sumatra north of Anak Krakatau. The latter results are com-
pared to data from an initial post-event survey27 (note, the coordinates of surveyed data points were inferred
from survey data maps using GOOGLE EARTH). Simulated and measured tsunami flow depths are found in
good agreement, particularly in view of the fairly coarse model grid G1 used here. A good agreement is found in
particular for the larger flow depth values measured at particular coastal sites, that result from the initial tsunami
directionality and subsequent strong bathymetric focusing discussed above (note, at the time our work was per-
formed, field data was lacking from the south-western coast of Java (Panaitan and Ujong Kulon) where the largest
flow depths of 9.5 m are simulated in Fig. 6c). Additional closer zoom-ins of maximum runups are consistent with
field observations and eyewitness reports (see Fig. S.3 in Supplementary #2).
Discussion
The potential tsunami hazard from the collapse of AK was recognised before the 2018 lateral collapse12,18. Several
factors may have predisposed the volcano for collapse of its southwest flank. First, its position on the northeast
margin of the 1883 caldera has resulted in steeper submarine slopes to the southwest compared to the north-
east20,36. Second, there has been a gradual shift in vent position during its evolution towards the southwest and
the caldera interior20. Third, significant lava flow deltas have extended the base of AK to the west, which overlie
potentially weak and altered volcaniclastic material produced by the Surtseyan activity of 1927–1960 and later
hyaloclastites formed by ocean-entering lava flows as the lava deltas expanded. Finally, the very rapid growth of
the volcano during the last 90 years had built a steep-sided summit cone consisting dominantly of unstable vol-
caniclastic material46.
Despite uncertainties in the volume and rheology of the collapsed material, the effects of which were esti-
mated in our simulations based on six scenarios, the good correspondence between the predicted and observed
wave characteristics in the far-field at the coast, flow depths, and runups, confirms the relevance of the proposed
geometric model for the collapse. In particular, the modelling is consistent with a tsunami source of 0.22–0.30
km3, as inferred from our interpretation of post-collapse imagery (Figs 2, 3). Combined with the observation of
a single phase of tsunami inundation, our results support an interpretation of an en masse failure of the SW flank
of Anak Krakatau, rather than a more piecemeal process, and suggest that this was necessary to generate the
observed tsunami. Our results also suggest that significant portions of the submarine flank of AK were involved
in the landslide. As identified previously by12 the mechanism of failure (for example, whether a landslide occurs
in a multi-stage retrogressive process) is important in determining the characteristics of the generated tsunami,
Scientific Reports | (2019) 9:11946 | https://doi.org/10.1038/s41598-019-48327-6 8www.nature.com/scientificreports/ www.nature.com/scientificreports
Figure 6. Maximum surface elevations and flow depth at the shore (along 0 m contour), simulated for the
0.27 km3 scenario (granular slide) based on results of Fig. 4d, in two highly impacted areas (a,b). For clarity of
their drawing in (a,b), four arbitrary height classes were selected for bullets in (c–e). (a,b) Coastal data point
locations (coloured bullets) for flow depths plotted in (c,d,e), respectively, shown over the maximum surface
elevation (colour scale in meter). (c,d) Flow depth calculated for area (a) (for clarity same results were plotted
as a function of Lon. or Lat.); and (e) area (b). Level datum is MSL + 1.5 m. Blue square symbols indicate data
measured in field surveys27. Maps in (a,b) were produced by the authors using MATLAB version 2017b ;
topography from GOOGLE EARTH georeferenced satellite images was embedded in these maps using an API
key: GOOGLE EARTH, 2019 DigitalGlobe.
particularly in the near-field. In this instance, our results confirm that failure had to be sufficiently rapid to repre-
sent a single tsunami source, which is consistent with the observed tsunami wave train. In addition, based on our
simulations, it is not necessary to invoke any other possible tsunami-generating mechanism, such as a lateral blast
or submarine explosion, to explain the magnitude and intensity of the tsunami.
It remains unclear what role eruptive activity had in triggering the lateral collapse. The collapse occurred
several months into an eruption phase that was relatively intense but comparable in style to the activity that has
Scientific Reports | (2019) 9:11946 | https://doi.org/10.1038/s41598-019-48327-6 9www.nature.com/scientificreports/ www.nature.com/scientificreports
characterised preceding decades, and there was no clear indication of increasing or anomalous activity in the days
or weeks preceding the collapse23,25. Although a major change in eruptive behaviour, in the form of intense phrea-
tomagmatic explosions, occurred after the collapse, current observations cannot identify whether this change was
a response to the collapse, or whether an incipient change in behaviour occurred in the run-up to the collapse and
may thus have acted as a trigger for failure. Given that there are examples of volcanic lateral collapses which were
not associated with magmatic eruptions47, it is plausible that the collapse was simply associated with a critical
instability arising from the long-term rapid growth and local topographic and geological characteristics of AK.
Numerical simulations of six collapse scenarios, including both slide and tsunami generation, and propaga-
tion to shore, were performed that covered the range of uncertainty in estimated collapse volume, for two differ-
ent slide rheologies (granular material and dense viscous fluid). Overall, results showed that waves generated in
the near-field were quite similar for each scenario, particularly in the dominant direction of propagation (SW/
SSE) (Figs 5e, S.6e–i). This similarity was even more pronounced for far-field results, as time series of surface
elevations simulated at the four tide gauges were very close for each scenario (Figs 5a–d, S.6a–d). This “loss of
memory” of the details of the tsunami source, as a tsunami propagates away from it is expected48. Nearshore, this
effect is even more pronounced as a result of the strong bathymetric control on the refraction and shoaling of
tsunami waves48. Given the relatively minor effect of both the collapse volume and slide rheology on the far-field
tsunami impact (a feature already pointed out in the hypothetical scenarios simulated by12), simulation results
were mostly shown here in detail and compared to field data for the likeliest collapse scenario (0.27 km3), assum-
ing a granular rheology. This also implies that the limited choice of two model rheologies was adequate to estimate
the far-field tsunami impact. A good agreement with field data was observed for the arrival time and elevation of
the first few waves at tide gauges, as well as for the flow depth at the shore, which confirmed the relevance of the
estimated collapse scenario(s) and the accuracy of numerical simulations with the NHWAVE/FUNWAVE-TVD
model suite. The latter implies that a similar modelling approach could be applied to estimate tsunami hazard
from future hypothetical volcanic collapses at other locations. Although these models have been well validated
and benchmarked against laboratory data and some field case studies, to date, they had not been applied to a
well-documented large scale volcanic collapse such as AK’s.
One of the most significant developments following the AK eruption is the rapid post-collapse regrowth of the
volcanic edifice by Surtseyan activity, which in the space of a few weeks significantly modified the morphology
of the collapse scar. The rapidity of AK’s rebuilding following the collapse signals the potential for future col-
lapse. Seawater gained access to the vent in the immediate post-collapse period, generating distinctive Surtseyan
ash plumes and in a sense resetting the evolution of the volcano back to the type of activity occurring in the
1930–1960 period. The rebuilding has already led to an enclosed crater lake, and it is likely that further activity
will rapidly establish a new cone, with a transition back to magmatic eruptions and lava effusion. The southwest
submarine flank is again being supplied with unconsolidated volcaniclastic material and if lava flows extend
the coast in this direction, they will overlie these weaker lithologies, as was the situation prior to the December
2018 failure. AK’s rapid regrowth emphasizes the need to monitor its activity by the acquisition of satellite data,
as well as marine surveys to better determine submarine bathymetry. In both volume and volcano-tectonic
setting, the AK event is broadly similar to lateral collapse-generated tsunamis at other arc volcanoes including
Oshima-Oshima 1741, Unzen 1792, Ritter Island 1888, and Harimkotan 19305,7,49–52. These historical events sug-
gest that tsunami-generating volcanic landslides >0.1 km3 have a global recurrence interval of less than 100 years.
Although there are likely to be differences in collapse precursors, dominant lithologies and the style of landslide
emplacement between all events e.g.16,51, the AK lateral collapse is a modern equivalent of these historical events.
As such, it is significant both in improving our understanding of the mechanisms of lateral collapse and as a
benchmark against which current landslide-tsunami models can be tested and developed. The AK lateral collapse
highlights the major hazard from this volcanic process, both in the impact of the initial landslide and, in island or
coastal settings, from the associated tsunami generation.
If the regrowth of AK continues, there is a possibility of future collapses to the southwest and potential tsu-
nami generation. However, the precursors to lateral collapses remain poorly understood, limiting the prospects
for forecasting their timing. Given the short tsunami travel time from the AK volcanic source to the adjacent
coastlines, mitigating against tsunami impacts after generation based on standard buoy-based measurements is a
major challenge. Unlike earthquake-triggered tsunamis, which can be more easily detected, and hazard warnings
issued to adjacent coastal communities, volcanic lateral collapses will continue to be a surprise, with the potential
for causing significant loss of life and property destruction. One promising avenue for early detection of tsunamis
from such non-seismic sources is the use of shore-based high frequency radars, combined with tsunami detection
algorithms based on simulations of potential tsunami scenarios cf.53, and literature reviews therein. Following
the premonitory study of12, the present research confirms that state-of-the-art numerical models can accurately
simulate the potential hazard from volcanic induced tsunamis. Hence, realistic lateral collapse scenarios could
be simulated for future volcanic events, at AK or elsewhere, and serve as a basis for developing tsunami hazard
assessment maps and new types of tsunami detection and warning systems.
Methods
Numerical models and grids. We use a suite of hydrodynamic models for 3D landslide tsunami genera-
tion (NHWAVE)38–40 and 2D propagation (FUNWAVE-TVD)44. These models have been extensively validated
through benchmarking against laboratory and field data, as well as in the context of operational tsunami haz-
ard assessment, for hypothetical38,39,53–56 or actual57–60 landslide tsunamis and other events. Much of this past
work was performed in the US in parallel with or under the auspice of the National Tsunami Hazard Mitigation
(NTHMP) program, including studies of potential volcanic flank collapses in the Canary Islands11,48 (see also9 for
initial work on this event).
Scientific Reports | (2019) 9:11946 | https://doi.org/10.1038/s41598-019-48327-6 10www.nature.com/scientificreports/ www.nature.com/scientificreports
NHWAVE simulates 3D wave generation by slides, including frequency dispersion effects (vertical accelera-
tion/non- hydrostatic effects), using only a small number of vertical, boundary fitted, σ -layers. Slides are modelled
as an additional (depth-averaged) layer of subaerial and/or underwater material whose motion is fully coupled to
that of the surrounding water. This layer can be of arbitrary geometry and also simulate non-hydrostatic effects61,
with the slide material being either represented as a dense Newtonian fluid39 or a saturated granular medium with
intergranular and basal stresses governed by Coulomb friction40,55. Both of these rheologies were used in the pres-
ent work. FUNWAVE-TVD is a fully nonlinear and dispersive 2D Boussinesq-type model used (and initialized)
here to propagate the initial near-field tsunami generated with NHWAVE to the far-field. FUNWAVE-TVD has
been applied and validated for some actual tsunami case studies57–60.
The 100 m resolution bathymetric and topographic data was interpolated to set-up model grids, to which
+1.5 m was added, representing the tide elevation at Marina Jambu (tide gauge 1; Fig. 1a) at the time of tsunami
arrival: (i) a Cartesian grid G1 used in FUNWAVE-TVD, with a 100 m horizontal resolution (Fig. 1a; 1950 by
1840 cells), and (ii) a 3D grid G0, with a 90 m horizontal resolution and 5 σ -layers, over a smaller footprint nested
within G1 (Fig. 1b; 360 by 300 cells). Based on AK’s collapse geometry described in Fig. 3 the likeliest collapse
volume, and its lower and upper bounds (within the estimated uncertainty) are computed at 0.27, 0.22 and 0.30
km3, respectively in NHWAVE grid G0 (Supplementary #2 provides 3D images of the pre- and post-collapse
discretized topography and bathymetry in grid G0).
Tsunami simulations. Following initial sensitivity analyses performed with another model
(TSUNAMI-SQUARE62), six collapse cases were simulated with NHWAVE in grid G0 (Fig. 1), for 0.22, 0.27, and
0.30 km3 volume of slide material (Fig. 3) represented: (i) either as a Newtonian fluid of density ρc = 1, 900 kg/
m3 and kinematic viscosity ϕc = 0.5 m2/s; or (ii) a granular medium with ρc = 1, 900 kg/m3 for the solid part, an
internal friction angle ϕic = 10°, a basal friction angle ϕbc = 2° (similar to that used by15, and a 40% porosity;
with this data, assuming a water density ρw = 1, 025 kg/m3, the average density of the granular medium is ρac = 1,
550 kg/m3). NHWAVE was run up to 410 s, the time when the generated tsunami approaches the boundary of
grid G0 (Fig. 4a). Then surface elevation and horizontal velocity (calculated at the required depth z = −0.531 h)
were interpolated to initialize FUNWAVE-TVD simulations in grid G155, which were run for another 7,200 s
(Fig. 4c,d). Time series of surface elevations shown in Fig. 5 (and Fig. S.6) are computed at 5 numerical wave
gauges in NHWAVE and 4 tide gauges in FUNWAVE-TVD (Table 1).
Data Availability
The FUNWAVE-TVD and NHWAVE models used here (developed by some of the authors) are open source
and available on github.com. All data is available from references cited in the text, except for unprocessed raw
input-output model results, which have been archived and the authors can make available upon request.
References
1. AHA Centre. Indonesia, Tsunami in Sunda Strait, http://adinet.ahacentre.org/reports/view/1383 (2018).
2. Simkin, T. & Fiske, R. S. Krakatau 1883: the volcanic eruption and its effects. Smithsonian Institution Press, Washington, D.C. (1983).
3. Verbeek, R. D. M. Krakatau. Government Press Batavia (1885).
4. Johnson, R. W. Large-scale volcanic cone collapse: the 1888 slope failure of Ritter Volcano, and other examples from Papua New
Guinea. Bulletin of Volcanology 49, 669–679 (1987).
5. Day, S. In The Encyclopedia of Volcanoes, 993–1009, Elsevier (2015).
6. Paris, R. Source mechanisms of volcanic tsunamis. Philosophical Transactions of the Royal Society of London A: Mathematical,
Physical and Engineering Sciences, 373, https://doi.org/10.1098/rsta.2014.0380 (2015).
7. Auker, M. R., Sparks, R. S. J., Siebert, L., Crosweller, H. S. & Ewert, J. A. Statistical analysis of the global historical volcanic fatalities
record. Journal of Applied Volcanology 2, 1–24, https://doi.org/10.1186/2191-5040-2-2 (2013).
8. Day, S. et al. Submarine landslide deposits of the historical lateral collapse of Ritter Island, Papua New Guinea. Marine and Petroleum
Geology 67, 419–438, https://doi.org/10.1016/j.marpetgeo.2015.05.017 (2015).
9. Ward, S. N. & Day, S. Cumbre Vieja volcano – Potential collapse and tsunami at La Palma, Canary Islands. Geophysical Research
Letters 28(17), 3397–3400 (2001).
10. Løvholt, F., Pedersen, G. & Gisler, G. Oceanic propagation of a potential tsunami from the La Palma Island. Journal of Geophysical
Research, 113, https://doi.org/10.1029/2007JC004603 (2008).
11. Abadie, S. M., Harris, J. C., Grilli, S. T. & Fabre, R. Numerical modeling of tsunami waves generated by the flank collapse of the
Cumbre Vieja Volcano (La Palma, Canary Islands): Tsunami source and near field effects. Journal of Geophysical Research 117,
C05030, https://doi.org/10.1029/2011jc007646 (2012).
12. Giachetti, T., Paris, R., Kelfoun, K. & Ontowirjo, B. Tsunami hazard related to a flank collapse of Anak Krakatau Volcano, Sunda
Strait, Indonesia. Geological Society, London, Special Publications 361, 79–90, https://doi.org/10.1144/sp361.7 (2012).
13. Tinti, S., Bortolucci, E. & Romagnoli, C. Computer simulations of tsunamis due to sector collapse at Stromboli, Italy. Journal of
Volcanology and Geothermal Research 96, 103–128, https://doi.org/10.1016/S0377-0273(99)00138-9 (2000).
14. Ward, S. N. & Day, S. Ritter Island Volcano-lateral collapse and the tsunami of 1888. Geophysical Journal International 154, 891–902
(2003).
15. Hunt, J. E., Wynn, R. B., Masson, D. G., Talling, P. J. & Teagle, D. A. H. Sedimentological and geochemical evidence for multistage
failure of volcanic island landslides: A case study from Icod landslide on north Tenerife, Canary Islands. Geochemistry Geophysics
Geosystems 12, Q12007, https://doi.org/10.1029/2011gc003740 (2011).
16. Watt, S. F. L. et al. From catastrophic collapse to multi-phase deposition: Flow transformation, seafloor interaction and triggered
eruption following a volcanic-island landslide. Earth and Planetary Science Letters 517, 135–147, https://doi.org/10.1016/j.
epsl.2019.04.024 (2019).
17. Watt, S. F. L. et al. Combinations of volcanic-flank and seafloor-sediment failure offshore Montserrat, and their implications for
tsunami generation. Earth and Planetary Science Letters 319–320, 228–240, https://doi.org/10.1016/j.epsl.2011.11.032 (2012).
18. Camus, G., Gourgaud, A. & Vincent, P. M. Petrologic evolution of Krakatau (Indonesia): Implications for a future activity. Journal of
Volcanology and Geothermal Research 33, 299–316, https://doi.org/10.1016/0377-0273(87)90020-5 (1987).
19. Stehn, C. In Krakatau, Proc. 4th Pacific Sci. Congr, Batavia I. 1–55.
20. Sudradjat, A. The morphological development of Anak Krakatau volcano, Sunda Straits. Geol. Indonesia 9, 1–11 (1982).
21. Siswowidjoyo, S. In Proc. Symp. on 100 years development Krakatau its surroundings, Jakarta, 23–27 August 1983. 191–198,
Indonesian Inst. Sci. Jakarta (1983).
Scientific Reports | (2019) 9:11946 | https://doi.org/10.1038/s41598-019-48327-6 11www.nature.com/scientificreports/ www.nature.com/scientificreports
22. Abdurrachman, M., Widiyantoro, S., Priadi, B. & Ismail, T. Geochemistry and Structure of Krakatoa Volcano in the Sunda Strait,
Indonesia. Geosciences 8, 111 (2018).
23. Global Volcanic Program. In Bulletin of the Global Volcanism Network Vol. 43:10 (ed Venzke, E.) Smithsonian Institution (2018).
24. Andersen, O. Krakatau Volcano: Witnessing the eruption, tsunami and the aftermath 22-23th December 2018, http://www.
oysteinlundandersen.com/krakatau-volcano-witnessing-the-eruption-tsunami-22december2018/Accessed December 26, 2018
(2018).
25. PVMBG (Pusat Vulkanologi dan Mitigasi Bencana Geologi). Activity reports for Anak Krakatau from 01/12/2018 – 03/01/2019,
http://pvmbg.bgl.esdm.go.id/index.php/gunungapi/aktivitas-gunungapi (2018).
26. Gurney, J. Low frequency analysis of the 13:55 event (arrival at Bungbulang at 13:57 UTC), https://twitter.com/UKEQ_Bulletin. UK
Earthquake Bulletin. Accessed on Dec. 28, 2018 (2018).
27. TDMRC (Tsunami Disaster and Mitigation Research Center) Post Sunda Strait Tsunami Survey, http://tdmrc.unsyiah.ac.id/the-
latest-update-from-post-sunda-strait-tsunami-survey/. Accessed Jan. 8, 2019 (2019).
28. Muhari, A. In Kompas, (in Indonesian), https://sains.kompas.com/read/2018/12/23/180319123/menyoal-dakwaan-pada-anak-
krakatau-tentang-kasus-tsunami-selat-sunda?page=all. Acessed Dec. 23, 2018 (2018).
29. Adristy, C. Kondisi Waspada, Begini Erupsi Gunung Anak Krakatau dari Udara, in Serambin News, https://foto.tempo.co/
read/69191/kondisi-waspada-begini-erupsi-gunung-anak-krakatau-dari-udara (2018).
30. Foto-foto Letusan Gunung Anak Krakatau Sehari setelah Tsunami Menerjang Banten dan Lampung in Serambin News, https://aceh.
tribunnews.com/2018/12/24/foto-foto-letusan-gunung-anak-krakatau-sehari-setelah-tsunami-menerjang-banten-dan-lampung
(2018).
31. Sentinel Hub, https://www.eorc.jaxa.jp/ALOS-2 (2018).
32. ALOS-2 (Advanced Land Observing Satellite-2; SAR mission)/Daichi-2, ALOS-2 (Advanced Land Observing Satellite-2; SAR
mission) / Daichi-2 (.
33. Cole, P. D., Guest, J. E., Duncan, A. M. & Pacheco, J.-M. Capelinhos 1957–1958, Faial, Azores: deposits formed by an emergent
surtseyan eruption. Bulletin of Volcanology 63, 204, https://doi.org/10.1007/s004450100136 (2001).
34. Kokelaar, P. Magma-water interactions in subaqueous and emergent basaltic. Bulletin of Volcanology 48, 275–289, https://doi.
org/10.1007/bf01081756 (1986).
35. Moore, J. G. Structure and eruptive mechanisms at Surtsey Volcano, Iceland. Geological Magazine 122, 649–661, https://doi.
org/10.1017/S0016756800032052 (2009).
36. Deplus, C. et al. Inner structure of the Krakatau volcanic complex (Indonesia) from gravity and bathymetry data. Journal of
Volcanology and Geothermal Research 64, 23–52, https://doi.org/10.1016/0377-0273(94)00038-I (1995).
37. Siebert, L. Large volcanic debris avalanches: Characteristics of source areas, deposits, and associated eruptions. Journal of
Volcanology and Geothermal Research 22, 163–197 (1984).
38. Ma, G., Shi, F. & Kirby, J. T. Shock-capturing non-hydrostatic model for fully dispersive surface wave processes. Ocean Modelling
43–44, 22–35, https://doi.org/10.1016/j.ocemod.2011.12.002 (2012).
39. Kirby, J. T., Shi, F., Nicolsky, D. & Misra, S. The 27 April 1975 Kitimat, British Columbia, submarine landslide tsunami: a comparison
of modeling approaches. Landslides 13, 1421–1434, https://doi.org/10.1007/s10346-016-0682-x (2016).
40. Ma, G., Kirby, J. T., Hsu, T.-J. & Shi, F. A two-layer granular landslide model for tsunami wave generation: Theory and computation.
Ocean Modelling 93, 40–55, https://doi.org/10.1016/j.ocemod.2015.07.012 (2015).
41. Reynolds, J. Post-collapse image of Anak Krakatau. Earth Uncut TV, https://twitter.com/hashtag/Krakatau?src=hash, Accessed Jan.
11, 2019 (2019).
42. Observation Result for Eruption of Anak Krakatau Volcano in Indonesia by ALOS-2, https://www.eorc.jaxa.jp/ALOS-2/en/img_up/
dis_pal2_eruption_anak_krakatau_20181226.htm (2018).
43. Team, P. Planet Application Program Interface: In Space for Life on Earth. San Francisco, CA, https://api.planet.com (2017).
44. Shi, F., Kirby, J. T., Harris, J. C., Geiman, J. D. & Grilli, S. T. A high-order adaptive time-stepping TVD solver for Boussinesq
modeling of breaking waves and coastal inundation. Ocean Modelling 43-44, 36–51, https://doi.org/10.1016/j.ocemod.2011.12.004
(2012).
45. Ina-COAP. Tide Gauge data in Indonesia, http://tides.big.go.id/las/UI.vm Accessed Jan. 3, 2019 (2019).
46. Hoffman-Rothe, A. et al. Monitoring Anak Krakatau Volcano in Indonesia. Eos, Transactions American Geophysical Union 87,
581–586, https://doi.org/10.1029/2006eo510002 (2006).
47. Cooke, R. J. S. In Cooke–Ravian Volume of Volcanological Papers (ed. Johnson, R. W.) 115–123 (Geological Survey of Papua New
Guinea Memoir 10, 1981).
48. Tehranirad, B. et al. Far-field tsunami impact in the north Atlantic basin from large scale flank collapses of the Cumbre Vieja
volcano, La Palma. Pure and Applied Geophysics 172(12), 3,589–3,616, https://doi.org/10.1007/s00024-015-1135-5 (2015).
49. Tsuji, Y. & Hino, T. Damage and inundation height of the 1792 Shimabara landslide tsunami along the coast of Kumamoto
prefecture. Bulletin of the Earthquake Research Institute, University of Tokyo 68, 91–176 (1993).
50. Belousova, M. & Belousov, A. Prehistoric and 1933 debris avalanches and associated eruptions of Harimkotan Volcano (Kurile
Islands). Period. di Mineral, 99–101 (1995).
51. Inoue, K. Shimabara-shigatusaku earthquake and topographic changes by Shimabara catastrophe in 1792 (in Japanese with English
Abstract). Journal of the Japan Society of Erosion Control Engineering 52, 45–54 (2000).
52. Karstens, J. et al. From gradual spreading to catastrophic collapse – Reconstruction of the 1888 Ritter Island volcanic sector collapse
from high-resolution 3D seismic data. Earth and Planetary Science Letters 517, 1–13, https://doi.org/10.1016/j.epsl.2019.04.009
(2019).
53. Guérin, C.-A., Grilli, S. T., Moran, P., Grilli, A. R. & Insua, T. L. Tsunami detection by high-frequency radar in British Columbia:
performance assessment of the time-correlation algorithm for synthetic and real events. Ocean Dynamics 68, 423–438, https://doi.
org/10.1007/s10236-018-1139-7 (2018).
54. Grilli, S. T. et al. Modeling of SMF tsunami hazard along the upper US East Coast: detailed impact around Ocean City, MD. Natural
Hazards 76, 705–746, https://doi.org/10.1007/s11069-014-1522-8 (2015).
55. Grilli, S. T. et al. Modeling coastal tsunami hazard from submarine mass failures: effect of slide rheology, experimental validation,
and case studies off the US East Coast. Natural Hazards 86, 353–391, https://doi.org/10.1007/s11069-016-2692-3 (2017).
56. Schambach, L., Grilli, S. T., Kirby, J. T. & Shi, F. Landslide Tsunami Hazard Along the Upper US East Coast: Effects of Slide
Deformation, Bottom Friction, and Frequency Dispersion. Pure and Applied Geophysics, 1–40, https://doi.org/10.1007/s00024-018-
1978-7 (2018).
57. Grilli, S. T. et al. Numerical simulation of the 2011 Tohoku tsunami based on a new transient fem co-seismic source: Comparison
to far- and near-field observations. Pure and Applied Geophysics 170, 1333–1359, https://doi.org/10.1007/s00024-012-0528-y
(2013).
58. Grilli, S. T. et al. Source constraints and model simulation of the December 26, 2004 Indian Ocean tsunami. J. Waterway Port Coastal
and Ocean Engineering 133(6), 414–428 (2007).
59. Ioualalen, M. et al. Modeling the 26th December 2004 Indian Ocean tsunami: Case study of impact in Thailand. Journal of
Geophysical Research 112, C07024, https://doi.org/10.1029/2006JC003850 (2007).
60. Tappin, D. R. et al. Did a submarine landslide contribute to the 2011 Tohoku tsunami? Marine Geology 357, 344–361, https://doi.
org/10.1016/j.margeo.2014.09.043 (2014).
Scientific Reports | (2019) 9:11946 | https://doi.org/10.1038/s41598-019-48327-6 12You can also read