Calibrating a new attenuation curve for the Dead Sea region using surface wave dispersion surveys in sites damaged by the 1927 Jericho earthquake ...
←
→
Page content transcription
If your browser does not render page correctly, please read the page content below
Solid Earth, 10, 379–390, 2019
https://doi.org/10.5194/se-10-379-2019
© Author(s) 2019. This work is distributed under
the Creative Commons Attribution 4.0 License.

Calibrating a new attenuation curve for the Dead Sea region using
surface wave dispersion surveys in sites damaged by
the 1927 Jericho earthquake
Yaniv Darvasi and Amotz Agnon
The Fredy & Nadine Herrmann Institute of Earth Sciences, The Hebrew University of Jerusalem, 9190401 Jerusalem, Israel

Correspondence: Yaniv Darvasi (yaniv.darvasi@mail.huji.ac.il)

Received: 3 June 2018 – Discussion started: 7 June 2018
Revised: 10 February 2019 – Accepted: 12 February 2019 – Published: 7 March 2019

Abstract. Instrumental strong motion data are not common           quake data, together with modern measurements, in order to
around the Dead Sea region. Therefore, calibrating a new at-       better estimate the peak ground acceleration or the seismic
tenuation equation is a considerable challenge. However, the       intensities to be caused by future earthquakes. This integra-
Holy Land has a remarkable historical archive, attesting to        tion will conceivably lead to a better mitigation of damage
numerous regional and local earthquakes. Combining the his-        from future earthquakes and should improve maps of seis-
torical record with new seismic measurements will improve          mic hazard.
the regional equation.
    On 11 July 1927, a rupture, in the crust in proximity to the
northern Dead Sea, generated a moderate 6.2 ML earthquake.
Up to 500 people were killed, and extensive destruction was        1   Introduction
recorded, even as far as 150 km from the focus. We con-
sider local near-surface properties, in particular, the shear-     Generating a modern and applicable attenuation equation is
wave velocity, as an amplification factor. Where the shear-        one of applied seismologists’ main interests. Considering the
wave velocity is low, the seismic intensity far from the focus     Dead Sea area, for which instrumental strong motion data are
would likely be greater than expected from a standard atten-       not available, this task is particularly challenging. Using the
uation curve. In this work, we used the multichannel analysis      Holy Land’s historically rich database, researchers had de-
of surface waves (MASW) method to estimate seismic wave            fined seismic intensities and estimated earthquake locations.
velocity at anomalous sites in Israel in order to calibrate a      Investigating anomalous sites, with seismic intensities higher
new attenuation equation for the Dead Sea region.                  or lower than predicted from the basic regional attenuation
    Our new attenuation equation contains a term which quan-       relation, may lead to a better attenuation equation. The local
tifies only lithological effects, while factors such as building   geological conditions can strongly influence the nature and
quality, foundation depth, topography, earthquake directivity,     severity of shaking at a given site. Assessing the local geo-
type of fault, etc. remain out of our scope. Nonetheless, about    logical conditions by geophysical techniques at these anoma-
60 % of the measured anomalous sites fit expectations; there-      lous sites, and adding a logarithmic term to a basic attenua-
fore, this new ground-motion prediction equation (GMPE) is         tion equation, should improve the equation.
statistically better than the old ones.                               This work focuses on the 1927 event, but it is part of wider
    From our local point of view, this is the first time that      research which extends to additional earthquakes. The 1927
integration of the 1927 historical data and modern shear-          event was chosen as it is the only devastating one recorded,
wave velocity profile measurements improved the attenua-           albeit teleseismically, during the instrumented period.
tion equation (sometimes referred to as the attenuation rela-         Our main goal in this research is a tighter constraint on
tion) for the Dead Sea region. In the wider context, regions of    the attenuation equation derived from this event. This should
low-to-moderate seismicity should use macroseismic earth-          allow us to examine whether this preliminary work coin-

Published by Copernicus Publications on behalf of the European Geosciences Union.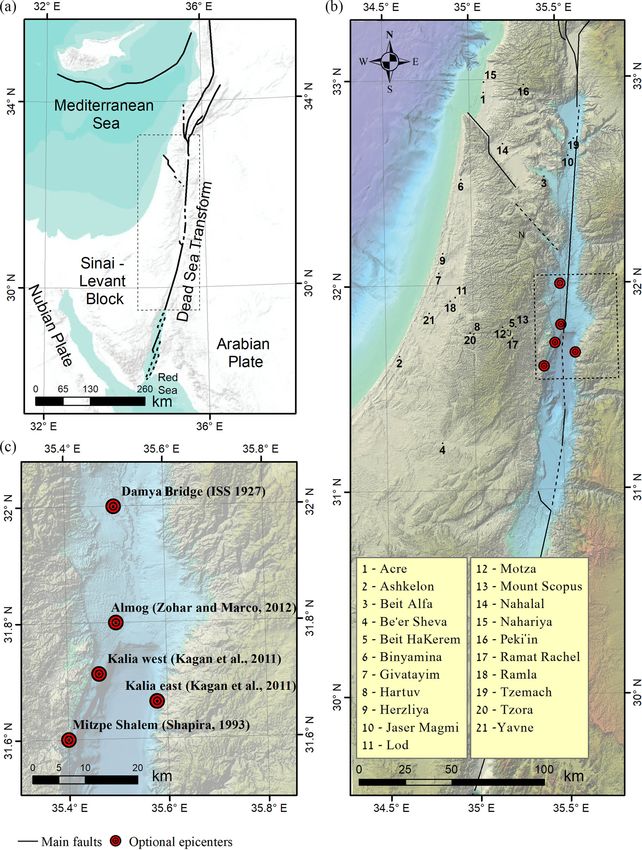
380 Y. Darvasi and A. Agnon: Recalibration of Dead Sea region attenuation curve
where ρ is the density of the investigated soil. As shear-wave
velocity decreases by a given fraction, the amplification in-
creases by half that fraction (for a constant density). Since
density plays a minor role (Dal Moro, 2014; Xia et al., 1999),
the Vs value can be used to represent site conditions.
The most widely used index in the classification of the soil
response is the average shear-wave velocity in the uppermost
30 m, the Vs30 . This index was accepted for site classification
in the US National Earthquake Hazards Reduction Program
(NEHRP) (Building Seismic Safety Council, 2001). In Eu-
Figure 1. Schematic view of site amplification. Seismogram at the rope, by the new provisions of Eurocode 8 (CEN, 2011), and
surface shows amplification in comparison to the seismogram lo- in Israel, it is accepted by the design provisions for earth-
cated over the bedrock (modified after Ciaccio and Cultrera, 2014). quake resistance of structures – SI 413 (The Standards In-
stitution of Israel, 2013). The value of 30 m comes from the
US and European building codes, where it was found empir-
cides with our expectations of site amplification and de- ically that this depth is directly proportional to deeper and
amplification due to the local lithology. shallower values (Boore et al., 2011). Zaslavsky et al. (2012)
argued that the use of Vs30 is a simplification that cannot be
1.1 Site response justified in the complex geological conditions in Israel, yet
no alternatives have thus far been proposed. Therefore, in
Ground motion is controlled by a number of variables, in- this scenario, the Standards Institution of Israel still adopts
cluding source characteristics, source distance, propagation the Vs30 index.
directivity, near-surface geology, etc. The elastic properties In modern attenuation equations, also known as ground-
of near-surface materials and their effect on seismic wave motion prediction equations (GMPEs), coefficients are de-
propagation are crucial to earthquake and civil engineering, rived from strong motion data, namely from ground accel-
and environmental and Earth science studies. eration measurements. In the past, and in areas lacking the
Seismic surface waves are initiated at the moment that technology to record earthquakes, it was impossible to mea-
the earthquake wave front impinges on the surface. These sure the peak ground acceleration (PGA) directly. Therefore,
waves spread out, and the surface shakes as they pass. Sur- it is common to categorize historical earthquakes with seis-
face wave amplitude at the surface is controlled by the me- mic intensity scales that describe the damage at each site or
chanical properties of the rocks below. These often consist of area (Ambraseys, 2009; Guidoboni and Comastri, 2005).
low-velocity weathered rock over bedrock with much higher
velocities. When seismic waves pass from a high-velocity 1.2 The 6.2 ML 1927 Jericho earthquake
layer to a low-velocity layer, their amplitudes and duration
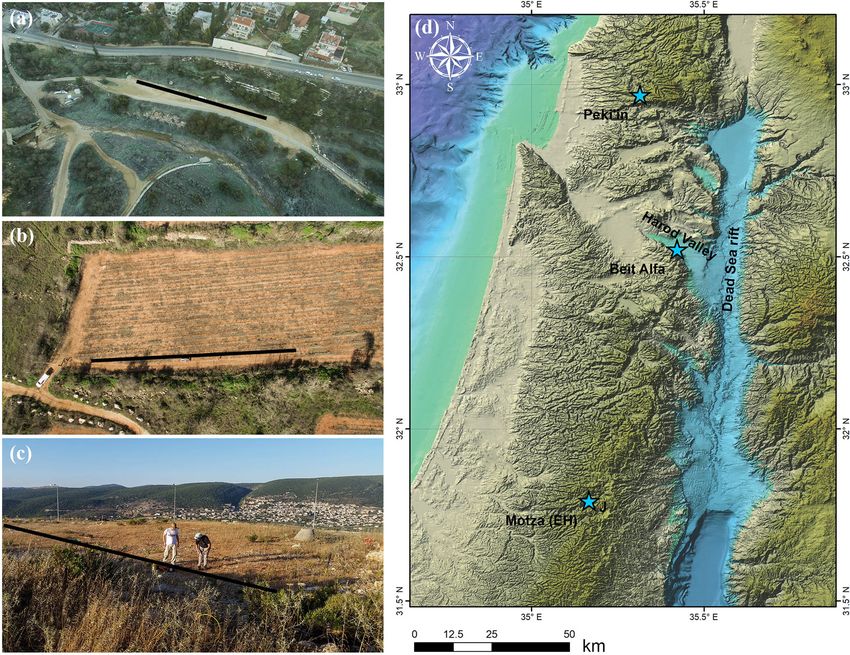
typically increase. The phenomena of site amplification, as The left-lateral Dead Sea transform separates the Sinai–
a result of soft sediments overlying hard bedrock, is well Levant Block from the Arabian Plate (Fig. 2). The 6.2 ML
known since the early days of seismology (Milne, 1898). 11 July 1927 Jericho earthquake (Ben-Menahem et al., 1976;
Site effects are also well known and were investigated af- Shapira, 1979) was the strongest and most destructive earth-
ter several major earthquakes: Mexico City 1985 (Singh et quake to hit the Holy Land during that century. Furthermore,
al., 1988), Yerevan 1989 (Borcherdt et al., 1989), San Fran- it was the first to be instrumentally recorded by seismo-
cisco 1989 (Hough et al., 1990), Los Angeles 1994 (Hall et graphs. The epicentral location was originally estimated to be
al., 1994) and Kobe 1995 (Aguirre and Irikura, 1997). There- a few kilometers south of the Damia Bridge, which is 30 km
fore, local lithology is a crucial factor for estimating site am- north of Jericho (International Seismological Summary – ISS
plification, defined as the amplitude ratio between the sur- Bulletin of 1927). In the following decades, new estimates
face layer and the underlying bedrock. Site amplification at a have been published: Shapira et al. (1993) calculated the epi-
specific site can be attributed to many factors, such as basin center to be near Mitzpe Shalem. Zohar and Marco (2012) es-
effects, focusing effects, topography and reverberation of the timated the epicenter to be near the Almog settlement, about
seismic waves in the upper layers due to acoustic impedance 30 km north of Shapira’s epicenter, and Kagan et al. (2011)
differences (Fig. 1). surmised that the source was somewhere on the Kalia fault,
The amplification, A, is proportional to the reciprocal located in the northern part of the Dead Sea graben, perpen-
square root of the product of the shear-wave velocity, Vs dicular to the main Dead Sea fault (Fig. 2).
(Eq. 1) (Aki and Richards, 2002): The damage from the earthquake was heavy, especially in
places near the source but not only there. In Nablus, located
1 70 km from the epicenter (Fig. 2), 60 people were killed,
A∝ √ , (1) 474 were injured, and more than 700 structures were de-
Vs ρ
Solid Earth, 10, 379–390, 2019 www.solid-earth.net/10/379/2019/
Y. Darvasi and A. Agnon: Recalibration of Dead Sea region attenuation curve                                                       381

                                                                      Figure 3. Wreckage of the Winter Palace Hotel, Jericho, after the
                                                                      1927 earthquake. American Colony (Jerusalem). Photo Dept., pho-
                                                                      tographer.

                                                                      epicenter (Ben-Menahem, 1991), although a different inter-
                                                                      pretation suggests this distance was only 300 km (Ambraseys
                                                                      and Melville, 1988).
                                                                         Compiling historical evidence, Avni (1999), in his
                                                                      PhD thesis, estimated the seismic intensities (MSK or
                                                                      the Medvedev–Sponheuer–Karnik scale) (Medvedev et al.,
                                                                      1965) at 133 different locations around Israel, Palestine, Jor-
                                                                      dan, Lebanon, Syria and Egypt (Fig. 4 for locations and
Figure 2. Research area: (a) Middle East area with the main tec-      the Supplement). The curve that Avni (1999) fit to his scat-
tonic elements. (b) Proposed epicenters for the 1927 earthquake       tered MSK vs. d points represents his basic attenuation equa-
event with all sites that were investigated placed over a 25 m dig-
                                                                      tion and had an R 2 of about 0.26. Based on the methodol-
ital terrain model (DTM) image (Hall, 2008). (c) Detailed location
of the proposed epicenters. Also shown are sites mentioned in the
                                                                      ogy proposed by Bakun and Wentworth (1997), Hough and
text: Jerusalem (J) and Nablus (N).                                   Avni (2011) published a new attenuation equation for the
                                                                      Dead Sea region:

                                                                      MMI (M, d) = −0.64+1.7M −0.00448d −1.67 log(d), (2)
stroyed, most of which were built on soft sediments (Blanck-
                                                                      where MMI is the modified Mercalli intensity (assumed to
enhorn, 1927; Willis, 1928). By comparison, Jerusalem is
                                                                      be equivalent to MSK), M is the magnitude, and d is the
only about 30 km from the source and the damage there
                                                                      distance from the epicenter.
was much smaller, especially in property. However, at Mount
Scopus and the Mount of Olives (eastern neighborhoods
in Jerusalem), the damage exceeded that in other parts of             2   Methods – multichannel analysis of surface waves
Jerusalem (Abel, 1927; Brawer, 1928). Other cities also suf-              (MASW)
fered from this earthquake. Tens of people were injured and
even died, and hundreds of houses were ruined in Ramla                The multichannel analysis of surface waves (MASW)
and Lod (Brawer, 1928). Jericho in the Jordan Valley also             method is environmentally friendly, non-invasive, low cost,
suffered significant damage, especially in terms of build-            rapid and robust, and provides reliable Vs30 data (Xia et al.,
ings collapsing (Fig. 3). The total number of victims was             2002). Multichannel shallow seismic surveys make it pos-
about 350–500 (Ambraseys and Melville, 1988; Amiran,                  sible to separate different wave fields in the frequency and
1952; Arieh, 1967; Ben-Menahem, 1991). Beyond the casu-               velocity domains. Fundamental and higher modes can be an-
alties, several environmental effects were reported. The Jor-         alyzed simultaneously, but generally, only the fundamental
dan River flow ceased near the Damia Bridge for about 21.5 h          mode is used because it has the highest energy (Park et al.,
(Willis, 1928) and a 1 m seiche wave was observed in the              1998).
Dead Sea (Abel, 1927; Blanckenhorn, 1927). Some evidence                 The MASW method consists of three main steps: (a) ac-
suggests that the earthquake was felt up to 700 km from the           quisition of experimental data, (b) signal processing to obtain

www.solid-earth.net/10/379/2019/                                                                    Solid Earth, 10, 379–390, 2019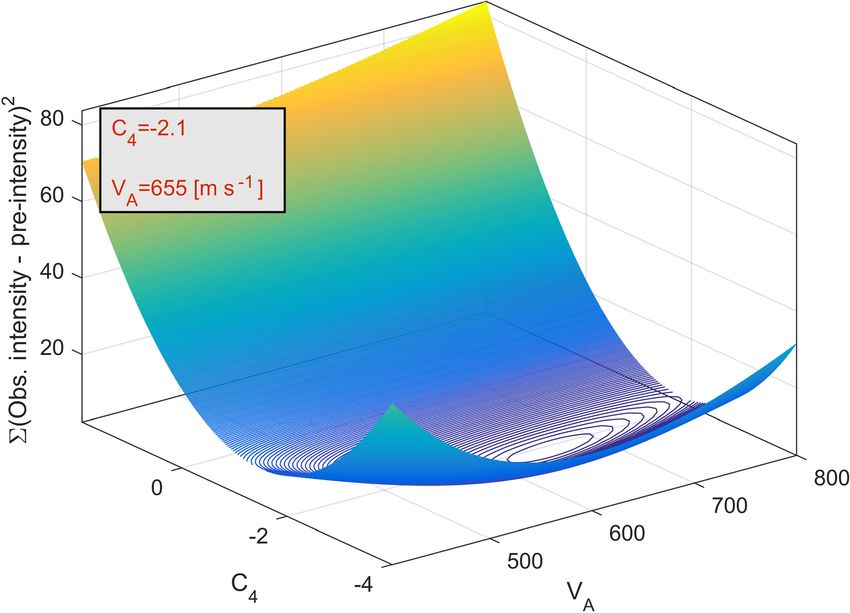
382                                            Y. Darvasi and A. Agnon: Recalibration of Dead Sea region attenuation curve

                                                                     Table 1. Acquisition parameters.

                                                                                     Number of geophones   24
                                                                                     Geophone spacing      2–3 m
                                                                                     Array length          46–69 m
                                                                                     Sampling rate         8 kHz
                                                                                     Record length         0.5–2 s
                                                                                     Receivers             4.5 Hz vertical
                                                                                     Source                5 kg hammer

                                                                     3     Results

                                                                     We carried out the surveys with a linear array of 24 vertical
                                                                     geophones (R. T. Clark’s geophones with a natural frequency
                                                                     of 4.5 Hz) at equal intervals of 2–3 m over a total length of
                                                                     46–69 m. For the survey sound source, we used a 5 kg sledge-
                                                                     hammer striking a 20 cm square aluminum plate at variable
                                                                     offsets of 5, 10, 15, 20, 25 and 30 m (both forward and re-
                                                                     versed) (Fig. 6a). The seismic data were recorded on a Ge-
                                                                     ometrics Geode seismograph at a sampling rate mostly of
                                                                     8 kHz for 0.5–2 s (Table 1). For an acceptable signal-to-noise
                                                                     ratio, we used the so-called “vertical stacking” approach,
                                                                     which is a summation of multiple synchronized repetitions
                                                                     of the test (usually five times).
                                                                        Rayleigh wave dispersion curves are obtained by the
                                                                     MASW module of the RadExPro® software, whose calcula-
                                                                     tion procedure is based on a paper by Park et al. (1998), and
Figure 4. Isoseismal map. The epicentral location is in red and
                                                                     also by the WinMASW® software. From all the dispersion
black circles. Red and green dots are suspected amplified or de-
amplified sites (respectively). Blue dots are sites which have MSK
                                                                     images that we calculated from each offset shot (Fig. 6b), we
values expected from the attenuation equation (with a 60 % predic-   chose the smoothest and clearest one (Fig. 6c) to compute the
tion boundary).                                                      site’s Vs30 profile. An inversion process then finds the shear-
                                                                     wave velocity profile whose theoretical dispersion curve is
                                                                     as close as possible to the experimental curve (Fig. 6d). The
the experimental dispersion curve and (c) inversion to esti-         data and coefficients are automatically inverted via genetic
mate Vs30 (Fig. 5). The inverse problem consists of estimat-         algorithms which represent an optimization procedure be-
ing a set of parameters that describe the soil deposit, based on     longing to the classification of global-search methods. Ge-
an experimental dispersion curve. Inversion problems based           netic algorithms are commonly used to generate high-quality
on wave propagation theory cannot be solved in a direct way          solutions to optimization and search problems by relying on
due to their non-linearity. Thus, iterative methods must be          bio-inspired operators such as mutation, crossover and selec-
used where a theoretical dispersion curve is determined for a        tion compared to traditional linear inversion methods based
given layer model and compared to the previously obtained            on gradient methods (Jacobian matrix). These inversion tech-
experimental dispersion curve (Ryden et al., 2004). Vs30 typ-        niques produce a very reliable result in terms of precision and
ically does not converge to a single stable value. In other          completeness (Dal Moro et al., 2007).
words, for the same dispersion curve, one will get slightly             From 24 surveys, we succeeded in extracting Vs30 for 19
different Vs30 depending on the initial model.                       of the 20 sites studied (the Hartuv data were too noisy for
                                                                     interpretation) (Table 2 and the Supplement). These would
                                                                     be used to recalibrate the attenuation equation arrived at by
                                                                     previous investigators at 19 of the 133 sites.

                                                                     3.1    Velocity model

                                                                     All ground models were considered to be a stack of hori-
                                                                     zontal homogeneous elastic layers, neglecting lateral varia-
                                                                     tions in soil properties. The number of unknowns for a lay-

Solid Earth, 10, 379–390, 2019                                                                   www.solid-earth.net/10/379/2019/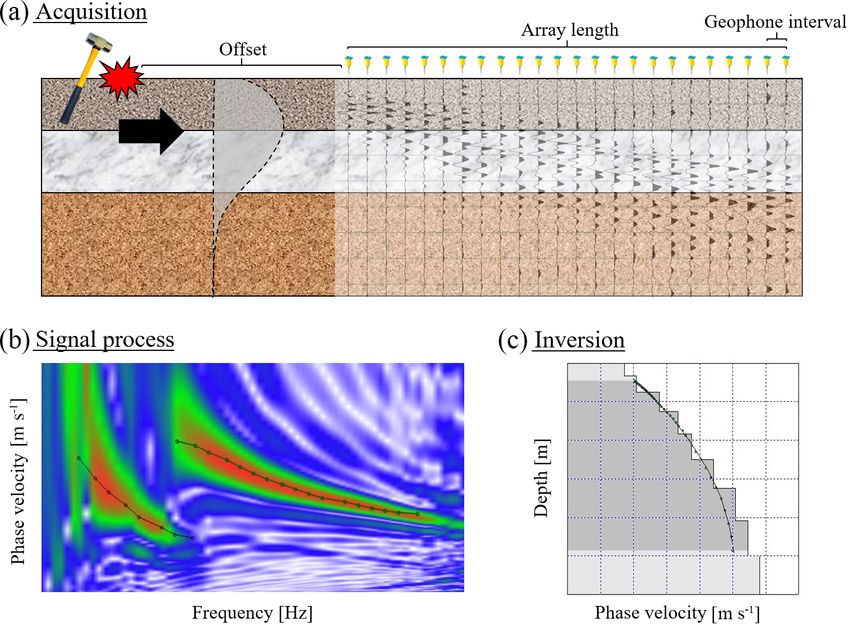
Y. Darvasi and A. Agnon: Recalibration of Dead Sea region attenuation curve                                                         383

Figure 5. Multichannel analysis of surface waves (MASW) technique: (a) acquisition – using a sledgehammer as an artificial source and
a linear array of geophones that receives all wavelets. (b) Signal process – a fundamental mode and first higher mode over the dispersion
image. (c) Inversion – final Vs profile which best fits the dispersion curve.

ered model, when considering only shear-wave velocity, is              tervals of more than 2 m, which limited the length of the seis-
three for each layer: density, thickness and one elastic con-          mic line. This length probably excludes longer wavelengths
stant. Therefore, the number of unknowns is 3n − 1 (where n            which limit the depth of investigation. Lastly, as the shear-
represents the number of layers). The change in density with           wave velocity of the lowest frequency is higher, more data
depth is usually small in comparison to the change in shear            are available for deeper layers. Therefore, the penetration
modulus and is normally neglected (Park et al., 1997).                 depth will decrease in areas with low shear-wave velocity.
                                                                       For instance, if we can clearly detect a phase velocity of
3.2   Number of layers and layer thicknesses                           about 300 m s−1 at 5 Hz, we can roughly estimate a depth
                                                                       of investigation of approximately 20–30 m according to the
The resolution of surface wave surveys decreases with depth.           following equation:
Thin layers are well resolved when they are close to the sur-
face, whereas at great depth, the resolution is limited and                  Velocityf
                                                                                       min
only large changes can be detected (Foti et al., 2014). Re-                      fmin
                                                                       Z=                    ,                                       (3)
gardless of the number of the layers at the site, Vs30 is al-                     n
most the same in each case (Fig. 7). For these reasons, as
well as the lack of density information, we did not restrict           where n ranges between 2 and 3 (Foti et al., 2014; Dal Moro,
each model to a specific number of layers. Without bore-               2014). In other words, this equation emphasizes that the
holes or other direct lithostratigraphic constraint, which is          depth of investigation is about a half to a third of the largest
the case in our work, a useful rule of thumb is to assume              wavelength observed.
layer thicknesses increasing with depth, to compensate for
the decreased resolution with depth, an intrinsic shortcoming          3.4   Recent improvement of the 1927 epicenter
of surface wave testing (Foti et al., 2014).
                                                                       Zohar and Marco (2012) relocated the 1927 epicenter to a
3.3   Depth of investigation                                           point near the Almog settlement. We used this most recently
                                                                       published epicenter to calculate new epicentral distances for
We used a 5 kg sledgehammer and summed up five strikes.                the 133 sites. Since Eq. (2) above is dependent upon d, we
For some sites, this type of source is insufficient to deter-          checked the variable scatter in the points but found that the
minate a shear-wave profile down to 30 m. In addition, at              changes in the best-fit coefficients were very minor, so we
some sites, we were not able to spread the geophones at in-            assumed for all purposes to use the original.

www.solid-earth.net/10/379/2019/                                                                     Solid Earth, 10, 379–390, 2019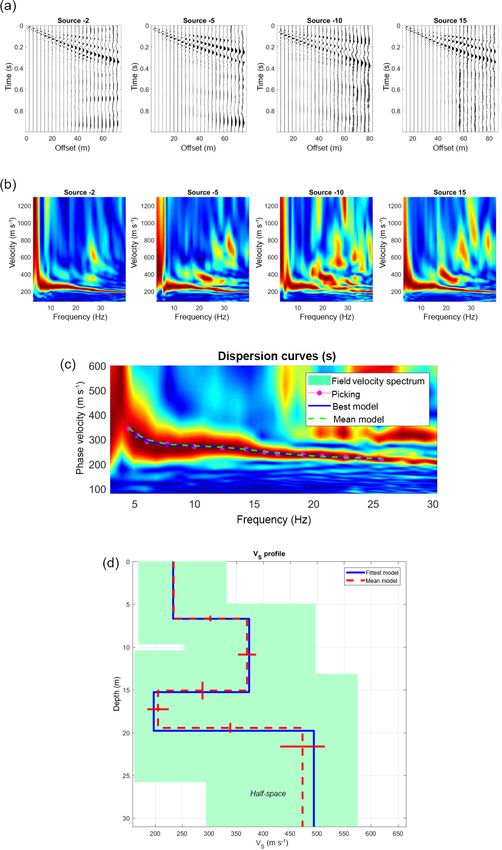
384                                             Y. Darvasi and A. Agnon: Recalibration of Dead Sea region attenuation curve

Figure 6. Data processing with WinMASW® (example from Binyamina): (a) raw data of four different offsets. (b) The four relative dis-
persion images calculated from the raw data. (c) Best dispersion image (offset 15): pink dots are the analyst’s dispersion curve picking. The
blue line and yellow dashed lines are, respectively, the best and the mean curves from the final model. (d) Shear-wave velocity model (blue
profile for the best one and red dashed line is the mean profile from 100 lower rms).

Solid Earth, 10, 379–390, 2019                                                                       www.solid-earth.net/10/379/2019/
Y. Darvasi and A. Agnon: Recalibration of Dead Sea region attenuation curve 385
Table 2. MASW results.
ID Site Vs30 Error Epicentral
(m s−1 ) (%) distance
1 Acre 261 13 131
2 Ashkelon 561 5 89
3 Be’er Sheva 359 8 91
4 Beit HaKerem 1436 12 29
5 Beit Alfa 232 5 79
6 Binyamina 316 5 95
7 Givatayim 396 6 72
8 Hartuv – – 47
9 Herzliya 330 5 77
10 Jisr al-Majami 294 9 92
11 Lod 1 320 4
60
12 Lod 2 374 6
13 Motza 1 1065 8
33
14 Motza 2 874 8
15 Mt. Scopus 1 600 6
23
16 Mt. Scopus 2 582 5
17 Nahalal 380 7 102
18 Nahariya 883 1 139 Figure 7. Vs30 as a function of a number of layers (example from
19 Peqi’in (Peki’in) 1444 3 131 Beit Alfa).
20 Ramleh (Ramla) 360 4 61
21 Tzemach 1 281 5
101
22 Tzemach 2 273 4
23 Tzora 430 3 50
24 Yavneh (Yavne) 361 10 72
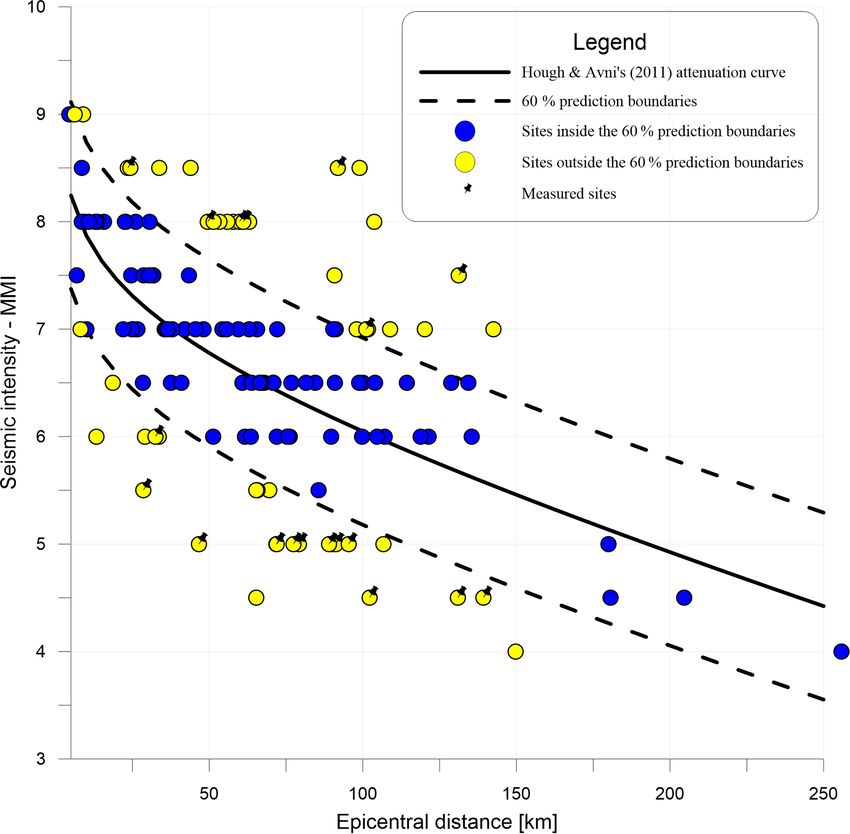
Figure 8 shows a scatter plot of the original MMI (assumed
equivalent to MSK) vs. new d for their 133 sites. Hough
and Avni (2011) fit these data with a curve whose equa-
tion best describes the attenuation equation for this event.
Using the mathematical form of their curve, we calculated
upper and lower limits such that 60 % of the points are en-
closed. This we call the 60 % prediction boundary. We con-
sider that the lithological effects probably account for much
of the scatter beyond this boundary, due to amplification and
de-amplification.
4 Discussion
A number of researchers have studied the 1927 event.
Avni (1999) tried to reduce the impact of local geology and
attempted to generate basic attenuation curves for specific
azimuths. Zohar and Marco (2012) relocated the source po- Figure 8. Avni’s seismic intensity (MMI) estimates of all the 133
sition, while Shani-Kadmiel et al. (2016) studied directivity sites. Distance is corrected according to the Zohar and Marco epi-
of the source pattern. None of these publications address the center. Yellow dots are suspected amplified or de-amplified sites.
Sites with pins are sites where we measured the Vs profile. Blue
Vs30 measurements. An attenuation equation with a term that
dots are sites which have MMI values expected from the attenua-
depends on the Vs30 index should lead to a better understand- tion equation (within the 60 % prediction boundary).
ing of past events and to more useful predictions of future
earthquakes.
www.solid-earth.net/10/379/2019/ Solid Earth, 10, 379–390, 2019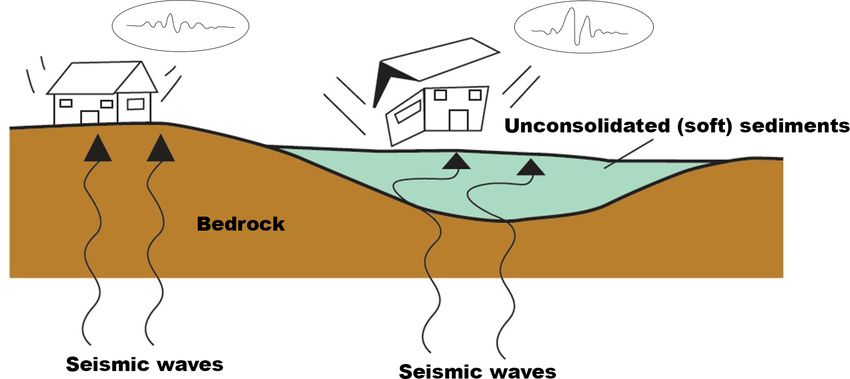
386                                            Y. Darvasi and A. Agnon: Recalibration of Dead Sea region attenuation curve

Figure 9. Comparison between our Vs30 results (light blue) and        Figure 10. Comparison between GII’s closest measurements (up to
those calculated from GII’s report (red) (Aksinenko and Hofstetter,   550 m).
2012).

                                                                      the famous valley of Gilboa some 10 km from the Dead Sea
4.1   Survey locations and validation                                 rift and a site of many millennia of agriculture. The high-
                                                                      est value is 1444 m s−1 in Peki’in, 680 m a.s.l. (Fig. 11), in
The decision as to where exactly each survey should take              an area of ancient hillside orchards and massive carbonate
place was based on Avni’s thesis (1999). Where the location           bedrock. On the other hand, the two Motza sites (Fig. 11)
was not sufficiently known, we rechecked the reference given          lie in Emek HaArazim (valley of the cedars) on the west-
by Avni. In most cases, there was evidence of specific dam-           ern flank of Jerusalem within the massive anticlinorium of
aged buildings. We tried to locate these buildings on histor-         the Judean Hills, at about 570 m a.s.l. Motza 1 (1065 m s−1 )
ical maps (1927–1945). Unfortunately, most sites were lo-             is on a compacted dirt parking lot above alluvium and the
cated inside urban areas, where we could not carry out the            Soreq Fm., while Motza 2 (874 m s−1 ) is farther up the val-
seismic surveys. Therefore, we surveyed in nearby open ar-            ley on a gentle hillside above the Beit Meir Fm. Both are of
eas as close as possible to the referenced damage zones.              similar limestone and marl composition and Cretaceous age.
   To validate our results, we compared them with a sum-
mary of thousands of seismic evaluations around Israel car-           4.2   A new attenuation equation
ried out over the years by the Geophysical Institute of Israel
(GII) and compiled in a report by Aksinenko and Hofstet-              In the present case of the 1927 earthquake, the sources of
ter (2012). These evaluations were based upon refraction and          the data are mostly historical documents and not strong data
borehole velocity measurements yielding Vs and/or Vp val-             measurements. This makes it difficult to quantify site re-
ues, as well as the effects of topography and geology. The            sponse into a single equation. In the practical modern attenu-
spacing of their data was such that often a number of GII sites       ation relationship, Vs30 is a crucial index. A term that depends
had to be averaged to provide a value within several kilome-          on Vs30 has previously been constrained for several large data
ters for comparison with our MASW values. However, Fig. 9             sets (Abrahamson et al., 2014; Boore et al., 1997; Camp-
shows that the GII-based values are in consistent agreement           bell and Bozorgnia, 2008). We chose the Boore et al. (1997)
with those of the MASW. However, this comparison is a bit             attenuation equation (Eq. 4) in order to emphasize site re-
tricky because Vs30 results for two sites 5 km or much less           sponse:
distant could be significantly different, as shown in Fig. 10.
Remembering that Vs30 enters a logarithmic term, we find our          ln (Y ) = b1 + b2 (M − 6) + b3 (M − 6)2 + b5
approach potentially useful.                                                                Vs
   Table 2 lists our 24 sites alphabetically, with their respec-             ln (r) + bv ln    ,                                  (4)
                                                                                            VA
tive Vs30 values, the computed errors and epicentral distances,
d. The Vs30 values vary from a low of 232 m s−1 in Beit Alfa,         where Y is the ground-motion variable (peak horizontal ac-
−85 m a.s.l. (Fig. 11), in the thick and active alluvial plain of     celeration or pseudo-acceleration response in g), M is the

Solid Earth, 10, 379–390, 2019                                                                  www.solid-earth.net/10/379/2019/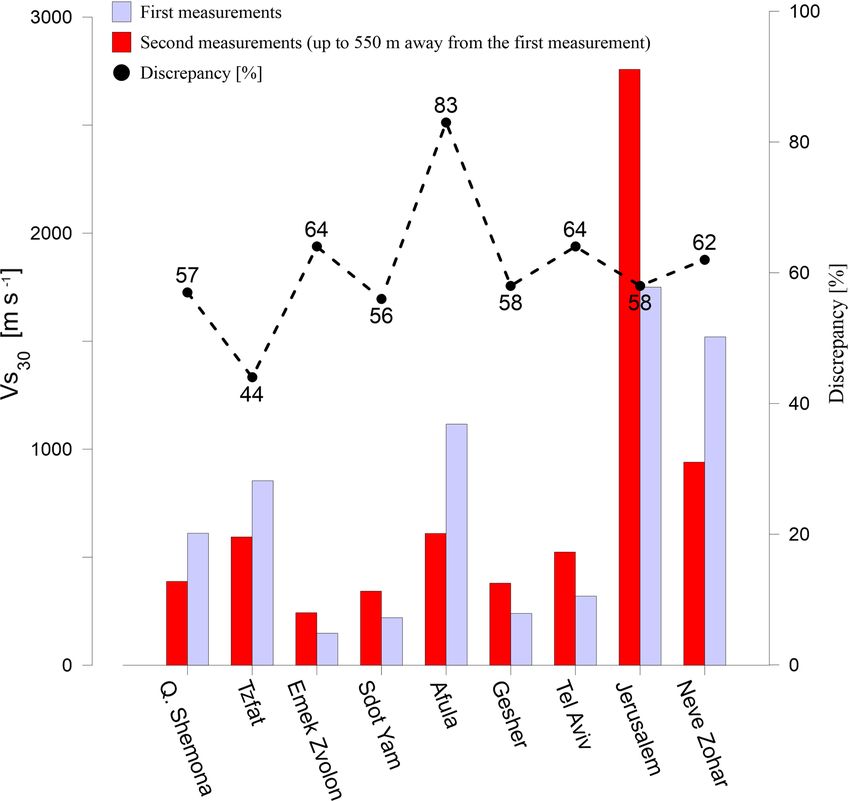
Y. Darvasi and A. Agnon: Recalibration of Dead Sea region attenuation curve                                                               387

Figure 11. Three of the sites investigated: (a) Motza 1, (b) Motza 2 and (c) Peki’in. Black lines represent the seismic line location. (d) The
locations of the sites over a 25 m DTM image (Hall, 2008). Also shown are sites mentioned in the text: Jerusalem (J) and Emek HaArazim
(EH).

moment magnitude, r is the epicentral distance in kilometers,
and VA and all b terms are frequency-dependent coefficients
to be determined. By adding Boore et al.’s (1997) Vs term to
the Hough and Avni (2011) attenuation equation (Eq. 2), we
suggest a new equation for the region:

MMI = −0.64 + 1.7M − 0.00448d − 1.67
                  Vs
   log (d) + C4 ln 30 ,                                         (5)
                  VA

where VA and C4 are adjustable coefficients. The first four
coefficients remain the same as we assert that the magni-
tude, attenuation, geometrical spreading and site response
are all independent. We adopt the value of VA from Boore
et al.’s (1997) equation (Eq. 4), as it represents a single              Figure 12. A sensitivity analysis for calibration of the new equation.
value independent of the frequency. We took formerly de-
rived GMPE, with its coefficients, and added another term,
by regressing only for the new coefficient, then optimizing
                                                                         4.3    The performance of the new attenuation equation
C4 and VA by least squares fitting (LSF), as shown in Fig. 12;
we get the final equation:
                                                                         With these coefficients, 58 %, or 11 of 19 sites, were am-
                                                                         plified or de-amplified as we expected. For the entire dis-
MMI = −0.64 + 1.7M − 0.00448d − 1.67                                     tance range (up to 250 km), the Vs30 corrections leave 42 %
                   Vs                                                    of sites out of the prediction boundary (8 of 19 sites). Seis-
   log (d) − 2.1 ln 30 .                                        (6)      mic intensities at all eight sites are overpredicted by the at-
                   655
                                                                         tenuation equation (Eq. 2) (Fig. 13). We expect that Vs30 at
                                                                         these sites will be higher than 655 m s−1 in order to obtain

www.solid-earth.net/10/379/2019/                                                                         Solid Earth, 10, 379–390, 2019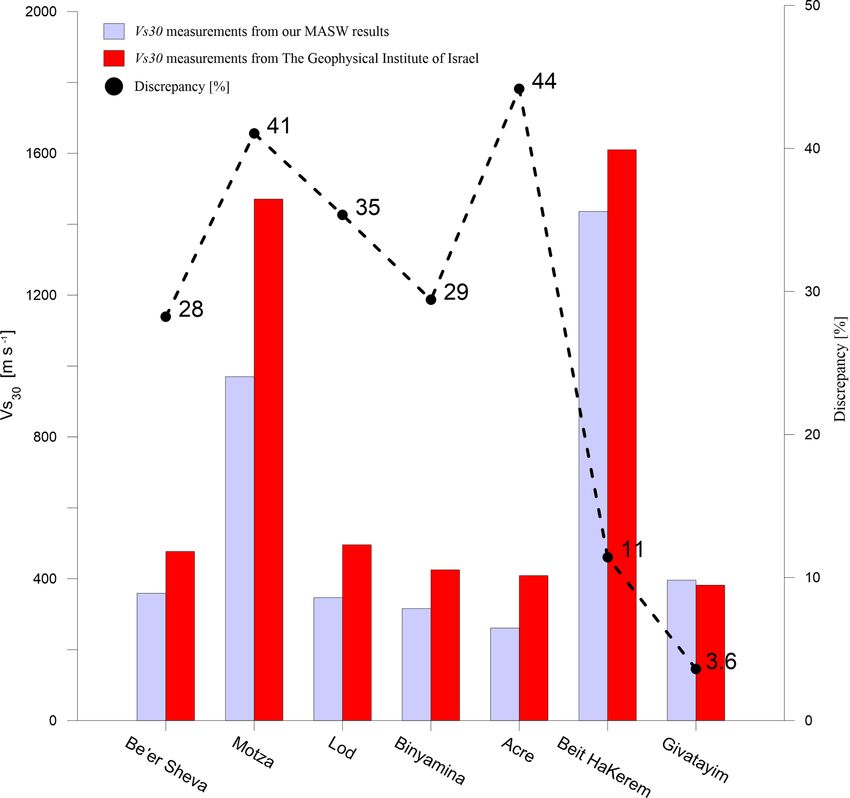
388                                               Y. Darvasi and A. Agnon: Recalibration of Dead Sea region attenuation curve

                                                                          quality, foundation depth, topography, earthquake directiv-
                                                                          ity, type of fault, etc. Obviously, for better results, we must
                                                                          use additional methods and jointly invert some other seismic
                                                                          data such as refraction (S and P waves), horizontal-to-vertical
                                                                          spectral ratio (HVSR), MASW of the transverse component
                                                                          of Love waves, MASW of the radial component of Rayleigh
                                                                          wave, extended spatial autocorrelation (ESAC), etc. Also,
                                                                          with these data in hand, a full inversion for the epicenter will
                                                                          be in order.
                                                                             Despite the scarcity of data, this is the first time that an
                                                                          integration of historical data with shear-wave velocity profile
                                                                          measurements improved the attenuation relation. In order to
                                                                          better estimate the peak ground acceleration or the seismic
                                                                          intensities that will be caused by future earthquakes, attenu-
                                                                          ation relations are necessary for areas characterized by high
Figure 13. Site response corrections: yellow dots are MMI before          seismicity. Some of the regions of low-to-moderate seismic-
site correction, and black dots, with error bars due to Vs uncertainty,   ity have rich sources of historical earthquake data. The in-
represent the MMI after reducing site effects.                            tegration of historical data with modern shear-wave velocity
                                                                          profile measurements will lead to a better understanding of
                                                                          future earthquakes.
de-amplification. However, our results show the opposite ef-
fect – these eight sites are characterized by lower Vs30 , which
drives amplification. This can be caused by the fact that mea-            Data availability. The entire database of the Vs measurements
surements were taken over agricultural fields, of which the               can be found at https://doi.org/10.6084/m9.figshare.7775972.v1
upper layers (the first few meters) are characterized by low              (Davarsi and Agnon, 2019).
shear-wave velocity, decreasing the average Vs . Another rea-
sonable explanation is that we did not succeed in extracting
the average shear-wave velocity down to 30 m and perhaps                  Supplement. The supplement related to this article is available
we missed some high-velocity shear-wave layers in deeper                  online at: https://doi.org/10.5194/se-10-379-2019-supplement.
layers. In such cases, we constrain the last layer to be thicker
in order to estimate Vs30 for all our surveys.
                                                                          Competing interests. The authors declare that they have no conflict
                                                                          of interest.

5   Conclusions
                                                                          Special issue statement. This article is part of the special issue
In this research, we investigate site amplification and de-               “Environmental changes and hazards in the Dead Sea region
amplification around Israel. According to previous studies                (NHESS/ACP/HESS/SE inter-journal SI)”. It is not associated with
(Aki, 1988; Boore, 2003; Borcherdt, 1994; Field and Jacob,                a conference.
1995; Joyner and Boore, 1988), the local lithology can am-
plify or de-amplify wave amplitude. The commonly used
modern seismic method – MASW – allowed the extraction                     Acknowledgements. We thank the Neev Center for Geoinfomat-
of Vs profiles at 19 sites reportedly damaged by the 1927                 ics’s facilities and its students. We are especially grateful to John
6.2 ML earthquake. We use these profiles to update the at-                K. Hall, founder of the Center, for his ongoing support. We are
tenuation equation for the Dead Sea region by including the               grateful to the Helmholtz Association of German Research Centers
Vs30 term.                                                                for funding this research. We thank Moshe Reshef for comments
                                                                          and suggestions on an earlier draft and Ran Bachrach for valuable
   According to this new equation, 11 sites, which constitute
                                                                          advice. We acknowledge the contribution of Michael Weber and
58 % of our measured samples, move into the 60 % predic-                  the geophysical deep sounding section at GFZ. Finally, we thank
tion boundary. This suggests that the prediction boundary ac-             Amit Ronen for his assistance.
tually encompasses over 80 % of the macroseismic observa-
tions. This fit is better than any available attenuation equa-            Edited by: Charlotte Krawczyk
tion for the Dead Sea region. However, as we have used                    Reviewed by: two anonymous referees
only 19 sites, we should consider further research and pro-
vide wider results. Although our final equation (Eq. 6) shows
amplification and de-amplification depending on Vs30 , it does
not take into consideration any other factor, such as building

Solid Earth, 10, 379–390, 2019                                                                        www.solid-earth.net/10/379/2019/
Y. Darvasi and A. Agnon: Recalibration of Dead Sea region attenuation curve 389
References Brawer, A. Y.: Earthquakes events in Israel from July 1927 to Au-
gust 1928, Jew. Pal. Expl. Soc., 316–325, 1928. (in Hebrew)
Building Seismic Safety Council (BSSC): NEHRP recommended
Abel, F.-M.: Le recent tremblement de terre en Palestine, Rev. provisions for seismic regulations for new buildings and other
Biblique, 36, 571–578, 1927. structures, Part 1: Provisions, Federal Emergency Management
Abrahamson, N. A., Silva, W. J., and Kamai, R.: Summary of the Agency, 368, Washington, D.C., 2001.
ASK14 ground motion relation for active crustal regions, Earthq. Campbell, K. W. and Bozorgnia, Y.: NGA ground motion model for
Spectra, 30, 1025–1055, 2014. the geometric mean horizontal component of PGA, PGV, PGD
Aguirre, J. and Irikura, K.: Nonlinearity, liquefaction, and veloc- and 5 % damped linear elastic response spectra for periods rang-
ity variation of soft soil layers in Port Island, Kobe, during the ing from 0.01 to 10 s, Earthq. Spectra, 24, 139–171, 2008.
Hyogo-ken Nanbu earthquake, B. Seismol. Soc. Am., 87, 1244– CEN, EN 1998-1 Eurocode 8: Design of Structures for Earthquake
1258, 1997. Resistance, Part 1: General Rules, Seismic Actions and Rules for
Aki, K.: Local site effect on ground motion, Earthq. Eng. Soil Dyn. Buildings, CEN, European Committee for Standardization, 2005.
II Recent Adv. Ground-Motion Eval., 1988. Ciaccio, M. G. and Cultrera, G.: Terremoto e rischio sismico,
Aki, K. and Richards, P. G.: Quantitative seismology, Mill Valley, Ediesse, Italy, 2014.
Calif: University Science Book, 2002. Dal Moro, G.: Surface wave analysis for near surface applications,
Aksinenko, T. and Hofstetter, A.: 1-D semi-empirical modeling of Elsevier, Italy, 2014.
the subsurface across Israel for site effect evaluations, State of Dal Moro, G., Pipan, M., and Gabrielli, P.: Rayleigh wave disper-
Israel GII Report ES_17_2012, Ministry of Energy and Water sion curve inversion via genetic algorithms and marginal poste-
Resources, 2012. rior probability density estimation, J. Appl. Geophys., 61, 39–55,
Ambraseys, N.: Earthquakes in the Mediterranean and Middle East: 2007.
a multidisciplinary study of seismicity up to 1900, Cambridge Darvasi, Y. and Agnon, A.: Database of Vs measurements,
University Press, Cambridge, 2009. https://doi.org/10.6084/m9.figshare.7775972.v1, 2019.
Ambraseys, N. N. and Melville, C. P.: An analysis of the eastern Field, E. H. and Jacob, K. H.: A comparison and test of various
Mediterranean earthquake of 20 May 1202, in: Historical Seis- site-response estimation techniques, including three that are not
mograms and Earthquakes of the World, edited by: Lee, W., Aca- reference-site dependent, B. Seismol. Soc. Am., 85, 1127–1143,
demic Press, San Diego, CA, 181–200, 1988. 1995.
Amiran, D. H. K.: A revised earthquake-catalogue of Palestine, Isr. Foti, S., Lai, C. G., Rix, G. J., and Strobbia, C.: Surface wave meth-
Explor. J., 2, 48–65, 1952. ods for near-surface site characterization, CRC press, Boca Ra-
Arieh, E.: Seismicity of Israel and adjacent areas, Geol. Surv. Isr. ton, 2014.
Bull., 43, 10–14, 1967. Guidoboni, E. and Comastri, A.: Catalogue of Earthquakes and
Avni, R.: The 1927 Jericho earthquake, comprehensive macroseis- Tsunamis in the Mediterranean Area from the 11th to the 15th
mic analysis based on contemporary sources, Ben-Gurion Univ. Century, SGA, Roma-Bologna, 2005.
Negev, Beersheba, 203, 1999. Hall, J. F. (Ed.): Northridge Earthquake January 17, 1994: Prelimi-
Bakun, W. H. U. and Wentworth, C. M.: Estimating earthquake lo- nary Reconnaissance Report, Publ. No. 94-01, Earthquake Engi-
cation and magnitude from seismic intensity data, B. Seismol. neering Research Institute, Oakland, Calif., 1994.
Soc. Am., 87, 1502–1521, 1997. Hall, J. K.: The 25-m DTM (digital terrain model) of Israel, Isr. J.
Ben-Menahem, A., Nur, A., and Vered, M.: Tectonics, seismicity Earth Sci., 57, 145–147, 2008.
and structure of the Afro-Eurasian junction – the breaking of an Hough, S. E. and Avni, R.: The 1170 and 1202 CE Dead
incoherent plate, Phys. Earth Planet. Inter., 12, 1–50, 1976. Sea Rift earthquakes and long-term magnitude distribution of
Ben-Menahem, A.: Four thousand years of seismicity along the the Dead Sea Fault Zone, Isr. J. Earth Sci., 58, 295–308,
Dead Sea rift, J. Geophys. Res.-Sol. Ea., 96, 20195–20216, 1991. https://doi.org/10.1560/IJES.58.3-4.295, 2011.
Blanckenhorn, M.: Das Erdbeben im Juli 1927 in Palästina, Z. Deut. Hough, S. E., Friberg, P. A., Busby, R., Field, E. F., Jacob, K. H.,
Palastina-Ver., 4, 288–296, 1927. and Borcherdt, R. D.: Sediment-induced amplification and the
Boore, D. M.: Simulation of ground motion using the stochastic collapse of the Nimitz Freeway, Nature, 344, 853–855, 1990.
method, Pure Appl. Geophys., 160, 635–676, 2003. Joyner, W. B. and Boore, D. M.: Measurement, characterization,
Boore, D. M., Joyner, W. B., and Fumal, T. E.: Equations for esti- and prediction of strong ground motion, in: Earthquake Engi-
mating horizontal response spectra and peak acceleration from neering and Soil Dynamics II, Proceedings of American Society
western North American earthquakes: A summary of recent of Civil Engineers Geotechnical Engineering Division Specialty
work, Seismol. Res. Lett., 68, 128–153, 1997. Conference, Park City, Utah, 27–30 June, 43–102, 1988.
Boore, D. M., Thompson, E. M., and Cadet, H.: Regional correla- Kagan, E., Stein, M., Agnon, A., and Neumann, F.: In-
tions of Vs30 and velocities averaged over depths less than and trabasin paleoearthquake and quiescence correlation of the
greater than 30 meters, B. Seismol. Soc. Am., 101, 3046–3059, late Holocene Dead Sea, J. Geophys. Res.-Sol. Ea., 116,
2011. https://doi.org/10.1029/2010JB007452, 2011.
Borcherdt, R., Glassmoyer, G., Andrews, M., and Cranswick, E.: Medvedev, S. V., Sponheuer, W., and Karnik, V.: Seismic intensity
3 Effect of Site Conditions On Ground Motion and Damage, scale version MSK 1964, United nation Educ. Sci. Cult. Organ.
Earthq. Spectra, 5, 23–42, 1989. Paris, 7, 1965.
Borcherdt, R. D.: Estimates of site-dependent response spectra for Milne, J.: Seismology: London, Kegan Paul, Trench, Truber, Lon-
design (methodology and justification), Earthq. Spectra, 10, 617– don, 1898.
653, 1994.
www.solid-earth.net/10/379/2019/ Solid Earth, 10, 379–390, 2019390 Y. Darvasi and A. Agnon: Recalibration of Dead Sea region attenuation curve Park, C. B., Miller, R. D., and Xia, J.: Multi-channel analysis of The Standards Institution of Israel (SII): Israeli Standard SI 413 surface waves (MASW) – a summary report of technical aspects, Amendment No. 5, 2013. experimental results, and perspective, Kansas Geol. Surv., open Willis, B.: Earthquakes in the holy land, B. Seismol. Soc. Am., 18, file report No: 97-10, 1997. 73–103, 1928. Park, C. B., Miller, R. D., and Xia, J.: Imaging dispersion curves of Xia, J., Miller, R. D., and Park, C. B.: Estimation of near-surface surface waves on multi-channel record, in: SEG Technical Pro- shear-wave velocity by inversion of Rayleigh waves, Geophysics, gram Expanded Abstracts 1998, 1377–1380, Society of Explo- 64, 691–700, 1999. ration Geophysicists, 1998. Xia, J., Miller, R. D., Park, C. B., Hunter, J. A., Harris, J. B., and Ryden, N., Park, C. B., Ulriksen, P., and Miller, R. D.: Multimodal Ivanov, J.: Comparing shear-wave velocity profiles inverted from approach to seismic pavement testing, J. Geotech. Geoenviron- multichannel surface wave with borehole measurements, Soil mental Eng., 130, 636–645, 2004. Dyn. Earthq. Eng., 22, 181–190, 2002. Shani-Kadmiel, S., Tsesarsky, M., and Gvirtzman, Z.: Distributed Zaslavsky, Y., Shapira, A., Gorstein, M., Perelman, N., Ataev, Slip Model for Forward Modeling Strong Earthquakes, B. Seis- G., and Aksinenko, T.: Questioning the applicability of mol. Soc. Am., 106, 93–103, 2016. soil amplification factors as defined by NEHRP (USA) Shapira, A.: Redetermined magnitudes of earthquakes in the Afro- in the Israel building standards, Nat. Sci., 4, 631–639, Eurasian Junction, Isr. J. Earth Sci., 28, 107–109, 1979. https://doi.org/10.4236/ns.2012.428083, 2012. Shapira, A., Avni, R., and Nur, A.: A new estimate for the epicenter Zohar, M. and Marco, S.: Re-estimating the epicenter of the 1927 of the Jericho earthquake of 11 July 1927, Isr. J. Earth Sci., 42, Jericho earthquake using spatial distribution of intensity data, J. 93–96, 1993. Appl. Geophys., 82, 19–29, 2012. Singh, S. K., Lermo, J., Dominguez, T., Ordaz, M., Espinosa, J. M., Mena, E. and Quaas, R.: The Mexico earthquake of September 19, 1985 – a study of amplification of seismic waves in the valley of Mexico with respect to a hill zone site, Earthq. Spectra, 4, 653–673, 1988. Solid Earth, 10, 379–390, 2019 www.solid-earth.net/10/379/2019/
You can also read