Mass balance of the Greenland Ice Sheet from 1992 to 2018
←
→
Page content transcription
If your browser does not render page correctly, please read the page content below
Article

Mass balance of the Greenland Ice Sheet
from 1992 to 2018

https://doi.org/10.1038/s41586-019-1855-2                            The IMBIE Team*

Received: 15 August 2019

Accepted: 25 November 2019                                           The Greenland Ice Sheet has been a major contributor to global sea-level rise in recent
Published online: 10 December 2019                                   decades1,2, and it is expected to continue to be so3. Although increases in glacier flow4–6
                                                                     and surface melting7–9 have been driven by oceanic10–12 and atmospheric13,14 warming,
    Check for updates
                                                                     the magnitude and trajectory of the ice sheet’s mass imbalance remain uncertain. Here
                                                                     we compare and combine 26 individual satellite measurements of changes in the ice
                                                                     sheet’s volume, flow and gravitational potential to produce a reconciled estimate of its
                                                                     mass balance. The ice sheet was close to a state of balance in the 1990s, but annual
                                                                     losses have risen since then, peaking at 345 ± 66 billion tonnes per year in 2011. In all,
                                                                     Greenland lost 3,902 ± 342 billion tonnes of ice between 1992 and 2018, causing the
                                                                     mean sea level to rise by 10.8 ± 0.9 millimetres. Using three regional climate models, we
                                                                     show that the reduced surface mass balance has driven 1,964 ± 565 billion tonnes (50.3
                                                                     per cent) of the ice loss owing to increased meltwater runoff. The remaining 1,938 ± 541
                                                                     billion tonnes (49.7 per cent) of ice loss was due to increased glacier dynamical
                                                                     imbalance, which rose from 46 ± 37 billion tonnes per year in the 1990s to 87 ± 25 billion
                                                                     tonnes per year since then. The total rate of ice loss slowed to 222 ± 30 billion tonnes
                                                                     per year between 2013 and 2017, on average, as atmospheric circulation favoured
                                                                     cooler conditions15 and ocean temperatures fell at the terminus of Jakobshavn Isbræ16.
                                                                     Cumulative ice losses from Greenland as a whole have been close to the rates predicted
                                                                     by the Intergovernmental Panel on Climate Change for their high-end climate warming
                                                                     scenario17, which forecast an additional 70 to 130 millimetres of global sea-level rise by
                                                                     2100 compared with their central estimate.

The Greenland Ice Sheet holds enough water to raise mean global sea                         measurements, reported by the 2012 Ice Sheet Mass Balance Inter-
level by 7.4 m (ref. 18). Its ice flows to the oceans through a network of                  comparison Exercise (IMBIE)1, have shown a fivefold increase in the
glaciers and ice streams19, each with a substantial inland catchment20.                     rate of ice loss from Greenland overall, rising from 51 ± 65 Gt yr−1 in the
Fluctuations in the mass of the Greenland Ice Sheet occur due to vari-                      early 1990s to 263 ± 30 Gt yr−1 between 2005 and 2010. This ice loss
ations in snow accumulation, meltwater runoff, ocean-driven melt-                           has been driven by changes in SMB7,21 and ice dynamics5,33. There was,
ing and iceberg calving. There have been marked increases in air21                          however, a marked reduction in ice loss between 2013 and 2018, as a
and ocean12 temperatures and reductions in summer cloud cover22                             consequence of cooler atmospheric conditions and increased pre-
around Greenland in the past few decades. These changes have pro-                           cipitation15. Although the broad pattern of change across Greenland
duced increases in surface runoff8, supraglacial lake formation23 and                       (Fig. 1) is one of ice loss, there is considerable variability; for example,
drainage24, iceberg calving25, glacier terminus retreat26, submarine                        during the 2000s just four glaciers were responsible for half of the total
melting10,11 and ice flow6, leading to widespread changes in the surface                    ice loss due to increased discharge5, whereas many others contribute
elevation—particularly near the margin of the ice sheet (Fig. 1).                           today33. Moreover, some neighbouring ice streams have been observed
   Over recent decades, ice losses from Greenland have made a sub-                          to speed up over this period while others slowed down35, suggesting
stantial contribution to global sea-level rise2, and model projections                      diverse reasons for the changes that have taken place—including their
suggest that this imbalance will continue in a warming climate3. Since                      geometrical configuration and basal conditions, as well as the forcing
the early 1990s there have been comprehensive satellite observations                        they have experienced36. In this study we combine satellite altimetry,
of changing ice sheet velocity4,6, elevation27–29 and, between 2002 and                     gravimetry and ice velocity measurements to produce a reconciled
2016, its changing gravitational attraction30,31, from which complete                       estimate of the Greenland Ice Sheet mass balance between 1992 and
estimates of Greenland Ice Sheet mass balance are determined1. Before                       2018, we evaluate the impact of changes in SMB and uncertainty in
the 1990s, only partial surveys of the ice sheet elevation32 and veloc-                     glacial isostatic adjustment and we partition the ice sheet mass loss
ity33 change are available. In combination with models of surface mass                      into signals associated with surface mass balance and ice dynamics. In
balance (SMB; the net difference between precipitation, sublimation                         doing so, we extend a previous assessment1 to include more satellite
and meltwater runoff) and glacial isostatic adjustment34, satellite                         and ancillary data and to cover the period since 2012.

*A list of participants and their affiliations appears at the end of the paper

                                                                                                                                       Nature | www.nature.com | 1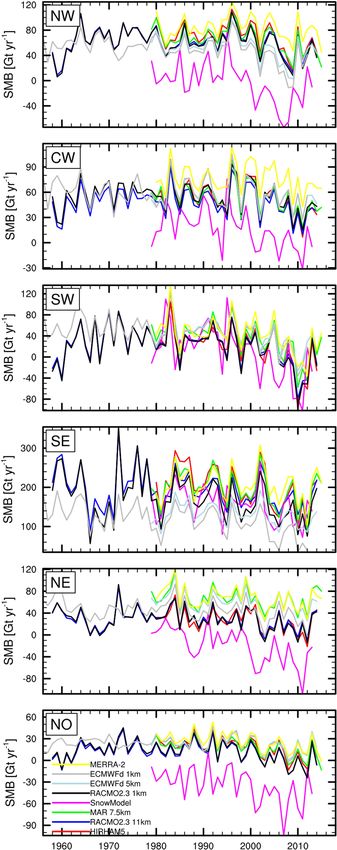
Article
1.00
0.75
Altimetry
0.50
0.25
Rate of change (m yr –1)
0
–0.25
–0.50
Surface
–0.75
–1.00
1992–1997 1997–2002 2002–2007 2007–2012 2012–2017
Fig. 1 | Greenland Ice Sheet elevation change. Rate of elevation change of the Greenland Ice Sheet determined from ERS, ENVISAT and CryoSat-2 satellite radar
altimetry (top row) and from the HIRHAM5 SMB model (ice equivalent; bottom row) over successive 5-yr epochs. Data from ref. 29.
Data and methods To compare and aggregate the individual satellite datasets, we first
We use 26 estimates of ice sheet mass balance derived from satellite adopt a common approach to derive linear rates of ice sheet mass bal-
altimetry (9 datasets), satellite gravimetry (14 datasets) and the input– ance over 36-month intervals (see Methods). We then compute error-
output method (3 datasets) to assess changes in the Greenland Ice weighted averages of all altimetry, gravimetry and input–output group
Sheet mass balance. The satellite data were computed using common mass trends, and combine these into a single reconciled estimate of
spatial20,37 and temporal domains, and a range of models to estimate the ice sheet mass balance using error-weighting of the group trends.
signals associated with changes in SMB and glacial isostatic adjust- Uncertainties in the individual rates of mass change are estimated as
ment. Satellite altimetry provides direct measurements of changing the root sum square of the linear model misfit and their measurement
ice sheet surface elevation recorded at orbit crossing points32, along error, uncertainties in the group rates are estimated as the root mean
repeated ground tracks27 or using plane-fit solutions28. The ice sheet square of the contributing time-series errors and uncertainties in the
mass balance is estimated from these measurements either by pre- reconciled rates are estimated as their root mean square error divided
scribing the density of the elevation fluctuation38 or by making an by the square root of the number of independent groups. Cumulative
explicit model-based correction for changes in firn height39. Satellite uncertainties are computed as the root sum square of annual errors,
gravimetry measures fluctuations in the Earth’s gravitational field an approach that has been employed in numerous studies1,17,33,41 and
computed using either global spherical harmonic solutions30 or using assumes that annual errors are not correlated over time. To improve
spatially discrete mass concentration units31. Ice sheet mass changes on this assumption, it is necessary to consider the covariance of the
are determined after making model-based corrections for glacial iso- systematic and random errors present in each mass balance solution
static adjustment30. The input–output method uses model estimates (see Methods).
of SMB7 (the input) and satellite observations of ice sheet velocity
computed from radar6 and optical40 imagery combined with airborne
measurements of ice thickness33 to compute changes in marine-ter- Intercomparison of satellite and model results
minating glacier discharge into the oceans (the output). The overall The satellite gravimetry and satellite altimetry data used in our assess-
mass balance is the difference between the input and output. Not all ment are corrected for the effects of glacial isostatic adjustment,
annual surveys of ice sheet discharge are complete, and sometimes although the correction is relatively small for altimetry as it manifests as
regional extrapolations have to be employed to account for gaps in a change in elevation and not mass. The most prominent and consistent
coverage33. Because they provide important ancillary data, we also local signals of glacial isostatic adjustment among the six models we
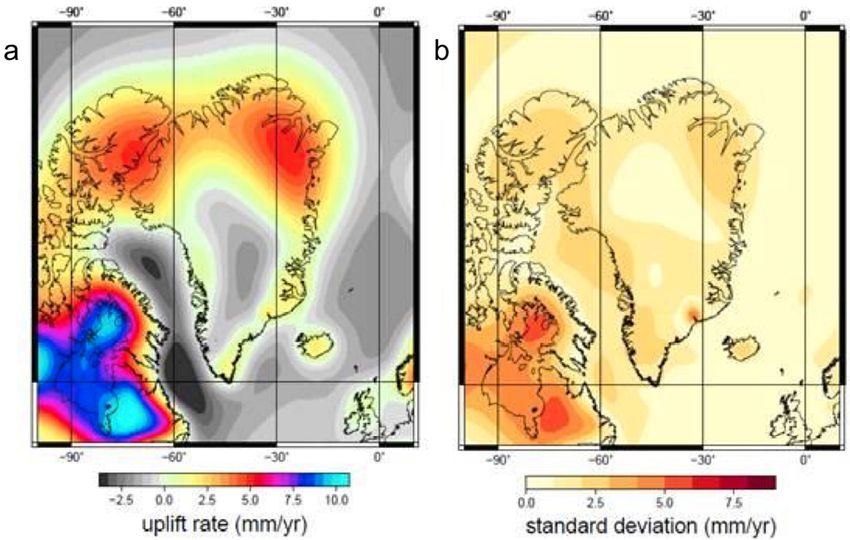
assess six models of glacial isostatic adjustment and ten models of considered are two instances of uplift peaking at about 5–6 mm yr−1,
surface mass balance. one centred over northwest Greenland and Ellesmere Island, and one
2 | Nature | www.nature.com
–1.0
                                                                                                         Altimetry                             Greenland
                                                                                                         Gravimetry
                                                200

                                                                                                                                                                   Sea-level contribution (mm yr–1)
                                                                                                         Input–output method                                –0.5
                                                                                                         All

                                                  0                                                                                                         0

                              dM/dt (Gt yr–1)
                                                       1
                                                                     2
                                                –200                                                                                                        0.5
                                                                         2
                                                           1 1                   2 2 2
                                                                                                                                                   2 1      1.0
                                                                 2                       2 17
                                                –400                         2                22 22 22                                  19 3
                                                                                                              23 19                21
                                                                                                         23                                    2
                                                                                                                      18                                    1.5
                                                                                                                           22 21
                                                            1995                 2000         2005              2010                    2015             2020
                                                                                                 Year

Fig. 2 | Greenland Ice Sheet mass balance. Rate of mass change (dM/dt, where                      estimated 1σ, 2σ and 3σ ranges of the class average are shaded in dark, mid and
M is mass and t time) of the Greenland Ice Sheet determined from the satellite-                   light grey, respectively; 97% of all estimates fall within the 1σ range, given their
altimetry, input–output method and gravimetry assessments included in this                        estimated individual errors. The equivalent sea-level contribution of the mass
study. In each case, dM/dt is computed at annual intervals from time series of                    change is also indicated (right vertical axis), and the number of individual mass-
relative mass change using a 3-yr window. An average of the estimates across                      balance estimates collated at each epoch is shown below each bar.
each measurement technique is also shown for each year (black line). The

over northeast Greenland (see Methods and Extended Data Fig. 3).                                  In general, there is close agreement between estimates determined
Although some models identify a 2 mm yr−1 subsidence under large                                  using each approach, and the standard deviations of annual mass bal-
parts of the central and southern parts of the ice sheet, it is absent                            ance solutions from the coincident altimetry, gravimetry and input–
or of lower magnitude in others, which suggests that it is less certain                           output methods are 42, 31 and 23 Gt yr−1, respectively (Extended Data
(Extended Data Table 1). The greatest difference among model solutions                            Table 3). Once averages were computed for each technique, the result-
is at Kangerlussuaq Glacier in the southeast, where a study42 has shown                           ing estimates of mass balance were also closely aligned (Extended Data
that models and observations agree if a localized weak Earth structure                            Fig. 6). For example, over the common period 2005–2015, the average
associated with overpassing the Iceland hotspot is assumed; the effect                            Greenland Ice Sheet mass balance is −254 ± 18 Gt yr−1 and, by compari-
is to offset earlier estimates of mass trends associated with glacial iso-                        son, the spread of the altimetry, gravimetry and input–output method
static adjustment by about 20 Gt yr−1. Farther afield, the highest spread                         estimates is just 36 Gt yr−1 (Extended Data Table 3). The estimated uncer-
between modelled uplift occurs on Baffin Island and beyond due to                                 tainty of the aggregated mass balance solution (see Methods) is larger
variations in regional model predictions related to the demise of the                             than the standard deviation of model corrections for glacial isostatic
Laurentide Ice Sheet42. This regional uncertainty is probably a major                             adjustment (20 Gt yr−1 for gravimetry) and for surface mass balance
factor in the spread across the ice-sheet-wide estimates. Neverthe-                               (40 Gt yr−1), which suggests that their collective impacts have been
less, at −3 ± 20 Gt yr−1, the mass signal associated with glacial isostatic                       adequately compensated; it is also larger than the estimated 30 Gt yr−1
adjustment in Greenland shows no coherent substantive change and                                  mass losses from peripheral ice caps44, which are not accounted for in
is negligible relative to reported ice sheet mass trends1.                                        all individual solutions. In keeping with results from Antarctica41, rates
   There is generally good agreement between the models of Greenland                              of mass loss determined using the input–output method are the most
Ice Sheet SMB that we have assessed for determining mass input—                                   negative, and those determined from altimetry are the least negative.
particularly those of a similar class; for example, 70% of all model                              However, the spread among the three techniques is six times lower for
estimates of runoff and accumulation fall within 1σ of their mean                                 Greenland than it is for Antarctica41, reflecting differences in ice sheet
(see Methods and Extended Data Table 2). The exceptions are a global                              size, the complexity of the mass balance processes and the limitations
reanalysis with coarse spatial resolution that tends to underestimate                             of the various geodetic techniques.
runoff due to its poor delineation of the ablation zone, and a snow
process model that tends to underestimate precipitation and to over-
estimate runoff in most sectors. Among the other eight models, the                                Ice sheet mass balance
average surface mass balance between 1980 and 2012 is 361 ± 40 Gt yr−1,                           We aggregated the average mass balance estimates from gravimetry,
with a marked negative trend over time (Extended Data Fig. 4) that is                             altimetry and the input–output method to form a single, time-varying
mainly due to increased runoff7. At the regional scale, the largest dif-                          record (Fig. 2) and then integrated these data to determine the
ferences occur in the northeast, where two regional climate models                                cumulative mass lost from Greenland since 1992 (Fig. 3). Although
predict considerably less runoff, and in the southeast, where there                               Greenland has been losing ice throughout most of the intervening
is considerable spread in precipitation and runoff across all models.                             period, the rate of loss has varied considerably. The rate of ice loss
All models show high temporal variability in SMB components, and                                  progressively increased between 1992 and 2012, reaching a maximum
all models show that the southeast receives the highest net intake of                             of 345 ± 66 Gt yr−1 in 2011, ahead of the extreme summertime surface
mass at the surface due to high rates of snowfall originating from the                            melting that occurred in the following year14. Since 2012, however,
Icelandic Low43. By contrast, the southwest, which features the wid-                              the trend has reversed, with a progressive reduction in the rate of
est ablation zone7, has experienced alternate periods of net surface                              mass loss during the subsequent period. By 2018—the last complete
mass loss and gain over recent decades, and has the lowest average                                year of our survey—the annual rate of ice mass loss had reduced to
SMB across the ice sheet.                                                                         85 ± 75 Gt yr−1. The highly variable nature of ice losses from Green-
   We assessed the consistency of the satellite altimetry, gravimetry and                         land is a consequence of the wide range of physical processes that
input–output method estimates of Greenland Ice Sheet mass balance                                 are affecting different sectors of the ice sheet16,28,35, which suggests
using common spatial and temporal domains (see Fig. 2 and Methods).                               that care should be taken when extrapolating measurements that

                                                                                                                                                                Nature | www.nature.com | 3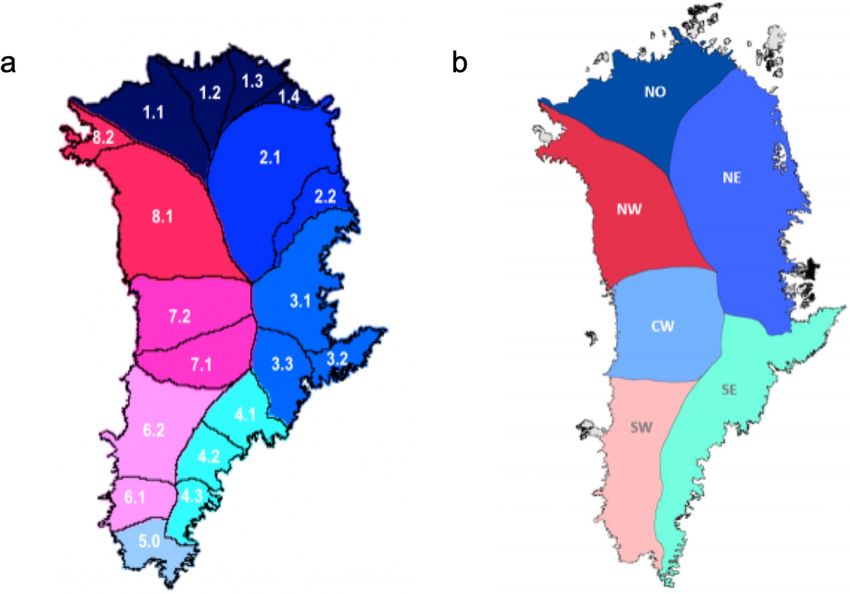
Article
                                                    1,000
                                                                                                                                                       2

                                                        0                                                                                              0

                                                                                                                                                             Sea-level contribution (mm)
                                                                                                                                                       –2
                                                    –1,000

                                 Mass change (Gt)
                                                                                                                                                       –4
                                                    –2,000
                                                                                                                                                       –6

                                                    –3,000                                                                                             –8

                                                                        Total
                                                                                                                                                       –10
                                                                        IMBIE 2012
                                                    –4,000
                                                                        Surface                                                                        –12
                                                                        Dynamics
                                                    –5,000
                                                        1980            1985     1990        1995   2000        2005      2010        2015         2020
                                                                                                    Year

Fig. 3 | Cumulative anomalies in the total mass, SMB and ice dynamics of the                           uncertainties of the cumulative changes are shown by the shaded envelopes.
Greenland Ice Sheet. The total change is determined as the integral of the                             The dotted line shows the result of a previous assessment1. The equivalent sea-
average rate of ice sheet mass change (Fig. 2). The change in SMB is determined                        level contribution of the mass change is also indicated (right vertical axis).
from three regional climate models relative to their mean over the period                              Vertical dashed lines mark consecutive 5-yr epochs since the start of our
1980–1990. The change associated with ice dynamics is determined as the                                satellite record in 1992. The IMBIE 2012 data is from ref. 1.
difference between the change in total and surface mass. The estimated 1σ

are sparse in space or time. Although the rates of mass loss we have                                   common to all models. In this comparison, all three models show that
computed between 1992 and 2011 are 16% less negative than those of                                     the Greenland Ice Sheet entered abruptly into a period of anomalously
a previous assessment, which included far fewer datasets1, the results                                 low SMB in the late 1990s and, when combined, they show that the ice
are consistent given their respective uncertainties. Altogether, the                                   sheet lost 1,964 ± 565 Gt of its mass due to meteorological processes
Greenland Ice Sheet has lost 3,902 ± 342 Gt of ice to the ocean since                                  between 1992 and 2018 (Table 1).
1992, with roughly half of this loss occurring during the 6-yr period                                     Just over half (50.3%) of all mass losses from Greenland—and much
between 2006 and 2012.                                                                                 of their short-term variability—have been due to variations in the ice
   To determine the proportion of mass lost due to surface and ice                                     sheet’s SMB and its indirect impacts on firn processes. For example,
dynamical processes, we computed the contemporaneous trend in                                          between 2007 and 2012, 70% of the total ice loss (193 ± 37 Gt yr−1) was
Greenland Ice Sheet surface mass balance—the net balance between                                       due to SMB, compared with 27% (22 ± 20 Gt yr−1) over the preceding
precipitation and ablation7, which is controlled by interactions with                                  15 years and 57% (139 ± 38 Gt yr−1) since then (Table 1). The rise in the
the atmosphere (Fig. 3). In Greenland, recent trends in surface mass                                   total rate of ice loss during the late 2000s coincided with warmer
balance have been largely driven by meltwater runoff43, which has                                      atmospheric conditions, which promoted several episodes of wide-
increased as the regional climate has warmed13. As direct observations                                 spread melting and runoff14. The reduction in surface mass loss since
of ice sheet surface mass balance are too scarce to provide full temporal                              then is associated with a shift of the North Atlantic Oscillation, which
and spatial coverage45, regional estimates are usually taken from atmos-                               brought about cooler atmospheric conditions and increased precipita-
pheric models that are evaluated with existing observations. Our evalu-                                tion along the southeastern coast15. Trends in the total ice sheet mass
ation (see Methods) shows that the finer-spatial-resolution regional                                   balance are not entirely due to surface mass balance, however, and by
climate models produce consistent results, probably due to their abil-                                 calculating the difference between these two signals, we can estimate
ity to capture local changes in melting and precipitation associated                                   the total change in mass loss due to ice dynamical imbalance—that is,
with atmospheric forcing, and to resolve the full extent of the ablation                               the integrated net mass loss from those glaciers whose velocity does
zone46. We therefore compare and combine estimates of Greenland                                        not equal their long-term mean (Fig. 3). Although this approach is indi-
SMB derived from three regional climate models: RACMO2.3p246,                                          rect, it makes use of all the satellite observations and regional climate
MARv3.621 and HIRHAM9. To assess the surface mass change across                                        models included in our study, overcoming limitations in the spatial and
the Greenland Ice Sheet between 1980 and 2018, we accumulate SMB                                       temporal sampling of ice discharge estimates derived from ice velocity
anomalies from each of the regional climate models (Extended Data                                      and thickness data. Our estimate shows that, between 1992 and 2018,
Fig. 7) and average them into a single estimate (Fig. 3). These SMB                                    Greenland lost 1,938 ± 541 Gt of ice due to the dynamical imbalance
anomalies are computed with respect to the average between 1980 and                                    of glaciers relative to their steady state, accounting for 49.7% of the
1990, which corresponds to a period of approximate balance8 and is                                     total imbalance (Table 1). Losses due to increased ice discharge rose

Table 1 | Rates of Greenland Ice Sheet total, surface and dynamical mass change

Region              1992–1997 (Gt yr−1) 1997–2002                                2002–2007          2007–2012           2012–2017 (Gt yr−1) 1992–2011 (Gt yr−1) 1992–2018
                                        (Gt yr−1)                                (Gt yr−1)          (Gt yr−1)                                                   (Gt yr−1)
Total               −26 ± 27                                 −44 ± 35            −174 ± 30          −275 ± 28           −244 ± 28              −119 ± 16                                   −150 ± 13
Surface             26 ± 35                                  −15 ± 36            −78 ± 36           −193 ± 37           −139 ± 38              −57 ± 18                                    −76 ± 16
Dynamics            −52 ± 44                                 −29 ± 50            −96 ± 47           −82 ± 46            −105 ± 47              −62 ± 24                                    −75 ± 21
Total rates were determined from all satellite measurements over the various epochs, rates of surface mass change were determined from three regional climate models and rates of dynamical
mass change were determined as the difference between the two. The period 1992–2011 is included for comparison with a previous assessment1, which reported a mass balance estimate of
−142 ± 49 Gt yr−1 based on far fewer data. The small differences in our updated estimate are due to our inclusion of more data and an updated aggregation scheme (see Methods). Errors are 1σ.

4 | Nature | www.nature.com
40 300
Rate of sea-level rise (mm yr –1)
2007–2018
35 1.00
250
0.75
30
0.50
Sea-level contribution (mm)
Sea-level contribution (mm)
25 200
0.25
20 0
IMBIE AR5 AR5 AR5 150
Upper Middle Lower
15
100
10
IMBIE
5 AR5 Upper
AR5 Middle 50
AR5 Lower
0
1995 2000 2005 2010 2015 2020 2025 2030 2035 2040 2040 2100
Year Year
Fig. 4 | Observed and predicted sea-level contributions from Greenland Ice order of increasing emissions: RCP2.6, RCP4.5, RCP6.0, SRES A1B and RCP8.5.
Sheet mass change. The global sea-level contribution from Greenland Ice Shaded areas represent the spread of AR5 emissions scenarios and the 1σ
Sheet mass change according to this study and the IPCC AR5 projections estimated error on the IMBIE data (this study). Inset, the average annual rates of
between 1992–2040 (left) and 2040–2100 (right) including upper, mid and sea-level rise during the overlap period 2007–2018 and their standard
lower estimates from the sum of modelled SMB and rapid ice dynamical deviations (error bars). Cumulative AR5 projections have been offset to make
contributions. Darker lines represent pathways from the five AR5 scenarios in them equal to the observational record at their start date (2007).
sharply in the early 2000s when Jakobshavn Isbræ10 and several other Conclusions
outlet glaciers in the southeast47 sped up, and the discharge losses We combine 26 satellite estimates of ice sheet mass balance and assess
are now four times higher than in the 1990s. For the period between 10 models of ice sheet SMB and 6 models of glacial isostatic adjustment
2002 and 2007, ice dynamical imbalance was the major source of ice to show that the Greenland Ice Sheet lost 3,902 ± 342 Gt of ice between
loss from the ice sheet as a whole, although the situation has since 1992 and 2018. During the common period 2005–2015, the spread of mass
returned to being dominated by surface mass losses as several glaciers balance estimates derived from three techniques is 36 Gt yr−1, or 14% of the
have slowed down16. estimated rate of imbalance. The rate of ice loss has generally increased
Despite a reduction in the overall rate of ice loss from Greenland over time, rising from 26 ± 27 Gt yr−1 between 1992 and 1997, peaking at
between 2013 and 2018 (Fig. 2), the ice sheet mass balance remained 275 ± 28 Gt yr−1 between 2007 and 2012, and reducing to 244 ± 28 Gt yr−1
negative, adding 10.8 ± 0.9 mm to global sea level since 1992. Although between 2012 and 2017. Just over half (1,964 ± 565 Gt, or 50.3%) of the ice
the average sea level contribution is 0.42 ± 0.04 mm yr−1, the 5-yr losses are due to reduced SMB (mostly meltwater runoff) associated with
average rate varied by a factor of 5 over the 25-yr period, peaking at changing atmospheric conditions13,14, and these changes have also driven
0.76 ± 0.08 mm yr−1 between 2007 and 2012. The variability in ice loss the shorter-term temporal variability in ice sheet mass balance. Despite
from Greenland illustrates the importance of accounting for annual variations in the imbalance of individual glaciers4,5,33, ice losses due to
fluctuations when attempting to close the global sea-level budget2. increasing discharge from the ice sheet as a whole have risen steadily
Satellite records of ice sheet mass balance are also an important tool from 46 ± 37 Gt yr−1 in the 1990s to 87 ± 25 Gt yr−1 since then, and account
for evaluating numerical models of ice sheet evolution48. In their 2013 for just under half of all losses (49.7%) over the survey period.
assessment, the Intergovernmental Panel on Climate Change (IPCC) Our assessment shows that estimates of Greenland Ice Sheet mass
predicted ice losses from Greenland due to SMB and glacier dynam- balance derived from satellite altimetry, gravimetry and the input–
ics under a range of scenarios, beginning in 200717 (Fig. 4). Although output method agree to within 20 Gt yr−1, that model estimates of SMB
ice losses from Greenland have fluctuated considerably during the agree to within 40 Gt yr−1 and that model estimates of glacial isostatic
12-yr period of overlap between the IPCC predictions and our recon- adjustment agree to within 20 Gt yr−1. These differences represent a
ciled time series, the total change and average rate (0.70 mm yr−1) are small fraction (13%) of the Greenland Ice Sheet mass imbalance and are
close to the upper range of predictions (0.72 mm yr−), which implies comparable to its estimated uncertainty (13 Gt yr−1). Nevertheless, there
70–130 mm of sea-level rise by 2100 above central estimates. The drop is still disagreement among models of glacial isostatic adjustment in
in ice losses between 2013 and 2018, however, shifted rates towards northern Greenland. Spatial resolution is a key factor in the degree to
the lower end of projections, and a longer period of comparison is which models of SMB can represent ablation and precipitation at local
required to establish whether the upper trajectory will continue to scales, and estimates of ice sheet mass balance determined from satel-
be followed. Even greater sea-level contributions cannot be ruled out lite altimetry and the input–output method continue to be positively
if feedbacks between the ice sheet and other elements of the climate and negatively biased, respectively, compared with those based on
system are underestimated by current ice sheet models3. Although the satellite gravimetry (albeit by small amounts). More satellite estimates
volume of ice stored in Greenland is a small fraction of that in Antarc- of ice sheet mass balance at the start (1990s) and end (2010s) of our
tica (12%), its recent losses have been ~38% higher41 as a consequence record would help to reduce the dependence on fewer data during
of the relatively strong atmospheric13,14 and oceanic10,11 warming that those periods; although new missions49,50 will no doubt address the
has occurred in its vicinity, and it is expected to continue to be a major latter period, further analysis of historical satellite data are required
source of sea-level rise3,17. to address the paucity of data during the early years.
Nature | www.nature.com | 5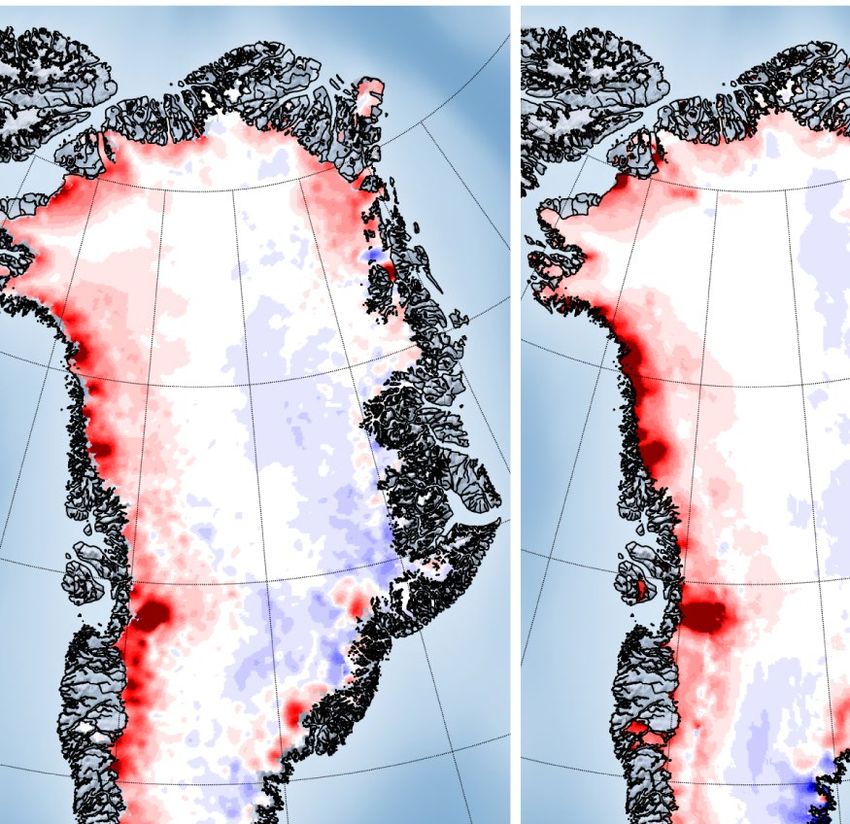
Article
                                                                                                      34. Lecavalier, B. S. et al. A model of Greenland ice sheet deglaciation constrained by
Online content                                                                                            observations of relative sea level and ice extent. Quat. Sci. Rev. 102, 54–84 (2014).
                                                                                                      35. King, M. D. et al. Seasonal to decadal variability in ice discharge from the Greenland Ice
Any methods, additional references, Nature Research reporting sum-                                        Sheet. Cryosphere 12, 3813–3825 (2018).
maries, source data, extended data, supplementary information,                                        36. Porter, D. F. et al. Identifying spatial variability in Greenland’s outlet glacier response to
                                                                                                          ocean heat. Front. Earth Sci. 6, 90 (2018).
acknowledgements, peer review information; details of author con-                                     37. Rignot, E. & Mouginot, J. Ice flow in Greenland for the International Polar Year 2008–
tributions and competing interests; and statements of data and code                                       2009. Geophys. Res. Lett. 39, L11501 (2012).
availability are available at https://doi.org/10.1038/s41586-019-1855-2.                              38. Sørensen, L. S. et al. Mass balance of the Greenland ice sheet (2003–2008) from ICESat
                                                                                                          data—the impact of interpolation, sampling and firn density. Cryosphere 5, 173–186
                                                                                                          (2011).
1.    Shepherd, A. et al. A reconciled estimate of ice-sheet mass balance. Science 338,               39. Zwally, H. J. et al. Greenland ice sheet mass balance: distribution of increased mass loss
      1183–1189 (2012).                                                                                   with climate warming; 2003–07 versus 1992–2002. J. Glaciol. 57, 88–102 (2011).
2.    WCRP Global Sea Level Budget Group. Global sea-level budget 1993–present. Earth Syst.           40. Rosenau, R., Scheinert, M. & Dietrich, R. A processing system to monitor Greenland outlet
      Sci. Data 10, 1551–1590 (2018).                                                                     glacier velocity variations at decadal and seasonal time scales utilizing the Landsat
3.    Pattyn, F. et al. The Greenland and Antarctic ice sheets under 1.5 °C global warming. Nat.          imagery. Remote Sens. Environ. 169, 1–19 (2015).
      Clim. Change 8, 1053–1061 (2018).                                                               41. The IMBIE Team. Mass balance of the Antarctic Ice Sheet from 1992 to 2017. Nature 558,
4.    Moon, T., Joughin, I., Smith, B. & Howat, I. 21st-century evolution of Greenland outlet             219–222 (2018).
      glacier velocities. Science 336, 576–578 (2012).                                                42. Khan, S. A. et al. Geodetic measurements reveal similarities between post–Last Glacial
5.    Enderlin, E. M. et al. An improved mass budget for the Greenland ice sheet. Geophys. Res.           Maximum and present-day mass loss from the Greenland ice sheet. Sci. Adv. 2, e1600931
      Lett. 41, 866–872 (2014).                                                                           (2016).
6.    Rignot, E. & Kanagaratnam, P. Changes in the velocity structure of the Greenland Ice            43. Ettema, J. et al. Higher surface mass balance of the Greenland ice sheet revealed by high-
      Sheet. Science 311, 986–990 (2006).                                                                 resolution climate modeling. Geophys. Res. Lett. 36, L12501 (2009).
7.    van den Broeke, M. et al. Partitioning recent Greenland mass loss. Science 326, 984–986         44. Bolch, T. et al. Mass loss of Greenland’s glaciers and ice caps 2003–2008 revealed from
      (2009).                                                                                             ICESat laser altimetry data. Geophys. Res. Lett. 40, 875–881 (2013).
8.    Trusel, L. D. et al. Nonlinear rise in Greenland runoff in response to post-industrial Arctic   45. Vernon, C. L. et al. Surface mass balance model intercomparison for the Greenland ice
      warming. Nature 564, 104–108 (2018).                                                                sheet. Cryosphere 7, 599–614 (2013).
9.    Lucas-Picher, P. et al. Very high resolution regional climate model simulations over            46. Noël, B. et al. Modelling the climate and surface mass balance of polar ice sheets using
      Greenland: identifying added value. J. Geophys. Res. D 117, 02108 (2012).                           RACMO2—Part 1: Greenland (1958–2016). Cryosphere 12, 811–831 (2018).
10.   Holland, D. M., Thomas, R. H., de Young, B., Ribergaard, M. H. & Lyberth, B.                    47. Howat, I. M., Joughin, I., Fahnestock, M., Smith, B. E. & Scambos, T. A. Synchronous
      Acceleration of Jakobshavn Isbræ triggered by warm subsurface ocean waters. Nat.                    retreat and acceleration of southeast Greenland outlet glaciers 2000–06: ice dynamics
      Geosci. 1, 659–664 (2008).                                                                          and coupling to climate. J. Glaciol. 54, 646–660 (2008).
11.   Seale, A., Christoffersen, P., Mugford, R. I. & O’Leary, M. Ocean forcing of the Greenland      48. Shepherd, A. & Nowicki, S. Improvements in ice-sheet sea-level projections. Nat. Clim.
      Ice Sheet: calving fronts and patterns of retreat identified by automatic satellite                 Change 7, 672–674 (2017).
      monitoring of eastern outlet glaciers. J. Geophys. Res. Earth Surf. 116, F03013 (2011).         49. Markus, T. et al. The Ice, Cloud, and land Elevation Satellite-2 (ICESat-2): science
12.   Straneo, F. & Heimbach, P. North Atlantic warming and the retreat of Greenland’s outlet             requirements, concept, and implementation. Remote Sens. Environ. 190, 260–273
      glaciers. Nature 504, 36–43 (2013).                                                                 (2017).
13.   Hanna, E., Mernild, S. H., Cappelen, J. & Steffen, K. Recent warming in Greenland in a          50. Flechtner, F. et al. What can be expected from the GRACE-FO laser ranging interferometer
      long-term instrumental (1881–2012) climatic context: I. Evaluation of surface air                   for earth science applications? Surv. Geophys. 37, 453–470 (2016).
      temperature records. Environ. Res. Lett. 7, 045404 (2012).
14.   Fettweis, X. et al. Important role of the mid-tropospheric atmospheric circulation in           Publisher’s note Springer Nature remains neutral with regard to jurisdictional claims in
      the recent surface melt increase over the Greenland ice sheet. Cryosphere 7, 241–248            published maps and institutional affiliations.
      (2013).
15.   Bevis, M. et al. Accelerating changes in ice mass within Greenland, and the ice sheet’s         © The Author(s), under exclusive licence to Springer Nature Limited 2019
      sensitivity to atmospheric forcing. Proc. Natl Acad. Sci. USA 116, 1934–1939 (2019).
16.   Khazendar, A. et al. Interruption of two decades of Jakobshavn Isbrae acceleration and
      thinning as regional ocean cools. Nat. Geosci. 12, 277–283 (2019); correction 12, 493           The IMBIE Team
      (2019).
17.   Church, J. A. et al. in Climate Change 2013: The Physical Science Basis (eds Stocker, T. F.     Andrew Shepherd1 ✉, Erik Ivins2, Eric Rignot2,3, Ben Smith4, Michiel van den Broeke5,
      et al.) 1137–1216 (IPCC, Cambridge Univ. Press, 2013).                                          Isabella Velicogna2,3, Pippa Whitehouse6, Kate Briggs1, Ian Joughin4, Gerhard Krinner7,
18.   Morlighem, M. et al. BedMachine v3: complete bed topography and ocean bathymetry                Sophie Nowicki8, Tony Payne9, Ted Scambos10, Nicole Schlegel2, Geruo A3, Cécile Agosta11,
      mapping of Greenland from multibeam echo sounding combined with mass                            Andreas Ahlstrøm12, Greg Babonis13, Valentina R. Barletta14, Anders A. Bjørk15, Alejandro
      conservation. Geophys. Res. Lett. 44, 11,051–11,061 (2017).                                     Blazquez16, Jennifer Bonin17, William Colgan12, Beata Csatho13, Richard Cullather18, Marcus
19.   Joughin, I., Smith, B. E., Howat, I. M., Scambos, T. & Moon, T. Greenland flow variability
                                                                                                      E. Engdahl19, Denis Felikson8, Xavier Fettweis11, Rene Forsberg14, Anna E. Hogg1, Hubert
      from ice-sheet-wide velocity mapping. J. Glaciol. 56, 415–430 (2010).
                                                                                                      Gallee7, Alex Gardner2, Lin Gilbert20, Noel Gourmelen21, Andreas Groh22, Brian Gunter23,
20.   Zwally, H. J., Giovinetto, M. B., Beckley, M. A. & Saba, J. L. Antarctic and Greenland
      Drainage Systems (GSFC Cryospheric Sciences Laboratory, 2012); http://icesat4.gsfc.             Edward Hanna24, Christopher Harig25, Veit Helm26, Alexander Horvath27, Martin Horwath22,
      nasa.gov/cryo_data/ant_grn_drainage_systems.php.                                                Shfaqat Khan14, Kristian K. Kjeldsen12,28, Hannes Konrad29, Peter L. Langen30,
21.   Fettweis, X. et al. Reconstructions of the 1900–2015 Greenland ice sheet surface mass            Benoit Lecavalier31, Bryant Loomis8, Scott Luthcke8, Malcolm McMillan32, Daniele Melini33,
      balance using the regional climate MAR model. Cryosphere 11, 1015–1033 (2017).                  Sebastian Mernild34,35,36,37, Yara Mohajerani3, Philip Moore38, Ruth Mottram30,
22.   Hofer, S., Tedstone, A. J., Fettweis, X. & Bamber, J. L. Decreasing cloud cover drives the      Jeremie Mouginot3,7, Gorka Moyano39, Alan Muir20, Thomas Nagler40, Grace Nield6,
      recent mass loss on the Greenland Ice Sheet. Sci. Adv. 3, e1700584 (2017).                      Johan Nilsson2, Brice Noël5, Ines Otosaka1, Mark E. Pattle39, W. Richard Peltier41,
23.   Leeson, A. A. et al. Supraglacial lakes on the Greenland ice sheet advance inland under
                                                                                                      Nadège Pie42, Roelof Rietbroek43, Helmut Rott40, Louise Sandberg Sørensen14,
      warming climate. Nat. Clim. Change 5, 51–55 (2015).
                                                                                                      Ingo Sasgen26, Himanshu Save42, Bernd Scheuchl3, Ernst Schrama44, Ludwig Schröder22,26,
24.   Palmer, S., McMillan, M. & Morlighem, M. Subglacial lake drainage detected beneath the
      Greenland ice sheet. Nat. Commun. 6, 8408 (2015).                                               Ki-Weon Seo45, Sebastian B. Simonsen14, Thomas Slater1, Giorgio Spada46, Tyler Sutterley3,
25.   Nick, F. M. et al. The response of Petermann Glacier, Greenland, to large calving events,       Matthieu Talpe2, Lev Tarasov31, Willem Jan van de Berg5, Wouter van der Wal44,47,
      and its future stability in the context of atmospheric and oceanic warming. J. Glaciol. 58,     Melchior van Wessem5, Bramha Dutt Vishwakarma48, David Wiese2, David Wilton49,
      229–239 (2012).                                                                                 Thomas Wagner50, Bert Wouters5,47 & Jan Wuite40
26.   Joughin, I. et al. Ice-front variation and tidewater behavior on Helheim and
      Kangerdlugssuaq Glaciers, Greenland. J. Geophys. Res. Earth Surf. 113, F01004 (2008).           1
                                                                                                       Centre for Polar Observation and Modelling, University of Leeds, Leeds, UK. 2NASA Jet
27.   Pritchard, H. D., Arthern, R. J., Vaughan, D. G. & Edwards, L. A. Extensive dynamic
                                                                                                      Propulsion Laboratory, California Institute of Technology, Pasadena, CA, USA. 3Department
      thinning on the margins of the Greenland and Antarctic ice sheets. Nature 461, 971–975
                                                                                                      of Earth System Science, University of California, Irvine, CA, USA. 4Department of Earth and
      (2009).
28.   McMillan, M. et al. A high-resolution record of Greenland mass balance. Geophys. Res.           Space Sciences, University of Washington, Seattle, WA, USA. 5Institute for Marine and
      Lett. 43, 7002–7010 (2016).                                                                     Atmospheric Research, Utrecht University, Utrecht, The Netherlands. 6Department of
29.   Sandberg Sørensen, L. et al. 25 years of elevation changes of the Greenland Ice Sheet           Geography, Durham University, Durham, UK. 7Institute of Environmental Geosciences,
      from ERS, Envisat, and CryoSat-2 radar altimetry. Earth Planet. Sci. Lett. 495, 234–241         Université Grenoble Alpes, Grenoble, France. 8Cryospheric Sciences Laboratory, NASA
      (2018).                                                                                         Goddard Space Flight Center, Greenbelt, MD, USA. 9School of Geographical Sciences,
30.   Velicogna, I. & Wahr, J. Greenland mass balance from GRACE. Geophys. Res. Lett. 32,             University of Bristol, Bristol, UK. 10Earth Science and Observation Center, University of
      L18505 (2005).
                                                                                                      Colorado, Boulder, CO, USA. 11Department of Geography, University of Liège, Liège, Belgium.
31.   Luthcke, S. B. et al. Recent Greenland ice mass loss by drainage system from satellite          12
                                                                                                        Geological Survey of Denmark and Greenland, Copenhagen, Denmark. 13Department of
      gravity observations. Science 314, 1286–1289 (2006).
32.   Zwally, H. J., Bindschadler, R. A., Brenner, A. C., Major, J. A. & Marsh, J. G. Growth of       Geology, State University of New York at Buffalo, Buffalo, NY, USA. 14DTU Space, National
      Greenland Ice Sheet: measurement. Science 246, 1587–1589 (1989).                                Space Institute, Technical University of Denmark, Kongens Lyngby, Denmark. 15Department
33.   Mouginot, J. et al. Forty-six years of Greenland Ice Sheet mass balance from 1972 to 2018.      of Geosciences and Natural Resource Management, University of Copenhagen,
      Proc. Natl Acad. Sci. USA 116, 9239–9244 (2019).                                                Copenhagen, Denmark. 16LEGOS, Université de Toulouse, Toulouse, France. 17College of

6 | Nature | www.nature.com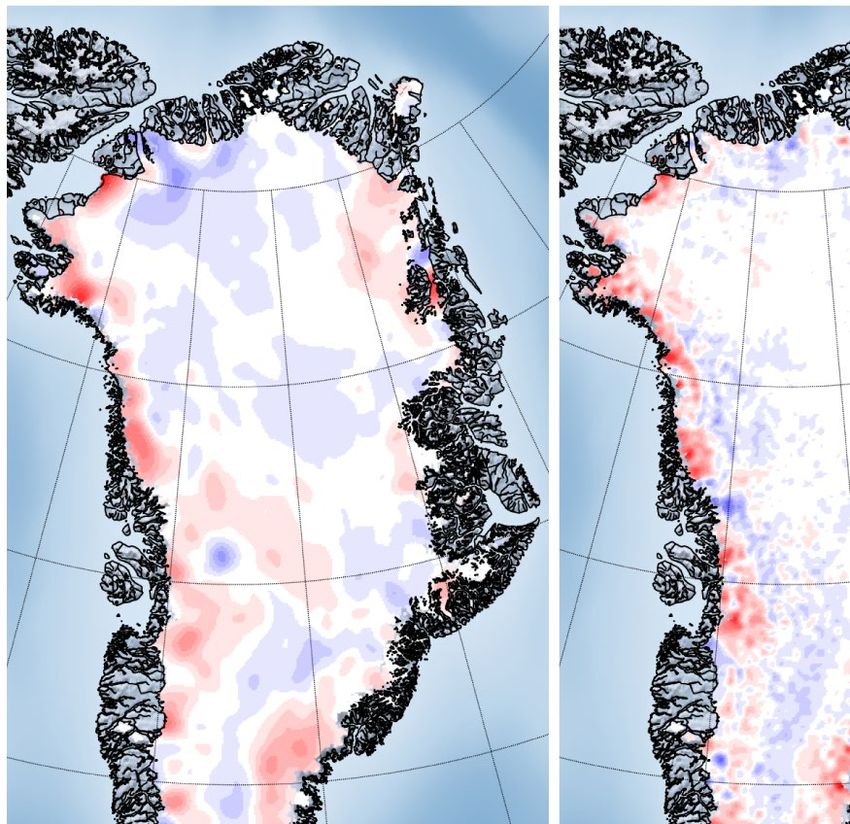
Marine Sciences, University of South Florida, Tampa, FL, USA. 18Global Modeling and           Vulcanologia, Rome, Italy. 34Nansen Environmental and Remote Sensing Centre, Bergen,
Assimilation Office, NASA Goddard Space Flight Center, Greenbelt, MD, USA. 19ESA-ESRIN,       Norway. 35Faculty of Engineering and Science, Western Norway University of Applied
Frascati, Italy. 20Mullard Space Science Laboratory, University College London, Holmbury St   Sciences, Sogndal, Norway. 36Direction of Antarctic and Sub-Antarctic Programs,
Mary, UK. 21School of Geosciences, University of Edinburgh, Edinburgh, UK. 22Institute for    Universidad de Magallanes, Punta Arenas, Chile. 37Geophysical Institute, University of
Planetary Geodesy, Technische Universität Dresden, Dresden, Germany. 23Daniel                 Bergen, Bergen, Norway. 38School of Engineering, Newcastle University, Newcastle upon
Guggenheim School of Aerospace Engineering, Georgia Institute of Technology, Atlanta,         Tyne, UK. 39isardSAT, Barcelona, Catalonia. 40ENVEO, Innsbruck, Austria. 41Department of
GA, USA. 24School of Geography, University of Lincoln, Lincoln, UK. 25Department of           Physics, University of Toronto, Toronto, Ontario, Canada. 42Center for Space Research,
Geosciences, University of Arizona, Tucson, AZ, USA. 26Alfred Wegener Institute, Helmholtz    University of Texas, Austin, TX, USA. 43Institute of Geodesy and Geoinformation, University of
Centre for Polar and Marine Research, Bremerhaven, Germany. 27Institute of Astronomical       Bonn, Bonn, Germany. 44Department of Space Engineering, Delft University of Technology,
and Physical Geodesy, Technical University Munich, Munich, Germany. 28GeoGenetics,            Delft, The Netherlands. 45Department of Earth Science Education, Seoul National University,
Globe Institute, University of Copenhagen, Copenhagen, Denmark. 29Deutscher                   Seoul, South Korea. 46Dipartimento di Scienze Pure e Applicate, Università di Urbino “Carlo
Wetterdienst, Offenbach, Germany. 30Danish Meteorological Institute, Copenhagen,              Bo”, Urbino, Italy. 47Department of Civil Engineering, Delft University of Technology, Delft,
Denmark. 31Department of Physics and Physical Oceanography, Memorial University of            The Netherlands. 48Geodetic Institute, University of Stuttgart, Stuttgart, Germany.
Newfoundland, St. John’s, Newfoundland and Labrador, Canada. 32Lancaster Environment          49
                                                                                                Department of Computer Science, University of Sheffield, Sheffield, UK. 50NASA
Centre, University of Lancaster, Lancaster, UK. 33Istituto Nazionale di Geofisica e           Headquarters, Washington, DC, USA. ✉e-mail: a.shepherd@leeds.ac.uk

                                                                                                                                                   Nature | www.nature.com | 7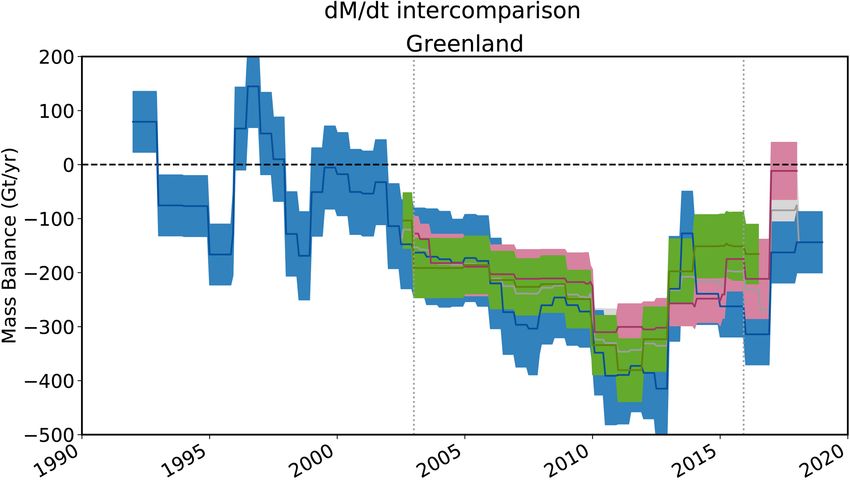
Article
Methods                                                                           especially from lateral variations of solid Earth properties42,51, and revi-
                                                                                  sions of the current state of knowledge can be expected34.
Data
In this assessment, we analyse five groups of data: estimates of ice              SMB
sheet mass-balance determined from three distinct classes of satellite            Here, ice-sheet SMB is defined as total precipitation minus sublima-
observations (altimetry, gravimetry and the input–output method                   tion, evaporation and meltwater runoff; that is, the interaction of
(IOM)) and model estimates of SMB) and glacial isostatic adjustment               the atmosphere and the superficial snow and firn layers, for example
(GIA). Each dataset is computed following previously reported methods             through mass exchanges via precipitation, sublimation and runoff,
(based on refs. 28,33,38,51–119 and detailed in Supplementary Table 1) and, for   and through mass redistribution by snowdrift, melting and refreezing.
consistency, they are aggregated within common spatial and temporal               We compare ten estimates of Greenland Ice Sheet SMB derived using a
domains. Altogether, 26 separate ice sheet mass balance datasets were             range of alternative approaches; four regional climate models (RCMs),
used—9 derived from satellite altimetry, 3 from the IOM and 14 from               two downscaled RCMs, a global reanalysis, two downscaled model
satellite gravimetry—with a combined period running from 1992 to                  reanalyses of climate data and one gridded model of snow processes
2018 (Extended Data Fig. 1). We also assess six model estimates of GIA            driven by climate model output (Extended Data Table 2).
(Extended Data Table 1) and ten model estimates of SMB (Extended                     Although SMB models of similar classes tend to produce similar
Data Table 2).                                                                    results, there are larger differences between classes—most notably
                                                                                  the global reanalysis and the process model—which lead to estimates
Drainage basins                                                                   of SMB that are substantially higher and lower than all other solutions,
We analyse mass trends using two ice sheet drainage basin sets                    respectively. The regional climate model solutions agree well at the
(Extended Data Fig. 2) for consistency with those used in the first               scale of individual drainage sectors, with the largest differences occur-
IMBIE assessment1 and to evaluate an updated definition tailored                  ring in northeast Greenland (Extended Data Fig. 4). The snow process
towards mass budget assessments. The first set comprises 19 drainage              model tends to underestimate SMB when compared with the other
basins delineated using surface elevation maps derived from ICESat-1              solutions that we have considered in various sectors of the ice sheet,
with a total area of 1,703,625 km2 (ref. 20). The second drainage basin           at times even yielding negative SMB, while the global reanalysis tends
set is an updated definition that considers other factors such as the             to overestimate it.
direction of ice flow and includes 6 basins with a combined area of                  Across all models, the average SMB of the Greenland Ice Sheet
1,723,300 km2 (ref. 37). The two drainage basin sets differ by 1% in area         between 1980 and 2012 is 351 Gt yr−1 and the standard deviation is
at the scale of the Greenland Ice Sheet, and this has a negligible impact         98 Gt yr−1. However, the spread among the 8 RCM and downscaled
on mass trends when compared to the estimated uncertainty of indi-                reanalyses is considerably smaller; these solutions lead to an average
vidual techniques.                                                                Greenland Ice Sheet SMB of 361 Gt yr−1 with a standard deviation of
                                                                                  40 Gt yr−1 over the same period. By comparison, the global reanalysis
Glacial isostatic adjustment                                                      and process model lead to ice-sheet-wide estimates of SMB that are
GIA (the delayed response of Earth’s interior to temporal changes in              considerably larger (504 Gt yr−1) and smaller (125 Gt yr−1) than this range,
ice loading) affects estimates of ice sheet mass balance determined               respectively. Model resolution is an important factor when estimating
from satellite gravimetry and, to a lesser extent, satellite altimetry93.         SMB and its components, as respective contributions where only the
Here, we compare six independent models of GIA in the vicinity of the             spatial resolution differed yield regional differences. The underlying
Greenland Ice Sheet (Extended Data Table 1). The GIA model solutions              model domains were also identified as a source of discrepancy in the
we considered differ for a variety of reasons, including differences in           case of the Greenland Ice Sheet, as some products would allocate the
their physics, in their computational approach, in their prescriptions            ablation area outside the given mask.
of solid Earth unloading during the last glacial cycle and their Earth rhe-
ology, and in the datasets against which they are evaluated. Although             Individual estimates of ice sheet mass balance
alternative ice histories (for example, ref. 94) and mantle viscosities (for      To standardize our comparison and aggregation of the 26 individual
example, ref. 95) are available, we restricted our comparison to those            satellite estimates of Greenland Ice Sheet mass balance, we applied a
that contributed to our assessment. No approach is generally accepted             common approach to derive rates of mass change from cumulative
as optimal, and so we evaluate the models by computing the mean                   mass trends41. Rates of mass change were computed over 36-month
and standard deviation of their predicted uplift rates (Extended Data             intervals centred on regularly spaced (monthly) epochs within each
Fig. 3). We also estimate the contribution of each model to gravimetric           cumulative mass trend time series, oversampling the individual time
mass trends using a common processing approach41 that puts special                series where necessary. At each epoch, rates of mass change were esti-
emphasis on the treatment of low spherical harmonic degrees in the                mated by fitting a linear trend to data within the surrounding 36-month
GIA-related trends in the gravitational field.                                    time window using a weighted least-squares approach, with each point
   The highest rates of GIA-related uplift occur in northern Greenland,           weighted by its measurement error. The associated mass trend uncer-
although this region also exhibits marked variability among the solu-             tainties were estimated as the root sum square of the regression error
tions, as does the area around Kangerlussuaq Glacier to the southeast.            and the measurement error. Time series were truncated by half the
Even though the model spread is high in northern Greenland, the signal            moving-average window period at the start and end of their period.
in this sector is also consistently high in most solutions. However, none         The emerging rates of mass change were then averaged over calendar
of the GIA models considered here fully captures all areas of high uplift         years to reduce the impact of seasonal cycles.
present in the models, and so it is possible there is a bias towards low
values in the average field across the ice sheet overall. The models              Gravimetry. We include 14 estimates of Greenland Ice Sheet ice sheet
yield an average adjustment for GRACE estimates of the Greenland Ice              mass balance determined from GRACE satellite gravimetry that to-
Sheet mass balance of −3 Gt yr−1, with a standard deviation of around             gether span the period 2003– 2016 (Extended Data Fig. 1). Ten of the
20 Gt yr−1. The spread is probably due, in part, to differences in the way        gravimetry solutions were computed using spherical harmonic solu-
each model accounts for GIA in North America (which is ongoing and                tions to the global gravity field and four were computed using spatially
impacts western Greenland), and so care must be taken when estimat-               defined mass concentration units (Supplementary Table 1). An unre-
ing mass balance at the basin scale. Local misrepresentation of the               stricted range of alternative GIA corrections were used in the formation
solid Earth response can also have a relatively large impact stemming             of the gravimetry mass balance solutions based on commonly adopted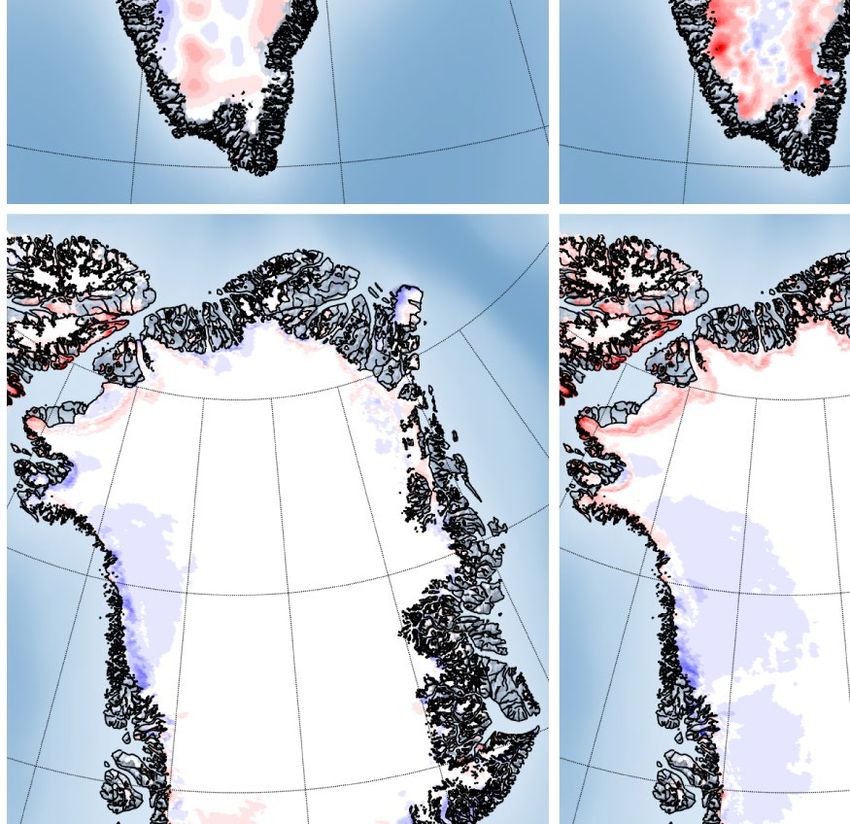
model solutions and their variants34,51–57 (Supplementary Table 1). All        noted that in earlier years the satellite ice discharge component of the
of the gravimetry mass balance solutions included in this study use the        data are relatively sparsely sampled in time (for example, ref. 104).There
same degree-1 coefficients to account for geocentre motion58 and, al-          is good overall agreement between rates of mass change determined
though an alternative set is now available96, the estimated improvement        from the input-output method solutions (Extended Data Fig. 5). During
in certainty is small in comparison with their magnitude and spread.           the period 2005–2015, annual rates of mass change determined from
There was some variation in the sampling of the individual gravim-             the four input–output datasets differ by up to 48 Gt yr−1 on average,
etry datasets, and their collective effective (weighted mean) temporal         and their average standard deviation is 23 Gt yr−1 (Extended Data Ta-
resolution is 0.08 yr. Overall, there is good agreement between rates          ble 3). These differences are comparable to the estimated uncertainty
of Greenland Ice Sheet mass change derived from satellite gravimetry           of the individual techniques and are also small relative to the estimated
(Extended Data Fig. 5); all solutions show the ice sheet to be in a state of   mass balance over the period in question. In addition to showing that
negative mass balance throughout their survey periods, with mass loss          the Greenland Ice Sheet was in a state of negative mass balance since
peaking in 2011 and reducing thereafter. During the period 2005–2015,          2000, with mass loss peaking in 2012 and reducing thereafter, the IOM
annual rates of mass change determined from satellite gravimetry               data show that the ice sheet was close to a state of balance before this
differ by 104 Gt yr−1 on average, and their average standard deviation         period33.
is 31 Gt yr−1 (Extended Data Table 3).
                                                                               Aggregate estimate of ice sheet mass balance
Altimetry. We include nine estimates of Greenland Ice Sheet mass bal-          To produce an aggregate estimate of Greenland Ice Sheet mass bal-
ance determined from satellite altimetry that together span the period         ance, we combine the 14 gravimetry, 9 altimetry and 3 IOM datasets to
2004–2018 (Extended Data Fig. 1). Three of the solutions are derived           produce a single 26-yr record spanning the period 1992–2018. First, we
from radar altimetry, four from laser altimetry and two use a combina-         combine the gravimetry, altimetry and the IOM data separately into
tion of both (Supplementary Table 1). The altimetry mass trends are also       three monthly time series by forming an error-weighted average of
computed using a range of approaches, including crossovers, planar             individual monthly rates of ice sheet mass change computed using the
fits and repeat track analyses. The laser altimetry mass trends are com-       same technique (Extended Data Fig. 6). At each epoch, we estimate the
puted from ICESat-1 data as constant rates of mass change over their           uncertainty of these time-series as the root mean square of their compo-
respective survey periods, whereas the radar altimetry mass trends             nent time-series errors. We then combine the mass balance time series
are computed from EnviSat and/or CryoSat-2 data with a temporal                derived from gravimetry, altimetry and the IOM to produce a single
resolution of between 1 and 72 months. In consequence, the altimetry           aggregate (reconciled) estimate, computed as the error-weighted mean
solutions have an effective collective temporal resolution of 0.74 yr.         of mass trends sampled at each epoch. We estimated the uncertainty
Mass changes are computed after making corrections for alternative             of this reconciled rate of mass balance as either the root mean square
sources of surface elevation change, including glacial isostatic and           departure of the constituent mass trends from their weighted-mean or
elastic adjustment, and firn height changes (see Supplementary Ta-             the root mean square of their uncertainties, whichever is larger. Cumu-
ble 1). Despite the range of input data and technical approaches, there        lative uncertainties are computed as the root sum square of annual
is good overall agreement between rates of mass change determined              errors, on the assumption that annual errors are not correlated over
from the various satellite altimetry solutions (Extended Data Fig. 5).         time. This assumption has been employed in numerous mass balance
All altimetry solutions show the Greenland Ice Sheet to be in a state of       studies1,17,33,41, and its effect is to reduce cumulative errors by a factor
negative mass balance throughout their survey periods, with mass loss          of 2.2 over the 5-yr periods we employ in this study (Table 1). If some
peaking in 2012 and reducing thereafter. During the period 2005–2015,          sources of error are temporally correlated, the cumulative uncertainty
annual rates of mass change determined from satellite altimetry dif-           may therefore be underestimated. In a recent study, for example, it is
fer by 121 Gt yr−1 on average, and their average standard deviation is         estimated that 30% of the annual mass balance error is systematic105,
42 Gt yr−1 (Extended Data Table 3). The greatest variance lies among           and in this instance the cumulative error may be 37% larger. On the other
the 4 laser altimetry mass balance solutions, which range from −248            hand, the estimated annual error on aggregate mass trends reported in
to −128 Gt yr−1 between 2004 and 2010; aside from methodological               this study (61 Gt yr−1) are 70% larger than the spread of the independent
differences; possible explanations for this high spread include the            estimates from which they are combined (36 Gt yr−1) (Extended Data
relatively short period over which the mass trends are determined,             Table 3), which suggests the underlying errors may be overestimated
the poor temporal resolution of these datasets and the rapid change            by a similar degree. A more detailed analysis of the measurement and
in mass balance occurring during the period in question.                       systematic errors is required to improve the cumulative error budget.
                                                                                  During the period 2004–2015, when all three satellite techniques
IOM. We include three estimates of Greenland Ice Sheet mass balance            were in operation, there is good agreement between changes in ice
determined from the IOM that together span the period 1992–2015                sheet mass balance on a variety of timescales (Extended Data Fig. 6).
(Extended Data Fig. 1). Although there are relatively few datasets in          In Greenland, there are large annual cycles in mass superimposed on
comparison with the gravimetry and altimetry solutions, the input–             equally prominent interannual fluctuations as well as variations of inter-
output data provide information on the partitioning of the mass change         mediate (~5 yr) duration. These signals are consistent with fluctuations
(surface processes and/or ice dynamics) cover a considerably longer            in SMB that have been identified in meteorological records1,59, and are
period and are therefore an important record of changes in Greenland           present within the time series of mass balance emerging from all three
Ice Sheet mass during the 1990s. The IOM makes use of a wide range of          satellite techniques, to varying degrees, according to their effective
satellite imagery (for example, refs. 6,40,97–102) combined with measure-      temporal resolution. For example, correlated seasonal cycles are appar-
ments of ice thickness (for example, ref. 103) for computing ice sheet         ent in the gravimetry and IOM mass balance time series, because their
discharge (output), and several alternative SMB model estimates of             effective temporal resolutions are sufficiently short (0.08 and 0.14 yr,
snow accumulation (input) and runoff (output) (see Supplementary               respectively) to resolve such changes. However, at 0.74 yr, the effective
Table 1). Two of the IOM datasets exhibit temporal variability across          temporal resolution of the altimetry mass balance time series is too
their survey periods, and ywo provide only constant rates of mass              coarse to detect cycles on sub-annual timescales. Nevertheless, when
changes. Although these latter records are relatively short, they are          the aggregated mass balance data emerging from all three experiment
an important marker with which variances among independent es-                 groups are degraded to a common temporal resolution of 36 months,
timates can be evaluated. The collective effective (weighted mean)             the time series are well correlated (0.63 < r2 < 0.80) and, over longer
temporal resolution of the IOM data are 0.14 yr, although it should be         periods, all techniques identify the marked increases in Greenland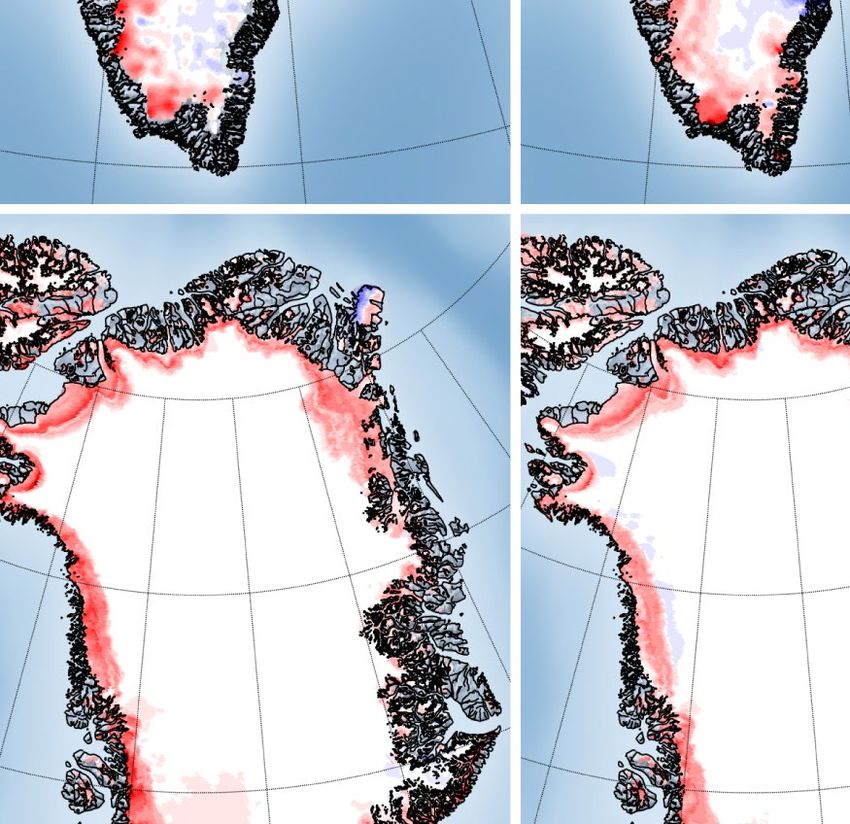
You can also read