MEASURING THE IMPACT OF AGRICULTURAL SUPPLY CHAINS ON BIODIVERSITY - A corporate needs assessment
←
→
Page content transcription
If your browser does not render page correctly, please read the page content below
MEASURING THE IMPACT
OF AGRICULTURAL SUPPLY
CHAINS ON BIODIVERSITY
A corporate needs assessment
Contents
Executive Summary...................................................................................................................... 3
Introduction.................................................................................................................................. 4
Identifying the needs.................................................................................................................... 4
     Why do companies measure biodiversity?.............................................................................................4
     How is biodiversity being measured?.....................................................................................................6
     Existing approaches for measuring biodiversity impacts........................................................................6
     What are the challenges to measuring biodiversity?...............................................................................7
          Lack of capacity and understanding to implement existing measurement approaches....................7
          Lack of approaches to measure impacts directly with heavy reliance on proxies.............................7
          Lack of evidence of application......................................................................................................8
          Lack of access to data by business................................................................................................8
     Few measurement approaches to track targets.....................................................................................8
     Difficulty interpreting and aggregating the results of measurement approaches.....................................8
Proposed solutions ...................................................................................................................... 9
     Overview...............................................................................................................................................9
     Alignment.............................................................................................................................................9
     Developing guidance.............................................................................................................................10
          Target audience.............................................................................................................................10
     Content................................................................................................................................................10
     Links to other tools/guidance/approaches............................................................................................11
     Process & Format.................................................................................................................................11
     Ensuring credibility and fostering adoption by business.........................................................................12
Next steps.................................................................................................................................... 13
Annex 1........................................................................................................................................ 14
Annex 2........................................................................................................................................ 18
Annex 3........................................................................................................................................ 23

About this working paper
This joint effort was brought together through the Aligning Biodiversity Measures for Business collaboration.

The EU Business @ Biodiversity Platform                                              The TRADE Hub

The EU Business @ Biodiversity Platform provides a                                   The UKRI GCRF Trade, Development and the Environment
unique forum for dialogue and policy interface to discuss                            (TRADE) Hub, led by the United Nations Environment
the links between business, finance and biodiversity                                 Programme World Conservation Monitoring Centre
at EU level. It was set up by the European Commission                                (UNEP-WCMC) operates as a research consortium with
with the aim to work with and help businesses integrate                              over 50 organisations from 15 different countries, to
natural capital and biodiversity considerations into                                 help make trade sustainable for people and the planet. A
business practices. It has been recognised for its role                              major research component is the investigation of trends
as independent, neutral and objective sounding board                                 and impacts of trade in agricultural commodities. The
for assessing and centralising available biodiversity                                TRADE Hub is actively engaging the private sector to
measurement approaches. Through the European                                         ensure that key supply chain actors have a direct role in
Business & Nature Summit (EBNS), it also aims to act as                              shaping research outputs and solutions.
a catalyst for action on biodiversity by corporates.

 Authors: Sharon Brooks, Julie Dimitrijevic, Kim Dunn, Kiran Sehra, Yann Verstraeten
 Reviewers: Annelisa Grigg, Matt Jones, Johan Lammerant

                                                                                2
Executive Summary

B
           usinesses with agricultural supply chains          The study highlighted six main challenges faced by
           depend on and impact biodiversity, both            companies attempting to measure their relationship with
           directly through their activities and indirectly   biodiversity:
           through their supply chains and there is
                                                                  ■    Lack of capacity and understanding to
           growing momentum to better assess and
                                                                       implement existing measurement approaches
manage these relationships with nature. However, the
business community is facing challenges in measuring
                                                                  ■    Lack of approaches to measure impacts
their biodiversity performance and keeping track of the
                                                                       directly and heavy reliance on proxies
rapidly evolving landscape of biodiversity measurement
approaches for business, which increases confusion
                                                                  ■    Lack of evidence of application
amongst many corporates around their specific
applications.
                                                                  ■    Lack of access to biodiversity data by business
The TRADE Hub, and the EU B@B Platform of the European
Commission have come together to support industry,
                                                                  ■    Few measurement approaches to track targets
scientists and practitioners to assess the challenges
and potential solutions for measuring and disclosing
                                                                  ■    Difficulty interpreting and aggregating results
biodiversity impacts and dependencies of companies
with agricultural supply chains. This working paper           This review and consultation identified an initial set
compiles the findings of a corporate needs assessment         of solutions that could make progress in applying
that consisted of a survey and interviews with companies      biodiversity measurement along agricultural supply
and a multi-stakeholder workshop.                             chains: (1) alignment across existing approaches and (2)
The overall perception of companies is that measuring         guidance on how to navigate through those approaches
biodiversity impacts is complex and raises many               were identified as the most pressing solutions followed
questions including: how to measure, where to start,          by (3) training on how to use the different methods
when to combine different approaches and metrics, how         and (4) improved data availability. This working paper
to aggregate results, and how results can inform action.      further discusses how alignment in terms of input data,
                                                              presentation of outputs and how they could inform action
                                                              could help the uptake of biodiversity indicators, metrics
                                                              and tools by companies with agricultural supply chains.
                                                              Finally, by providing the outputs of consultations, this
                                                              working paper lays the foundation for the development
                                                              of guidance that could offer a relatively ‘quick win’ to
                                                              improve corporate measurement of biodiversity.

                                                              3
Introduction
This working paper highlights the business needs for improving the measurement of impacts and dependencies on
biodiversity by companies with agricultural supply chains, the challenges faced in this endeavour and the potential
solutions. It will form the foundation for developing common guidance on biodiversity measures for agricultural supply
chains, anticipated to commence in 2021 on behalf of the European Commission under the Aligning Accounting
Approaches for Nature (Align project1) and called upon by the EU Biodiversity Strategy for 20302. The findings laid
out in this working paper will also support the research and engagement efforts being carried out by The TRADE
Hub, specifically those related to biodiversity metrics, tools and data that can be used by all stakeholders to support
sustainable trade of agricultural commodities

This working paper is based on a limited and rapid review of business and expert opinions, provided through a series of
consultations during November and December 2020. These included:

      ■    A survey collecting 16 responses from a range of companies across the value chain of a range of consumer
           goods (incl. food, textile, fragrance) (from farmers/producers and processors, to retailers and investors) to
           identify current use of measurement approaches, challenges and solutions to their broader uptake;

      ■    Five semi-structured interviews with business representatives to articulate challenges and solutions in more
           detail;

      ■    A multi-stakeholder online workshop which attracted over 90 individuals to gain a diversity of perspectives on
           the issue and confirm the solutions identified above3.

Figure 1 Survey respondents (n = 16)

A desktop study was used to provide more background on some of the existing biodiversity tools, metrics and data that
are applicable to agricultural supply chains.

Identifying the needs

   Why do companies measure biodiversity?
Before considering the methods and tools that can be used by a company to measure biodiversity, it is important to
consider the purpose of doing so to inform the way in which biodiversity can be incorporated into corporate decision
making. Based on our survey of companies4, most were focused on assessing impacts and dependencies on biodiversity
at farm and landscape level (rather than at company, individual commodity, supplier or country level). The companies
surveyed showed alignment in the purposes of measurement (as shown in Figure 1) which were to:
      ■    Assess a company’s current biodiversity performance

      ■    Assess a company’s future biodiversity performance

      ■    Track progress towards biodiversity targets

1 See ”Next steps” section for more detail.
2 COM/2020/380 final. Notably in Section 3.3.3.
3 The main findings of the workshop are presented throughout this working paper. The full details of the online workshop interactive discussion can
be found online through this link.
4 The full details of the survey results can be found in the Annex.

                                                                        4
Company interviews identified that corporate engagement on biodiversity often stems from a moral obligation5 (“duty
to act”, “we want to play our part”, “science says we need to act”) towards society and a need to safeguard the long-
term viability of a business in the face of a perceived increase of risks (e.g. of productivity declines stemming from
biodiversity loss) and societal (e.g. consumer, media) expectations. While biodiversity starts to be recognised as a
priority for companies, measuring of impacts often constitutes a first step to understand a firm’s relationship to nature,
and weighs corporates’ impact on the decision-making process (“biodiversity [assessment] is required from a higher
level”). Measuring impacts helps business leaders to better understand their firm’s current and future performance on
biodiversity, providing necessary data for setting biodiversity targets and ambitions.

Figure 2 Business application / purpose of biodiversity measurement

Interviews suggest that measuring impacts often constitutes a good entry point to start acting on the pressures and
drivers of biodiversity loss from a company’s perspective. At the agricultural supply chain level, this often implies
working with suppliers to understand how they impact nature and can contribute to making a positive change. Based
on the survey results (see Figure 3), most firms seem to approach biodiversity at the supply chain level from an impact
perspective (both negative and positive impacts), with many also interested to understand their level of dependence on
biodiversity (e.g. the benefits that an ecological diverse habitat or soil has on specific crops).

Figure 3 Interest for measuring biodiversity from a company or supplier perspective

5 A forthcoming report from the EU B@B Platform analysing the relationship between SMEs and nature also came to a similar conclusion that
social benefits and moral incentives are clear drivers for SMEs to engage on nature and biodiversity. Risk mitigation is seen as one of the important
benefits once SMEs have started their natural capital journey.

                                                                          5
How is biodiversity being measured?
Companies that responded to the survey were at different stages in their measurement of biodiversity. Some have
started to collect data and measure progress, whereas some have started to identify concrete options for biodiversity
measurement and allocate resources to complete an assessment.

The majority of those who started a biodiversity assessment have done so in cooperation with an NGO or academic
institution. This has resulted in the creation of several bespoke measurement approaches or frameworks. However,
overall, the survey showed that individual companies are relying on a variety of tools and approaches to assess
their relationship with biodiversity (see Figure 4). These include desktop studies to assess land-use changes (e.g.
deforestation) through satellite imagery or assessing potential risks associated with biodiversity through the Integrated
Biodiversity Assessment Tool (IBAT) or the IUCN Red List, most specifically. Desktop studies can provide a high-level
picture of a company’s relationship with biodiversity and are often complemented with field surveys to assess species
presence, abundance and richness at the site level. There were fewer responses related to tools that are more specific
to the business or agricultural sector.

Interviews indicated that understanding the firm’s impacts and dependencies on biodiversity often happens through
a trial-and-error process whereby various tools are explored. Sometimes a company will use more than one approach,
selecting the approach according to the measurement aim. For example: informing consumers on biodiversity risks
linked to single products and areas of sourcing, screening high-level risks to inform additional assessment efforts,
addressing location-specific challenges such as deforestation, or guiding the selection of sourcing commodities.

Figure 4 Tools and approaches to measure biodiversity6

           Existing approaches for measuring biodiversity impacts
There are a wide array of approaches that can support companies in measuring their impacts on biodiversity (24 of
these are included within the Annex – Table 1 and Table 2). These approaches can be broadly classed as metrics, data,
tools and frameworks, according to the definitions in Box 1. However it must be recognised that these categories are
not mutually exclusive and some approaches can appear in more than one category. Under the Aligning Biodiversity
Measures for Business collaboration, a number of approaches specifically developed to measure biodiversity change
were evaluated. Of the 12 assessed, the majority are applicable to companies with agricultural supply chains. A summary
of these is provided in Annex 1, Table 1. In addition to these, there are a wide array of tools and metrics that were
compiled under the Trade Hub project as a desktop study, that have been further reviewed in this context of this project
and are provided in Annex 1, Table 2.

6 A third update of this report was published on 1st March 2021 on the Platform’s website. All reports, including Update Report 3 can be found
through this link.

                                                                         6
Box 1. Definitions of the terminology used within the desktop study.

Measurement approach– In this working paper, we define “measurement approach” to encompass developed metrics,
data/models, tools and frameworks, which can be used to assess biodiversity impact and dependencies.

Metric– a mathematical representation of reality (e.g. Mean Species Abundance)

Data/Model– measured or modelled information (e.g. GLOBIO)

Tools – packages of data and one or more metrics (LC-IMPACT)

Frameworks – criteria and guidance for decision-making (e.g. LandScale)
Source: The Biodiversity Consultancy during Webinar 3: Case studies on supply chain level biodiversity measurement approaches for business,
EU Business @ Biodiversity Platform

As highlighted above, a common business purpose was to measure current and future biodiversity performance.
The existing approaches can support this in the following ways:
     ■    Providing an estimate of change in biodiversity associated with pressures, often at the population or
          ecological community level (e.g. Mean Species Abundance (MSA) or Potentially Disappeared Fraction of
          Species (PDF)).

     ■    Measuring levels of habitat loss and other pressures as a proxy for biodiversity loss (e.g. deforestation or
          rate of expansion into natural areas).

The biodiversity pressure data typically includes:
     ■    land-use changes, such as habitat loss and ecosystem loss and

     ■    climate change or greenhouse gas emissions, and to a lesser extent

     ■    pollution and

     ■    invasive species.
Despite a few approaches supporting current and future performance, only some approaches have been developed to
track progress to biodiversity targets specifically and some tools only cover targets in a qualitative way (e.g. LIFE and
the Agrobiodiversity Index) (EU Business @ Biodiversity Platform and UNEP-WCMC, 2019). Some approaches could be
used for initial risk screening (GMAP, Living Planet Index, Biodiversity Impact Metric) as these indicators can provide
a coarse overview on biodiversity impact due to low data resolution functionality. Other approaches provide flexibility
catering to multiple business applications (e.g. GLOBIO, LandScale, LIFE Key, Agrobiodiversity Index) (EU Business @
Biodiversity Platform and UNEP-WCMC, 2019). Some approaches have a commodity focus (e.g. GMAP, IOTA-SEI, The
Soy Toolkit), and others are product specific (e.g. The EU Product Environmental Footprints).

   What are the challenges to measuring biodiversity?
A range of challenges, six of which are presented below in further detail, preventing the measurement of biodiversity
were identified.

          Lack of capacity and understanding to implement existing measurement approaches
There are many different approaches for measuring biodiversity, and many have complex methodologies that require a
high level of capacity to implement.

Interviewees indicated the difficulty to “find their way in the number of tools available”, and “struggling to find the right
place/tool to start assessing their biodiversity footprint”. Assessing a company’s impact and dependence on biodiversity
requires in-house knowledge about the specificities of measurement approaches, which is often lacking. Faced with
insufficient technical expertise, companies often rely on external staff, so they do not build in-house capacity which
then remains inadequate. Some tools such as ENCORE, GMAP, Living Planet Index, do not require specialists, while
others require specialist skills use as Geographical User Interface (GIS) mapping/interpretation, statistical analysis
interpretation (SCP- Hotspots Analysis Tool, GLOBIO, InVEST) or specialist biologists (LC-IMPACT)

          Lack of approaches to measure impacts directly with heavy reliance on proxies
Some interviewees indicated that the right tools to measure impacts and dependencies of agricultural supply chains on

                                                                    7
biodiversity do not exist (“none of the methods fit everything”). The reliance on proxies to infer a firm’s relationship with
biodiversity was observed among companies interviewed and supported by the desktop study. Many approaches use
well-known drivers of biodiversity loss such as land-use change, deforestation, rate of expansion into natural areas, etc.
(See Annex 1, Table 2) to infer impacts on biodiversity. While these are credible proxies and supported through existing
scientific literature, there can be challenges in attributing these changes to the activities of an individual company and
their suppliers, as well as the ability for such proxies to reflect the ultimate impact of any interventions in the supply
chain that might be implemented. Assessing management interventions such as protecting High Conservation Value
areas is also used by some companies as a proxy to assess performance, but these do not measure conservation
outcomes. There are approaches which rely on species-centric data to measure biodiversity loss directly but their use
by companies is less common.

         Lack of evidence of application
Interviews suggested that companies need to have certainty that tools and methodologies used to assess a company’s
impact on biodiversity are robust and the results are meaningful. Companies are often not well placed to assess the
scientific credentials of an approach, and a lot of progress on this topic remains academic rather than practical in
nature. The multitude and complexity of approaches leads to the ‘black box effect’ whereby underlying methods are
not known or understood by business users. This undermines trust in the accuracy of these tools and their utility for
informing decisions.

         Lack of access to data by business
Some approaches have extensive minimum data requirements for businesses to use (e.g. LC-IMPACT, Agrobiodiversity
Index), whereas others are more straightforward (Biodiversity Impact Metric). While some provide data and clear
guidance (LandScale, EU PEP, JNCC), this can still require a lengthy process to implement. The finding from consultation
suggests that the science underpinning these approaches is not accessible to businesses using them. According to
survey results, data availability / data requirements are perceived as the second most important barrier preventing the
measurement of biodiversity.

         Few measurement approaches to track targets
Few measurement approaches can be used to track progress towards corporate or global goals, as highlighted by
the survey (see Figure 5). As a growing number of companies are starting to set their own biodiversity ambition or
commitment towards biodiversity, the use of approaches to assess corporates’ progress towards their own goals is
likely to gain traction going forward.

Figure 5 Suitability of measurement approaches to track progress towards targets

         Difficulty interpreting and aggregating the results of measurement approaches

     ■   Difficulty in interpreting results:
Results may not be actionable: Company representatives interviewed mentioned that metrics need to lead to conclusions
that firms can operationalise (which can be translated into concrete actions). Several approaches being explored by
business have not been developed with businesses in mind. Many are designed for policy at the national/landscape
level, rather than for use by companies to measure biodiversity impacts, hence they need interpretation and adaptation.
Different approaches have different focusses and calculate biodiversity loss differently using different metrics. For
example, the Global Biodiversity Score uses Mean Species Abundance (MSA) while LC-IMPACT and SCP Hotspots
Analysis use Potentially Disappeared Fraction (PDF). Interpretation of results from seemingly different biodiversity
measurement approaches may in fact be related due to the same underpinning data or methodologies used, which can

                                                             8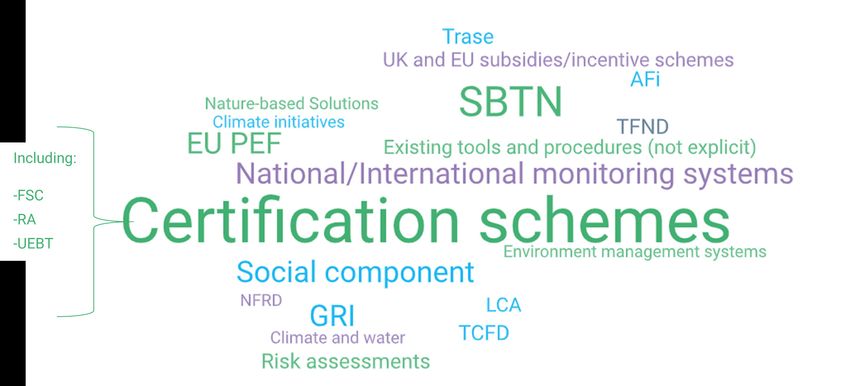
be hidden form the user due to a lack of transparency. The majority of approaches include the main drivers of land-use
change to inform biodiversity impact.
     ■   Difficulty in aggregating results:
Interview results suggest that companies often rely on a variety of tools and indicators to assess biodiversity. However,
data aggregation is often difficult, and the different approaches may not be able to be used in conjunction with each
other (as the results are not comparable).

Proposed solutions

   Overview
This review and consultation identified an initial set of solutions that could make progress in applying biodiversity
measurement along agricultural supply chains. These were used as a starting point for exploring the type of solutions
companies require in the online workshop (held December, 2020).

Figure 6 below shows the solutions presented to the workshop participants. Alignment across existing approaches
and guidance on how to navigate through those approaches were identified as the most pressing solutions followed by
training on how to use the different methods and improved data availability.

Figure 6 Responses from the workshop participants on what businesses require to help address the barriers
and challenges outlined above.

Helping businesses measure biodiversity will require a combination of many solutions. Developing guidance and
increasing alignment across the existing methods are two important solutions and are discussed in further detail in the
following sections. Training, improved data availability and further method development are also going to be required.
Training will be needed to provide a concrete starting point for businesses to implement approaches to measure
biodiversity, informing and training them on how to use available tools. Improved data availability is a clear need and while
advances in this area are being made, proxy data can be used to fill the gaps. More information on the appropriate use
of proxy data and its limitations is however needed. Finally, further method development to improve existing approaches
and ensure they meet the needs of businesses and investors is important and a continually evolving space.

   Alignment
Through this working paper, it is clear that alignment on the use of input data and metrics, the outputs provided and
the possible applications of these outputs is needed between different measurement approaches. This would increase
comparability and allow companies to fully understand the impacts and dependencies of their businesses on biodiversity
along their supply chains.

A further complication arises when businesses, particularly businesses with complex supply chains, are required to
aggregate data from a farm or local level, to a total corporate value, and the interviewees agreed that there was a
critical need for trust in the aggregation of data. Alignment of different approaches would allow the outputs of tools to

                                                             9
be more meaningfully aggregated. This would enable businesses to analyse their full supply chain using the different
approaches appropriate for their specific business application

While there are many global biodiversity datasets available, across all geographic and commodity areas, they are often
only available at a global, national or regional scale. The datasets are often not deemed suitable for corporate use due
to their granularity not allowing for aggregation or site specific assessments, and the inaccessibility of the methods
or background data. ‘Therefore, there is a need for a databse of common datasets across the available measurement
approaches as this would allow businesses to work from the same dataset and aggregate their outputs from a number
of approaches (as the information sources can be similar). By aligning approaches, comparisons would then be possible
across businesses including suppliers, farmers or retailers.

Aligning and linking existing biodiversity initiatives and approaches should ultimately facilitate the uptake of biodiversity
indicators, and subsequent measurement and reporting. This in turn should support improved management of
biodiversity impacts and dependencies and allow businesses to demonstrate their contributions to global efforts to
reverse the current biodiversity crisis

   Developing guidance
During the workshop, the participants were asked to respond to a variety of questions regarding the guidance to navigate
existing approaches could offer a relatively ‘quick win’ to improve corporate measurement of biodiversity. The guidance
should be concise and simple to use. This would be through the inclusion of key steps that generate actionable results.
The steps should be clearly outlined to ensure that the guidance drives positive action and should include information
on the effective implementation of biodiversity specific tools and the positive actions that result. By understanding
how and why guidance implementation can drive positive impact will promote action for biodiversity positive decision-
making.

         Target audience
There was a general agreement that the guidance should be targeted at supply chain managers and sustainability
managers, as this would be the most useful audience within the businesses. The guidance should however be accessible
to all organisations within the supply chain, allowing businesses to recognise themselves by organisational focus, sub-
sector and business application. This would allow the guidance to be used applicable to a wide range of business users
due to the variety of business applications for biodiversity measurement.

Figure 7 Target audience for the guidance

   Content
The guidance should be outcome focused and provide actionable advice to businesses with agricultural supply chains
and their existing targets and goals. It should include practical support on how to select the most suitable biodiversity
measurement approach or combination of approaches and related metrics and data sources. Specifically it should
contain:

     ■   Clear business case per sector on how measuring biodiversity can benefit the business to foster internal
         support and investment.

     ■   Explanatory notes for existing methods, supported by examples and case studies which relate to all types of
         companies and sectors within the value chain (farmers, producers, retailers and distributers).

     ■   Clear structured summary of the benefits/limitations of available method/tools, as well as details of how to
         access key datasets. This should include guidance on the cost and use of the available data.

     ■   Practical support to inform the selection and application of the appropriate measurement approach.

                                                            10
■ Description on how tools and methodologies can be integrated with other corporate reporting requirements
that are already implemented.
Links to other tools/guidance/approaches
For the guidance to be easy to integrate and add value to the processes businesses are already involved with,
it was important to establish where links to other tools, already available guidance or approaches exist, and which
the agricultural supply chain guidance should link to. The most common suggestion was for the guidance to link to
certification schemes, Science-based Targets for Nature initiative and align to national and international monitoring
systems (Figure 8). Less common suggestions included linking to subsidy and incentive schemes by the government,
and climate initiatives, as well as the Global Reporting Initiative.
A range of reports on biodiversity measurement approaches have been or are in the process of being developed that
will be important to link to. These include the Biodiversity Guidance to accompany the Natural Capital Protocol (already
developed), with an accompanying interactive Navigation Tool (currently under development by the Capitals Coalition).
There will also be a complementary Navigation Wheel made available by the EU Business @ Biodiversity Platform
(available from March 2021, see Figure 8 below). These resources will provide support to businesses on how to better
incorporate biodiversity measurement approaches within their activities and decision making.
Figure 8 Wordle highlighting responses of participants towards “What would make the guidance credible
and adopted by business?
The larger the text size the increased number of responses. Note the following acronyms used are: SBTN (Science-based
Targets for Nature), EU PEF (European Union Production Environmental Footprint), GRI (Global Reporting Initiative), AFi
(Accountability Framework Initiative, TCFD (Task Force on Climate-related Financial Disclosure), TFND (Task Force on
Nature-related Financial Disclosure), LCA (Life Cycle Assessment), NFRD (Non-financial reporting disclosure), UEBT
(The Union for Ethical BioTrade), FSC (Forest Stewardship Council), RA (Rainforest Alliance).
Process & Format
The workshop participants highlighted that new guidance should steer away from the standard ‘PDF report format’, and
aim towards a more interactive and engaging process, with ‘Online Training’ and ‘Online Interactive Guidance’ having
the most responses. It was also highlighted that the development of guidance should be an iterative process with the
business users engaged at every stage of its development.
Update to EU B@B report
The EU B@B Platform launched the Update Report 3 on biodiversity measurement approaches for businesses and
financial institutions on 2nd March 2021. The report highlighs the development of the Navigation Wheel, a decision
framework for selecting the most suitable (set of) biodiversity measurement approaches based on the specific needs of
the company. The Navigation Wheel relies on more than 10 selection criteria and therefore is much more sophisticated
compared to the initial decision framework presented in the Update Report 2, which was only built on two selection
criteria i.e. business applications and organisational focus areas. It is important to note that the Navigation Wheel
is complementary to the Biodiversity Guidance Navigation Tool which is more aligned with the sequential steps of
11the Natural Capital Protocol. The Update Report 3 focuses now entirely on real-life applications of measurement
approaches and includes 16 high quality case studies, some of them discussing biodiversity measurement approaches
in the agricultural supply chain. The report and case studies will be available on the Platform’s website. In 2021 case
studies will also be collected, reviewed and presented during dedicated webinars.
Figure 9 Graph showing participant responses on what format the guidance should take
Online training and interactive guidance are increasingly recognised as mechanism for increasing uptake due to the
ease and speed at which it can be used.
Ensuring credibility and fostering adoption by business
During the workshop, the participants were asked what would help make the guidance credible to increase uptake by
business, see Figure 10 below:
Figure 10 Responses from participants on what the requirements are needed to ensure credibility and
increasing engagement with business.
12Next steps
T
he findings of this needs assessment will be ensure that the conversation around business needs and
taken forward within the ALIGN and TRADE the development of tools continues as an iterative and
Hub Projects. ALIGN is a new European project guided process.
is comprised of a Consortium of partners
(WCMC Europe, Capitals Coalition, ICF, Arcadis The TRADE Hub consists of an extensive network of
and UNEP-WCMC) and is funded by DG Env. The objective researchers working to evaluate the environmental and
of the ALIGN project is to establish and operate a social impacts of globally important agricultural supply
business-driven discussion and alignment process that chains. It will continue efforts to identify common
can streamline and strengthen methods and metrics for biodiversity metrics and further develop tools to support
measuring biodiversity related business impacts and impact assessments at different scales. Working across
dependencies and their management across a range of both public and private sectors and providing input to
sectors, including agricultural supply chains. global policy discussions, the TRADE hub will aim to fill
data and knowledge gaps and support uptake by private
The project aims to produce a standardised approach and public sector decision makers. TRADE hub is also
for biodiversity measurement, teaming this with sectoral looking to understand also how and why metrics might
guidance and modules linking the approach into other be used in a complementary way to cover different
efforts to standardise natural capital management biodiversity ‘aspects’ in supply chain assessments.
accounting practice such as the EU-led initiatives on Through its Corporate Advisory Forum, the TRADE Hub
Product Environmental Footprint and Organisational will engage with companies with agricultural supply
Environmental Footprint, the Non-Financial Reporting chains and will work closely with the ALIGN project to
Directive, the Task Force on Nature Related Financial support this sector in measuring biodiversity impacts.
Disclosures and/or the Transparent project led by the
Value Balancing Alliance.
As part of the Align project, a technical hub will be
established with biodiversity measurement tool
developers to focus on understanding current issues
inhibiting alignment between measurement approaches.
In addition, a business driven Community of Practice will
be formed, to call upon interested stakeholders for their
input and continued involvement in the development
of fit-for-purpose guidance documents with the aim to
improving corporate biodiversity tool alignment. This will
13Annex 1
Table 1. Overview of assessed biodiversity measurement approaches and disclosure frameworks identified under the Aligning Biodiversity Measures for
Business Initiative.
EU B@B Platform, 2019 and UNEP-WCMC, 2019, Discussion paper 1 for the Technical Workshop on Aligning Biodiversity Measures for Business: Identifying common ground
between corporate biodiversity measurement approaches.
Name of tool / Developer Description Status Private sector uptake (with
framework case studies marked in
bold)
Approaches with one or more quality reviewed case studies
Biodiversity ASN Bank (NL) The BFFI is designed to provide an overall biodiversity footprint of the economic Operational ■ ASN Bank (full footprint)
Footprint CREM (NL) activities a financial institution (FI) invests in. The methodology allows calculation ■ Volksbank
Financial of the environmental impact and the environmental footprint of investments with-
PRé ■ Some case studies were
Institutions in an investment portfolio.
Sustainability done with the PBAF
(BFFI)
(NL) partners
In 2020, a project started with
case studies for six other
financial institutions
Biodiversity UNEP-WCMC, It is a joint initiative between UNEP-WCMC, Conservation International and Fauna Site-level stages are Anglo American, BHP, Chevron,
Indicators for Conservation & Flora International, with support from IPIECA and the Proteus Partnership. The operational. ENI, Equinor, Newmont, Total.
Site-based International, methodology provides an approach for companies with significant site-based Corporate-level
Impacts (BISI) and Fauna impacts to understand their impacts on biodiversity and link this to their performance stage will be piloted
& Flora in mitigating them. The methodology is being piloted by extractives companies in 2021
International throughout 2019-2020.
(Int)
Biodiversity Cambridge The BIM can be used to assess and track how a business’s sourcing affects nature, Operational Applied with members of CISL’s
Impact Metric Institute for through the biodiversity lost as a result of agricultural production. The metric allows Natural Capital Impact Group
(BIM) Sustainable comparison of potential impacts across different sourcing locations and between including Asda & Kering
Leadership commodities. The metric is an ideal entry-level approach that allows a company to
(CISL) (UK) undertake a rapid risk-screening of its sourcing in order to identify where the greatest
impacts are likely to occur, thereby helping to prioritise further investigations and
interventions.
Global CDC Biodiversité It provides an overall and synthetic vision of the biodiversity footprint of economic Operational BNP Paribas Asset
Biodiversity (France) activities. It is measured by Mean Species Abundance (ratio between the observed Management, Mirova, EDF, GRT
Score® (GBS) biodiversity and the biodiversity in its pristine state), based on PBL Netherlands Gaz, L’Oréal, Michelin, Schneider
Environmental Assessment Agency’s model of five terrestrial pressures (land use, Electric, Solvay, Suez, Veolia & a
nitrogen deposition, climate change, fragmentation, infrastructure/ encroachment) luxury goods company.
and 5 aquatic pressures, and their impacts on biodiversity.The GBS® has been developed
with the Businesses for Positive
Biodiversity Club (B4B+), a
group of about 10 financial
institutions and 25 companies,
benefiting from extensive road-
testing: 9 case studies and 2
full scale Biodiversity Footprint
Assessments. 16 consultants
and companies are already
trained to use the tool.
GBS® for CDC Biodiversité GBS® combined to company-level data from non-financial rating agencies and Developing CDC Asset Management, BIA
financial (France) & data providers. Provides data on the biodiversity impacts of a large universe of (Carbon4 Finance)
institutions partners companies.
The GBS® for financial institutions is actually several distinct tools, one with each
data provider, including the:
- Biodiversity Impacts Analytics (BIA) developed with Carbon4 Finance
LIFE Key (LIFE) LIFE Institute The Methodology provides quantitative information on a company´s performance Operational in Brazil ABN AMRO Bank, Boticário,
(Brazil) (pressure and positive impacts on biodiversity) and provides strategic guidance and Paraguay, LIFE Catallini
to organizations to ensure the effectiveness of their conservation actions. Is was adapted for C-Pack (3 evaluated business
characterized by being a robust and measurable methodology, integrating business Europe in 2020 with units)
and biodiversity, being adaptable to any country or region and applicable to first pilots sched-
Gaia, Silva & Gaede, Itaipu
companies of any size or sector. uled for January -
Binacional (Brazil and
April 2021
Paraguay), JTI Tobacco
International (8 evaluated
business units), Lapinha,
Neoenergia Group (2 evaluated
business units), Posigraf,
Rocha, SANEPAR, Suzano,
UDU Adecoagro (2 evaluated
business units), Agricert,
Amaggi, JBS, Karanda, Payco
Raízen Group (2 evaluated
business units), Tamanduá (2
evaluated business units),
Product I CARE – Sayari PBF combines biodiversity studies and companies’ data to quantify the impacts of a Operational. L’Oréal, Kering, Avril, EDF (on
Biodiversity (France) product on biodiversity along its life cycle stages. PBF provides guidance for product Already tested in going), Primagaz (on-going),
Footprint (PBF) changes, especially in an ecodesign approach. PBF is also declined at site level, with agriculture, food, Citeo (on-going)
a life cycle approach, taking into account direct impact of on-site operations and cosmetics and ap-
indirect impacts (off-site) related to site inbound and outbound flows. parel, electricity and
energy sectors,Ongoing tests in all
other sectors to be
completed in Q1
2021.
Species Threat IUCN (Int) The STAR* measures the contribution that investments can make to reducing Pilot testing in 18 tests underway or
Abatement and species extinction risk. It can help the finance industry and investors target their Indonesia, New completed: 5 for agricultural
Restoration investments to achieve conservation outcomes, and can measure the contributions Zealand and with products companies, 4 finance
metric (STAR) these investments make to global targets such as the Sustainable Development other private sector industry, 2 conservation
Goals. operators finalized, planning, 2 forest management,
Guidance notes for 1 extractive industry, 1 private
private sector users sector advisory services,
under development.
Portal for access
to STAR data layers
in early access
programme via the
Integrated Biodiver-
sity Assessment
Tool (IBAT) under
development
Biodiversity Plansup The pressure based methodology is used to quantify the biodiversity impact of Calculator tool is
Footprint a product, sector or company for the three major pressure types: Land use, GHG operational.
Methodology emission, and N and P emission to water. Cause - effect relations from GLOBIO are
and Calculator used and impact is calculated per part of the production chain. Used to determine
which part of the chain leads to the highest impact, and to test effectiveness of
company measures.
The Biodiversity Footprint Calculator is a simple open source tool that allows to
calculate the terrestrial impact of land use and GHG for most relevant parts of the
production chain.
Corporate Iceberg Data The Corporate Biodiversity Footprint measures the impact of corporates on Operational Axa IM, BNPP AM, Mirova,
Biodiversity Lab Biodiversity. It is designed to serve the needs of Financial Institutions to have a Sycomore
Footprint Science-based and scalable approach capable of to covering large portfolios with a
bottom-up approach covering the most material impacts of constituents throughout
their value chain.
Biodiversity Net Arcadis Operational Alvance Aluminium, Brussels
Gain Calculator Airport Company
BIRS and ES LafargeHolcim Operational LafargeHolcim
assessmentReCiPe2016 Radboud Life cycle impact assessment (LCIA) translates emissions and resource extractions Operational
University, RIVM, into a limited number of environmental impact scores by means of so-called
Norwegian characterisation factors. There are two mainstream ways to derive characterisation
University of factors, i.e. at midpoint level and at endpoint level. To further progress LCIA method
Science and development, we updated the ReCiPe2008 method to its version of 2016. We
Technology, PRé implemented human health, ecosystem quality and resource scarcity as three areas
Sustainability of protection. Endpoint characterisation factors, directly related to the areas of
protection, were derived from midpoint characterisation factors with a constant mid-
to-endpoint factor per impact category. We included 17 midpoint impact categories.
The update of ReCiPe provides characterisation factors that are representative for
the global scale instead of the European scale, while maintaining the possibility for
a number of impact categories to implement characterisation factors at a country
and continental scale. We also expanded the number of environmental interventions
and added impacts of water use on human health, impacts of water use and climate
change on freshwater ecosystems and impacts of water use and tropospheric ozone
formation on terrestrial ecosystems as novel damage pathways.
Approaches without quality reviewed case studies
Agrobiodiversity Alliance of ABDi assesses risks in food and agriculture related to low agrobiodiversity. Piloting with food HowGood & Danone; Olam
Index (ABDi) Bioversity The framework is based on 22 indicators, assessing multiple components of and agriculture
International agrobiodiversity in markets and consumption, agricultural production, genetic companies
and CIAT (Int) resource management, and related actions and commitment.
Biological Endangered This protocol is aligned to the Natural Capital Protocol. It helps provide biodiversity- Under development
Diversity Wildlife Trust specific guidance to measuring changes in the state of natural capital (step 6 of the
Protocol (BD (South Africa) Natural Capital Protocol), by providing guidance on how to measure change(s) in
Protocol) biodiversity components affected by business. It differs from the other measurement
approaches in that it offers an accounting framework.
Biodiversity Solagro (France) The Biodiversity Performance Tool (BPT) is being elaborated in the frame of the Online tool tested Currently 350 users (farmers),
Performance EU LIFE Project “Biodiversity in standards and labels for the food sector” aims in Oct – Dec 2019. but still no longer term case
Tool for Food at proposing a methodology to quite easily assess the integration of functional Available from Oct study available
sector (BPT) biodiversity at farm level for food sector actors (product quality or sourcing 2019
managers) as well as for certification companies (certifiers and auditors). The
BPT should help farmers and farm advisors to elaborate and implement sound
Biodiversity Action Plans, which contribute substantially to a better biodiversity
performance on farm level. The tool will support auditors and certifiers of standards
as well as product, quality and sourcing managers of food companies to better
assess the preservation and improvement of integration of biodiversity at farm level.
The BPT should help farmers and farm advisors to elaborate and implement sound
Biodiversity Action Plans, which contribute substantially to a better biodiversity
performance on farm level. The tool will support auditors and certifiers of standards
as well as product, quality and sourcing managers of food companies to better
assess the preservation and improvement of integration of biodiversity at farm level.Biodiversity Lake Constance The tool (also elaborated in the frame of the EU LIFE Project “Biodiversity in Pilots were planned
Monitoring Foundation, standards and labels for the food sector”) has been created to offer food standards in May – Sept. 2020
System for the Global Nature and food companies the possibility to monitor indicators with relevance for but was limited due
Food Sector Fund, Germany biodiversity of their certified farms / their producers. The monitoring is divided to Covid19 pandem-
(BMS) into two levels. Level 1 monitoring is a system wide approach with 25 indicators ic. Intensive promo-
to evaluate the potential created for biodiversity (ecological structures, biotope- tion will happen in
corridors, buffer zones, etc.) and the reduction of negative impacts on biodiversity 2021. The new Ger-
(use of chemical pesticides and fertilizers, erosion, water use, etc.). Level 2 will man sector initiative
be developed in 2021: An In-depth sampling beyond the scope of certification. It “Biodiversity in the
monitors mid- and long-term effects of certification on wild biodiversity on the farm Food Sector” agreed
and its direct surroundings by selected key indicator species. on the implemen-
tation of the Biodi-
versity Monitoring
SystemAvailable
from Sept. 2020
Environmental Kering (France) The EP&L measures carbon emissions, water consumption, air and water pollution, Operational
Profit & Loss land use, and waste production along the entire supply chain, thereby making the
(EPL) various environmental impacts of the company’s activities visible, quantifiable, and
comparable. These impacts are then converted into monetary values to quantify the
use of natural resources.
BioScope Ministry of BioScope provides users with an estimation of where the most important impacts on Operational, but not
Economic biodiversity in their supply chain could be. maintained
Affairs, CODE, This is a first step into determining which of the purchased products and services
Arcadis, PRé may actually matter, allowing you to focus on the relevant commodities and suppliers
Sustainability for managing the biodiversity risks and opportunities in your supply chain.
Source: EU B@B Platform, 2019 and UNEP-WCMC (on behalf of the Aligning Biodiversity Measures for Business initiative). 2019. Discussion Paper 1 for the Technical Workshop on Aligning Biodiversity Measures for
Business: Identifying common ground between corporate biodiversity measurement approaches.
Annex 2
Table.2 Overview of biodiversity measurement approaches and resources used to measure biodiversity impacts for businesses with agricultural supply
chains.
These approaches and resources have been included as they i) are launched, ii) include a range of spatial scales not exclusive to a specific country and iii) the biodiversity
pressure data included is not exclusive to a specific country. Note that this table is not a comprehensive overview of all approaches available and is intended to build
upon prior reports from the EU B@B Platform, 2019 and UNEP-WCMC, 2019, Discussion paper 1 for the Technical Workshop on Aligning Biodiversity Measures for Business:
Identifying common ground between corporate biodiversity measurement approaches (see Table on page 16). The Update Report 3 on biodiversity measurement approaches
for businesses and financial institutions (published on March 2, 2021 includes an update to this list of approaches). Therefore, the intention was to explore what other tools and
resources are available to help further the understanding of the current landscape of biodiversity tools available to businesses with agricultural supply chains.Biodiversity Description Biodiversity Minimum Data Biodiversity Pressure Data
Measurement Metric/ Requirements Included Within the Tool
Resource Indicator Used
Tools
ENCORE ■ ENCORE is used to understand natural capital risks N/A Users need to know the country to be Provides impact drivers to bi-
arising from dependencies and impacts of business screened by the business odiversity loss using the GICS
activities through the use of spatial data. sector classification system
■ The aim of the tool is to help financial institutions but cannot quantify these
to better understand, assess and integrate natural pressures. Examples of impact
capital risks in their activities. drivers:
■ Diseases
■ Although not directly a biodiversity measurement
approach, it provides information on the potential ■ Droughts
risks to businesses by outlining the impacts and ■ Earthquakes
dependencies they have on biodiversity. There ■ Fire
is a biodiversity measurement module currently
■ Habitat modification
in development that will show the impact of
agricultural portfolios to ecological integrity and ■ Intensive agriculture
threatened species. ■ Invasive species
■ Landslides,
■ Pollution
GMAP ■ GMAP provides an early and high-level country and ■ Rate of expansion into Users need to know the country ■ Rate of expansion into
commodity-level evaluation of environmental and natural areas and commodity to be screened by natural areas
social risks associated with agri—commodity primary ■ Impact on protected business ■ Impact on protected areas
production. areas ■ Presence and impact on
■ The criteria and indicators align with the IFC 2012 ■ Presence and impact on high or unique terrestrial
Performance Standards (PS) on Environmental and high or unique terrestrial biodiversity
Social Sustainability, in particular the supply chain- biodiversity ■ Presence and impact on
related requirements of PS2 “Labour and Working
high or unique freshwater
Conditions” and PS6 “Biodiversity Conservation
biodiversity
and Sustainable Management of Living Natural
Resources”.
Sustainable ■ The SCP Hotspots Analysis Tool (SCP-HAT) aims Potentially disappeared For Module 1 and 2, the tool uses The PDF metric incorporates
Consumption at identifying the hot spot areas of unsustainable fraction of species (PDF). primary data so the user can filter the biodiversity pressure data
and production and consumption in order to support PDF indicator (biodiversity metric). for land occupation and land
Production setting priorities in national SCP and climate policies. For the 3rd module on national data transformation for six different
(SCP) system, users can insert their national land use types (- annual crops,
Hotspots data on domestic raw material extrac- permanent crops, pasture,
Analysis Tool tion and greenhouse gas emissions urban, extensive forestry and
produced and substitute the default intensive forestry.
data.Frameworks
EU Product ■ EU project and biodiversity measurement N/A The data should include all known Pressure is not used as a term.
Environmental methodology that aims to standardise the way in inputs and outputs for the process- Data should include those
Footprints which companies can measure product and company es. Inputs are use of energy, water, listed within the Minimum Data
level footprints. materials, etc. Outputs are the prod- Requirements column.
■ Uses a Life cycle assessment (LCA) based method ucts, co-products (77), and emissions.
to quantify the environmental impacts of products Emissions can be divided into four
(goods or services). categories: emissions to air, to water,
to soil, and emissions as solid waste.
■ The overarching purpose of PEF information is to
reduce the environmental impacts of goods and
services taking into account supply chain activities
(from extraction of raw materials, through production
and use and to final waste management).
LandScale The LandScale assessment framework helps users Measures of extent of There are required and optional data ■ Ecosystem conversion
gain critical insights, make more informed decisions, natural ecosystems requirements for the framework ■ Ecosystem degradation
and share credible stories of impact. It provides a and important habitats to use. Examples of required data
■ Biodiversity habitat
holistic overview of a landscape in relation to four converted, degraded, includes:
conversion
pillars of sustainability: ecosystems, human well-being, protected and under ■ Changes in threats to species
governance, and production. restoration, as well as (changes in threats to populations ■ Biodiversity habitat
threatened species of indicator species or other degradation
species identified as important in ■ Changes in
the landscape, using the IUCN Red water quantity
List) ■ Changes in
■ Biodiversity habitat conversion water quality,
(ha of natural ecosystem ■ Greenhouse
conversion within areas identified gas emissions
as important for biodiversity and
■ Soil health (erosion rates,
percentage % of such areas that
percentage of soil organic
this represents).
carbon at production sites)
Data /model
GLOBIO GLOBIO can be used to quantify various policy-relevant Mean Species Abundance No detailed species data is required, ■ Land use (including
dimensions of human-nature interactions by linking the model uses spatial information agriculture, forestry and
climate-change, land use and nitrogen deposition to from the Integrated Model to Assess urbanisation)
biodiversity the Global Environment (IMAGE) ■ Atmospheric nitrogen
deposition
■ Hunting
■ Fragmentation
■ Climate change
■ Road disturbanceYou can also read