Exploring the Influencing Factors of the Recreational Utilization and Evaluation of Urban Ecological Protection Green Belts for Urban Renewal: A ...
←
→
Page content transcription
If your browser does not render page correctly, please read the page content below
International Journal of
               Environmental Research
               and Public Health

Article
Exploring the Influencing Factors of the Recreational Utilization
and Evaluation of Urban Ecological Protection Green Belts for
Urban Renewal: A Case Study in Shanghai
Weiqi Zhao, Yun Wang *, Dan Chen *, Ling Wang and Xiaomin Tang

                                            School of Design, Shanghai Jiao Tong University, Shanghai 200240, China; by19970519@sjtu.edu.cn (W.Z.);
                                            wwlling@sjtu.edu.cn (L.W.); xmtang@sjtu.edu.cn (X.T.)
                                            * Correspondence: wangyun03@sjtu.edu.cn (Y.W.); danchen.gator@sjtu.edu.cn (D.C.);
                                              Tel.: +86-139-0165-1975 (Y.W.); +86-182-1728-2096 (D.C.)

                                            Abstract: With the continuous expansion of urban construction land, the green belts aiming for
                                            ecological protection have ensured a sustainable and effective function of regional ecosystem services.
                                            At the same time, these ecological green belts are expected to develop their compound service
                                            potentials with the development of cities. In order to meet the increasing demand of urban residents
                                            for the recreational utilization of urban green space, the primary function of the ecological green belts
                                            has transformed from being purely ecological to a combination of being ecological and recreational.
                                            Based on social media data, which has the characteristics of a large amount of accessible geographic
                                  information, this study used multiple regression models to analyze the recreational utilization

                                            intensity of ecological protection green belts with a case study in the green belt of Shanghai, China.
Citation: Zhao, W.; Wang, Y.;               The research results showed that the internal elements (total external area, water area, etc.) of the
Chen, D.; Wang, L.; Tang, X.
                                            Shanghai green belt have positive correlations with its recreational utilization. The impact of external
Exploring the Influencing Factors of
                                            factors was inconclusive on the recreational utilization of the outer forest belt (the number of subway
the Recreational Utilization and
                                            stations in accessibility factors was negatively correlated; the number of cultural facilities and the
Evaluation of Urban Ecological
                                            number of restaurants in the surrounding service facilities were positively related). Combined with
Protection Green Belts for Urban
Renewal: A Case Study in Shanghai.
                                            the “Shanghai City Master Plan (2017–2035)”, this study suggests potential zones for the recreational
Int. J. Environ. Res. Public Health 2021,   transformation of the Shanghai green belt, provides a theoretical and practical basis for improving the
18, 10244. https://doi.org/10.3390/         recreational utilization of an urban ecological protection green belt and contributes to the sustainable
ijerph181910244                             development of ecological protection green belts in high-density cities.

Academic Editor: Paul B. Tchounwou          Keywords: green belt; recreational utilization; potential evaluation; social media data; multivariate
                                            regression model; shanghai
Received: 25 August 2021
Accepted: 26 September 2021
Published: 29 September 2021

                                            1. Introduction
Publisher’s Note: MDPI stays neutral
                                                 Regional ecosystem services guarantee the health and well-being of urban and rural
with regard to jurisdictional claims in
                                            residents. The urban green space system, comprised of large ecological patches, landscape
published maps and institutional affil-
                                            ecological corridors and city parks, is the foundation to ensure the continuous performance
iations.
                                            of services, and the ecological protection green belt, as a style of ecological corridor, is a key
                                            component. Boston’s well-known Emerald Necklace has evolved from the initial protection
                                            of natural ecology and connection of city parks to a recreational greenway with ecological
                                            significance [1]. The idea of an ecological protection green belt is usually considered to
Copyright: © 2021 by the authors.
                                            have originated from Ebenezer Howard’s development of a “garden city” around London
Licensee MDPI, Basel, Switzerland.
                                            in the early 20th century [2–4]. Howard’s initial strategy was to curb urban sprawl. This
This article is an open access article
                                            concept was first implemented in the Greater London Plan in 1945. This plan was a great
distributed under the terms and
                                            success, and the concept of the green belt was thus widely imitated in the UK and elsewhere
conditions of the Creative Commons
Attribution (CC BY) license (https://
                                            afterwards [5,6]. The appearance of the ecological protection green belt is used to effectively
creativecommons.org/licenses/by/
                                            control the growth of urban land and serve ecological functions, including maintaining
4.0/).                                      bio-diversity, improving overall protection and utilization of environmental resources in

Int. J. Environ. Res. Public Health 2021, 18, 10244. https://doi.org/10.3390/ijerph181910244                    https://www.mdpi.com/journal/ijerph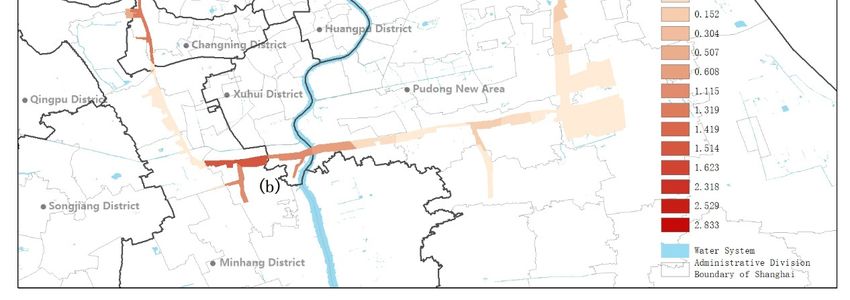
Int. J. Environ. Res. Public Health 2021, 18, 10244                                                                               2 of 18

                                        marginal areas [7], regulating the urban microclimate and absorbing pollutants [8]. In
                                        recent years, researchers have paid more attention to the compound functions of a green
                                        belt around a city, and they have studied new planning policies for green belts to ensure
                                        the sustainable development of an ecological protection green belt to contribute to current
                                        cities [9].
                                              With the increasing requirements for healthier lifestyles, green recreational space
                                        has become essential for urban residents [10]. More and more studies have shown that
                                        entering the green space plays an important role in people’s health and well-being [11,12].
                                        In addition to their widely studied role in urban microclimate and the absorption of
                                        pollutants [8], urban green spaces provide urban residents with a place for sports and
                                        recreation and improve their physical and mental health [11,13]. People’s recreational
                                        requirements for urban green spaces are increasing with improved living levels [14–17].
                                        However, to accommodate growing populations, governments have continued to expand
                                        urban land at the expense of green recreational space [18–20]. The conflict between the
                                        decrease in recreational space and the increase in citizens’ demand for recreation has
                                        intensified [21]. The existence of urban protective green belts is one of the largest green
                                        space resources in a city. The planning of urban green belts in Hong Kong and other places
                                        proves that ecological protective green belts have a certain degree of flexibility and that they
                                        can play different roles in different spaces throughout a city, which shows changeability
                                        in their planning principles [4]. The recreational utilization function is also an important
                                        planning purpose of a green belt. It is essential for an urban ecological protection green
                                        belt to transform in response to the changes in a modern city. The recreational utilization
                                        function of the urban protective green belt will make a significant contribution to balancing
                                        the negative impacts of rapid urbanization on the health and well-being of residents.
                                              The research on the factors affecting the recreational use of the green belts has a strong
                                        guiding significance for the planning of recreational transformation. Many researchers have
                                        studied the factors affecting the recreational utilization of green space. However, there is no
                                        consensus on the influencing factors. Many studies have focused on polygonal green space,
                                        which can also be applied to striped green space, and areas [22], attractiveness [23–25],
                                        accessibility [26,27] and the amount of green space [28] have positive impacts on polygonal
                                        green space. In the study by Zhang et al., the attractiveness of area size for residents to enter
                                        the park was second only to the entrance fee, and this result explained 57% of the survey
                                        data in their research; another 27% of the survey data showed that the inconvenience
                                        of transportation would lead to a decline in the utilization rate of the park, and at this
                                        time the positive impact of factors such as park area and cost would not be obvious [29].
                                        Hooper’s research results showed that most people will use parks and green spaces within
                                        1500 m of their homes that are easily accessible, which showed that accessibility is an
                                        important influencing factor [30]. Donahue found that water features are closely related
                                        to the utilization of parks through analyzing Twitter photos [31]. These previous studies
                                        indicate that residents’ recreational utilization of urban parks is inextricably linked to the
                                        area, landscape, accessibility and the surrounding environment. Large-scale natural parks
                                        full of natural scenery are very popular with residents; at the same time, community parks
                                        that are easy to reach and have more exquisite designs are also very important for the
                                        entertainment and leisure activities of nearby residents [32,33].
                                              Reviewing the literature, most research on urban green space relies on traditional
                                        survey methods, such as a questionnaire survey of random or representative sample users
                                        to measure the recreational use of urban green space and to explore the factors affecting
                                        recreational use [24,31,33–35]. However, such methods are usually limited by several
                                        factors, including the time selection of the investigation, the ability to interpret questions
                                        and the number of samples. For a large research area, material and human resources are
                                        expensive [36]. More importantly, in the context of the coronavirus (COVID-19) pandemic,
                                        face-to-face investigations are not feasible under the current situation. In the past few years,
                                        the number of studies using rich geographic information resources provided by social
                                        media to evaluate the recreational use of green park space has surged [37–39]. Social media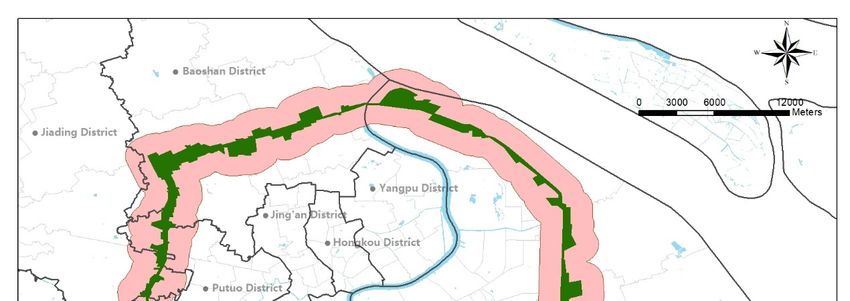
Int. J. Environ. Res. Public Health 2021, 18, 10244                                                                                3 of 18

                                        data can aid the analysis of user attributes to study the relationship between people and
                                        the environment in urban parks [40]. Social media data can also be used to measure the
                                        utilization of urban green space and evaluate its influential factors [14,18,31,41]. Inspired
                                        by the demand for large amounts of green space usage data with a long time span and the
                                        research methods mentioned above, we decided to estimate the recreational use of urban
                                        green space through social media data in this study.
                                              On the basis of protecting the existing ecological pattern of the ecological protection
                                        green belt, how shall we improve the recreational service function of the green belt in a
                                        targeted manner to meet the residents’ increasing demand for recreational green space? The
                                        main purpose of this article is to explore the factors that affect recreational utilization of the
                                        green belt and contribute to the planning of the recreational transformation to contribute
                                        to the sustainable development of ecological protection green belts in the context of urban
                                        renewal. Previous studies have discussed the factors affecting the recreational utilization
                                        of urban green space. In this study, we assumed that these influencing factors could also
                                        be used for the study of the recreational utilization of protective green belts. Therefore, it
                                        was assumed that the internal attributes, accessibility, and surrounding service facilities
                                        of ecological protection green belts would affect residents’ recreational utilization, which
                                        also determined the potential location of an urban green belt recreation transformation.
                                        The Shanghai green belt is an ecological protection green belt that was built in 1994 to
                                        prevent the unlimited expansion of the city. In this work, the Shanghai green belt was used
                                        as part of an empirical study to explore the factors that actually affected the recreational
                                        utilization of the ecological protection green belt, and propose planning guidance for the
                                        transformation of recreational utilization in the city to explore the sustainable development
                                        of the green belt in response to the changes in the recreational demand of today’s residents
                                        and to improve the sustainable development of residents’ health.

                                        2. Methodology
                                             In order to explore the factors affecting the recreational utilization of the Shanghai
                                        green belt, a multiple regression model was used in this study. Sina Weibo sign-in data
                                        was used to quantify the recreational utilization of the green belt (dependent variable) and
                                        the impact factor (independent variable) in the regression model.

                                        2.1. Study Area
                                              The Shanghai government approved the construction of the green belt in 1994. It
                                        is a vital place for entertainment, and is also an open green belt that provides ecological
                                        protection and isolates urban and rural development. The construction of the green
                                        belt effectively prevented the unlimited expansion of the city and brought significant
                                        environmental and social benefits. It also has significant ecological and economic benefits,
                                        such as adjusting temperature and humidity (e.g., alleviating the urban heat island effect)
                                        and purifying the atmospheric environment [21,42,43]. With the expansion of construction
                                        land in the central urban area, the location of the green belt was no longer in the boundary
                                        area. The acceleration of urbanization and the development of the urban economy also
                                        led to population increase in the urban area. The urban residential areas have been
                                        concentrated within the outer ring, and gradually developed near the green belt, especially
                                        in the western part. After 2005, residential areas with green spaces began to be built around
                                        the green belt. After twenty-five years of rapid urban growth, restraining urban expansion
                                        is no longer the primary function of the green belt. The green belt is no longer able to meet
                                        the needs of citizens for its purely ecological purposes [21,44].
                                              The Shanghai green belt is 98 kilom long and has a width of at least 500 m. The
                                        green belt passes through seven administrative regions including Baoshan, Minhang and
                                        Changning District, with a total area of about 72.41 km2 . The green space can be classified
                                        into two types. The first type is a 500-m-wide shelter forest model, including a 100-m-wide
                                        open, pure forest belt dominated by trees and a 400-m-wide green belt built along the
                                        road’s outer area. The landscape of the Shanghai green belt is weak, lacking infrastructure.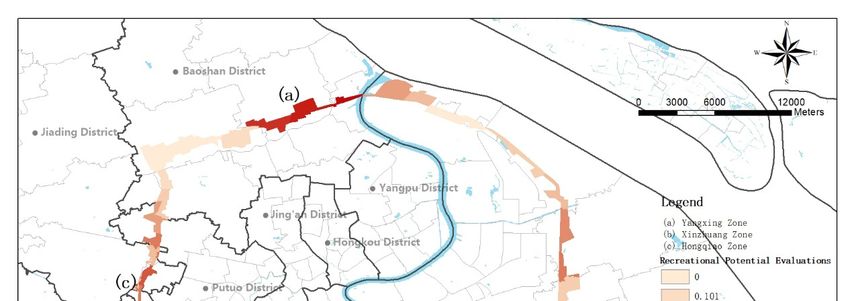
not enough to attract citizens from the city for recreational activities. In the preliminary
                                     investigation, the target population had to be mainly surrounding residents. According to
                                     the “Shanghai 15-min walk living circle” policy, in order to achieve the goal of
                                     constructing a multi-type, multi-level, walkable and public urban network space by the
Int. J. Environ. Res. Public Health 2021, 18, 10244
                                     year of 2035, the green belt is responsible for providing green open space4 to              of 18
                                                                                                                                     dense
                                     residential areas on both sides—a vital function of available green space within 15 min. A
                                     15-min walking distance is taken as the acceptable service range of the green belt based
                                     on The    second daily
                                         residents’    type mainly  includes
                                                             recreational     botanical
                                                                           needs        gardens, forest
                                                                                  and behaviors.        parks, green
                                                                                                    Therefore, in thisentertainment
                                                                                                                        study, the green
                                        parks    and other parks built on the green belt. These parks make
                                     belt and the 15-min walking distances (about 1500 m) on both sides wereup for the lack of green
                                                                                                                               examined
                                         open    space and serve as community
                                     (Figure 1, 15-min walking distance).       parks  for the surrounding residents  (Figure 1, The
                                 Shanghai green belt).

         Figure
    Figure         The green
                1. green
           1. The        beltbelt
                              andand
                                  thethe 15-min
                                      15-min    walkingdistance
                                              walking   distance buffers
                                                                 buffers (about
                                                                          (about1500
                                                                                 1500m)m)
                                                                                        onon
                                                                                           both sides
                                                                                             both     of the
                                                                                                   sides  of green belt. belt.
                                                                                                             the green
                                      Given the green belt’s overall service facilities and aesthetic level, the green space is
                             2.2.not
                                  Data  Collection
                                     enough   to attract citizens from the city for recreational activities. In the preliminary
                                 investigation,
                             2.2.1. Social Mediathe Data
                                                    target population had to be mainly surrounding residents. According to
                                 the “Shanghai 15-min walk living circle” policy, in order to achieve the goal of constructing
                                   The recreational use data in this study came from the Sina Weibo sign-in data from
                                 a multi-type, multi-level, walkable and public urban network space by the year of 2035,
                             December
                                 the green2011   toresponsible
                                            belt is  July 2020 (Table   1). Sinagreen
                                                                for providing     Weibo,
                                                                                      openusually
                                                                                           space toregarded  as Twitter
                                                                                                    dense residential     inon
                                                                                                                      areas  China,
                             is one
                                 bothofsides—a
                                         the most    important
                                                  vital          social
                                                        function of      media
                                                                    available    platforms
                                                                              green         and one
                                                                                     space within     of the
                                                                                                   15 min. A largest  social media
                                                                                                              15-min walking
                             platforms
                                 distance is taken as the acceptable service range of the green belt based on residents’Weibo
                                          in China    [45]. In 2020, the  average   number   of daily active  users of   daily was
                                 recreational needs and behaviors. Therefore, in this study, the green belt and the 15-min
                                 walking distances (about 1500 m) on both sides were examined (Figure 1, 15-min walking
                                 distance).

                                 2.2. Data Collection
                                 2.2.1. Social Media Data
                                      The recreational use data in this study came from the Sina Weibo sign-in data from
                                December 2011 to July 2020 (Table 1). Sina Weibo, usually regarded as Twitter in China,
                                is one of the most important social media platforms and one of the largest social media
                                platforms in China [45]. In 2020, the average number of daily active users of Weibo was
                                229 million, and the number of monthly active users was 523 million. Weibo is in the top
                                tier of China’s social media platforms and provides a rich database for research material,
                                covering the range of residents’ activities in all four seasons. We signed an agreement with
                                Sina Weibo to purchase data, provided by Application Programming Interface (API), and
Int. J. Environ. Res. Public Health 2021, 18, 10244 5 of 18
obtained more than 3 million pieces of Weibo sign-in data from its establishment from
December 2011 to July 2020. Sina Weibo records the location and statuses of users. Each
record of the sign-in data includes the following fields:
• User ID: identity code of anonymous user;
• Longitude: longitude of the user’s activity point;
• Latitude: latitude of the user’s activity point;
• Time: time of the user’s activity.
Table 1. Social media data information.
Data Time Quantity of Records Fields Use
Sina Weibo check-in December 2011–July User ID, number of points, To identify the
3,019,644
data 2020 longitude, latitude and time destinations of users
2.2.2. Basic Data Related to the Green Belt
Other basic data related to the green belt (Table 2) mainly includes information
on Shanghai’s urban road network, bus stations, subway stations, urban water systems
and points of interest (POI) near the green belt. According to the Shanghai Statistical
Yearbook [46], Shanghai’s road network and public transportation system have undergone
minor changes from 2011 to 2020 [47]. The increase in roads is within 10% and mainly
in suburban roads, and the impact on the periphery of the green belt is relatively small.
The data on bus stops, subway stations and POI points will match the Weibo check-in
data, so the latest basic data that can be obtained is selected. In order to obtain the
geographic information data for the city, the area data for Shanghai was extracted from
OpenStreetMap [48]. The POI data came from the Weibo application, and the data could
be used to reflect the business prosperity around the green belt.
Table 2. Basic data information related to the green belt.
Data Time Quantity Use
Road network 2019 12,273
Bus station 2020 7284 To determine the traffic convenience of the green belt
Subway station 2020 37
POI data 2020 24,088 To determine the commercial prosperity of the green belt
2.3. Definition and Evaluation Method for the Recreational Utilization of the Green Belt
Recreational utilization, which is an essential function of urban green space [49,50],
relies on natural and human resources as well as other attractions as carriers to provide
residents with the function of achieving physical and mental rest within a certain travel
time or distance [29,51,52]. In previous studies, researchers have proven that the density of
social media posts is positively correlated with the number of actual visits [53], and there
are empirical studies that have used Weibo check-in data to quantify the number of visits
to urban parks and the recreational preferences of residents [29,54]. For this study, it was
believed that the user check-in data in the green belt represented the residents’ visits and
utilization, which could be used to define the recreational utilization. Therefore, the Weibo
check-in data for residents in the green belt was used as a quantitative indicator to measure
the recreational utilization of the green belt.
Through this research, multiple regression equations affecting the recreational utiliza-
tion of the green belt were established. The results of the equations were combined with
related urban planning strategies, and the future leisure use of the urban green belt was
calculated by incorporating the values of related independent variables into the regression
equation in order to propose the recreational evaluation of the green belt.Int. J. Environ. Res. Public Health 2021, 18, 10244 6 of 18
2.4. Determination and Calculation of Impact Factors
Through a literature review and investigation, it was found that factors affecting the
green belt around the city included internal factors, accessibility and surrounding service
facilities. The internal influencing factors were attributes related to the initial design of the
green belt, including the size of the green area, the size of the water body, and the degree
of beauty, which was determined by scoring the beauty of current photos. Accessibility
is a measure connecting the supply and demand for recreational services. Convenient
transportation will increase the frequencies and opportunities of contact between residents
and green spaces. It can be analyzed from the area of the road network, the number of bus
stations, and the number of subway stations [55]. Surrounding service facilities refer to the
influencing factors located outside a green belt, which can be analyzed for residential areas,
shopping spots, restaurants, cultural facilities, tourist spots, and entertainment facilities. In
this study, we used the thirteen impact factors shown in Table 3.
Table 3. Information on the potential factors affecting the recreational utilization of the green belt.
Type Factors Description Measurement
The land coverage area of the
The size of the green area hm2
green area
The land coverage area of the
The size of the water body hm2
water area
Internal factors
The land coverage area of the 1500-m
The size of the 1500-m area hm2
buffer zone of the green belt
The degree of beauty Evaluation score for green belt scenery Grade
The land coverage area of the
Road area hm2
road network
Accessibility
Bus station The number of bus stations Count
Subway station The number of subway stations Count
Residential areas The number of residential areas Count
The number of shopping spots, such as
shopping malls, convenience stores,
Shopping spots Count
hypermarkets, supermarkets,
commercial streets and specialty stores
The number of restaurants, such as
Chinese and foreign restaurants, fast
Restaurants Count
food restaurants, coffee shops,
teahouses and pastry shops
The number of cultural facilities, such
Surrounding service as museums, exhibition halls, art
facilities Cultural facilities galleries, libraries, science and Count
technology museums, cultural palaces,
archives and schools
The number of tourist spots, such as
Tourist spots zoos, botanical gardens and Count
scenic spots
The number of entertainment facilities,
Entertainment facilities such as sports venues, entertainment Count
places, theaters and vacation resorts
Other basic data related to the green belt (Table 2) was used to calculate internal
factors and accessibility. Through the ArcGIS platform, using the shape of the green belt
and the water area, the area of the required range and the number of roads, bus stops and
subway stations within the scope were calculated. The degree of beauty was calculatedInt. J. Environ. Res. Public Health 2021, 18, 10244 7 of 18
by the Scenic Beauty Estimation Method (SBE method), which is often used to evaluate
landscapes aesthetically [56,57]. The selection of sample plots was carried out based on
the principles of full coverage in different administrative divisions, time of establishment,
diversity of plant community types, and richness of plant species. After ensuring that
the sample plots cover all the administrative regions, the number of sample plots were
distributed proportionally according to the length of the green belt belonging to each
administrative region. Finally, 101 sample plots of the green belt were selected to represent
different sections. The public’s perception of the beauty of the green belt was measured by
taking photos and evaluating photos by professionals and non-professionals. The degree
of beauty reflected the current visual situation of the green belt [58]. The combination of
social media data (Table 1) and the basic data related to the green belt (Table 2) was used to
determine the surrounding service facilities. A summary of the statistics of the variables
used in this study is shown in Table 4.
Table 4. Summary of statistics of variables used.
Standard
Variable Category Variable Name Minimum Maximum Mean
Deviation
The green area (hm2 ) 1.34 485.26 204.24 108.05
The water area (hm2 ) 0.00 39.61 6.36 10.24
Internal factors
The 1500-m buffer zone (hm2 ) 1307.41 2,404,560.00 44,985.60 318,165.34
The degree of beauty (grade) 2.00 8.00 4.60 1.33
Road area (hm2 ) 120.11 800.88 286.75 138.95
Accessibility Bus station (count) 0.00 5.00 1.36 1.32
Subway station (count) 28.00 815.00 238.46 166.84
Residential areas (count) 0.00 139.00 28.32 25.45
Shopping spots (count) 0.00 32.00 7.98 6.65
Surrounding Restaurants (count) 0.00 182.00 35.61 34.64
service facilities Cultural facilities (count) 2.00 23.00 8.00 4.97
Tourist spots (count) 0.00 8.00 2.64 2.22
Entertainment facilities (count) 0.00 41.00 8.09 7.96
2.5. Multiple Regression Model
In order to explore the relationship between the influencing factors and the recreational
utilization of the green belt, a multiple regression model of the recreational utilization was
established. In this model, the dependent variable of the park recreation utilization was
estimated using Weibo check-in data, and the independent variables (influencing factors)
of the green belt recreation utilization were determined using the thirteen attributes of
the green belt. It should be noted that seasonal changes brought changes in the plant
seasons and temperature. Therefore, the four seasons of spring, summer, autumn and
winter were introduced as control variables to illustrate the potential seasonal effects of
the recreational use of the green belt. According to Shanghai’s climate changes, spring
was defined from March to May, summer was defined from June to August, autumn was
defined from September to November, and winter was defined from December to February.
Based on the above variables, a logarithmic multiple regression model (1) was used:
ln(Y ) = b0 + b1 ln( X1 ) + b2 ln( X2 ) + · · · + b13 ln( X13 ) (1)
where Y is the number of Weibo check-in data points, Xi (i = 1,2 . . . , 13) is the influencing
factor and bi (i = 0, 1, 2 . . . , 13) is the coefficient to be solved. ln stands for log transforma-
tion. This is a special data transformation method, which can reduce the absolute value
of the data to facilitate calculation. In this study, the absolute value of the area data and
the sign-in data are both large, while the absolute value of the service facility data is small,
and the magnitude of the independent variable is inconsistent. Therefore, the logarithmic
transformation of the data is carried out to eliminate this large difference in magnitude. TheInt. J. Environ. Res. Public Health 2021, 18, 10244 8 of 18
study calculated both the logarithmic model and the dual logarithmic model and selected
the dual logarithmic model with a higher model fitting result. The entirety of the statistical
analysis was performed using IBM SPSS Statistics 24 (SPSS Inc., Chicago, IL, USA).
Multiple regression models and logarithmic regression models have been widely
used in previous studies to detect the statistical relationships between the utilization of
green space and the impact factors [59,60]. In this study, four multiple regression models
(the linear form, semi-logarithmic form, logarithmic linear form and logarithmic form of
the multiple regression equation) were preliminarily tested during model selection. The
logarithmic model was the most appropriate since it had the highest degree of fit and
explanation.
3. Results
3.1. The Relationship between Recreational Utilization and the Influencing Factors of the
Green Belt
According to the selection results of the above models, a logarithmic model was
adopted and the natural logarithm of the number of check-ins and the natural logarithm
of all numerical variables were used in a stepwise regression. The model was analyzed
and tested on the judgment coefficient, the probability value of the F statistic, the variance
expansion index VIF value, the homogeneity of the variance and the residual value. The
test results showed that the built model had a reasonable degree of fit and high explanatory
power. The fitting of the sample data was statistically significant, and it could be used to
analyze and explain the impact of various variables on the recreational utilization of the
Shanghai green belt.
The results of the regression model (Table 5) showed that the number of subway
stations passed the 5% significance level test, while the water area, 1500 m service area,
number of residential areas, number of restaurants and number of cultural facilities all
passed the 1% significance level test. Among these six factors, the number of residential
areas and the number of subway stations had significantly negative impacts on the recre-
ational utilization of the green belt, while the number of cultural facilities, the areas of the
water bodies, the number of restaurants and the area had significantly positive effects.
The Shanghai green belt is divided into two parts: the pure forest belt and the park
built on the green belt. Therefore, there was likely to be a difference between the recreational
utilization of the park and the pure forest belt. Therefore, 188 groups of samples were
selected, with 56 groups of samples from the parks and 132 groups from the pure forest
belt. Then, a regression model analysis was performed on each of these two groups of
data (Table 6). In addition to the difference in the internal impact factors, the results of the
built park and the pure forest belt were also different in terms of accessibility. The results
of the built park showed that for every 1% increase in road area, recreational utilization
will increase by 21.227%; for every 1% increase in the number of bus stops, recreational
utilization will increase by 11.587%. For the results of the pure forest belts, the road area
and the number of bus stops were not significant.
In addition, the policy of “Guidelines for Environmental Landscape Design of Res-
idential Areas (Trial Draft)” was believed to be the cause for why Shanghai’s real estate
market was in an overheating stage in 2005 [61]. Since then, the supporting facilities of
commercial housing have been rapidly improved, the green landscape of residential areas
has been paid attention to and the improvement of the environment may have had a
certain impact on the results of the recreational utilization of the green belt. Therefore,
the third regression analyzed the impact of the construction year of the residential area
around the green belt on the recreational utilization (Table 7). In this model, the difference
between pure forest belts and parks around the city was not considered because of the aim
of obtaining the impact of the construction year of the residential area on the recreational
utilization. The residential buildings were divided into those built before and after 2005,
and the model analysis was performed again. The results of the model showed that for
residential areas built after 2005, every 1% increase in the number of residential areas willInt. J. Environ. Res. Public Health 2021, 18, 10244 9 of 18
lead to a 0.681% drop in recreational use. In the model before 2005, residential areas did
not have a significant impact.
Table 5. Results of the multivariate regression model.
Model Variable Coeff. PCSE
Intercept −1.944 2.355
ln (the size of the
0.334 0.199
green area)
ln (the size of the
0.417 0.088 ***
water body)
ln (the size of the
0.293 0.096 ***
1500-m area)
ln (the degree of
0.487 0.466
beauty)
ln (road area) 0.411 0.527
ln (bus station) −0.873 0.225
ln (subway station) −0.665 0.326 **
ln (residential areas) −0.668 0.199 ***
ln (shopping spots) 0.263 0.229
ln (restaurants) 1.124 0.205 ***
ln (cultural facilities) 1.204 0.305 ***
ln (tourist spots) −0.235 0.18
ln (entertainment
−0.263 0.176
facilities)
Overall model
sample size (n) 192
Adjusted R2 0.533
F-test 14.628 ***
NOTES: Coeff. = coefficient; PCSE = panel-corrected standard errors. *** = significant at 99% (p ≤ 0.01);
** = significant at 95% (p ≤ 0.05); * = significant at 90% (p ≤ 0.10).
Table 6. Regression results for the parks and pure green belts.
Parks Built on Green Belts Pure Green Belts
Model Variable
Coeff. PCSE Coeff. PCSE
Intercept 80.088 13.869 *** 1.578 2.678
ln (the size of the
8.706 0.787 *** 0.069 0.223
green area)
ln (the size of the
7.311 1.002 *** 0.136 0.135
water body)
ln (the size of the
5.933 4.710 *** 0.309 0.094 ***
1500-m area)
ln (the degree of
0.001 0.395 0.132 0.558
beauty)
ln (road area) 21.277 2.677 *** −0.047 0.653
ln (bus station) 11.587 1.837 *** −0.362 0.367
ln (subway station) −2.094 0.329 *** −0.987 0.334 ***
ln (residential areas) −2.82 0.398 *** −1.344 0.304 ***
ln (shopping spots) −26.406 3.781 *** 0.702 0.260 ***
ln (restaurants) 14.579 1.953 *** 1.134 0.239 ***
ln (cultural facilities) −11.744 1.908 *** 1.234 0.424 ***
ln (tourist spots) 4.452 0.779 *** 0.205 0.219
ln (entertainment
−1.624 0.354 *** −0.294 0.223
facilities)
Overall model
sample size (n) 51 139
Adjusted R2 0.928 0.445
F-test 42.278 *** 7.964 ***
NOTES: Coeff. = coefficient; PCSE = panel-corrected standard errors. *** = significant at 99% (p ≤ 0.01);
** = significant at 95% (p ≤ 0.05); * = significant at 90% (p ≤ 0.10).Int. J. Environ. Res. Public Health 2021, 18, 10244 10 of 18
Table 7. Regression results for the residential areas built before 2005 and after 2005.
Residential Areas Built before 2005 Residential Areas Built after 2005
Model Variable
Coeff. PCSE Coeff. PCSE
Intercept −3.409 7.862 −2.787 3.757
ln (the size of the green area) −0.596 0.254 * 1.180 0.308 ***
ln (the size of the water body) 1.011 0.146 *** 0.057 0.179
ln (the size of the 1500-m area) 1.346 1.362 0.260 0.106 **
ln (the degree of beauty) −0.001 0.682 1.464 0.651 **
ln (road area) 0.653 0.943 −0.638 0.906
ln (bus station) −1.941 0.576 *** −0.381 0.445
ln (subway station) −0.758 0.302 ** −0.777 0.405 *
ln (residential areas) −0.454 0.507 −0.681 0.291 **
ln (shopping spots) 0.055 0.543 0.553 0.296 *
ln (restaurants) 2.721 0.479 *** 0.880 0.286 ***
ln (cultural facilities) 2.011 0.445 *** 1.068 0.555 *
ln (tourist spots) 0.003 0.314 −0.532 0.294 *
ln (entertainment facilities) −2.300 0.439 *** −0.083 0.217
Overall model
sample size (n) 83 103
Adjusted R2 0.705 0.522
F-test 13.403 *** 8.022 ***
NOTES: Coeff. = coefficient; PCSE = panel-corrected standard errors. *** = significant at 99% (p ≤ 0.01); ** = significant at 95% (p ≤ 0.05);
* = significant at 90% (p ≤ 0.10).
3.2. Recreational Potential Evaluation
According to the results above, factors such as residential areas, cultural facilities
and accessibility significantly affect the recreational use of the green belt. Combined with
the land use plan given in the “Shanghai City Master Plan (2017–2035)” and the strategic
guidance maps of each administrative region, the recreational potential of the green belt
was calculated. The recreational potential evaluations of the recreation utilization along
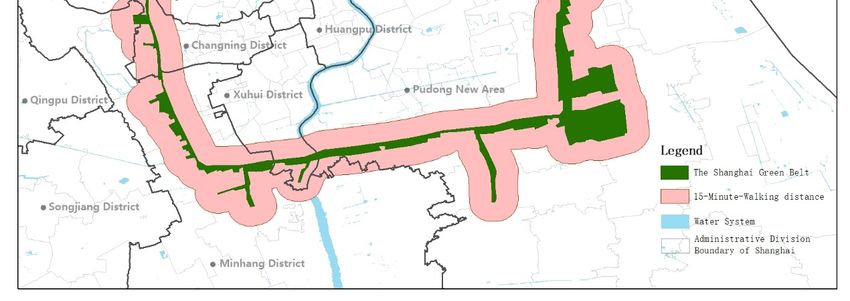
the Shanghai green belt are shown in Figure 2. The Yanghang zone (a), Xinzhuang zone
(b) and Hongqiao zone (c) were the points with the most recreational potential in the green
belt. On one hand, in the “Shanghai City Master Plan (2017–2035)”, the Hongqiao hub
at the junction of Minhang and Changning District near the green belt would become
an international (national) transportation hub, while the Yanghang and Xinzhuang hubs
in Baoshan and Minhang District were planned to be a city-level transportation hub.
Combining the strategic guidance maps of various administrative regions, it was found
that a large number of residential areas will be formed near these three transportation
hubs, as well as cultural facilities and other public service facilities. On the other hand,
high-quality internal factors qualify the green belt of these three regions to have huge
recreational potential. Additionally, the existence of the recreational green belt helps to
meet the planning requirement of a 15-min walk to green space. Therefore, recreational
transformation of the green belt in these three sections in order of priority will cope with
the increased demand.Int. J. Environ. Res. Public Health 2021, 18, x 13 of 20
Int. J. Environ. Res. Public Health 2021, 18, 10244 11 of 18
Figure 2. Recreational potential evaluations of recreation utilization along the Shanghai green belt.
Figure 2. Recreational potential evaluations of recreation utilization along the Shanghai green belt.
4. Discussion
4. Discussion
4.1. Influencing Factors of the Recreational Utilization of the Green Belt
4.1. Influencing Factors
In this study, theofrelationships
the Recreational Utilization
between of the Green
the internal Belt attributes of the
and external
In this
green belt study, the relationships
and its recreational between
utilization the internalByand
were investigated. external
comparing theattributes
influencingof the
factors of the recreational utilization, it could be seen that the internal
green belt and its recreational utilization were investigated. By comparing the factors thatinfluencing
had a
great impact on the recreational potential of the green belt were the water
factors of the recreational utilization, it could be seen that the internal factors that area and thehad a
service
great areaon
impact of 1500 m. The most influential
the recreational potential accessibility
of the green factor
beltwas
werethethe
number
waterofarea
subwayand the
stations, while the surrounding service facilities factors included the number of cultural
service area of 1500 m. The most influential accessibility factor was the number of subway
facilities, the number of restaurants and the number of residential areas. The number of
stations,
subway while theand
stations surrounding
the numberservice facilities
of residential areasfactors includedcorrelated,
were negatively the number of the
while cultural
facilities, the number of restaurants
rest were positively correlated. and the number of residential areas. The number of
subway stations and the number of residential areas were negatively correlated, while the
rest4.1.1.
wereInternal Factors
positively correlated.
The results show that the scale of green spaces and water bodies had a positive impact
on Internal
4.1.1. attractingFactors
residents to recreational activities. When increasing the area of green land
and water bodies by 1%, the recreational potential of the green belt increases by 0.71%. The
The results show that the scale of green spaces and water bodies had a positive
results confirm what previous studies described: that residents tend to use larger areas
impact on attracting
of green residents
space [22,30,62], and to
thatrecreational
the existenceactivities.
of water When
bodies increasing
is attractivethe area of green
to residents
land and water
regardless bodies
of the by 1%,and
environment theaccessibility
recreational potential of the green belt increases by
[24,63].
0.71%. The resultsofconfirm
The degree beauty didwhatnotprevious studies
significantly affectdescribed: that residents
the recreational utilizationtend
of the to use
larger areas green
Shanghai of greenbelt.space [22,30,62],
Previous studies and
havethat
foundthethat
existence of are
residents water
morebodies
willingis to
attractive
go
to scenic urban
to residents green of
regardless spaces [21]. The green
the environment belt,
and as a protective
accessibility green space to restrain
[24,63].
urban
The sprawl,
degreedid of not take aesthetic
beauty did not beauty as an important
significantly concern
affect the in the initial
recreational planningof the
utilization
and construction stage. Therefore, the degree of beauty of the green belt
Shanghai green belt. Previous studies have found that residents are more willing to go to was generally
low, which caused the lack of residents’ willingness to use it for recreation. At the same
scenic urban green spaces [21]. The green belt, as a protective green space to restrain urban
time, accessibility is an important factor affecting recreational utilization [64]. When infras-
sprawl, didfacilities
tructure not take aesthetic
such as roadbeauty as an
traffic and busimportant
stations areconcern
not fullyin the initialand
constructed planning
traffic and
construction stage. Therefore, the degree of beauty of the green belt was generally low,
which caused the lack of residents’ willingness to use it for recreation. At the same time,
accessibility is an important factor affecting recreational utilization [64]. When
infrastructure facilities such as road traffic and bus stations are not fully constructed andInt. J. Environ. Res. Public Health 2021, 18, 10244 12 of 18
accessibility is weak, residents are unwilling to go to the green belt for recreational activities,
regardless of the beauty of the scenery [65]. It can be predicted that after the improvement
of traffic accessibility and the completion of the plant landscape and supporting facilities,
the degree of beauty may serve as a significant positive factor impacting the recreational
utilization of the green belt.
It can be concluded that the size of green spaces and water bodies is a prerequisite
for the recreational transformation of the green belt. The scale of green spaces and water
bodies also guarantees the advantages of the green belt in terms of temperature regulation
and atmospheric purification [66]. Therefore, in the process of recreational transformation,
it is necessary to ensure the scale of green spaces and water bodies. On this basis, enriching
the plant community, optimizing the plant seasonal view and cleaning the water body
help increase the recreational utilization of the green belt while maintaining the ecological
benefit, and achieve the purpose of developing and utilizing the compound utilization of
the green belt.
4.1.2. Accessibility
With regard to accessibility, the number of subway stations has a negative impact on
the recreational utilization of the green belt, which is different from the results in previous
studies [26]. After dividing the green belt into pure forest belt and the park built along with
the forest belt, regression analysis results indicate that the area of roads and the number
of bus stops in the partial sections of the green belt (parks built on the green belt) are
significantly positive factors affecting the recreational utilization of the green belt (Table 6).
Previous quantitative studies showed that accessibility can increase the recreational use
of green spaces [29]. However, qualitative analysis and research have shown that easily
accessible green space does not necessarily lead to the use of green space [67]. Factors
such as safety, night lighting and site flatness affect residents’ use of green space [68]. This
explains why the road area and the number of bus stops are positively correlated with the
recreational use of the green belt in the regression analysis results of the sections of the
parks that have been built in this study. In the model of the pure green belts, due to the
lack of night lighting facilities and safety facilities, the regression analysis results show that
the two accessibility factors are not significantly correlated to the recreational use of the
green belt. As of this moment, the main purpose of the Green Belt is still a forest belt with
ecological protection. The subway station represents a time-consuming way for residents to
travel, and is not the most convenient method of transportation. This explains why when
the number of subway station increases by 1%, the recreational utilization will decrease
by 0.665%. Although the research results did not explicitly conclude the positive effect of
accessibility on the recreational use of green belts, it was found in related design practices
that good traffic accessibility has become a prerequisite for renovation design [69,70].
Therefore, for the recreational transformation of the green belt, it is necessary to increase
the convenience of transportation.
4.1.3. Surrounding Service Facilities
The model suggests that if the number of cultural facilities and restaurants increases
by 1%, this will lead to an increase in recreational utilization by 2.33%. The dining spots
attract a massive flow of people, which is positively related to the further recreational use of
the green belt [31,71]. The construction of cultural facilities helped to improve the economic
value of the area, attract projects and investment, increase the cultural connotation and
cultural heritage of the site, and stimulate the generation of public spaces. A green belt
around a city can serve as a measure for residents to enter these cultural platforms, which
is more effective for stimulating local economic development and spatial potential as
well as producing a substantial effect on the recreational use of a green belt around a
city [72]. In the regression analysis of built parks, cultural facilities and shopping spots
were significantly negatively correlated with the recreational use of the green belt. One
possible reason may be that the locations of built parks along the green belt are economicallyInt. J. Environ. Res. Public Health 2021, 18, 10244 13 of 18
developed and densely populated areas, with relatively high-quality infrastructure service
facilities and well-designed recreational spaces. Therefore, residents do not have to go
to a green belt with relatively low accessibility for recreational activities. In addition,
entertainment facilities were significantly negatively correlated as shown in Tables 6 and 7.
Entertainment facilities include cinemas, theaters, etc., which residents usually choose
for certain entertainment purposes which typically last several hours. A previous study
has shown that the leisure and recreation time of urban residents generally persists for
1–3 h [73], and after spending several hours in entertainment facilities people usually no
longer spend time in the green belt for recreational activities.
Residential green space has ecological effects, such as regulating the temperature and
humidity inside the residential area and having strong noise reduction and dust reten-
tion [74,75]. After the introduction of the green space management policies in residential
areas, the area of green space in residential areas has rapidly increased, providing a large
amount of green space for the city [76]. The green space in the residential area connects the
urban green space system, which provides basic ecosystem services for the city [77]. From
the perspective of recreation, some studies believed that residential areas had particular
importance and that surrounding residents had specific needs for daily recreational activi-
ties [31]. Therefore, a green belt located next to a residential area has the proper conditions
for recreational development and utilization [78,79]. However, studies have also shown
that if nearby green spaces are considered uncomfortable and unattractive, individuals will
prefer not to participate in outdoor recreational activities [80]. The research results of this
study on the Shanghai green belt tend to be close to the latter conclusion. The policy of
the “Guidelines for Environmental Landscape Design of Residential Areas (Trial Draft)”
enabled a better internal green space construction within the residential area after 2005,
qualifying those residential green spaces for recreational use. Combined with the previous
analysis of the degree of beauty and the traffic accessibility, the residential area was far
from the green belt and the atheistic beauty was insufficient, so the residents tended to
choose the more convenient internal green space of the residential area. This has been
confirmed in some design investigations [69]. Designers found that there are also sites in
the green belt with little utilization by surrounding residents due to poor accessibility, even
after undergoing a recreational transformation. The existence of high-quality recreational
green space in the residential areas and the lack of convenient transportation to the green
bel might lead to the fact that the residential area in this study (Tables 5 and 7) does not
have a positive impact on recreational utilization. In response to the needs of residents
in these residential areas, the green belts have to be transformed into recreational areas
that are different from the recreational functions of the green spaces in the residential areas.
By developing river entertainment projects through the design of waterfronts [81], the
design of urban greenways provides broader sports and entertainment options [82]. These
are recreational functions that cannot be included in residential green space, but can be
realized in the green belt.
4.2. Recreational Transformation of the Ecological Green Belts
In the “Shanghai City Master Plan (2017–2035)”, the most important role of the
Shanghai green belt is still to effectively suppress the spread of the surrounding areas of
the central city and provide ecological benefits as an ecological corridor of the city. At the
same time, the plan mentions the indicator requirements for a 15-min walking distance to
reach a green space. In the context of the shortage of urban land, the green belt has great
potential to make up for the lack of green space within a 15-min walk for surrounding
residents. This means that some sections of the 98 km green belt need to increase parks,
greenways and other spaces for recreation and leisure to meet the recreational needs
of surrounding residents. The results of this study reinforce the belief that with urban
development and urban renewal, some sections of a green belt have a high potential
for recreational transformation, as shown in Figure 2 (a), (b) and (c). For sections with
recreational potential, in addition to ecological service functions, attention should be paidInt. J. Environ. Res. Public Health 2021, 18, 10244 14 of 18
to expanding the water body areas, optimizing the plant landscapes, and increasing the
construction of internal service facilities. For traffic conditions, bus and subway stations
should be optimized to increase traffic accessibility. For surrounding service facilities, it is
necessary to continue to strengthen the construction of cultural facilities and the catering
industry, and the construction of residential areas can be advocated to increase the potential
service population of a green belt. For sections with a low recreational potential, the current
ecological environment should continue to be maintained to better serve its ecological
service functions for a city.
With the rapid development of urbanization, attention must be paid to the health
and well-being of urban residents while controlling the scale of a city. Therefore, many
countries pay attention to urban ecological protection green belts. They transform the
traditional pure ecological protection green belts into partial recreational areas to deal with
the shortage of urban green recreational space under the background of urban renewal
in order to provide places for recreational activities, so that they can improve the health
of urban residents. London has developed the “All London Green Grid” to provide
opportunities for outdoor sports near urban areas [83]. The Green Belt Berlin puts the
design of recreational spaces in its most important position [49]. Beijing has transformed a
second green belt into a diverse recreational space [84]. The Pearl River Delta greenway
provides public infrastructure and entertainment space for urban areas [50]. Shanghai
has also incorporated the transformation into the planning direction of modern ecological
protection green space. The results of this research will guide the specific location of the
planned transformation and put forward new ideas for the recreational transformation of
ecological protection green belts in high-density cities, and contribute to the promotion of
social health.
5. Conclusions
Approaching 30 years since its establishment, the Shanghai green belt has achieved
great success in microclimate adaptation, air pollution purification and other ecological
effects [85]. With the development of the city of Shanghai and the increasing demand for
recreation from surrounding citizens, it is urgent to explore the comprehensive function
of the Shanghai green belt and transform some pure ecological forests for recreational
utilization. In this study, social media data was used to analyze the factors affecting
recreational utilization along the Shanghai green belt. Multiple regression models were
used to analyze the relationship between the recreational utilization of the green belt and
the influencing factors.
The regression model results showed that the number of cultural facilities, the areas
of the water bodies, the number of restaurants and the total external area had a significant
positive influence on the recreational utilization of the Green Belt. However, the number of
residential areas was negatively correlated with the number of subway stations. However,
after the verification of the segmentation models and the analysis of the literature, we
found that the number of residential areas and the accessibility of traffic are important
factors that affect the recreational utilization of the Green Belt. It is recommended that the
recreational transformation planning of a green belt should consider the characteristics of
the green belt and the completeness of the surrounding service facilities, as described in
the paragraphs with recreational potential in this study, for example, Figure 2 (a), (b) and
(c). On the purpose of ensuring the ecological effects already possessed by the green belt,
the plant community structure should be optimized, the seasons should be enriched and
recreational transformation should be carried out according to the needs of residents in the
surrounding residential areas. While in some areas with a small amount of green space, an
imperfect road traffic system and few potential populations, it is still better to maintain the
primary function of ecological protection of the green belt, playing the role of adjusting
temperature and humidity (alleviating the urban heat island effect) as well as purifying the
atmospheric environment to protect the natural environment of the city.Int. J. Environ. Res. Public Health 2021, 18, 10244 15 of 18
The result of this study provides a guideline for the sustainable development of urban
ecological protection green belts for urban renewal. It contributes to the research on the
compound functions of green belts and new green belt planning policies. The study pro-
poses planners incorporate the recreational transformation of urban ecological protection
green belts into planning considerations. The improvement of the recreational utilization of
the green belt will put forward requirements for the penetration of roads, the construction
of residential areas and the layout of cultural facilities in addition to other public service
facilities outside the green belt, and will guide planners to make reasonable plans for the
city. At the same time, the green belt after the recreational transformation will provide
urban residents with practically accessible urban green spaces and balance the physical and
psychological negative effects of urbanization on residents, contributing to the promotion
of social health. This study proved that it is feasible to analyze the recreational utilization
of a green belt through social media data, and it has important guiding significance for the
planning of a green belt, especially the recreational transformation with the background of
urban regeneration. However, there are still some limitations in this study. First, although
the Shanghai Statistical Yearbook showed that the basic data within the scope of the study
does not vary too much, it is not possible to separate the data by time ranging over 8 years,
due to the lack of that information from open source websites, and therefore the analysis
results would be slightly affected. Secondly, social media data has the advantages of a
large amount of data and a large time span. However, there will be restrictions on the
ages of the crowd members. Big data does not mean complete data. The Weibo sign-in
data that was used was actually limited by the type of demographic. A survey showed
that the recreational population in the green belt was mainly made up of middle-aged
and elderly people. Among this population, the elderly people did not use social media
frequently. When using big data, there will be a lack of relevant data, which will have a
certain impact on the final results. In future studies, social media data can be combined
with questionnaire surveys to make up for the lack of information on the use of green
belts by users of all ages that cannot be proven by social media data. Finally, the different
impacts of several influencers in the results of the three models in this study come from
the difference of development degree and geographical space along the green belt. These
differences will be further studied in future research.
Author Contributions: Conceptualization, Y.W. and D.C.; Methodology, W.Z. and D.C.; Formal
Analysis, W.Z.; Writing—Original Draft Preparation, W.Z.; Writing—Review and Editing, W.Z., Y.W.
and D.C.; Supervision, L.W. and X.T.; Funding Acquisition, Y.W. and D.C. All authors have read and
agreed to the published version of the manuscript.
Funding: This research was funded by the China National Natural Science Foundation (grant no.
32001361) and the General Program of Social Science Planning in Shanghai (grant no. 2020BCK011).
Institutional Review Board Statement: Not applicable.
Informed Consent Statement: Informed consent was obtained from all subjects involved in the study.
Data Availability Statement: The data presented in this study are available on request from the
corresponding author. The data are not publicly available due to privacy.
Acknowledgments: Special thanks to the teachers of Shanghai Jiao Tong University for their guidance
on the research.
Conflicts of Interest: The authors declare no conflict of interest.
References
1. Fábos, J.G. Greenway planning in the United States: Its origins and recent case studies. Landsc. Urban Plan. 2004, 68, 321–342.
[CrossRef]
2. Millward, H. Urban containment strategies: A case-study appraisal of plans and policies in Japanese, British, and Canadian cities.
Land Use Policy 2006, 23, 473–485. [CrossRef]
3. Longley, P.; Batty, M.; Shepherd, J.; Sadler, G. Do Green Belts Change the Shape of Urban Areas? A Preliminary Analysis of the
Settlement Geography of South East England. Reg. Stud. 1992, 26, 437–452. [CrossRef]You can also read