High-Resolution Motor State Detection in parkinson's Disease Using convolutional neural networks - mediaTUM
←
→
Page content transcription
If your browser does not render page correctly, please read the page content below
www.nature.com/scientificreports

            OPEN           High-Resolution Motor State
                           Detection in Parkinson’s Disease
                           Using Convolutional Neural
                           Networks
                           Franz M. J. Pfister1, Terry Taewoong Um 2, Daniel C. Pichler 3,4, Jann Goschenhofer1,
                           Kian Abedinpour3,4, Muriel Lang5, Satoshi Endo5, Andres O. Ceballos-Baumann3,4,
                           Sandra Hirche5, Bernd Bischl1, Dana Kulić2 & Urban M. Fietzek 3,6*
                           Patients with advanced Parkinson’s disease regularly experience unstable motor states. Objective
                           and reliable monitoring of these fluctuations is an unmet need. We used deep learning to classify
                           motion data from a single wrist-worn IMU sensor recording in unscripted environments. For validation
                           purposes, patients were accompanied by a movement disorder expert, and their motor state was
                           passively evaluated every minute. We acquired a dataset of 8,661 minutes of IMU data from 30
                           patients, with annotations about the motor state (OFF,ON, DYSKINETIC) based on MDS-UPDRS global
                           bradykinesia item and the AIMS upper limb dyskinesia item. Using a 1-minute window size as an input
                           for a convolutional neural network trained on data from a subset of patients, we achieved a three-class
                           balanced accuracy of 0.654 on data from previously unseen subjects. This corresponds to detecting the
                           OFF, ON, or DYSKINETIC motor state at a sensitivity/specificity of 0.64/0.89, 0.67/0.67 and 0.64/0.89,
                           respectively. On average, the model outputs were highly correlated with the annotation on a per subject
                           scale (r = 0.83/0.84; p < 0.0001), and sustained so for the highly resolved time windows of 1 minute
                           (r = 0.64/0.70; p < 0.0001). Thus, we demonstrate the feasibility of long-term motor-state detection in a
                           free-living setting with deep learning using motion data from a single IMU.

                           Parkinson’s disease (PD) is characterized by slowness of movement, decremented small amplitude, and loss of
                           movement spontaneity that are dramatically relieved when dopamine is orally restituted1. Due to the pharma-
                           cokinetic properties of the main medication, i.e. L-DOPA, motor fluctuations may occur and complicate the
                           symptomatic treatment2–4. Troughs in dopaminergic therapy are accompanied by parkinsonistic phases, so-called
                           OFF-states, while peaks can lead to phases with excessive (hyperkinetic) spontaneous movements, the dyskinetic
                           (DYS), or ON + motor state5. Ideally, patients with PD (PwP) experience neither OFF nor dyskinetic motor states
                           but maintain a state resembling normal motor function, i.e. the ON state.
                               These motor fluctuations are a major limiting factor for patients’ quality of life, especially in later disease
                           stages6. Consequently, therapeutic innovations have to demonstrate superiority in terms of their ability to reduce
                           motor fluctuations in order to be licensed by health agencies e.g.7–9. The current standard for assessing motor fluc-
                           tuations relies on patient self-reporting in the form of diaries (e.g.10), or expert ratings using standardized scales
                           (e.g.11, see12 for a review). Both approaches have their merits. But they are prone to rater bias and placebo effects,
                           and they can capture the motor state only with coarse temporal resolutions13,14. In the past, clinically relevant
                           features in motion data has been extracted to quantify motor states of PwP over long periods of time in free-living
                           setups15–17. Those approaches were not capable of a dynamic detection of typical motion patterns and failed,
                           for example, when the sensor data were confounded by underlying daily activities. While they achieved good
                           correlation to the motor state at a daily scale, they erred at finer temporal resolution18. However, a high temporal

                           1
                            Department of Computer Science, Ludwig Maximilians University Munich, Munich, Germany. 2Department
                           of Electrical and Computer Engineering, University of Waterloo, Waterloo, Canada. 3Department of Neurology
                           and Clinical Neurophysiology, Schön Klinik München Schwabing, Munich, Germany. 4Department of Neurology,
                           Technical University of Munich, Munich, Germany. 5Chair of Information-Oriented Control, Department of Electrical
                           and Computer Engineering, Technical University of Munich, Munich, Germany. 6Department of Neurology, Ludwig
                           Maximilians University Munich, Munich, Germany. *email: urban.fietzek@med.uni-muenchen.de

Scientific Reports |   (2020) 10:5860 | https://doi.org/10.1038/s41598-020-61789-3                                                             1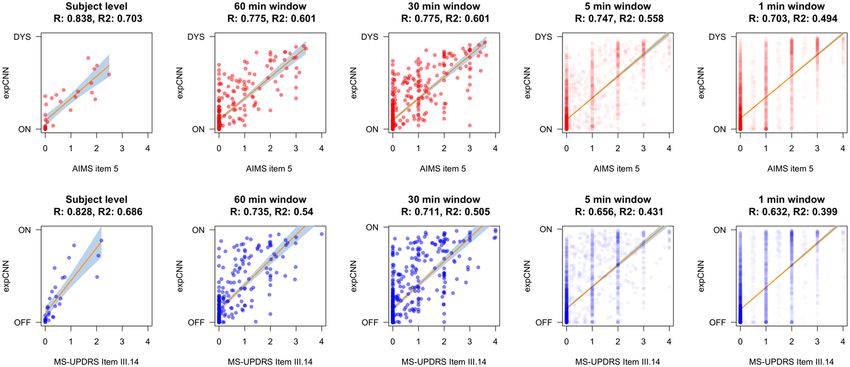
www.nature.com/scientificreports/                                                                                      www.nature.com/scientificreports

               parameter                                                  full cohort              HY stage 2               HY stage 3               HY stage 4
                                                                          N or mean ± SD (range)
               Gender (male/female)                                       20/10                    9/2                      9/7                      2/1
               Age (years)                                                67.1 ± 10.2 (40–83)      66.1 ± 8.1 (47–73)       69.5 ± 11.0 (40–83)      58.0 ± 9.2 (48–66)
               Disease duration (years)                                   11.0 ± 5.1 (1–21)        9.9 ± 6.0 (1–18)         11.2 ± 4.8 (2–21)        14.3 ± 2.3 (13–17)
               Levodopa equivalent dose$                                  1109 ± 785 (90–3754)     1172 ± 1113 (90–3754)    1053 ± 521 (120–2435)    1181 ± 806 (675–2110)
               MDS-UPDRS III (ON)                                         21.6 ± 15.3 (2–57)       16.9 ± 15.8 (2–57)       25.4 ± 15.6 (5–54)       19.0 ± 7.9 (13–28)
               AIMS
                                                                          2.1 ± 2.4 (0–7)          1.2 ± 1.8 (0–4.5)        2.5 ± 2.7 (0–7)          2.9 ± 2.7 (1.25–6.0)
               (sum items 1–7)
               Montreal Cognitive Assessment                              25.7 ± 2.8 (18–30)       26.1 ± 1.9 (24–30)       24.9 ± 3.3 (18–29)       28.0 ± 1.7 (27–30)
               Body Mass Index (kg/m2)                                    25.2 ± 4.8 (12.9–35.4)   26.9 ± 5.0 (21.6–35.4)   25.2 ± 3.9 (21.3–35.1)   19.4 ± 5.8 (12.9–23.7)
               Duration of motion data recording (hours)                  7.5 ± 3.9 (0.4–13.4)     6.6 ± 4.0 (0.4–12.5)     8.3 ± 3.8 (2.8–13.4)     6.5 ± 5.1 (2.6–12.3)
               Additional therapy, i.e. deep brain stimulation (DBS) or   DBS = 4                                           DBS = 1
                                                                                                   DBS = 1                                           DBS = 2
               continuous subcutaneous apomorphine infusion (CSAI)        CSAI = 2                                          CSAI = 2

                                 Table 1. Clinical descriptors of the full cohort and according to the Hoehn & Yahr disease stages two to
                                 four. Mean ± standard deviation is given with the range in brackets. $Levodopa equivalent dose is calculated
                                 according to ref. 68. Abbreviations: AIMS, abnormal involuntary movement scale; UPDRS, unified PD rating
                                 scale; DBS, deep brain stimulation; CSAI, continuous subcutaneous apomorphine infusion.

                                 granularity is crucial for successful and reliable adaptation of drug therapy regimes used in clinical practice, and
                                 will ultimately be essential to steer continuous closed-loop therapies such as medication pumps or deep brain
                                 stimulation in the future19. Despite significant technological advances in the field, there is no commonly accepted
                                 standard for objectively monitoring the motor state of PwP20,21. Most research on this topic has been undertaken
                                 under laboratory conditions, and only a few researchers have addressed the measurement of motor fluctuations
                                 in a free-living setting, e.g.16,17,22–29. While relevant progress has been shown for sensor technologies and data
                                 analyses, the critical issue of validation has not been convincingly answered30–32.
                                     Recent developments in machine learning techniques (ML) such as convolutional neural networks (CNN),
                                 a class of deep feed-forward artificial neural networks33 have helped to analyze large-scale datasets for sup-
                                 porting clinical applications, e.g.34,35. In particular, it has been demonstrated that deep learning approaches are
                                 capable of analyzing motion data derived from sensors worn by PwP in free-living situations25,36. While high
                                 computational requirements for training very complex models had been a limiting factor in the past, the acces-
                                 sibility of high-performance computing has increasingly enabled efficient processing and interpretation of large
                                 datasets37–39. As most biomedical data is highly unstructured, high-quality annotations are vital for developing
                                 machine learning models; one of the major issues impacting ML applications in the clinical domain29,40. With
                                 additional practical, ethical, and scientific challenges including the sparse availability of annotated motion data,
                                 the lack of adequate numbers of high-quality annotations, or the non-availability of high computational power
                                 for training, ML technique has not been fully utilized for evaluating motor fluctuations of PwP in complex,
                                 free-living settings (for reviews, see e.g.20,21,41). Thus, we address practical challenges in free-living monitoring
                                 of the PD motor state on a larger scale, and show how ML techniques can be adapted to assist continuous mon-
                                 itoring of the motor state of PwP. In the present study, we used a deep learning approach, i.e. a CNN, to classify
                                 motion data from a single wrist-worn IMU sensor in a non-test-based setting. The patients were accompanied
                                 (“shadowed”) by a movement disorder expert and their motor state was passively categorized as OFF, ON, or DYS
                                 every minute. Thereby, we acquired a dataset of 8,661 minutes of annotated, cleaned and preprocessed sensor data
                                 from 30 PwP. This dataset was then trained and tested with a leave-one-subject-out (LOSO) approach to validate
                                 the CNN model’s performance. The results were compared against other models over various naturally observed
                                 ambient activities of the participants to demonstrate the robustness of the CNN performance.

                                 Results
                                 Cohort, clinical data and sensor data.           The study cohort consisted of 30 patients: 20 male, 10 female.
                                 On average, the patients were 67.1 ± 10.2 years old (mean ± SD). The mean duration since the PD diagnosis was
                                 11.0 ± 5.1 years. The mean motor score according to part III of MDS-UPDRS was 21.6 ± 15.3 (assessed in ON).
                                 The mean AIMS (sum of items 1–7) was 2.1 ± 2.4. For cohort characteristics, see Table 1. In total, 11,567 minutes
                                 of 3D-accelerometer data were collected, and 10,977 minutes of them are annotated to the expert rater’s assess-
                                 ment. After the pre-processing (removing data with little to no acceleration measurement as described in the
                                 Methods section), 2,316 min of data were discarded, and 8,661 min were used for further analysis.

                                 Reliability of the expert rater. As all clinical evaluations were performed by one expert rater, we set up a
                                 separate experiment to verify the reliability of this rater (see Assessment of rater reliability). Intraclass correlation
                                 statistics of the committee vote label and the rater revealed a high intraclass correlation of 0.94 (95% confidence
                                 0.91–0.95; F = 30.6; p < 0.0005), indicating a high consistency of our expert.

                                 Results from the CNN model and comparison to other machine learning models. The data aug-
                                 mentation (see Preprocessing of data)42 resulted in 96,342 samples of 1-minute sensor-data that had a distri-
                                 bution of OFF: 26.8%, ON: 41.4%, and DYS:31.8%. Our CNN model classified the three motor states of PwP
                                 at a three-class accuracy of 0.654, and a Cohen’s Kappa of 0.47, pointing to a moderate agreement43. Detection

Scientific Reports |         (2020) 10:5860 | https://doi.org/10.1038/s41598-020-61789-3                                                                                      2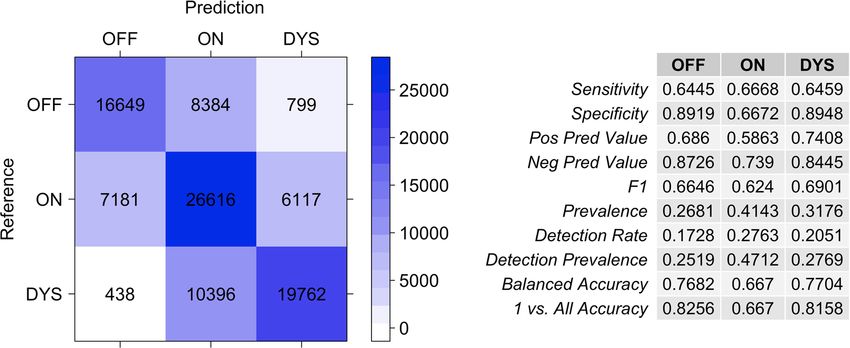
www.nature.com/scientificreports/                                                                     www.nature.com/scientificreports

                           Figure 1. Confusion matrix of the clinical annotation (Reference) and the model prediction (Prediction), and
                           clinimetric results of the CNN prediction for the full (augmented) dataset. The numbers in the matrix indicate
                           corresponding observations.

                            Methodology         SVM (linear)   kNN (n = 10)   Random Forest   MLP      CNN
                            Balanced Accuracy   50.28          50.41          53.73           54.02    67.39

                           Table 2. Comparison of the machine learning (ML) methods with a 4-fold cross-validation. Note that these
                           performance measures were obtained from non-augmented data using 4-fold cross validation. Abbreviations: SVM,
                           support vector machine; kNN, k-nearest neighbor; MLP, multi-layer perceptron; CNN, convoluted neural network.

                           prevalence had a similar distribution to the true prevalence values with OFF: 25.2%, ON: 47.1%, and DYS: 27.7%,
                           slightly overestimating the ON state. OFF and DYS were detected with better specificity compared to the ON
                           state, with high negative predictive values (OFF: 87.2%; DYS: 84.5%). The accuracy balanced over the class dis-
                           tributions was highest for DYS with 0.770, compared to OFF with 0.768, and ON with 0.667. Other clinimetric
                           results are shown in Fig. 1.
                               For comparisons, we implemented a SVM (support vector machine), kNN (k-nearest neighbour), Random
                           Forest, and a MLP (multilayer perceptron) model. These models yielded consistently inferior results compared
                           to the proposed CNN approach. These results illustrate the predictive power of the CNN-based approach in our
                           particular dataset. See Table 2 for the detailed results.

                           Temporal aggregation of probabilistic CNN output allows visualization of the motor state. On
                           a subject level, the aggregated clinical expert rating and the softmax scores (expCNN) were on average at a very
                           similar level with 0.98 vs. 1.04, respectively. For easy comparison per patient, we plotted the class distribution
                           plots of the expert ratings and the CNN predictions in an overview that can be viewed in the Supplemental
                           Material Fig. A1. We illustrate the long-term recordings and the outcome of the algorithm for four exemplary
                           PwP that have different clinical phenomenologies, but are equally well recognized by the algorithm (see Fig. 2
                           for details). We chose these specific patients to demonstrate the ability of our approach to precisely detect fast
                           changes of the motor state.
                               Figure 3 illustrates the changes in correlation between our model predictions and the clinical scores over
                           different temporal resolutions. When the expCNN was obtained across the entire dataset per patient (i.e. a sin-
                           gle value representing the patient’s motor state), we observe high correlations with the motor item scores of the
                           rater, i.e. AIMS item 5 for the dyskinetic state and MDS-UPDRS item 3.14 for bradykinetic states (Rbrady = 0.828,
                           p < 0.001; Rdys = 0.838, p < 0.001). The correlation is somewhat smaller, but preserved for time windows of
                           one hour (Rbrady = 0.735, p < 0.001; Rdys = 0.775, p < 0.001), 30 minutes (Rbrady = 0.711, p < 0.001; Rdys = 0.775,
                           p < 0.001), 5 minutes (Rbrady = 0.656, p < 0.001; Rdys = 0.747, p < 0.001), and also for 1-minute time windows
                           (Rbrady = 0.632, p < 0.001; Rdys = 0.703, p < 0.001).

                           The model achieves similar performance for various activities.                  Our model is trained irrespective
                           of background daily-life activities, and the activity annotation is not used for model training or prediction. We
                           evaluated the performance of the CNN over the background activity classes documented by the expert rater.
                           While being observed for their motor states, the patients spent 58% sitting, 18.5% walking, 8.4% lying, 5.3%
                           standing, 1.2% performing motor examination tests, and 3.4% of their recording time pursuing other activities.
                           In 5.3% of the time, the activity class was not documented. The information on patients’ activities is visualized
                           in Supplementary Material Fig. A2. The evaluation indicated that the CNN performance was robust against the
                           background activities of the patients as no substantial performance differences were observed between these
                           activity classes. The CNN’s performance measures accuracy and balanced accuracy during the seven classes of
                           activities are shown in Table 3.

Scientific Reports |   (2020) 10:5860 | https://doi.org/10.1038/s41598-020-61789-3                                                          3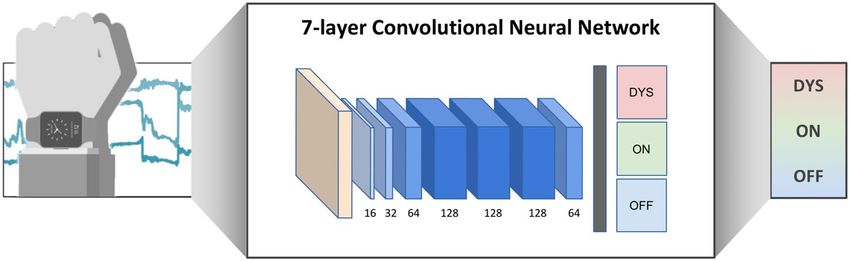
www.nature.com/scientificreports/ www.nature.com/scientificreports
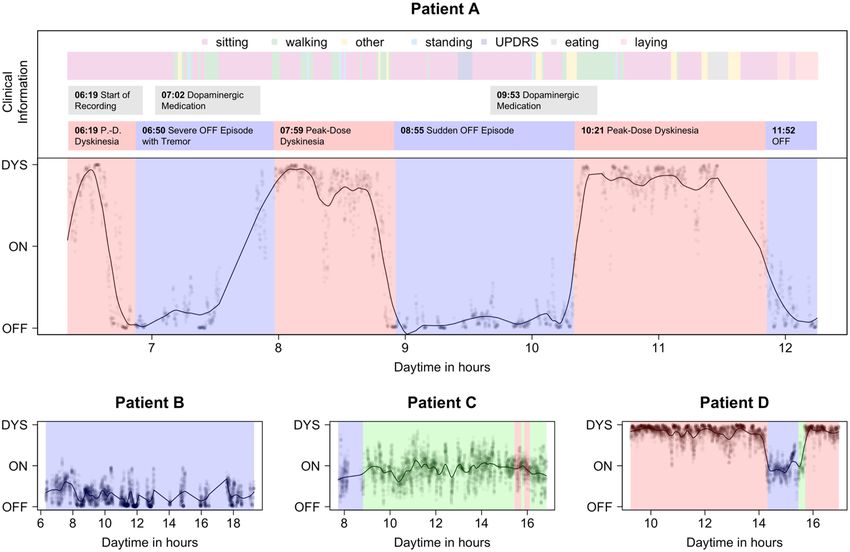
Figure 2. Motor state profiles of four typical patients (A–D). The observed motor state annotations by the
expert rater is coded in three background colors along the x-axis; blue, OFF; green, ON; red, DYS). Unsmoothed
expCNN point predictions (transparent circles) and LOESS smoothed predicted day curves (drawn line)
predict the highly resoluted motor state. In the top section of part A, clinical information on the free-living
activity is given that demonstrates the independence of the predicted motor state curve from the concurrent
motor activity. Patient A is a severely fluctuating patient who spends almost no time in the ON condition, but
experiences several sudden OFF or DYS phases during the recording. The expert evaluated A with an average
of 1.36 ± 0.54. Mean expCNN was similar with 1.02 ± 0.81. The high SD identifies A as a severe fluctuator.
Patient B is a predominantly bradykinetic patient with no ON time and no dyskinesia. B was admitted to the
hospital a couple of weeks after DBS surgery and recorded before readjustment of the stimulation parameters.
The expert evaluated B with an average of 0.48 ± 0.20. Mean expCNN was similar with 0.28 ± 0.22. Note that
there are missing values in the predictions as the sensor signal was not recorded continuously. Patient C is a
patient who is responding well to treatment. Except for the typical OFF in the morning, C spends almost all
the time in the ON state. The rater evaluated C with an average of 0.99 ± 0.11. Mean expCNN was similar with
0.91 ± 0.29. The mean around 1 (=ON) and the low SD describe a patient with minor fluctuations mainly in ON
state. Patient D is a dyskinetic patient with one OFF period in the afternoon. The expert evaluated him with an
average of 1.47 ± 0.34. Mean expCNN was similar with 1.66 ± 0.37. The curves from all patients are available as
supplementary material.
Discussion
Our research shows that expert-level information about the motor state of PwP may be obtained from a single
wrist sensor in free-living situations using deep learning autonomously at high temporal resolution. Probabilistic
information and smoothing procedures demonstrate that the clinically relevant trends and the transitions from
one motor state to the other are well recognized in as little as a one-minute time windows. Furthermore, we show
that our method is capable of detecting the individual motor state irrespective of activities undertaken by the PwP
in a free-living, non-controlled setting and generalizes to the PD population as we tested on data from previously
unseen patients.
The technology empowered objectivity of this approach potentially opens new pathways for monitoring the
motor state of patients with PD over the course of a day, and thus, for evaluating and developing therapies. The
objective sensor-based evaluation should be more robust against measurement bias and placebo effects com-
pared to the traditional methods such as, i.e. clinical observation by physicians or patient reported diaries. We
achieved this by making use of deep learning to classify highly granular accelerometer data labeled with clinical
information. The high dataset size requirements are met through a supervised data collection approach by which
we were able to generate informative annotations in one-minute intervals. To our knowledge, collecting expert
annotations on a one-minute basis has not been reported to date at such a large scale.
It should be kept in mind, that patients may experience their OFF states not only in terms of reduced motor
function, but also in the form of pain, panic attacks, or other non-motor features44. We focused on the motor
function, as we used a motion sensor for recordings. Other research might replicate our findings using different
data types or forms of data acquisition, such as galvanic skin response or heart rate45. However, for standard clini-
cal evaluation, motion analysis is currently considered the state of the art for measuring the quality of treatment46,
and to determine the motor state.
Scientific Reports | (2020) 10:5860 | https://doi.org/10.1038/s41598-020-61789-3 4www.nature.com/scientificreports/ www.nature.com/scientificreports
Figure 3. Correlations of the probabilistic output of the CNN with the bradykinesia and dyskinesia items that
were labeled minutely by the expert, but modelled for various time windows. Linear correlation is depicted with
95% confidence interval (grey shading).
Activity (%) Sitting Walking Lying Standing Testing Other Unknown
Prevalence 58.0 18.5 8.4 5.3 1.2 3.4 5.3
Balanced Accuracy 74.47 76.94 70.72 69.31 72.01 64.38 61.85
Table 3. Prevalence and CNN performances across seven classes of background activities.
A number of automated assessment techniques have been proposed to remotely assess motor phenomena
in PwP. As recently as 2004, the detection of motor state information from body-worn sensors was considered
impossible16. The reporting group had evaluated PwP over 1.5 hours and demonstrated limited sensitivity and
specificity for tremor, bradykinesia and dyskinesia detection in comparison to self-assessment.
In this research with free-living recordings, we overcame a number of obstacles encountered by other groups.
Previous work considered laboratory test setting, and evaluated patients over the course of three hours by six
accelerometer sensors worn on six different body parts to distinguish ON from OFF17. They used statistical fea-
tures of the motion data as input variables for a neural network, and reported sensitivity and specificity near 0.97.
However, by essentially reducing the motor state detection to a binary classification, their results are not repre-
sentative of the phenomenology of fluctuating patients. Moreover, they suggest a simple threshold to differentiate
OFF from ON, that fails to be a generalizable principle. In contrast, our work shows that three motor states can
be reliably differentiated.
Similarly, previous work assessed motor fluctuations from a motion sensor at the waist using an SVM for clas-
sification, and compared against 30-minute patient diaries as the ground truth27. Although the average specificity
and sensitivity was above 0.9 for 10 min segments, these results cannot easily be transferred into clinical practice,
as the algorithm did not discern ON from dyskinetic motor behavior. In addition, the use of patient reported
measures for standardization is debatable, as patients are not trained to evaluate motor symptoms of PD in a
systematic fashion. Moreover, there is a consensus that the motor state does not follow a 30 minute time structure,
so that entries is diaries are inherently imprecise, and are a debatable source to provide valid information for
the training of an algorithm. In contrast, our approach provides the means to model various time aggregations,
allowing both a coarse and a granular perspective on PwP.
Another source of information regarding the motor state might be obtained from the frequency domain anal-
ysis of movement data, e.g. mean spectral power. This approach has been used to algorithmically describe brad-
ykinesia and dyskinesia from a wrist sensor15,47. Although convincing group effects were demonstrated, such an
approach failed to reliably provide individual predictions, and did not give information on the precise recognition
of the motor state18. To our knowledge there is not data published using such an approach that has shown to be
resistant to artificial intrusions of movement sensor recordings such as repetitive intense exercising.
Detection of motor states is highly dependent on how the task is defined. Another research group evaluated
PwP over one week by patient-diary annotated 5,500 h of sensor data from bilateral wrist-worn sensors. Using
a set of 91 features per minute recording, they trained a sequence of Restricted Boltzmann Machines (RBM) to
classify the data in the four categories of sleep, OFF; ON; DYS24. They report promising specificity results for a
clinical setting (0.99) and a home setting (0.93), but insufficient sensitivity below 0.6 for ON/OFF detection25.
One might argue that framing the task of motor state detection to include sleep, that is comparatively easy to
classify, leads to an overestimation of accuracy. Consequently these results are difficult to reproduce when sleep
is part of the classification.
Scientific Reports | (2020) 10:5860 | https://doi.org/10.1038/s41598-020-61789-3 5www.nature.com/scientificreports/ www.nature.com/scientificreports
Our study was performed at one clinical center with a relatively small cohort of patients. While this research
design clearly represents a limitation, it concomitantly can be interpreted as an asset.
Concerning the limitations, the small sample could be prone to investigator bias or misinterpretation, or
not be representative of the large variety of the PD phenomenology or PD stages. Other sources for bias include
sampling bias (e.g. rater chooses to report the motor state for a 30 minute interval from few minutes of obser-
vation, (ii) selection bias (e.g. rater describes motor state only from one motor symptom), (iii) performance
bias (i.e. patient behaves better than usually) or (iv) measurement bias, i.e. pre-knowledge of outcome modifies
measurement.
For these reasons, we have restricted the task to a very basic evaluation of three classes, that is expected even
from the patients themselves. We evaluated the competency of our main rater by comparing his evaluation to a com-
mittee with average experience in Parkinson research of more than ten years, and found a high congruency. Future
research might further improve the quality of the input to the neural networks with inclusion of aggregated voting,
or using surrogate markers of bradykinesia such as the ß-band from local field recordings from the basal ganglia.
Concerning the asset, the study demonstrates the power of deep learning to recognize clinically valuable infor-
mation in ubiquitously available data even in small samples42. Our system achieved an overall accuracy, balanced
for class inhomogenities, of 65% for one-minute measurements. As all previous approaches only looked at 30 or
10 minute intervals, this accuracy stands out, and shows a promising path towards a large-scale deployment of
real-life monitoring of PwP.
A major concern of motor evaluation for PwP is the choice of the patient activity during evaluation. While
specific test protocols can provide for the controlled assessments of a defined function, e.g. finger taps and brad-
ykinesia23,48, these results may only give a surrogate marker of the disease and may not be representative of the
movement capacity of the patient49. On the other hand, to refrain from test setups, by relying on free-living data
only, one might introduce too much noise in the dataset, thereby making any meaningful interpretation and
comparison of the observations impossible.
Here, we deliberately used a free-living setting to achieve maximum ease and applicability of the approach
to patients’ everyday lives. We used a commonly available smartwatch that is not licensed for a medical use and
performed a limited set of data quality checks, which demonstrated reasonable data quality. Occasionally, we
experienced breakdowns of the Bluetooth connection that led to recording pauses and subsequent data loss. It
is conceivable that the use of more accurate and reliable devices with other sensors might further improve the
outcome of our approach, but this will need confirmation in fresh datasets.
Potential sources of noise have to be discussed as well. While the sensor and rater have been evaluated for
their reliability, further validation studies need to confirm our results. Also, our setup might introduce bias, as
we recorded free-living data in the constrained environment of a hospital. In addition, our approach needs to be
validated in a larger cohort to address the observed high inter-patient variability and potential ethnic differences
between study participant groups.
Our CNN modeled the PD motor states as a 3-class categorical concept (OFF/ON/DYS) over a set of seg-
mented time windows which are independent of each other. In order to account for the fact that patients undergo
a gradual transition of classes over time, we treated the CNN prediction for each class as a confidence vector so
the LOSO smoothing of aggregated softmax outputs across time could represent a continuous motor state tran-
sition. It has to be kept in mind that the confidence of the predictions is not an equivalent measure to the factual
severity of the motor state but adherence to the trained model. Thus, it is adequate to interpret expCNN as a
relative severity marker for the motor state rather than the absolute severity. Future research should be directed
to achieve higher resolutions for severity grading, e.g. by using regression approaches. Also, taking temporal
dependencies of the input into account, e.g. by adding LSTM (Long-Short-Term-Memory) layers to the deep
learning models, has a potential to further improve our approach.
One important characteristic of a behavior quantification algorithm should be the capacity to describe the
behavior repertoire in its totality, including behaviors not anticipated by the researchers50. As deep learning may
be difficult to interpret, and sometimes referred to as a “black box”, the employment of visualization techniques
for the convolutional filters should be investigated in the future.
We believe that the approach outlined in this paper will evolve rapidly with increasing availability of sensors
and data storage capacity. For this, data security issues have to be addressed adequately. Furthermore, advances in
high resolution sensor technology will demand the creation and validation of new clinical scales to more narrowly
define and quantify the motor state regarding the severity and the temporal resolution.
Methods
Ethical vote and patient consent. This project was approved by the ethical board of the Technical
University of Munich (TUM) (No. 234/16S) on June 30, 2016. All patients agreed via a written informed consent
form to the protocol and to the recording and analyses of their anonymized data. The authors confirm that all
experiments were performed in accordance with relevant guidelines and regulations.
Clinical setup. Patient data was collected at the Schön Klinik München Schwabing from patients diagnosed
with PD according to UK Brain Bank Criteria51 with an established history of motor fluctuations. The patient cohort
is described by MDS-UPDRS motor score (part III)52, abnormal involuntary movement scale sum of items 1–7
(AIMS)53, Hoehn & Yahr (HY) classification54, Montreal Cognitive Assessment (MoCA)55, and body mass index
during medication ON. One patient normally used a walking aid, that was not used during recording of his data.
For motor state evaluation we acquired motion data from PwP in free-living conditions, where the PwP were
continuously accompanied by a movement disorder expert (D.P.) to enable large-scale annotation collection.
Motion data was recorded from a sensor worn at the wrist of the more affected side. In this setting the expert
provided one-minute annotations of the motor state: OFF (i.e. bradykinetic state), ON, or DYS (i.e. dyskinetic
Scientific Reports | (2020) 10:5860 | https://doi.org/10.1038/s41598-020-61789-3 6www.nature.com/scientificreports/ www.nature.com/scientificreports
state)56, the severity of global bradykinesia (according MDS-UPDRS item 3.14), and of upper limb dyskinesia
(according AIMS item 5). The expert only rated choreatic dyskinesias to provide annotations, as this form typ-
ically occurs during the ON motor state, while dystonic dyskinesia typically confound the OFF motor state.
Therefore, if choreatic dyskinesias were observed the patient was annotated to be in a DYS motor state. For sta-
tistical comparison with the model’s predictions, the expert’s ratings for OFF, ON and DYS were considered as 0,
1 and 2, respectively. The expert also documented the current activity of the patient, i.e. sitting, lying, walking,
standing, sleeping, motor testing or others. The data was collected in a continuous manner, except for short breaks
due to technical reasons (such as low battery levels of the sensor) or bathroom activities of the PwP.
Assessment of rater reliability. We acquired a second dataset consisting of 132 video segments from a
different cohort of 70 PwP to allow for the evaluation of the reliability of the expert rater. Three additional move-
ment disorder specialists and the expert rater all independently rated randomly presented short video segments
according to the same classification methodology as described above. The annotations acquired by the three
specialists were aggregated as committee vote labels using the mode and compared with the annotation given by
the expert rater.
Technical specifications of the sensor. The participants wore the Microsoft Band 2 (Microsoft, Redmond,
WA, U.S.A.) on their wrists, as recent research identified this location best reflecting most levodopa induced var-
iability of motor symptoms57. The band contains a 6-axis inertial module (LSM6D series by STMicroelectronics,
Geneva, Switzerland) including a 3D-accelerometer, 3D-gyroscope, and a Bluetooth 4.0 communication module.
The accelerometer records movements up to +/−8 G with a sensitivity of 0.244 mG/least significant byte and a
sampling rate of approx. 62.5 Hz.
Preprocessing of data. The 11,567 minutes of collected accelerometer data was preprocessed to classify the
motor state. As the raw data includes sensor noise, we mildly filtered by applying a two-directional Butterworth
filter. The lower bound of the cut-off frequency was set to 0.1 Hz to filter out sensor drift, and the upper bound was
set to 20 Hz to filter out high frequency noise. The sensor data was resampled to 60 Hz to create regular intervals
between samples. Accelerometer data with no clinical annotations (590 min) and ones with little to no signals (a
sum of variance of x, y, z accelerations less than 0.01, 2316 min) were removed, resulting in a dataset of 8,661 min-
utes. Note that only the three Cartesian dimensions of acceleration are used because PD motor states are believed
to be independent from the pose of the wrist. As a result, each one-minute window of data is a 3600 * 3 matrix,
that will be regarded as a rectangular image input for the CNN. After resampling and cleaning of the data, the
data was augmented by rotation and sliding-window-based data augmentation methods42. Rotational augmen-
tation emulates different arm poses, which may be present independently of the PD motor states, by applying a
random rotation to each 1-min windowed data. On the other hand, sliding-window-based augmentation extracts
multiple 1-min windows from consecutive two 1-min windows by sliding the window with a stride of 5 seconds.
Data augmentation increased the size of the data from 8,661 to 96,342 samples. In cases where the sliding win-
dow was located in the middle of two differently annotated 1-min windows, we used float annotation after linear
interpolation.
Comparison to other classification methods. We implemented a set of classical machine learning
methods including SVM (support vector machine), kNN (k-nearest neighbor), Random Forest, and MLP (multi-
layer perceptron) using Scikit-learn and Keras to serve as comparative models to our approach. The performance
of these models was evaluated using a 4-patient-group cross-validation procedure where the dataset was divided
into four similar-sized patient groups. Note that all methods are applied to the raw data without any feature
extraction steps.
Architecture, development and tuning of the CNN. CNNs were originally developed for processing
2D images (e.g.33,58). However, CNNs have also shown powerful performance in non-image data by treating
them as 2D images, e.g. for Natural Language Processing (NLP)59, or wearable-sensor data60. In this research, an
ensemble CNN approach was used for classifying the three motor states. Each CNN in the ensemble CNN con-
sists of 7 convolutional layers with 64-128-256-512-1024-1024-1024 feature maps. Each layer again consists of
convolution (Conv), batch-normalization (BN), and rectification (ReLU) sublayers. The architecture of the CNN
is depicted in Fig. 4.
Each CNN in the ensemble was trained with a 15-randomly selected subset of patients, to handle differing
motor state distributions between patients. The input window size included one-minute sequences of sensor data
with a sliding window of five-second length. The sensor data from each one-minute snippet was transformed to
a three-channel RGB image where each sensor corresponded to one channel. For each sensor stream, 3600 data
points were depicted as the sensors operated with a frequency of 60 Hz. Those images were fed as inputs to the
CNN61. For a more detailed description of the transformation method, see36,62.
Postprocessing of CNN output. The three output nodes of the CNN normalized by the softmax function
are considered as probabilities of the output belonging to each of the respective three classes OFF, ON, DYS. Thus,
in order to visualize the CNN output, two mathematical operations were performed on the CNN output:
(i) Aggregation of softmax output to compute expCNN ranging from 0 (OFF) via 1 (ON) up to 2 (DYS):
expCNN = 0 ∗ softmax(0) + 1 ∗ softmax(1) + 2 ∗ softmax(2)
(ii) Visualization of expCNN by means of LOESS smoothing63.
Scientific Reports | (2020) 10:5860 | https://doi.org/10.1038/s41598-020-61789-3 7www.nature.com/scientificreports/ www.nature.com/scientificreports
Figure 4. Setup of IMU sensor data acquisition and CNN architecture. The CNN consists of seven
convolutional blocks followed by two fully-connected layers. Each block consists of a convolution, batch-
normalization66 and ReLU67 layer. As we progress through the convolutional blocks, the size of the input vector
decreases from 3600 * 3 to 13 * 1, whereas the number of channels increases from 1 to 64. Finally, the 13 * 1 * 64
feature maps are flattened to an 832 * 1 vector and classified by two fully-connected layers which have 512 and 3
nodes, respectively. (Figure drawn by Dr. Pfister).
It should be noted that the magnitude of expCNN does not directly reflect motor symptom severity, but a
probability of belonging to the three classes: OFF, ON, DYS.
Comparison of rater and CNN output. We employ a LOSO cross validation (CV) strategy which is the
classical exhaustive CV procedure for small datasets64. This CV strategy evaluates how the trained model gen-
eralizes to data from participants not seen during training. That is, in each fold, one participant contributes all
observations of the test data, while the CNN is trained with data from the remaining participants. This strategy
provides a more realistic test of the system performance, and is more similar to the deployment where we would
have little opportunity to create a training dataset for every new user65. As the task was a multi-class classification
problem, a 1-vs-all strategy was used for the calculation of the clinimetric results shown in Fig. 2. For visualiza-
tion of the variation in time, the expCNN output is plotted with the actual motor state derived from the expert
rater’s ground truth three-class annotations (see Fig. 2 for examples).
For demonstration of criterion validity, the rater’s mean item values for bradykinesia and dyskinesia were
correlated with expCNN (0 to 1 for bradykinesia, 1 to 2 for dyskinesia) as has been done in related research15.
Also see Fig. 3. To determine the reliability of our approach across various temporal granularity, we used time
windows of 1 min, 5 min, 30 min, and 1 hour – in addition, we also aggregated on the whole recording per subject
(daily window).
Patients’ view on experiment. To determine the patients’ acceptance of the experiment, a short survey
with four questions was conducted after the experiment. The results are presented in the Supplementary Material
Fig. A3.
Descriptive and computational statistics. Group comparisons of clinical characteristics are performed
using a one-way ANOVA. Correlations are calculated in terms of Pearson’s correlation coefficients with 95% con-
fidence limits for mean and single predictions. Interrater reliability of the expert was ascertained with intraclass
correlation statistics (ICC 2,1). Alpha was 5%. Statistical analyses and machine learning were performed with
R, version 3.4.2 (R Project for Statistical Computing) and Python, version 3.5 (Python Software Foundation)
employing Keras and Tensorflow for its backend. Deep learning models were trained using a GPU, GTX 1080ti
(12GB) by NVIDIA, Santa Clara, USA.
Data availability
The patients of this proof-of-concept study, in accordance to National and European Data protection laws, did not
consent to publication of their sensor data in open repositories. The data that support the findings of this study are
available from the corresponding author, U.M.F., upon reasonable request.
Code availability
We made the code for the CNN publicly available. The repository can be found here. https://github.com/terryum/
Deep_Ensemble_CNN_for_Imbalance_Labels. In order to run the code, we provide a modified dataset based on
MNIST (http://yann.lecun.com/exdb/mnist/).
Received: 13 August 2018; Accepted: 23 December 2019;
Published: xx xx xxxx
References
1. Postuma, R. B. et al. MDS clinical diagnostic criteria for Parkinson’s disease. Mov. Disord. Off. J. Mov. Disord. Soc. 30, 1591–1601
(2015).
2. Marsden, C. D. & Parkes, J. D. ‘On-off ’ effects in patients with Parkinson’s disease on chronic levodopa therapy. Lancet 1, 292–296
(1976).
Scientific Reports | (2020) 10:5860 | https://doi.org/10.1038/s41598-020-61789-3 8www.nature.com/scientificreports/ www.nature.com/scientificreports
3. Obeso, J. A. et al. Motor complications associated with chronic levodopa therapy in Parkinson’s disease. Neurology 39, 11–9 (1989).
4. LeWitt, P. A. & Fahn, S. Levodopa therapy for Parkinson disease: A look backward and forward. Neurology 86, S3–S12 (2016).
5. Luquin, M. R., Scipioni, O., Vaamonde, J., Gershanik, O. & Obeso, J. A. Levodopa-induced dyskinesias in Parkinson’s disease:
clinical and pharmacological classification. Mov. Disord. 7, 117–124 (1992).
6. Hechtner, M. C. et al. Quality of life in Parkinson’s disease patients with motor fluctuations and dyskinesias in five European
countries. Parkinsonism Relat. Disord. 20, 969–974 (2014).
7. Olanow, C. W. et al. Continuous intrajejunal infusion of levodopa-carbidopa intestinal gel for patients with advanced Parkinson’s
disease: a randomised, controlled, double-blind, double-dummy study. Lancet Neurol. 13, 141–149 (2014).
8. Ferreira, J. J. et al. Opicapone as an adjunct to levodopa in patients with Parkinson’s disease and end-of-dose motor fluctuations: a
randomised, double-blind, controlled trial. Lancet Neurol., https://doi.org/10.1016/S1474-4422(15)00336-1 (2015)
9. Elmer, L. W. et al. Pooled Analyses of Phase III Studies of ADS-5102 (Amantadine) Extended-Release Capsules for Dyskinesia in
Parkinson’s Disease. CNS Drugs., https://doi.org/10.1007/s40263-018-0498-4 (2018)
10. Hauser, R. A. et al. A home diary to assess functional status in patients with Parkinson’s disease with motor fluctuations and
dyskinesia. Clin. Neuropharmacol. 23, 75–81 (2000).
11. Goetz, C. G. et al. Movement Disorder Society-sponsored revision of the Unified Parkinson’s Disease Rating Scale (MDS-UPDRS):
Process, format, and clinimetric testing plan. Mov. Disord. Off. J. Mov. Disord. Soc. 22, 41–47 (2007).
12. Antonini, A. et al. Wearing-off scales in Parkinson’s disease: critique and recommendations. Mov. Disord. 26, 2169–2175 (2011).
13. Vitale, C. et al. Unawareness of dyskinesias in Parkinson’s and Huntington’s diseases. Neurol. Sci. 22, 105–106 (2001).
14. Reimer, J., Grabowski, M., Lindvall, O. & Hagell, P. Use and interpretation of on/off diaries in Parkinson’s disease. J. Neurol.
Neurosurg. Psychiatry 75, 396–400 (2004).
15. Griffiths, R. I. et al. Automated assessment of bradykinesia and dyskinesia in Parkinson’s disease. J. Park. Dis. 2, 47–55 (2012).
16. Hoff, J. I., van der Meer, V. & van Hilten, J. J. Accuracy of objective ambulatory accelerometry in detecting motor complications in
patients with Parkinson disease. Clin. Neuropharmacol. 27, 53–57 (2004).
17. Keijsers, N. L. W., Horstink, M. W. I. M. & Gielen, S. C. A. M. Ambulatory motor assessment in Parkinson’s disease. Mov. Disord. Off.
J. Mov. Disord. Soc. 21, 34–44 (2006).
18. Ossig, C. et al. Correlation of Quantitative Motor State Assessment Using a Kinetograph and Patient Diaries in Advanced PD: Data
from an Observational Study. PloS One 11, e0161559 (2016).
19. Pfister, F. M. J., Ceballos-Baumann, A. O. & Fietzek, U. M. Time for change – closing the loop in Parkinson’s Disease. Basal Ganglia
6, 191 (2016).
20. Del Din, S. et al. Measuring gait with an accelerometer-based wearable: influence of device location, testing protocol and age.
Physiol. Meas. 37, 1785–1797 (2016).
21. Rovini, E., Maremmani, C. & Cavallo, F. How Wearable Sensors Can Support Parkinson’s Disease Diagnosis and Treatment: A
Systematic Review. Front. Neurosci. 11, 555 (2017).
22. Keijsers, N. L. W., Horstink, M. W. I. M. & Gielen, S. C. A. M. Automatic assessment of levodopa-induced dyskinesias in daily life by
neural networks. Mov. Disord. Off. J. Mov. Disord. Soc. 18, 70–80 (2003).
23. Patel, S. et al. Monitoring motor fluctuations in patients with Parkinson’s disease using wearable sensors. IEEE Trans. Inf. Technol.
Biomed. Publ. IEEE Eng. Med. Biol. Soc. 13, 864–873 (2009).
24. Hammerla, N. et al. PD Disease State Assessment in Naturalistic Environments Using Deep Learning. in Procedings of the 29th AAAI
Conference on Artificial Intelligence (2015).
25. Fisher, J. M. et al. Unsupervised home monitoring of Parkinson’s disease motor symptoms using body-worn accelerometers.
Parkinsonism Relat. Disord. 33, 44–50 (2016).
26. Hssayeni, M. D., Burack, M. A. & Ghoraani, B. Automatic assessment of medication states of patients with Parkinson’s disease using
wearable sensors. in 6082–6085 (IEEE), https://doi.org/10.1109/EMBC.2016.7592116 (2016)
27. Pérez-López, C. et al. Assessing Motor Fluctuations in Parkinson’s Disease Patients Based on a Single Inertial Sensor. Sensors 16,
(2016).
28. Pastorino, M. et al. Preliminary results of ON/OFF detection using an integrated system for Parkinson’s disease monitoring. In 2013
35th Annual International Conference of the IEEE Engineering in Medicine and Biology Society (EMBC) 941–944. https://doi.
org/10.1109/EMBC.2013.6609657 (2013)
29. Zhan, A. et al. Using Smartphones and Machine Learning to Quantify Parkinson Disease Severity: The Mobile Parkinson Disease
Score. JAMA Neurol., https://doi.org/10.1001/jamaneurol.2018.0809 (2018)
30. Maetzler, W. & Rochester, L. Body-worn sensors–the brave new world of clinical measurement? Mov. Disord. Off. J. Mov. Disord. Soc.
30, 1203–1205 (2015).
31. Espay, A. J. et al. Technology in Parkinson’s disease: Challenges and opportunities. Mov. Disord. 31, 1272–1282 (2016).
32. Godinho, C. et al. A systematic review of the characteristics and validity of monitoring technologies to assess Parkinson’s disease. J.
Neuroengineering Rehabil. 13, 24 (2016).
33. Krizhevsky, A., Sutskever, I. & Hinton, G. E. ImageNet Classification with Deep Convolutional Neural Networks. In Advances in
Neural Information Processing Systems 25 (eds. Pereira, F., Burges, C. J. C., Bottou, L. & Weinberger, K. Q.) 1097–1105 (Curran
Associates, Inc., 2012).
34. Rajpurkar, P., Hannun, A. Y., Haghpanahi, M., Bourn, C. & Ng, A. Y. Cardiologist-Level Arrhythmia Detection with Convolutional
Neural Networks. ArXiv170701836 Cs (2017).
35. Rajpurkar, P. et al. CheXNet: Radiologist-Level Pneumonia Detection on Chest X-Rays with Deep Learning. ArXiv171105225 Cs Stat
(2017).
36. Um, T. T. et al. Data Augmentation of Wearable Sensor Data for Parkinson’s Disease Monitoring using Convolutional Neural
Networks. Proc. 19th ACM Int. Conf. Multimodal Interact. - ICMI 2017 216–220, https://doi.org/10.1145/3136755.3136817 (2017)
37. LeCun, Y., Bengio, Y. & Hinton, G. Deep learning. Nature 521, 436–444 (2015).
38. Hinton, G. E. & Salakhutdinov, R. R. Reducing the dimensionality of data with neural networks. Science 313, 504–507 (2006).
39. Kubota, K. J., Chen, J. A. & Little, M. A. Machine learning for large-scale wearable sensor data in Parkinson’s disease: Concepts,
promises, pitfalls, and futures. Mov. Disord. 31, 1314–1326 (2016).
40. Ching, T. et al. Opportunities And Obstacles For Deep Learning In Biology And Medicine. bioRxiv, https://doi.org/10.1101/142760
(2017).
41. Ossig, C. et al. Wearable sensor-based objective assessment of motor symptoms in Parkinson’s disease. J. Neural Transm. 123, 57–64
(2016).
42. Um, T. T. et al. Data Augmentation of Wearable Sensor Data for Parkinson’s Disease Monitoring using Convolutional Neural
Networks. ArXiv170600527 Cs 216–220, https://doi.org/10.1145/3136755.3136817 (2017).
43. Landis, J. R. & Koch, G. G. The measurement of observer agreement for categorical data. Biometrics 33, 159–174 (1977).
44. Chaudhuri, K. R., Healy, D. G. & Schapira, A. H. Non-motor symptoms of Parkinson’s disease: diagnosis and management. Lancet
Neurol. 5, 235–245 (2006).
45. Mazilu, S. et al. Prediction of Freezing of Gait in Parkinson’s From Physiological Wearables: An Exploratory Study. IEEE J. Biomed.
Health Inform. 19, 1843–1854 (2015).
46. Maetzler, W., Liepelt, I. & Berg, D. Progression of Parkinson’s disease in the clinical phase: potential markers. Lancet Neurol. 8,
1158–1171 (2009).
Scientific Reports | (2020) 10:5860 | https://doi.org/10.1038/s41598-020-61789-3 9www.nature.com/scientificreports/ www.nature.com/scientificreports
47. Horne, M. K., McGregor, S. & Bergquist, F. An objective fluctuation score for Parkinson’s disease. PloS One 10, e0124522 (2015).
48. Mera, T. O., Heldman, D. A., Espay, A. J., Payne, M. & Giuffrida, J. P. Feasibility of home-based automated Parkinson’s disease motor
assessment. J. Neurosci. Methods 203, 152–156 (2012).
49. Giannouli, E., Bock, O., Mellone, S. & Zijlstra, W. Mobility in Old Age: Capacity Is Not Performance. Bio. Med. Res. Int. 2016,
3261567 (2016).
50. Branson, K., Robie, A. A., Bender, J., Perona, P. & Dickinson, M. H. High-throughput ethomics in large groups of Drosophila. Nat.
Methods 6, 451–457 (2009).
51. Hughes, A. J., Daniel, S. E., Kilford, L. & Lees, A. J. Accuracy of clinical diagnosis of idiopathic Parkinson’s disease: a clinico-
pathological study of 100 cases. J. Neurol. Neurosurg. Psychiatry 55, 181 (1992).
52. Goetz, C. G. et al. Movement Disorder Society-sponsored revision of the Unified Parkinson’s Disease Rating Scale (MDS-UPDRS):
scale presentation and clinimetric testing results. Mov Disord 23, 2129–70 (2008).
53. Guy, W. ECDEU assessment manual for psychopharmacology. (U.S. Dept. of Health, Education, and Welfare, Public Health Service,
Alcohol, Drug Abuse, and Mental Health Administration, National Institute of Mental Health, Psychopharmacology Research
Branch, Division of Extramural Research Programs (1976).
54. Hoehn, M. M. & Yahr, M. D. Parkinsonism: onset, progression and mortality. Neurology 17, 427–442 (1967).
55. Nasreddine, Z. S. et al. The Montreal Cognitive Assessment, MoCA: a brief screening tool for mild cognitive impairment. J. Am.
Geriatr. Soc. 53, 695–699 (2005).
56. Hauser, R. A. et al. Patient evaluation of a home diary to assess duration and severity of dyskinesia in Parkinson disease. Clin.
Neuropharmacol. 29, 322–330 (2006).
57. Curtze, C., Nutt, J. G., Carlson-Kuhta, P., Mancini, M. & Horak, F. B. Levodopa Is a Double-Edged Sword for Balance and Gait in
People With Parkinson’s Disease. Mov. Disord. Off. J. Mov. Disord. Soc. 30, 1361–1370 (2015).
58. He, K., Zhang, X., Ren, S. & Sun, J. Deep Residual Learning for Image Recognition. ArXiv151203385 Cs (2015).
59. Abdel-Hamid, O. et al. Convolutional Neural Networks for Speech Recognition. IEEEACM Trans. Audio Speech Lang. Process. 22,
1533–1545 (2014).
60. Um, T. T., Babakeshizadeh, V. & Kulić, D. Exercise motion classification from large-scale wearable sensor data using convolutional
neural networks. in 2017 IEEE/RSJ International Conference on Intelligent Robots and Systems (IROS) 2385–2390, https://doi.
org/10.1109/IROS.2017.8206051 (2017).
61. LeCun, Y. & Bengio, Y. The Handbook of Brain Theory and Neural Networks. In (ed. Arbib, M. A.) 255–258 (MIT Press, 1998).
62. Um, T. T. et al. Parkinson’s Disease Assessment from a Wrist-Worn Wearable Sensor in Free-Living Conditions: Deep Ensemble
Learning and Visualization. ArXiv180802870 Cs (2018).
63. loess function | R Documentation. Available at: https://www.rdocumentation.org/packages/stats/versions/3.4.3/topics/loess.
(Accessed: 10th April 2018).
64. Arlot, S. & Celisse, A. A survey of cross-validation procedures for model selection. Stat. Surv. 4, 40–79 (2010).
65. Saeb, S., Lonini, L., Jayaraman, A., Mohr, D. C. & Kording, K. P. The need to approximate the use-case in clinical machine learning.
GigaScience 6, 1–9 (2017).
66. Ioffe, S. & Szegedy, C. Batch Normalization: Accelerating Deep Network Training by Reducing Internal Covariate Shift.
ArXiv150203167 Cs (2015).
67. Nair, V. & Hinton, G. E. Rectified Linear Units Improve Restricted Boltzmann Machines. in Proceedings of the 27th International
Conference on International Conference on Machine Learning 807–814 (Omnipress, 2010).
68. Tomlinson, C. L. et al. Systematic review of levodopa dose equivalency reporting in Parkinson’s disease. Mov. Disord. Off. J. Mov.
Disord. Soc. 25, 2649–2653 (2010).
Acknowledgements
We thank Kerstin Ziegler, Kai Bötzel, Seyed-Ahmad Ahmadi and Felix Achilles for their advice in the early stages
of the project. We thank Ruth Adam for proof-reading the final version. The work of Mr. Um and Prof. Kulic was
supported in part by Canada’s Natural Sciences and Engineering Research Council and Ontario’s Early Researcher
Award. The work of Mrs. Lang and Dr. Endo was supported in part by the EU seventh framework programme
FP7/2007-2013 within the ERC Starting Grant Control based on Human Models (con-humo), grant agreement
no. 337654. Dr. Fietzek’s position was supported by an unrestricted research grant from the Deutsche Stiftung
Neurologie and the Deutsche Parkinson Vereinigung e.V.
Author contributions
F.M.J.P. conceived the experiment, executed the post-CNN analyses, and reviewed the manuscript; T.T.U.
designed and executed the deep learning by CNN, and reviewed the manuscript; D.P. gathered the patient data,
and reviewed the manuscript; K.A. gathered the patient data, and reviewed the manuscript; J.G. executed the
post-CNN analyses and reviewed the manuscript; M.L. executed the pre-processing and reviewed the manuscript;
S.E. executed the pre-processing and reviewed the manuscript; S.H. reviewed the manuscript; A.C.-B. reviewed
the manuscript; B.B. reviewed the manuscript; D.K. reviewed the manuscript; U.M.F. conceived the experiment,
wrote the first draft, executed the descriptive clinical statistics, and reviewed the manuscript.
Competing interests
Dr. F.M.J. Pfister does work as consultant for digital health. Prof. Dr. B. Bischl received grants from Deutsche
Forschungsgesellschaft (DFG), Zentrum Digitalisierung Bayern, Audi, and Roche. Prof. Dr. A. Ceballos-
Baumann received grants from the Deutsche Stiftung Neurologie and the German Parkinson Vereinigung. He
received honoraria for speeches from Abbvie, Archimedes, Bayer, Boston Scientific, Desitin, Grünenthal, Ipsen,
Kyowa, Licher, Merz, Pfizer, Zambon for speeches. Prof. D. Kulic received grants from Canada’s Natural Sciences
and Engineering Research Council, Mitacs, PUSH; Cardon. Dr. U. Fietzek received honoraria for advisory work
from Ipsen and from Abbvie, Allergan, Merz, and Ipsen for speeches.
Additional information
Supplementary information is available for this paper at https://doi.org/10.1038/s41598-020-61789-3.
Correspondence and requests for materials should be addressed to U.M.F.
Reprints and permissions information is available at www.nature.com/reprints.
Scientific Reports | (2020) 10:5860 | https://doi.org/10.1038/s41598-020-61789-3 10www.nature.com/scientificreports/ www.nature.com/scientificreports
Publisher’s note Springer Nature remains neutral with regard to jurisdictional claims in published maps and
institutional affiliations.
Open Access This article is licensed under a Creative Commons Attribution 4.0 International
License, which permits use, sharing, adaptation, distribution and reproduction in any medium or
format, as long as you give appropriate credit to the original author(s) and the source, provide a link to the Cre-
ative Commons license, and indicate if changes were made. The images or other third party material in this
article are included in the article’s Creative Commons license, unless indicated otherwise in a credit line to the
material. If material is not included in the article’s Creative Commons license and your intended use is not per-
mitted by statutory regulation or exceeds the permitted use, you will need to obtain permission directly from the
copyright holder. To view a copy of this license, visit http://creativecommons.org/licenses/by/4.0/.
© The Author(s) 2020
Scientific Reports | (2020) 10:5860 | https://doi.org/10.1038/s41598-020-61789-3 11You can also read