Long-term series and trends in surface solar radiation in Athens, Greece
←
→
Page content transcription
If your browser does not render page correctly, please read the page content below
Atmos. Chem. Phys., 18, 2395–2411, 2018
https://doi.org/10.5194/acp-18-2395-2018
© Author(s) 2018. This work is distributed under
the Creative Commons Attribution 3.0 License.

Long-term series and trends in surface solar radiation
in Athens, Greece
Stelios Kazadzis1,2 , Dimitra Founda2 , Basil E. Psiloglou2 , Harry Kambezidis2 , Nickolaos Mihalopoulos2,3 ,
Arturo Sanchez-Lorenzo4,5 , Charikleia Meleti6 , Panagiotis I. Raptis1,2 , Fragiskos Pierros2 , and Pierre Nabat7
1 Physikalisch-Meteorologisches    Observatorium Davos, World Radiation Center (PMOD/WRC) Dorfstrasse 33,
7260 Davos Dorf, Switzerland
2 Institute of Environmental Research and Sustainable Development, National Observatory of Athens, Athens, Greece
3 Department of Chemistry, Univ. of Crete, Heraklion, Crete
4 Instituto Pirenaico de Ecología, Consejo Superior de Investigaciones Científicas (IPE-CSIC), Zaragoza, Spain
5 Department of Physics, University of Extremadura, Badajoz, Spain
6 Physics Department, Aristotle University of Thessaloniki, Thessaloniki, Greece
7 CNRM UMR3589, Météo-France/CNRS, Toulouse, France

Correspondence: Stelios Kazadzis (kazadzis@noa.gr)

Received: 20 January 2017 – Discussion started: 14 March 2017
Revised: 20 November 2017 – Accepted: 16 January 2018 – Published: 19 February 2018

Abstract. We present a long-term series of surface solar ra-      1   Introduction
diation (SSR) from the city of Athens, Greece. SSR mea-
surements were performed from 1954 to 2012, and before            In recent decades surface solar radiation (SSR) and the trans-
that (1900–1953) sunshine duration (SD) records were used         mission of the atmosphere have been of increasing interest
in order to reconstruct monthly SSR. Analysis of the whole        because of the related impacts on climate. Most of the energy
data set (1900–2012) mainly showed very small (0.02 %)            in the Earth–atmosphere system is introduced by solar radi-
changes in SSR from 1900 to 1953, including a maximum             ation. It provides heating, which creates pressure gradients
decrease of −2.9 % decade−1 in SSR during the 1910 to 1940        and ultimately wind and triggers water, carbon and oxygen
period, assuming a linear change. For the dimming period          cycles through evaporation and photosynthesis. These pro-
1955–1980, −2 % decade−1 was observed that matches var-           cesses define the climatological conditions, and changes of
ious European long-term SSR-measurement-related studies.          incoming solar radiation rapidly affect the energy balance
This percentage in Athens is in the lower limit, compared to      (Wild et al., 2015). Interest in solar radiation changes has
other studies in the Mediterranean area. For the brightening      also been raised after the development of solar energy appli-
period 1980–2012 we calculated +1.5 % decade−1 , which is         cations, which are continuously growing in number over the
also in the lower limit of the reported positive changes in SSR   recent years. Changes in SSR have been recorded over the
around Europe. Comparing the 30-year periods 1954–1983            last century and can be caused either by natural events such
and 1983–2012, we found a difference of 4.5 %. However,           as volcanic eruptions or human-related activities, mainly in
measurements of the first 30-year period are associated with      polluted regions (Wild, 2016). On longer scales (thousands
higher uncertainties than those of the second period, espe-       of years) changes in SSR may be caused by changes in the
cially when looking at year-to-year changes. The difference       Earth’s orbit and Sun solar output (Lean, 1997; Ohmura,
between the two periods was observed for all seasons except       2006).
winter. Analyzing SSR calculations of all-sky and clear-sky          Systematic continuous measurements of SSR were estab-
(cloudless) conditions/days, we report that most of the ob-       lished in the middle of the 20th century at selected meteoro-
served changes in SSR after 1954 can be attributed partly to      logical observatories. Solar variations have been investigated
cloudiness and mostly to aerosol load changes.                    in several studies using ground-based SSR measurements
                                                                  from various monitoring networks worldwide (e.g., Ohmura,

Published by Copernicus Publications on behalf of the European Geosciences Union.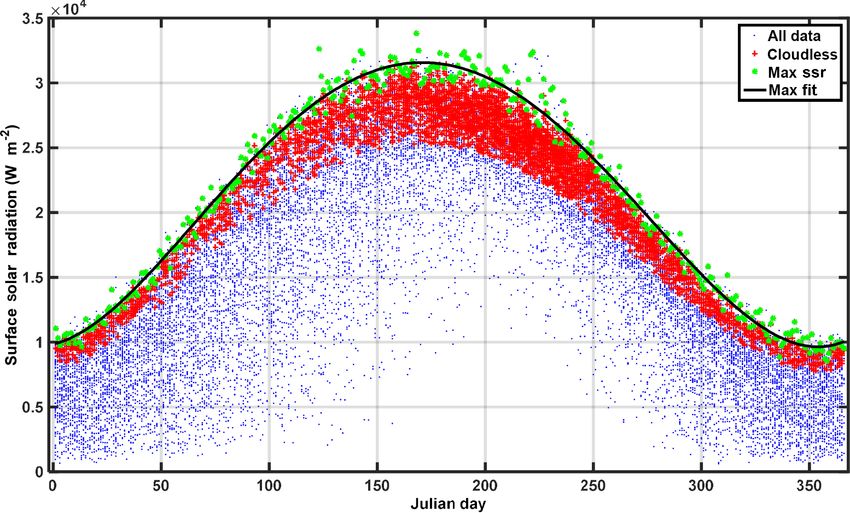
2396                                                                   S. Kazadzis et al.: Surface solar radiation in Athens

2009) and also by satellite-derived estimations (e.g., Kam-       temporal changes is the small number of sites with reliable
bezidis et al., 2010). Overall, most of these studies (Gilgen     long-term records, even over areas with a relatively high den-
et al., 1998; Noris and Wild, 2009; Wild, 2009 and 2016;          sity of stations such as Europe, Japan or the USA. In Europe
and references therein) have reported a worldwide decrease        for example, there are currently less than 80 stations with
of solar incoming radiation in the period 1960–1985 (known        more than 40 years of homogeneous data (Sanchez-Lorenzo
as dimming period), followed by an increase (brightening          et al., 2015), with very few of them operating over southern
period). These changes were reported to be higher in more         Europe. Recently, a high-quality data set of SSR was set up
polluted and urban areas but have also been recorded in iso-      over Italy (Manara et al., 2016), but there is still a lack of
lated regions such as the Arctic (Stanhill, 1995) and Antarc-     high-quality long-term trends in other countries around the
tica (Stanhill and Cohen, 1997). Other recent studies have        Mediterranean Basin.
investigated the effect of urbanization on global brighten-          In addition, measurements taken before the 1950s were
ing and dimming, and found no marked differences among            even more sporadic (Stanhill and Ahiman, 2017); the few
urban and rural SSR time series (Tanaka et al., 2016) and         studies of them have pointed out an SSR increase in the first
Imamovic et al. (2016). Changes in atmospheric transmission       decades of the 20th century and a maximum around 1950
due to variations in cloudiness and aerosol concentration are     (Ohmura, 2006, 2009). This topic is still controversial due to
the main factors to investigate in order to determine the pos-    the few long-term series available (Antón et al., 2014). Re-
sible causes of such trends in SSR (Wild, 2009). However,         cently, there have been efforts to reconstruct SSR series in
due to the aerosol–cloud interactions and the aerosol indirect    periods with no direct measurements available, using other
effect on SSR, the two factors (clouds and aerosols) are not      variables such as sunshine duration (SD), which is avail-
completely mutually exclusive in explaining SSR changes.          able in a large number of sites starting from the late 19th
   The cloud and aerosol radiative effects on solar radia-        century (e.g., Stanhill and Cohen, 2005, for USA; Sanchez-
tion variations over the past decades have been investigated      Lorenzo and Wild, 2012, for Switzerland; Matuszko, 2014,
in numerous studies in recent years. The interannual varia-       for Poland). For example, Sanchez-Lorenzo and Wild (2012)
tions in cloudiness is crucial for studying SSR time series,      used data from 17 stations in Switzerland, considered SD as
but its decadal variability is not always connected with the      a proxy and successfully reconstructed SSR time series be-
widespread dimming and brightening effects (Wang et al.,          ginning in the late 19th century. They calculated that the vari-
2012; Wild, 2016). Aerosols play a significant role in incom-     ability in SSR monthly anomalies can be explained by SD
ing radiation, by scattering and absorbing light and by act-      anomalies in the range of 76–96 %, and a monthly root mean
ing as cloud-condensation nuclei. Over the 20-year dimming        squared error of 4.2 W m−2 between recorded and estimated
phase (from 1960 to 1980) and the 15-year brightening phase       SSR for all-sky conditions and of 5.5 W m−2 for clear-sky
(from 1990 to 2005), aerosol effects (direct and indirect)        conditions. Other studies have tried to use pan evaporation as
were found to have played the most important role in SSR          a proxy of SSR, for the first half of the 20th century (Stanhill
variation (Dudok de Wit et al., 2015). Concerning central Eu-     and Möller, 2008). Kambezidis et al. (2016) used monthly
rope, Ruckstuhl et al. (2008) suggested that the brightening      re-analysis data sets from the Modern Era Retrospective-
phase under cloud-free conditions is in line with decreasing      Analysis for Research and Applications (MERRA) and cal-
anthropogenic aerosol emissions (Streets et al., 2006). Nabat     culated shortwave radiation trends over the period 1979–
et al. (2013), using a blending of remote sensing and model       2012 for the Mediterranean basin. They reported an increase
products, showed a decreasing aerosol optical depth (AOD)         in MERRA of +0.36 W m−2 decade−1 , with higher rates
trend of 0.05 decade−1 in Europe for the period of their study    over the western Mediterranean (+0.82 W m−2 decade−1 ).
(1979–2009). In addition, Nabat et al. (2014) reported that          A few studies discuss the brightening/dimming effect in
the anthropogenic aerosol decline in Europe from 1980 to          the southeastern Mediterranean. Zerefos et al. (2009) studied
2012 statistically explains 81 ± 16 % of the observed bright-     the ultraviolet A (UVA) changes for the area of Thessaloniki
ening. Overall, changes in anthropogenic aerosol emissions        (Greece) from 1984 to 2008. They calculated a positive trend
are now considered to be the primary cause of brightening         of +5 % decade−1 linked to a negative trend in aerosol opti-
and dimming effects (Wild, 2016). The gaseous and particu-        cal depth (AOD) for the area due to air pollution abatement
late air pollutants may reduce solar radiation by up to 40 %      strategies. The variability in shortwave downward solar irra-
during air pollution episodes (Jauregui and Luyando, 1999).       diance received at Earth’s surface over Thessaloniki, Greece,
Aerosol-related attenuation is much larger during forest fires,   for the period 1993–2011 (Bais et al., 2013), showed an up-
dust events and volcanic eruptions. Vautard et al. (2009) also    ward trend in SSR after 1990 (+0.33 % year−1 ). They also
reported a decline in the frequency of low-visibility condi-      reported signs of a slowdown in the upward trend in SSR
tions such as fog, mist and haze in Europe over the past          during the beginning of the 2000s. Founda et al. (2014) stud-
30 years, suggesting a significant contribution of air-quality    ied the SD long-term variability over the Athens area. They
improvements                                                      reported a −7 % decline in the annual SD over 1951–1982
   Long-term series of SSR measurements are essential for         and a 3 % increase over 1983–2011 under all-sky conditions.
such studies. One of the main constraints in studying SSR         Under near-clear-sky conditions, these percentages are −7 %

Atmos. Chem. Phys., 18, 2395–2411, 2018                                            www.atmos-chem-phys.net/18/2395/2018/
S. Kazadzis et al.: Surface solar radiation in Athens                                                                       2397

and +9 % for the dimming and brightening periods, respec-          2     Data and methodology
tively. Similarly, Founda et al. (2016) analyzed long-term
SD and total cloud cover time series over 15 sites in Greece       2.1    SSR data collection and analysis
(the oldest one beginning in 1897). They showed an increase
in SD at almost all stations since the mid-1980s, which in         The SSR data used in this study cover the period from De-
certain areas of southeastern Greece amounts to an increase        cember 1953 to December 2012 and were measured by a se-
of 20 h year−1 . This increase is not accompanied with syn-        ries of pyranometers that are mentioned in Table 1. These
chronous decrease in total cloud cover, possibly evidenc-          instruments have operated continuously at the Actinomet-
ing decreasing aerosol loads, despite the fact that their im-      ric Station of the National Observatory of Athens (ASNOA;
pact on SD should be lower than on SSR (Sanchez-Romero             Pnyx Hill, Thissio, Athens), which is located near the center
et al., 2014). Yildirim et al. (2013) analyzed 41 years of SD      of Athens, Greece (38.00◦ N, 23.73◦ E; 110 m above mean
measurements in 36 stations in Turkey. They reported a de-         sea level). Table 1 presents the instruments and the period
creasing trend (between 1970 to about 1990) at most of the         of operation, as well as the maximum error on the integrated
stations. After 1990, they observed either zero trend vari-        daily values. References mentioned in Table 1 describe the
ation or a reduction in the decreasing rate of SD at most          exact type of errors and uncertainties related to the sensors.
of the locations. They concluded that the decreasing period        In the period 1953–1986, the maximum daily error was about
might be attributed to human-induced air pollution. Founda         5 %, and 2 % afterwards. The spectral response of the sensors
et al. (2017) have investigated the visibility trends over the     is in the range of 285–2800 nm; since 1986 a first-class Ep-
Athens area from 1931 to 2013. They reported a deteriora-          pley PSP pyranometer (WMO, 1983) has been in operation
tion in the visibility up to 2004 and a slight recovery af-        at ASNOA. Since 1992, frequent calibration (every 2 years)
terwards, negatively/positively correlated with relative hu-       has been performed by the NOA Laboratory of Meteorologi-
midity/wind speed and positively correlated with AOD from          cal Device Calibration (LMDC; Basil E. Psiloglou, personal
2000 to 2013. Finally, Alexandri et al. (2017) studied the         communication, 2016) in order to ensure high-quality mea-
spatiotemporal variability in SSR over the eastern Mediter-        surements. LMDC follows the standard calibration proce-
ranean for the 1983–2013 period, using the Satellite Appli-        dure for thermopile pyranometers (ISO 9847, 1992), with
cation Facility on Climate Monitoring Solar surfAce RAdi-          exposure to real sunlight conditions and comparison with
ation Heliosat satellite-based product (SAF). They reported        a standard thermopile pyranometer (Secondary Standard).
a positive (brightening) and statistically significant SSR trend   LMDC’s reference pyranometer, a Kipp & Zonen CM21, is
at the 95 % confidence level (0.2 ± 0.05 W m−2 year−1 or           regularly calibrated in PMOD/WRC, Davos, Switzerland.
(0.1 ± 0.02 % year−1 ) being almost the same over land and            SSR data are processed using a set of quality-control (QC)
sea.                                                               tests in order to ensure the quality of the data set. The QC
   In this work, measurements of SSR, recorded over                procedures include rejection of the following:
60 years in the center of Athens, are presented. In addition,
                                                                       – measurements for solar elevation angles less than 5◦ ;
with the use of the SD measurements, which have been con-
ducted in Athens since 1900, we were able to reconstruct the           – SSR values equal to or less than 5 W m−2 , during sun-
time series of SSR during the first half of the 20th century.            rise and sunset, due to the pyranometers’ sensitivity;
These time series (1900–2012) are the oldest uninterrupted
and high-quality SSR time series in the SE Mediterranean               – SSR values greater than 120 % of the seasonally cor-
and one of the oldest in Europe, providing unique informa-               rected solar constant.
tion about the variations and trends in the area for recent past
decades. Time series of SSR over Athens are presented to try         After the initiation of diffuse horizontal radiation measure-
answering questions such as the following:                         ments at ASNOA in 1991, the following quality criteria were
                                                                   added for rejection:
  – Are the dimming–brightening patterns observed in Eu-
    rope over the past century also observed, to the same              – diffuse horizontal values greater than the corresponding
    extent, over the eastern Mediterranean?                              SSR ones;

  – Is SSR variability during the first decades of the 20th            – diffuse horizontal values greater than 80 % of the sea-
    century in Athens in line with the trends reported at                sonally correct solar constant;
    other locations over this period?
                                                                       – direct-beam solar component exceeding the extraterres-
  – Can we verify that anthropogenic aerosols play the most              trial solar irradiance.
    important role in the brightening/dimming observed
    SSR after 1950, in agreement with results from other             Also, both total and diffuse horizontal measurements are
    European regions?                                              corrected for the nighttime dark-signal offset of the pyra-
                                                                   nometers.

www.atmos-chem-phys.net/18/2395/2018/                                                Atmos. Chem. Phys., 18, 2395–2411, 2018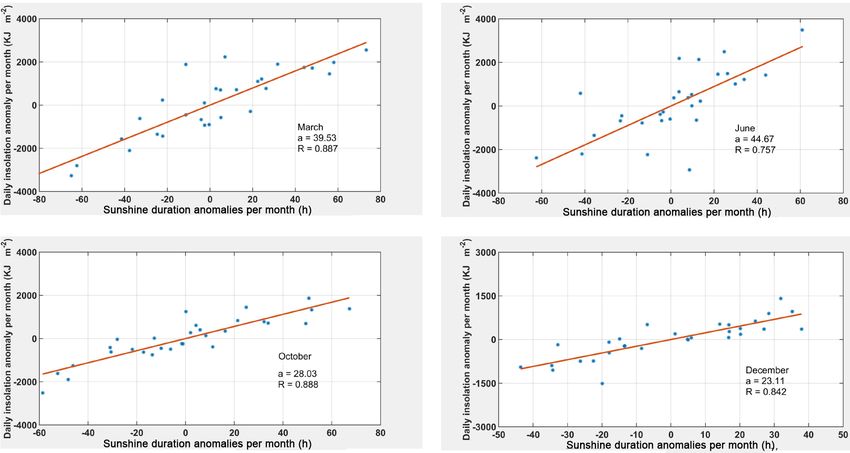
2398                                                                           S. Kazadzis et al.: Surface solar radiation in Athens

Table 1. History of SSR instruments used at ASNOA. SSR measurements refer to the total solar radiation on a horizontal surface.

       Instrument                        Period      Class    Maximum     Reference    Class   Comments                           Resolution
                                                              error
                                                              (daily
                                                              integral)
 1     Gorczyski Solarimeter             1953–1959   second   5%          Coulson      B       one instrument being used          1h
                                                                          (1975)
 2     Eppley 180◦ pyranometer           1960–1966   second   5%          Coulson      B       manual measurements archiving      1h
       (no. 3604)                                                         (1975),              with a voltmeter
                                                                          Drummond
                                                                          (1965)
 3     Eppley 180◦ pyranometer           1966–1968   second   5%          Coulson      B       same instrument as no. 2 with      1h
       (no. 3604)                                                         (1975),              Speedomax recorder
       coupled with a Leeds & Northup                                     Drummond
       recorder, Speedomax, type G                                        (1965)
 4     Eppley 180◦ pyranometer           1968–1973   second   5%          Coulson      B       new instrument, same recorder      1h
       (no. 3034) coupled with a Leeds                                    (1975),
       & Northup recorder, Speedomax,                                     Drummond
       type G                                                             (1965)
 5     Eppley pyranometer,               1974–1986   second   3–5 %       Hulstrom     B       type 8-48 and type 8-48A instru-   1h
       type 8-48 and type 8-48A cou-                                      (1989)               ments measured alternatively for
       pled with a Leeds & Northup                                                             3 years each
       recorder, Speedomax, type G
 6     Eppley Precision Spectral Pyra-   1986–now    first    1–2 %       Hulstrom     A       regular recalibration;             1 min
       nometer (PSP)                                                      (1989)               coupled with an A/D recorder
                                                                                               (Campbell Scientific Ltd.) data
                                                                                               logger, type CR-21X during
                                                                                               1986–2003; CR-10X during
                                                                                               2003–2012

   Mean daily SSR values were calculated from the data set                this case the subtraction of the nighttime dark signal (more
of this study (December 1953–December 2012); only months                  specifically, the mean of the previous and next night signal
with more than 20 days of measurements were considered in                 was subtracted for a specific day) reduces the problem by at
the analysis. During the 60 years of measurements, only three             least half. The remaining offset was not considered in our
months (January and February 1998 and March 2012) did not                 analysis, partly because it was tackled through the overlap-
fulfill these criteria.                                                   ping measurements/homogenization procedures. In addition,
   When trying to use such long-term series, it is evident                the inclusion of diffuse radiation in the quality-assurance
that the data quality differs as instrument performance has               tests after 1991 may be the cause of the major improve-
improved, quality-assurance and quality-control procedures                ment in the newest data compared with the older ones. How-
have been standardized and finally the information flow on                ever, this recent improvement in quality control cannot be
the day-to-day instrument performance issues is much more                 linked with a systematic impact on SSR measurements and
complete at the present. At ASNOA (after 1986 only) the                   changes compared to the past, other than higher uncertainty
instruments were calibrated or checked with a reference in-               in the integrated (monthly, yearly) SSR values. For the 1953–
strument on a yearly basis to identify changes in the cali-               1986 time series there are a number of publications that have
bration and drifts. As reported, the addition of diffuse irra-            used the SSR-NOA time series. In particular, Macris (1959)
diance measuring instruments also provided the opportunity                used the 1954–1956 SSR measurements to identify the rela-
to improve minute-based measurement quality. Before 1986,                 tionship between SSR and sunshine duration. Katsoulis and
the instruments reported in Table 1 were used. According to               Papachristopoulos (1978) used the SSR data from 1960 to
the log books there has always been a certain overlap when                1976 in order to calculate SSR statistics for daily, seasonal
changing from one instrument to another. Reports mention                  and yearly solar radiation levels in Athens, Greece. Notari-
that there were instrument drifts that were corrected with no             dou and Lalas (1978) used the 1954–1976 SSR data in order
further information from 1953 to 1970. Instrument overlaps                to verify an empirical formula on global net radiation over
after 1986 were used to eliminate possible instrument-related             Greece. Flocas (1980) used the 1961–1975 SSR time series
offsets. However, instrument differences (e.g., thermal off-              to compare them with sunshine duration data for the same pe-
set of PSP instrument compared with a model 8–48 pyra-                    riod. Kouremenos et al. (1985) used the SSR data from 1955
nometer; Vignola et al., 2012) could theoretically have an ef-            to 1980 in order to correlate their changes with various atmo-
fect on the order of 1–2 W m−2 on the series continuation. In             spheric parameters. Zabara (1986) used the 1965–1980 time

Atmos. Chem. Phys., 18, 2395–2411, 2018                                                    www.atmos-chem-phys.net/18/2395/2018/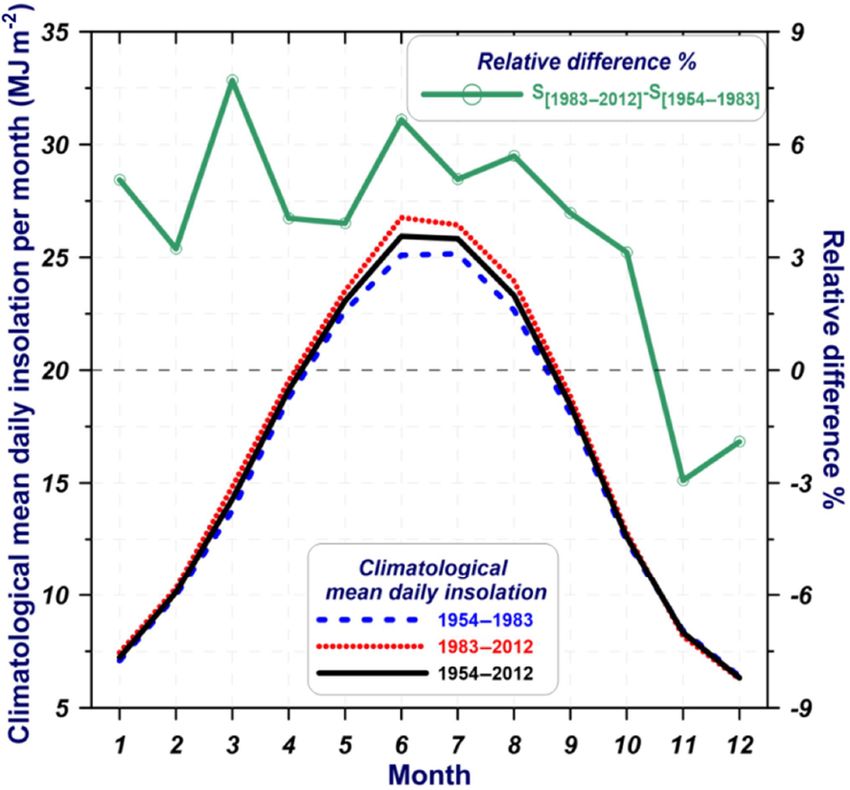
S. Kazadzis et al.: Surface solar radiation in Athens                                                                        2399

                                                                      2.2   Sunshine duration data

                                                                      In addition, collocated measurements of SD recorded at AS-
                                                                      NOA were used. According to WMO (2010), the SD dur-
 Daily SSR ( MJ m 2)

                                                                      ing a given period is defined as the sum of the sub-periods
                                                                      for which the direct solar irradiance exceeds 120 W m−2 . In
                                                                      Athens, SD was recorded using classical Campbell–Stokes
                                                                      heliographs (starting in 1894) and was replaced by electronic
                                                                      instrumentation in 1998 (EKO, MS-091 analog SD sensor).
                                                                      Monthly SD values starting from January 1900 were used in
                                                                      this study. A more analytical study of these time series can
                                                                      be found in Founda et al. (2014).
                                                                         Complementary to this study, cloud-cover observations
Figure 1. Average intra-annual variability of surface solar radia-
tion (SSR) at the Actinometric Station of the National Observatory    from the Hellenic National Meteorological Service (HNMS)
of Athens (red), along with the interannual variability for a given   from 1954 through the present are also used. These obser-
day (±1 standard deviation, blue), calculated over the period 1953–   vations are recorded at a site 7 km away from ASNOA. All
2012.                                                                 cloud observations at HNMS are conducted every 3 h and are
                                                                      expressed in octas.

series to verify a monthly solar radiation calculation method.        2.3   Aerosol optical depth (AOD)
Katsoulis and Leontaris (1981) used the 1960–1977 data to
verify tools describing the solar radiation distribution over         In order to examine the AOD impact on SSR, we used the
Greece. Finally, the percentages of errors reported in Table 1        longest satellite-based AOD series available for the area.
are not directly linked with possible instrument drifts that can      This is the AOD time series from Advanced Very High Res-
impact the SSR time series analysis. Thus, results of mea-            olution Radiometer (AVHRR). AOD retrievals at 630 nm
surements before 1986 have to be used with caution and ac-            over global oceans at spatial resolution of 0.1◦ × 0.1◦ and
companied by a report on the different level of uncertainties         one overpass per day were used. Aerosol optical thickness
of the past and recent data.                                          data were downloaded from NOAA Climate Data Record
   Figure 1 shows the intra-annual variability of SSR at AS-          (CDR) version 2 (Zho and Chan, 2014) and cover the pe-
NOA based on the measurements from all instruments during             riod from August 1981 to December 2009. AVHRR AOD
the period 1953–2012. Daily SSR in Athens ranges between              embodies a large variety of uncertainties, including radiance
approximately 6 and 27 MJ m−2 during the year. Mean and               calibration, systematic changes in single scattering albedo
standard deviations were calculated using the 60-year record          and ocean reflectance (Mishchenko et al., 2007). Current
for each day.                                                         data set radiances have been recalibrated using more accurate
   The results of Fig. 1 show the average yearly pattern of           MODIS data (Chan et al., 2013). We used daily data from the
SSR at ASNOA. The day-to-day variability that is shown as             region around Athens (37.5–38.2◦ N, 23.2–24.4◦ E), which
“noise” in the plotted blue line comes from the 60-year aver-         includes 50 active available (ocean) grid points. The above
aging of each day and is mostly related with the amount of            region was selected based on data availability on each grid,
cloudiness for each of the averaged days. Minimum and max-            within 50 km from ASNOA.
imum SSR at solstices, compared to a cloudless sky aerosol-              To complement the analysis on the evolution of aerosols,
free model, is also related with the highest probability of the       the recent climatology developed by Nabat et al. (2013) was
presence of clouds during winter months. For the calculation          considered over the period 1979–2012. This product pro-
of each of the daily averages the available data points vary          vides monthly averages of AOD at 550 nm over the Mediter-
from 55 to the possible maximum of 60.                                ranean region at 50 km resolution. It is based on a combi-
   Concerning the data availability for SSR and SD data,              nation of satellite-derived (MODIS instrument) and model-
SSR monthly means calculated here were retrieved from                 simulated products (MACC reanalysis and RegCM-4 simu-
daily calculated SSR. Over the 59 years (708 months) of SSR           lations), which have been selected from among many avail-
data, 98 % of the months had 0 or 1 days missing, 3 months            able data sets, from an evaluation against ground-based mea-
had 10–20 missing days and 2 months 20–30 missing days.               surements of the AERONET network. Thus this climatology
For SD, the 1931–1940 monthly data used were taken from               is able to give the best possible atmospheric aerosol con-
the NOA measurement annals. From 1940 on, hourly mea-                 tent over the period 1979–2012. For the present work, the
surements were used in order to derive daily and monthly              AOD time series over the grid cell of the ASNOA (38.00◦ N,
measurements. The SD time series have no gaps with only 6             23.73◦ E) was extracted and is referred to as the ChArMEx
missing days, during December 1944 (Founda et al., 2014).             data.

www.atmos-chem-phys.net/18/2395/2018/                                                 Atmos. Chem. Phys., 18, 2395–2411, 2018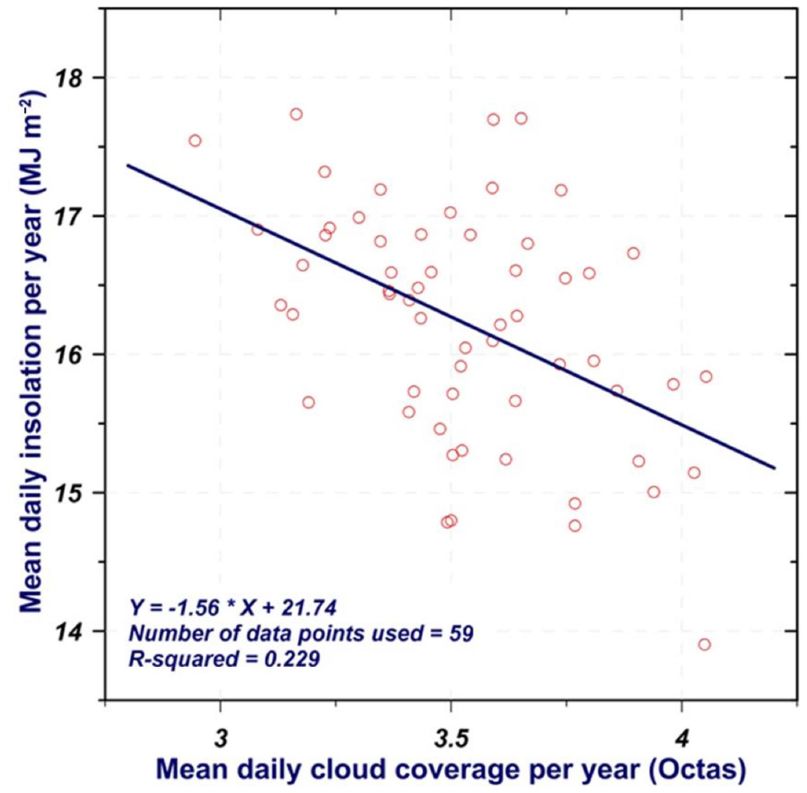
2400                                                                     S. Kazadzis et al.: Surface solar radiation in Athens

2.4    Clear-sky SSR                                              chosen for determining the SSR vs. SD relationship as SSR
                                                                  measurements have lower uncertainties compared with the
For the determination of the clear-sky (defined here as the       1953–2012 period. We thus calculated c = 0.237 and d =
cloudless) days, we used both the cloud octas and SD data.        0.458 and an R 2 equal to 0.81.
Daily observations were used for this analysis. We defined           We also followed the same procedure to calculate the
a clear-sky day as one that fulfills the following criteria:      coefficients of the Ångström formula separately for each
                                                                  month and for each season during the control period 1983–
  – the mean daily cloudiness (in octas) should be less than
                                                                  2012. For individual months, calculated SSR/SSRmax vs.
    1.5;
                                                                  SDU/SDUmax coefficients of determination ranged from 0.5
  – the total daily SD should be higher than 90 % of its the-     to 0.65 for winter months, 0.32 to 0.67 for spring months,
    oretical (astronomical) value.                                0.47 to 0.53 for autumn months and 0.1 to 0.38 for sum-
                                                                  mer months. Thus, coefficients of determination using the
   The procedure for calculating a single mean cloud octa         monthly based data were much lower than the first method
value for each day was the following: we first excluded night-    reported. The low coefficients for the summer period are re-
time cloud observations, and then we weighted each obser-         lated with the small range of values of SDU/SDUmax and
vation based on the hour of the observation. Weights were         SSR/SSRmax that are related with the absence of clouds.
calculated based on the solar radiation contribution of the          We used both the monthly regression coefficients from
specific time slot and day of the month, compared with the        the first method and the yearly based Ångström formulas
daily clear-sky SSR integral of the particular day and month.     in order to investigate the impact of the different methods
                                                                  on the SSR reconstruction. Results of the reconstructed SSR
2.5    Reconstruction of SSR from SD                              yearly values from 1900 to 1953 showed maximum differ-
                                                                  ences of 1 % in the calculated SSR percent anomalies, while
We used the 1900–2012 SD time series in order to extend our       for monthly values the higher difference was 2 %. In order
SSR time series back to 1900.                                     to avoid the use of theoretical normalization values such as
   There are different methods that are used in order to es-      SDUmax and SSRmax needed for the second method, we re-
timate SSR values from SD. In this work we have tried two         constructed the SSR time series based on the monthly based
methods based on the linear regression between SSR and SD         results of the first method as proposed in Sanchez-Lorenzo
(Sanchez-Lorenzo and Wild, 2012). For all-sky conditions          and Wild (2012).
the monthly anomalies of SSR and SD, obtained as differ-
ences from the 1983–2012 mean, were calculated. Then for
each month a linear regression was used to estimate the rela-     3     Results
tionship between the SSR and the SD:
                                                                  3.1    Long-term variations and trends (1900–2012)
SSR = a × SD + b.                                          (1)
                                                                  Based on methods described in Sect. 2, we reconstructed
                                                                  monthly SSR from 1900 to 1953. Using the full data set of
   Figure 2 shows 4 out of the total 12 regressions together      reconstructed (1900–1953) and measured SSR (1954–2012)
with their statistics.                                            we calculated the mean monthly SSR values and used them
   The correlation coefficients (R) vary from 0.75 to 0.91.       for de-seasonalizing the results shown in Fig. 3. The de-
This implies that the SD monthly anomalies explain between        seasonalizing was determined by the following two steps: (1)
56 and 83 % of the variability of the SSR monthly anomalies.      calculating the average SSR (SSRmi ) for each month (i) out
It should be noted that coefficient b is less than 10−3 for all   of the 12 months of the given year, for all years between 1983
months.                                                           and 2012 and (2) calculating the changes in percent in SSR
   The second method to derive a relationship between SD          (SSR% (i, y)) for each month (i) of each year (y) as follows:
and SSR is based on the broadly accepted formula of
                                                                                  SSRiy − SSRmi
Ångström (1924):                                                  SSR%(i, y) =                  × 100.                       (3)
                                                                                     SSRmi
SSR/SSRmax = c + d × (SD/SDmax ),                          (2)
                                                                     According to Fig. 3, the month-to-month variation (shown
where SSRmax and SDmax refer to the theoretical extra-            with light grey line) can reach more than 30 % in compar-
terrestrial value of SSR and the astronomical value of SD,        ison with the mean monthly average of the whole data set.
respectively, while c and d are constants usually defined         Annual means show a 10–12 % (peak to peak) decrease in
monthly. This formula can only be used in large data sets         SSR from 1910 to late 1930s and then an increase of +12 %
as a statistical approach. That is because for different cloud    from 1940 to early 1950s. The simulated SSR results follow
heights, thicknesses and positioning, the constants can show      the observed decline of SD reported in Founda et al. (2014),
large variability (Angell, 1990). The 1983–2012 period was        where a decrease from 1910 to 1940s is shown.

Atmos. Chem. Phys., 18, 2395–2411, 2018                                            www.atmos-chem-phys.net/18/2395/2018/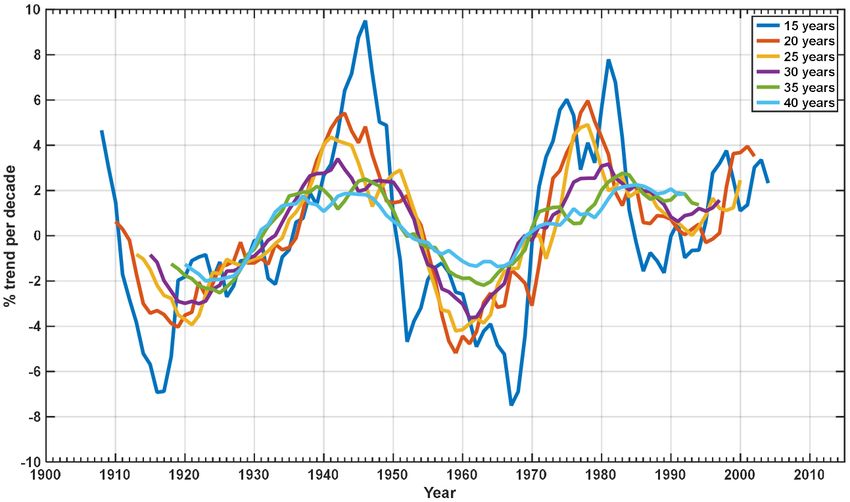
S. Kazadzis et al.: Surface solar radiation in Athens                                                                              2401

Figure 2. Linear regression of SSR and SD anomalies for March, June, October and December 1983–2012.

Table 2. Monthly regression statistics of SSR vs. SD anomalies (see Eq. 1).

            Month     Jan      Feb      Mar      Apr      May      Jun        Jul     Aug     Sep     Oct     Nov      Dec
            a         22.47    34.99    39.53    46.65    57.88    44.67      51.87   46.23   34.28   28.02   27.32    23.10
            R         0.842    0.895    0.887    0.840    0.799    0.757      0.773   0.772   0.812   0.888   0.916    0.842

   Subsequently, there is a decrease during the late 1950s and           a negative annual change of −2.33 % decade−1 in SSR,
then a positive change on the order of +20 % through the                 which is also reflected in all seasons with predominant
present with an episode in the early 1990s that shows low                changes during winter (−6.43 % decade−1 ). The second
SSR values. Measured SSR in the 1991–1993 period differs                 sub-period shows a positive trend of +0.80 % decade−1
by 5 % compared with the one in 1990. The SSR values for                 with the highest ones in spring (+2.77 % decade−1 )
1993 can be linked with the Pinatubo volcanic eruption and               and summer (+1.38 % decade−1 ) and negative in autumn
its known effect in the SSR (e.g., Zerefos et al., 2012).                (−1.50 % decade−1 ). Looking at the trend significance de-
   Analytical linear trends of each of the sub-periods and for           scribed by the 95 % confidence bounds, we can see signif-
every season are presented in Table 3. It should be noted                icant positive trends for 1900–2012 (yearly, summer and
that the trend determination and its statistical significance do         spring) and significant negative trends for yearly analysis and
not take into account measurement- or SSR-reconstruction-                winter of 1953–1982.
related uncertainties, which are different for different peri-              In order to have a better understanding of the SSR
ods.                                                                     changes over the 113-year period (1900–2012), we calcu-
   Looking at the 1900–2012 period the seasonal and an-                  lated the decadal SSR trends for different time windows (15
nual linear trends in SSR are less than 1 % decade−1 .                   to 40 years). Figure 4 shows the results of this analysis.
A positive change of +0.39 % decade−1 was calculated                        There is a decrease in SSR in the first 2 decades of the 20th
from annual values. For the whole data set, all sea-                     century, in line with other long-term SD series as recently
sons show positive trends, except winter. For the peri-                  shown by Stanhill and Ahiman (2016). Then, in all calcula-
ods with simulated SSR values (1900–1952), even smaller                  tions an increase is shown from mid-1930s to late 1940s, in
trends were detected for spring and summer. The measur-                  line with the early brightening effect pointed out by other
ing period of 1954–2012 was split into two sub-periods                   authors (Ohmura, 2009; Sanchez-Lorenzo et al., 2008). It
of 1954–1982 and 1983–2012. The first sub-period shows                   should be reminded that this period is based on estimations of

www.atmos-chem-phys.net/18/2395/2018/                                                       Atmos. Chem. Phys., 18, 2395–2411, 2018
2402 S. Kazadzis et al.: Surface solar radiation in Athens
Figure 3. Full time series of de-seasonalized SSR percent changes (using the 1900–2012 monthly averages). (a) Different colors represent
seasonal analysis; (b) the black bold line represents the annual series and light blue line the mean monthly values.
Table 3. Annual and seasonal SSR trends in percent per decade over the period 1900–2012 and different sub-periods. Percentages in paren-
theses show the limits of the 95 % confidence bounds and in bold the yearly trends.
Season 1900–2012 1900–1952 1953–1982 1983–2012
Winter −0.11 (±0.47) −0.90 (±1.46) −6.43 (±3.83) +0.52 (±3.26)
Spring +0.54 (±0.37) +0.38 (±1.12) −0.60 (±3.10) +2.77 (±3.10)
Summer +0.59 (±0.21) +0.28 (±0.48) −1.14 (±2.90) +1.38 (±2.55)
Autumn +0.21 (±0.44) +0.11 (±0.97) −1.28 (±3.42) −1.50 (±1.83)
Year +0.39 (±0.22) +0.04 (±0.71) −2.33 (±2.28) +0.80 (±1.96)
SSR from SD measurements, which thus include additional observed in all time windows with a brightening effect after
uncertainties. Nevertheless, early dimming and brightening late 1970s.
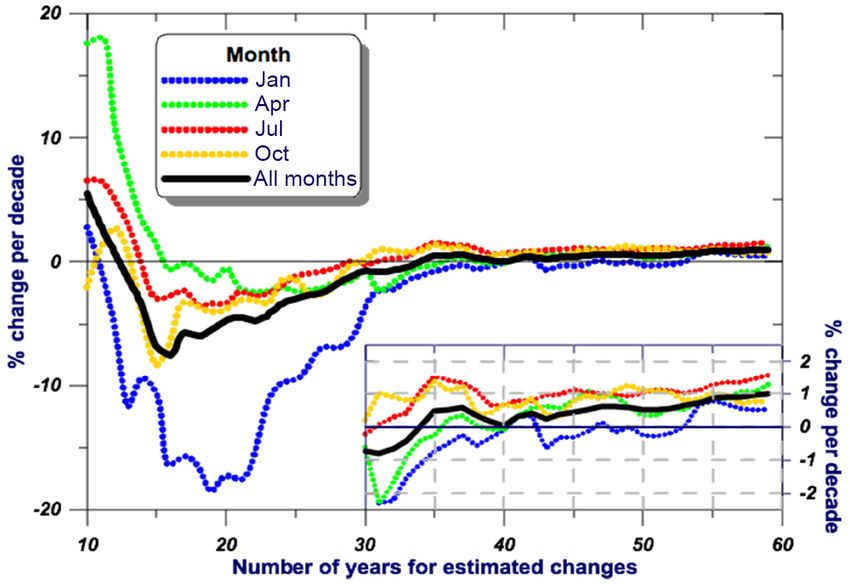
periods were reported in Stanhill and Ahiman (2016). The The 40- and 30-year time windows in the analysis pre-
results can be partly supported by trends in anthropogenic sented in Fig. 5 show the maximum rate of increase
black carbon (McConnell et al., 2007; Lamarque et al., 2010) in the early 1940s (resulting in an increase of +2 and
and biomass-burning (Lamarque et al., 2010) emissions in +3 % decade−1 , respectively). Then a maximum rate of de-
Europe. The dimming period from 1950s to 1970s can be crease is observed in early to middle 1960s, followed by
a positive rate of increase after 1990s. Shorter time windows
Atmos. Chem. Phys., 18, 2395–2411, 2018 www.atmos-chem-phys.net/18/2395/2018/S. Kazadzis et al.: Surface solar radiation in Athens 2403
Figure 4. Trends in SSR (% decade−1 ) calculated for different slid-
ing time windows. The value of the trend was calculated at the cen-
tral year of each time window.
Figure 5. Intra-annual variability of monthly mean daily SSR over
(15 years) are also interesting as they are able to capture the
the sub-periods of 1954–1983 (blue line) and 1983–2012 (red line)
Pinatubo effect in early 1990s.
and the entire period of 1954–2012 (black line). The green line
(right axis) represents the monthly relative difference between the
3.2 Variations and trends in SSR for the 1954–2012 two 30-year sub-periods (recent minus older period).
measurement period
In order to further analyze the whole 59-year SSR data set
of this study, we divided it into two 30-year climatological
sub-periods: 1954–1983 and 1983–2012 (the common year
is to allow for equal durations for both periods). Investigat-
ing a possible seasonal dependence, the relative difference in
SSR for every month from its mean monthly value over the
whole measurement (1954–2012) period was calculated.
Figure 5 shows the mean daily insolation for each month
for the two sub-periods and the whole 59-year period. Exam-
ining the monthly average differences between the two peri-
ods, we observe that for spring and summer months these are
on the order of 6 %. In addition, for all months SSR differ-
ences of the 1983–2012 period compared to the 1954–1983
period are positive with an exception of November (−1.9 %)
and December (−1.2 %). In general, the second measure- Figure 6. Percent change per decade for different timescales and
ment period shows a 3 to 8 % larger monthly SSR than the different months using 1954 as the starting year (the last 30-year
first measurement period. period is magnified with changes presented as percent per decade).
Figure 6 shows the SSR change per decade for the months
of January, April, July and October as well as the yearly
average (all months). The figure shows a trend analysis for
ing any time window centered after 1975. Larger trends are
the entire data set with time windows from 10 to 59 years,
calculated for time windows centered at 1975 to 1980 and
where each time window starts from 1953. For all months
after 2000 (on the order of 5 % decade−1 using the 15-year
SSR changes become positive for time windows of 35 years
time window). For the period 1954 to 1970 mainly negative
and greater (1953–1988 time window and any larger win-
trends are shown.
dow starting from 1953). Negative trends calculated from
1954 to any given year up to 1989 are mainly due to the
large negative changes during the winter period. In par-
ticular, during the 1954–1974 period, winter SSR changes 4 Comparison between all-sky and clear-sky SSR
show an −18 % decade−1 decrease. Linear trends in SSR records variation
from 1954 to 2012 showed a positive trend on the order of
+1 % decade−1 , while individual months vary from +0.5 to We used the 59-year data set (1954–2012) in order to quan-
+1.5 % decade−1 . Mostly positive trends can be detected us- tify the factors controlling the SSR variations in Athens,
www.atmos-chem-phys.net/18/2395/2018/ Atmos. Chem. Phys., 18, 2395–2411, 20182404 S. Kazadzis et al.: Surface solar radiation in Athens
Figure 7. De-seasonalized yearly percent deviations from mean for
SSR (black line) and cloud octas. Grey lines show measurements
with possible uncertainties/drifts.
Greece, focusing mainly on two known dominant factors,
clouds and aerosol load.
4.1 The role of clouds
Figure 8. Correlation between annual means of daily insolation and
Figure 7 shows the 1954–2012 time series of yearly anoma- cloud cover over the period 1954–2012. The straight line represents
the best-fit regression line to the data points. The year 1953 has not
lies based on daily SSR, together with yearly total cloud
been included in the analysis since it does not include measurements
coverage in weighted octas. The yearly de-seasonalized SSR
for all months.
values for all-sky conditions show a drop of ∼ 14 % from
1960 to 1970 and then a continuous increase excluding the
Pinatubo period in the early 1990s. The most pronounced
positive changes can be seen during the last 15 years with period are less than 1 %, with maximum differences in the
a change on the order of about 15 %. late 1960s 1–3 %. For the 30-year window maximum differ-
Going back to the measurement uncertainties for the ences are on the order of 1–2 %, while for the 40-year win-
1954–1983 period where a number of instruments were used dow, maximum differences are less than 1 %.
in order to build the presented time series; we tried to inves- This particular exercise cannot be defined as an uncer-
tigate possible instrument drifts and their effect on the calcu- tainty assessment on the 1954–1983 measurements, as recon-
lated long-term trends. In order to try to indirectly tackle this structed data cannot be used as a reference. Moreover, SSR is
issue, we included a shaded area in Fig. 7 representing a pos- much more sensitive than SD to aerosol optical depth change.
sible (one-directional) “uncertainty” based on reconstructing Thus, in locations where the number of cloudless days is rel-
the 1954–1983 series using the 1984–2012 measured SSR atively high, SD reconstruction tends to “smooth” the SSR
data and the sunshine duration data for 1954–1983. The re- variability; however, the opposite can be said in cases with
construction was performed in the same way as the 1900– constant cloudiness.
1953 one. The one-directional “uncertainty” points out pos- Figure 8 shows the correlation between annual mean SSR
sible drifts and instrument-exchange-related uncertainties. and cloud cover. From the best-fit linear regression line it is
However, that does not mean that we believe the series recon- deduced that a −1.54 MJ m−2 (or −9.6 %) change in mean
structed through sunshine duration in 1954–1983 more than daily insolation accounts for a change of 1 octa in cloud
the actual SSR measurements. If this was the case, we would cover.
have presented a 1983–2012 high-quality measuring period However, the great scatter of the data points and the low
and a 1900–1983 reconstructed period. There have been var- correlation of the two parameters in Fig. 8 (R 2 = 0.229) indi-
ious such papers published quite recently using small mea- cate that the cloud cover can only partly explain the changes
suring periods compared with the reconstructed ones: Garcia in SSR. In addition, there is no significant change in cloudi-
et al. (2014) using 1992–2013 measurements reconstructed ness over the 59-year period for Athens, Greece. Calculating
back to 1933 and Anton et al. (2017) using the 1887–1950 linear changes of cloudiness from data shown in Fig. 8 re-
period with radiative transfer modeling. In our case we tried sults in a non-significant change of −0.4 % decade−1 which,
to use, and not reconstruct, the historical SSR measurements in practice, has a limited effect on SSR changes during the
of NOA during the 1954–1983 period. examined period.
Using the 1984–2012 measurements and the 1900–1983 Nevertheless, it is worth mentioning that different cloud
reconstruction data set we recalculated all trends presented properties like cloud optical thickness and cloud phase, not
in Fig. 4 and Table 2. Differences for the 15-year window described by the measurements of cloud cover, can influence
differences on the calculated trends outside the 1954–1983 SSR.
Atmos. Chem. Phys., 18, 2395–2411, 2018 www.atmos-chem-phys.net/18/2395/2018/S. Kazadzis et al.: Surface solar radiation in Athens 2405
Figure 10. Changes in yearly mean SSR to relative to the 1954–
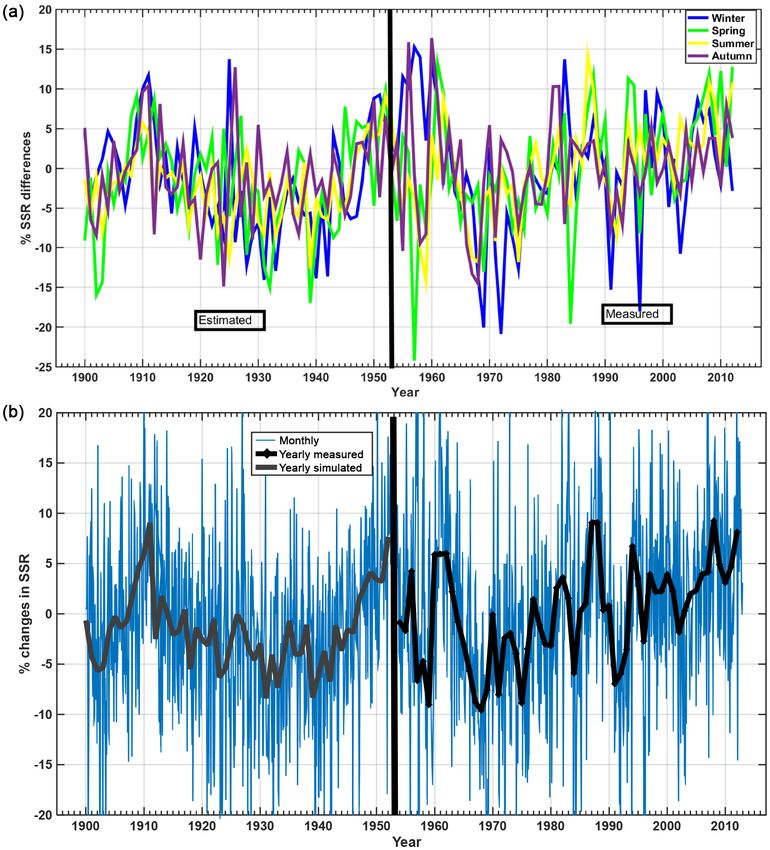
Figure 9. Clear-sky SSR measurements (red dots) and all-sky SSR 2012 average for cloudless sky (in percent; black). AVHRR AOD
measurements (blue dots) derived with the cloud octa (cloudiness < series (red) and ChArMEx AOD climatology (blue; Nabat et al.,
1.5) and sunshine-duration-related criteria (SD > 0.9). The black 2013) for the Athens area is shown in the right axis.
line represents the polynomial fit to the daily SSRmax values.
4.2 Clear-sky records tertime show similar patterns to the year-to-year variability.
Individual seasonal calculated SSR variability does not ex-
In order to minimize the cloud influence and investigate the ceed the SSR variability of all-sky data by more than ±5 %,
possible role of direct aerosol effects on Athens SSR se- with the exception of the winter season. Comparing clear-
ries, we had to select clear-sky (or cloudless) days. We used sky and all-sky yearly mean SSR, we find a high correlation
daily SSR measurements from 1954 to 2012 and separated (R 2 = 0.71), which can be explained by a combination of
the cloudless days according to the criteria mentioned in aerosol changes driving the SSR changes and the number of
Sect. 2.2. clear-sky days during the year. There is a decrease of more
For considering the SSR seasonality, we calculated a fifth- than −15 % in the clear-sky SSR from the start of the series
degree polynomial derived from the maximum daily SSR to the end of 1960s. A decline after 1983 could possibly be
(for all years of the data set), as a function of the day of related with El Chichón volcanic eruption.
the year (Fig. 9). Afterwards we calculated the ratio of the All-sky SSR measurements and AOD from AVHRR were
daily SSR to the SSR calculated by this function. Seasonal used in order to find the AOD effect in all-sky data. For
and yearly means of this ratio were estimated and used to de- yearly AOD and SSR averages from 1981 to 2009, we calcu-
scribe cloudless-sky SSR percentage changes on a seasonal lated a correlation coefficient of −0.55 with a rate of SSR
and yearly basis. This approach was chosen since averaging reduction per 0.1 units of AOD equal with −3.8 %. For
a random set of cloudless days, within each month during the monthly based comparisons, all months revealed a correla-
59-year period, could cause solar-elevation-related (due to tion coefficient of −0.2 with a rate of −1.5 % per 0.1 AOD
the change of maximum solar elevation within each month) with better results for summer and autumn months (−0.30,
discrepancies, when calculating the monthly average SSR. −2.2 % and 0.1 AOD; −0.30, −1.5 % and 0.1 AOD)
We emphasize that the clear-sky selection criterion could The Pinatubo-related drop of −6 % from the early 1990s
possibly eliminate a few cases with very high aerosol opti- to the mid-1993 can also be seen in both cloudless and all-
cal depth. sky data sets and also in the increase in AOD in the AVHRR
Seasonal and yearly averages of SSR were calculated us- data set (Fig. 10).
ing clear-sky conditions. Seasonal SSR was introduced in- Since the ∼ 6 % drop from 1990 to 1991–1993 is shown
stead of monthly SSR in order to improve the averaging SSR- for all seasons, we argue that it describes the effect of the
related statistics, since the average number of cloudless days eruption on SSR data for the Athens station. However, as
(per year) can be relatively low especially during the winter shown in Fig. 7, cloudiness for 1991 is also high, while it
months. For all cases the ratios of the mean daily cloudless is much lower for 1992 and 1993. Combined with the strato-
SSR to the SSRmax derived from the daily best-fit curve in spheric AOD figure, it seems that the 1991 decrease is also
Fig. 9 were calculated, and deviations of this ratio from its related with cloud increase, while the 1992 and 1993 de-
59-year mean were calculated for each year. crease is related with aerosol effects from Pinatubo.
Figure 10 shows that most of the SSR variation observed Concerning the stratospheric AOD in Athens the
for the measuring period has to be explained by factors other ChArMEx AOD data set revealed two main peaks of 0.12
than changes in cloudiness (see Fig. 7 for variations due for 1983 and 0.09 for 1992 due to El Chichón and Pinatubo
to cloudiness). Different seasons with the exception of win- eruptions, respectively, while stratospheric AOD after 1995
www.atmos-chem-phys.net/18/2395/2018/ Atmos. Chem. Phys., 18, 2395–2411, 20182406 S. Kazadzis et al.: Surface solar radiation in Athens
Figure 11. Ratio of cloudless vs. all days, per season and yearly.
Table 4. Clear-sky and all-sky data trend comparison for the whole 1953–2012 period and the two 30-year sub-periods (% decade−1 ).
Percentages in parentheses show the limits of the 95 % confidence bounds and in bold the yearly trends.
Season Clear sky All skies Clear sky Clear sky
1953–2012 1953–2012 1953–1982 1983–2012
Winter 0.91 (±2.31) −6.43 (±3.83) −7.01 (±3.16) 0.55 (±2.41)
Spring 1.22 (±1.12) −0.60 (±3.10) −0.92 (±1.11) 2.62 (±1.97)
Summer 2.03 (±0.78) −1.14 (±2.90) −0.36 (±0.83) 1.31 (±0.81)
Autumn 2.74 (±1.37) −1.28 (±3.42) −1.03 (±1.84) −1.48 (±1.73)
Year 2.17 (±1.21) −2.33 (±2.28) −1.44 (±2.35) 1.94 (±2.08)
is lower than 0.01. These two peaks are possibly associated In addition to Fig. 10, Fig. 11 shows the ratio of cloudless
with decreases in SSR as measured at ASNOA. days to all available days for each season and for each year.
Finally, the ∼ 13 % change from 1995 to 2012 shown Figure 11 shows a minimum (less than 30 % during a year)
for all skies (Fig. 7) and clear skies (Fig. 10) is accompa- number of cloudless days from mid-1970s to early 1990s. It
nied with a drop of ∼ 25 % in AOD measured by AVHRR. is mostly linked with the decrease of cloudless days during
The year-to-year variations of clear-sky SSR series and the summer months. The figure provides evidence of the relative
AVHRR-related AOD show an anti-correlation with R = SSR changes observed during this period, but it cannot di-
−0.78 (N = 29), verifying the hypothesis that clear-sky SSR rectly interpret year-to-year SSR changes as they also depend
changes are associated with aerosol load changes, at least on cloud fraction and properties for cloudy days. In addition,
within the common AVHRR measurement period (1982– it can only partly be linked with Fig. 10 as aerosol effects on
2009). cloudless-sky-calculated SSR depend mostly on AOD levels
Similar to the AVHRR data the ChArMEx 4-D aerosol cli- and not on the number of days included in the calculations.
matology is shown in Fig. 10, providing similar conclusions, Differences in the ratio of cloudless days shown in Fig. 11
namely the negative AOD trend of −0.03 or −14 % decade−1 and in the almost constant cloud octa variability shown in
from 1979 to 2012. Fig. 7 are partly attributed to the different definition of
Differences between the AVHRR and ChArMEx data can a cloudless day that is based on the cloud radiative effect for
be explained in part by the different AOD wavelengths pre- Fig. 11 and on observation of cloud percentage in the sky for
sented here (630 vs. 550 nm) and also by a general nega- Fig. 7. However, this could also be an indication of changes
tive bias of AVHRR over the Mediterranean compared to in cloud properties (e.g., a change in optically thin clouds
AERONET (Nabat et al., 2014). The smooth decline in the could have a small radiation effect but would be marked as
ChArMEx AOD data is due to the method used to build this cloudy conditions by the observer).
product and uses the trend and not the interannual variability, In Table 4 we calculated the linear trends for the 1953–
which is not included in the global model that was used. 2012 period and for both clear-sky and all-sky measurements
Atmos. Chem. Phys., 18, 2395–2411, 2018 www.atmos-chem-phys.net/18/2395/2018/S. Kazadzis et al.: Surface solar radiation in Athens 2407
Table 5. Summary of percent SSR changes per decade for various locations.
Period Location Trend % Reference
per decade
1893–2012 Potsdam, Germany 0.71 Stanhill and Achiman (2014)
1900–2012 Athens, Greece 0.40 (±0.26) This work
1959–1988 Europe −2.0 Ohmura and Lang (1989)
1971–1986 Europe −2.3 Norris and Wild (2007)
1959–1985 Italy −6.4(±1.1)/−4.4(±0.8) Manara et al. (2016)
1953–1982 Athens, Greece −2.33(±2.28) This work
1985–2005 Europe 2.5 Wild (2009)
1990–2012 Italy 6.0 (±1.1)/7.7 (±1.1) Manara et al. (2016)
1986–2013 Athens, Greece 0.80 (±1.96) This work
and the 1953–1982 and 1983–2012 sub-periods for clear-sky measurements accompanied by a visibility increase and no
measurements. Results show comparable changes per decade significant changes in the cloud cover conditions in Germany.
(2 % for the clear-sky and 1.5 % for the all-sky cases). Sea- This Athens SSR vs. visibility relationship can be partly ex-
sonal analysis show that clear-sky trends for summer, autumn plained by the fact that SSR and visibility have different re-
and winter months are higher than the ones derived for all sponses to cloud conditions, water vapor and rainfall, and
skies. Such differences are linked with the seasonal variabil- also by the fact that visibility is affected by aerosols only in
ity and long-term changes in cloudiness for the specific sea- the first few hundred meters above the surface, while SSR is
sons. affected by the columnar AOD, which in the case of Athens
Clear-sky results for the 1953–2012 period show signifi- can be significantly different due to long-range aerosol trans-
cant positive changes in SSR for all seasons except winter. port at altitude (e.g., Saharan dust; Leìon et al., 1999).
Looking individually at the 1953–1982 and 1983–2012 pe-
riods, we calculated significant negative trends for only the
winter for the former, and for only summer and spring for 5 Conclusions
the latter.
The effect of various parameters on SSR was discussed Surface solar radiation (SSR) at National Observatory of
by Kambezidis et al. (2016) in their study about the global Athens, in the center of the city, is presented using a unique
dimming/brightening effect over the Mediterranean in the data set covering a period of 59 years (1954–2012). Sun-
period 1979–2012. They show that the influence of param- shine duration (SD) records for another 54 years were used
eters related to the atmospheric transparency, like water va- as a proxy to reconstruct SSR time series for the period from
por, aerosols and trace gases, as well as changes in the sur- 1900 to 2012.
face albedo on SSR, were larger in the southern parts of the The accuracy of such historical radiation data sets is dif-
Mediterranean, over the Balkan countries and central Turkey. ficult to assess, especially when looking at the 1950s and
This outcome is in agreement with the conclusion of the 1960s, when instruments, operational procedures and qual-
present study that factors other than cloudiness play a sig- ity control were not at the same level as in the past 30 years.
nificant role in the SSR variations. Quality-assessment procedures in the presented time series
A comparison of the SSR results in Athens with visibility were applied with criteria based on instrument characteristics
observations stretching back to 1931 (Founda et al., 2017) and the availability of additional collocated measurements.
did not show any correlation among SSR and horizontal vis- Year-to-year fluctuations of the measured SSR, in addition
ibility. For the first part of the common data set (1930–1959) to the reversal of the downward tendencies at the ASNOA
the visibility decline is accompanied with an SSR increase. site, adds credibility to the measured variations. That is be-
However from 1950 through the present, visibility shows cause radiometers typically lose sensitivity with time, indi-
a monotonical decrease. The steep visibility decrease from cating spurious downward trends but not upward trends. The
1931 to the early 1990s is not accompanied by a relative SSR more recent (after 1986) SSR measurements can be charac-
decrease excluding individual sub-periods. However, simu- terized as high-quality radiation data with known accuracy.
lated SSR is driven purely by changes in sunshine duration; Concerning the measurements from 1954 to 1970, there have
in this case the SD variability in Founda et al. (2014) is al- been sporadic reports mentioning the homogenization and
most stable after 1950, so SD cannot be also linked with the calibration procedures, while for 1970 to 1986 there is more
visibility reported decrease. Studying the literature for sim- information on the instrument quality control.
ilar cases, similar conclusions were drawn by Liepert and Reporting of the results from the 1954–1986 period should
Kukla (1997), showing an SSR decrease over 30 years of be accompanied by noting that the uncertainties of the mea-
www.atmos-chem-phys.net/18/2395/2018/ Atmos. Chem. Phys., 18, 2395–2411, 2018You can also read